Article

Raw Glycerol Based Medium for DHA and Lipids Production, Using the Marine Heterotrophic Microalga Crypthecodinium cohnii

1
Laboratório Nacional de Energia e Geologia, I.P.-Unidade de Bioenergia e Biorrefinarias, Estrada do Paço do Lumiar 22, 1649-038 Lisbon, Portugal
2
Instituto Dom Luiz (IDL), Faculdade de Ciências da Universidade de Lisboa, Campo Grande, 1747-016 Lisbon, Portugal
*
Author to whom correspondence should be addressed.
Processes 2021, 9(11), 2005; https://doi.org/10.3390/pr9112005
Submission received: 15 September 2021 / Revised: 28 October 2021 / Accepted: 29 October 2021 / Published: 10 November 2021
(This article belongs to the Special Issue Recent Advances in Biorefining Processes)

Abstract

:
Crude glycerol, a biodiesel industry byproduct, and corn steep liquor (CSL) derived from a starch industry, were used as carbon and nitrogen sources, respectively, for lipid production, using the heterotrophic microalga C. cohnii grown in a bench bioreactor, in a batch culture. The maximum biomass concentration, lipid content and lipid productivity attained were 5.34 g/L, 24.6% (w/w Dry Cell Weight-DCW) and 0.016 g L−1 h−1, respectively. Flow cytometry analysis was used to evaluate the impact of these substrates on the microalgae cells. A high proportion of intact cells with enzymatic (esterases) activity (>50%) was present throughout the cultivation time course. These results indicate that crude glycerol and CSL can be used in the medium formulation for DHA and lipid production using this microalga, which reduce the process costs in an expected maximum of 84%.

1. Introduction

The heterotrophic marine microalga Crypthecodinium cohnii has been mostly used to produce docosahexaenoic acid (DHA), a ω-3 fatty acid essential for brain development during pregnancy and early childhood. It has also been reported that this compound improved vision, heart health, psoriasis, and reduced inflammatory response.
This microalga produces significant amounts of lipids (up to 30% w/w dry cell weight), accounting DHA up to 50% of total fatty acid (TFA) content. Other polyunsaturated fatty acids (PUFA) remain below 1% of the TFA content [1]. This is a notorious characteristic of this microalga, which facilitates the DHA purification since most marine microalgae rich in PUFAs contain intermediate fatty acids that provide difficulty to the DHA fractionation and concentration.
In most of the works reporting C. cohnii DHA production and extraction, the remaining lipid fraction is neglected [2,3,4,5]. However, this fraction, obtained after DHA removal, mainly composed of saturated and unsaturated fatty acids, can also be directed for biodiesel production. In this way, all the microalgal lipidic fractions can be valorized and used.
The most expensive component of the fermentation media is the carbon source. C. cohnii has been grown on single and pure carbon substrates such as glucose, ethanol, acetate to produce DHA [6,7,8]. However, despite these carbon sources may induce high lipid and DHA productivities, they are expensive (glucose 16 €/kg, ethanol 1.82 €/kg and acetic acid 0.45 €/kg [9]), being ethanol and acetic acid dangerous and difficult to handle and transport. Isleten-Hosoglu and Elibol [3] have used pure glycerol to grow C. cohnii CCMP 316, but this compound, when pure, is also expensive (5.9 €/kg [9]). Other media formulation components are complex nitrogen sources, as yeast extract and soya peptones [3]. However, these nutrients are also very expensive (yeast extract 35.4 €/kg; soya peptones 7.25 €/kg [9]). In addition, the need to use low-cost substrates as feedstock to reduce bioprocess costs, the need to accomplish the circular economy rules and the European Green Deal have led to search for wastes/byproducts to be used as nutrients in microbial processes.
Raw glycerol is a byproduct of biodiesel industry that can be considered as carbon source in media formulations. However, this industrial byproduct may contain inhibitory compounds (methanol, salts, soap) that may affect the microalgae cell physiology, thus reducing the lipid production.
This work studied C. cohnii growth and lipid production, using biodiesel industry derived glycerol as carbon source, developed in a bench bioreactor. Previously, low cost nitrogen sources were also tested, and CSL was selected as the best nitrogen source for C. cohnii biomass lipids production. As far as the authors know, this is the first work using raw glycerol as carbon source, and corn steep liquor as nitrogen source, to grow C. cohnii, for lipids and DHA production. Flow cytometry was used to monitor all the bioreactor microalgal cultivations, in order to evaluate the impact of these substrates on the microalgae cell physiology.

2. Materials and Methods

2.1. C. cohnii Starter Cultures

Crypthecodinium cohnii ATCC 30772 was purchased to American Type Culture Collection. A medium composed of yeast extract (1.8 g/L, Oxoid), sea salt (OceanusIberia, Queluz, Portugal) (23 g/L) and glucose monohydrate (9.9 g/L) (Acros Organics) was used to maintain the microalgal cultures (starters), which were re-inoculated monthly.

2.2. Shake Flasks Experiments—Selection of a Low-Cost Nitrogen Source

To select a low-cost nitrogen source, C. cohnii was grown in 500 mL shake flasks with 250 mL of sterile culture medium, containing 25 g/L sea salt, 20 g/L glycerol, 0.5 g/L YE and the same nitrogen amount present in 1.5 g/L of yeast extract (YE) (as reference), sodium nitrate (SN, 0.97 g/L), ammonium sulfate (AS, 0.76 g/L) and CSL (4.59 g/L), gently supplied by COPAM, Companhia Portuguesa de Amidos SA, S. João da Talha, Portugal). After collected from the industrial plant, the CSL was left uncovered, for a few weeks, so that volatile toxic compounds could be released. This substrate contains 0.035 g nitrogen/g. No microalgal growth occurred when no yeast extract was added to the medium culture. Therefore, low amount of yeast extract was added (0.5 g/L) to the media containing alternative nitrogen sources. Two CSL concentrations were tested: CSL 100 contained the total nitrogen amount present in 1.5 g/L YE, and CLS 50 contained half amount the nitrogen present in 1.5 g/L of YE. For the YE assay, 2 g/L of YE was used as nitrogen source. The initial pH of all media was adjusted to 6.5, before sterilization. Glucose was previously sterilized separately, to avoid caramelisation.
The inocula were prepared from the starters cultures. The 500 mL-flasks containing 150 mL of medium (yeast extract 2 g/L, sea salt 25 g/L and glycerol (20 g/L) were inoculated (10% v/v) with the starter cultures, and incubated at 120 rpm, 27 °C for 6 days.
The 500 mL-flasks containing 250 mL of medium and the different nitrogen sources were inoculated (10% v/v) and incubated at 120 rpm, 27 °C. After 7 days of growth, the cultures were centrifuged and the pellet (biomass) and supernatant were frozen at −18 °C for further lipid and residual substrate analysis, respectively. All shake flasks experiments were conducted in duplicate.

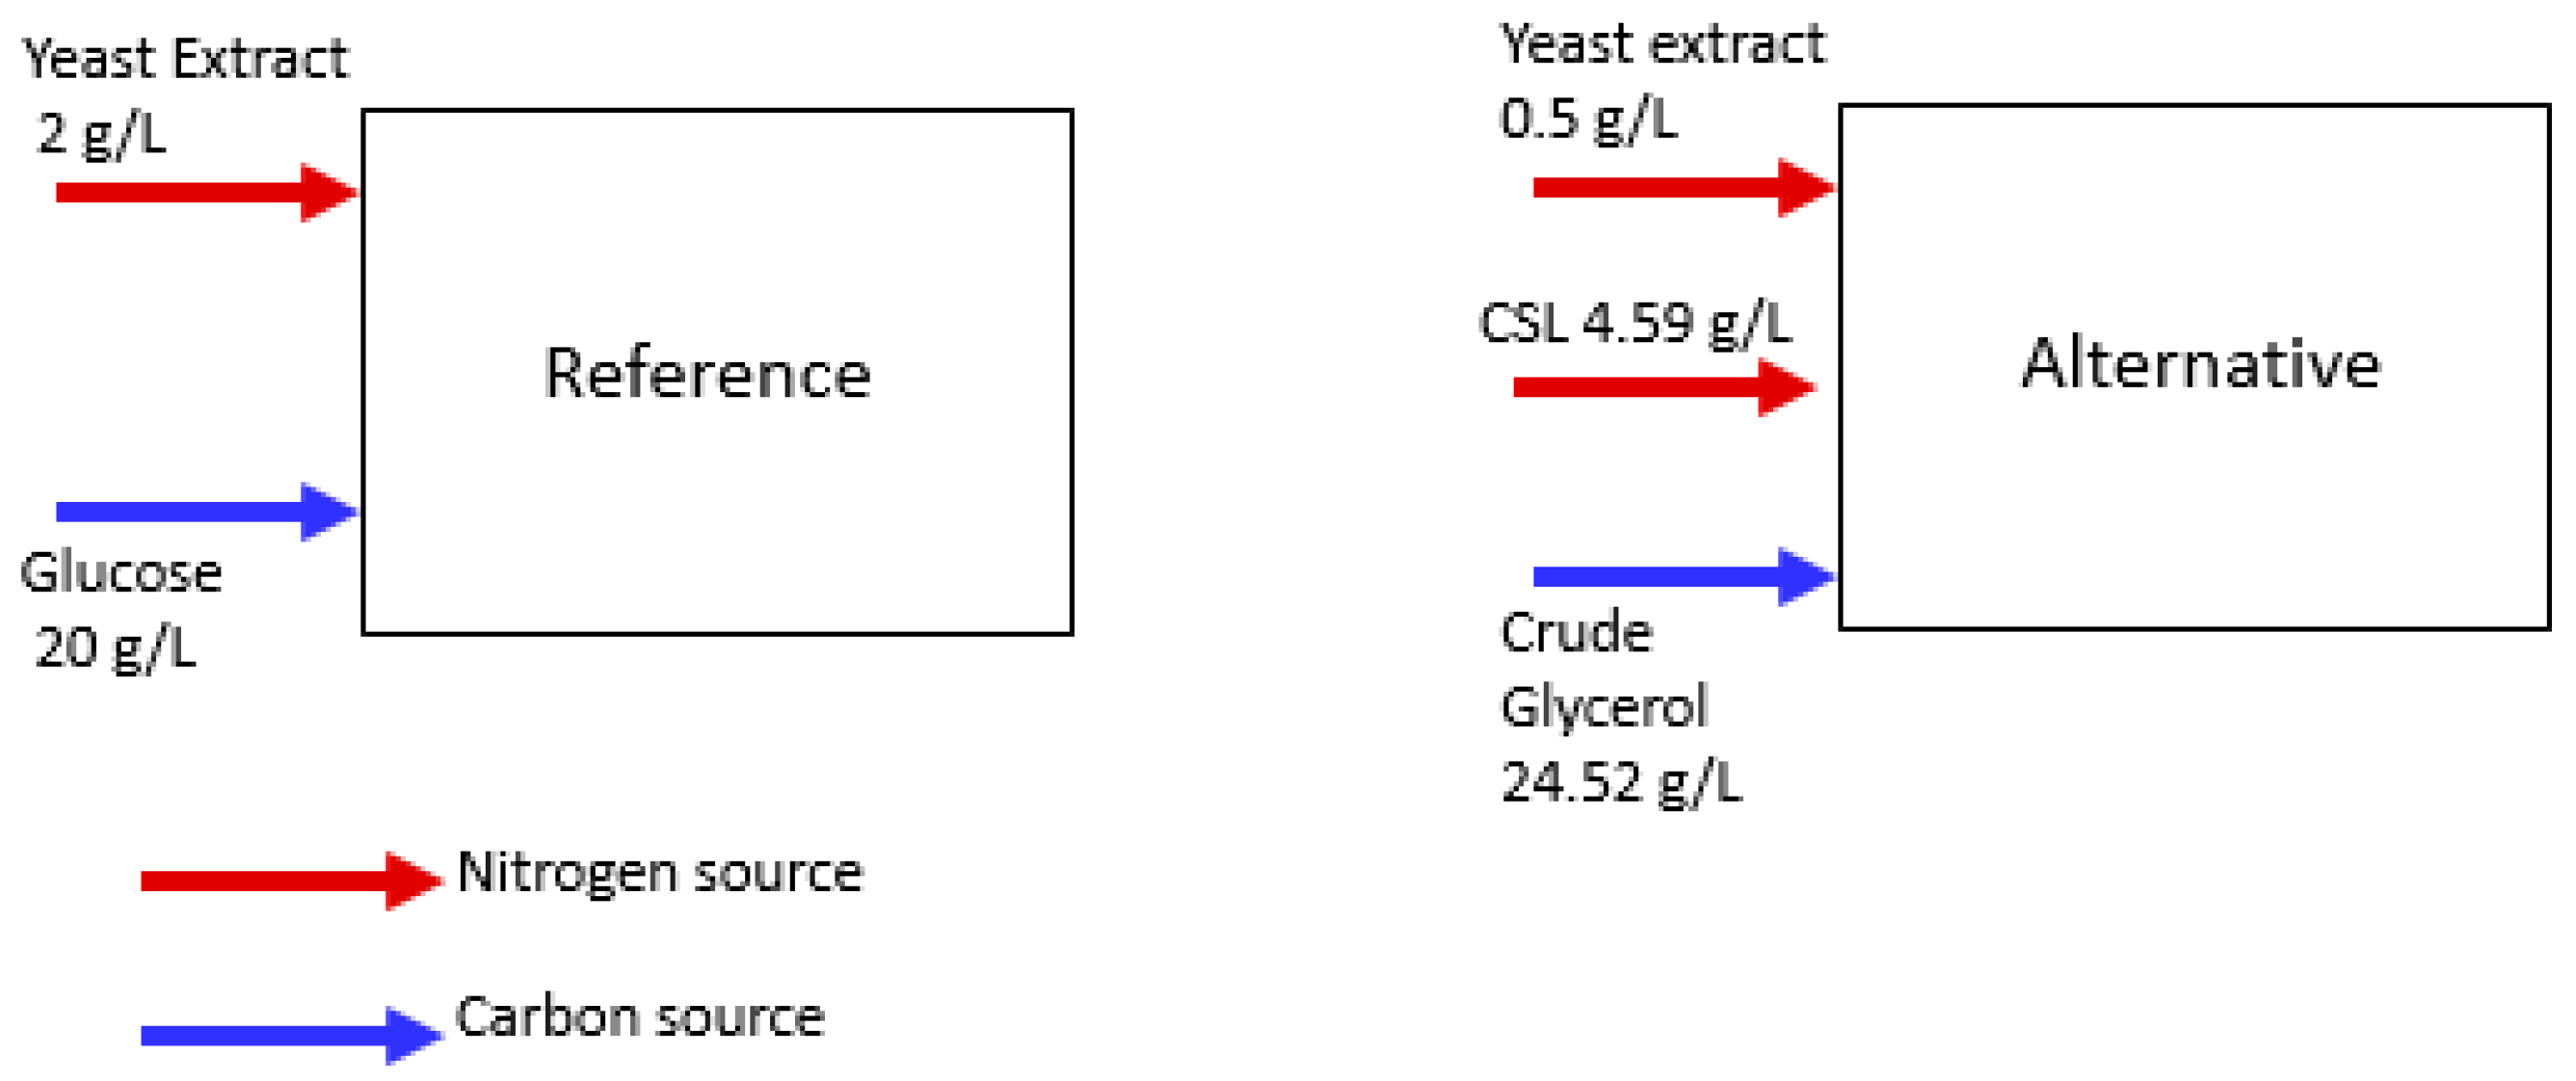
2.3. Bioreactor Experiments Using Raw Glycerol-Based Medium

The raw glycerol used in this work was supplied by Iberol (Alhandra, Portugal) and was collected after methanol removal. Table 1 shows the characteristics of this substrate.
To inoculate the 7L-bioreactor (Fermac 360, Electrolab Biotech, Tewkesbury, UK), inocula were prepared from the starters cultures. The 500 mL-flasks containing 150 mL of medium composed of yeast extract 2 g/L, sea salt 25 g/L and glucose (20 g/L) were inoculated (10% v/v) and incubated at 120 rpm, 27 °C. After 6 days of growth (exponential growth phase) this culture (10% v/v) was used to inoculate the 7L-bioreactor, equipped with two Rushton impellers, and with an initial volume of 3000 mL of the medium culture composed of sea salt 25 g/L, yeast extract 0.5 g/L and 4.59 g/L CSL. All the cultivations were conducted at 27 °C and the medium pH was adjusted at 6.5. The aeration rate was set at 1 vvm, and the speed rate was initially set at 100 rpm, being manually increased as the dissolved oxygen level decreased below 30%, in order to avoid oxygen limiting conditions, since C. cohnii is an obligate aerobic microorganism, and lipid synthesis requires oxygen excess conditions.

2.4. Growth Measurement

Usually, wastes and effluents contain particles. When used as substrates in media formulations, these particles may interfere with the cell concentration quantification by optical density and dry cell weight. Indeed, CSL and raw glycerol contain a high proportion of particles.
To minimize the particles interference in the biomass quantification, the number of C. cohnii cells/mL was evaluated by flow cytometry, as described in the next sub-section.
All carbon sources were analysed by HPLC using an Aminex HPX-87H column (Bio-Rad, Hercules, CA, USA) in combination with a cation H+-guard column (Bio-Rad) in an Agilent Chromatographer, equipped with a diode array detector (DAD) and a refractive index detector (RI). Elution took place at 50 °C with 5 mmol/L H2SO4 at a flow rate of 0.6 mL/min. The chromatograms were analyzed using the ChemStation software (Agilent Technologies, Santa Clara, CA, USA).
FC and HPLC analyses were performed in duplicate.

2.5. Flow Cytometry

Flow cytometry (FC) was used to monitor the bioreactor microalgal cultivations. FC analysis was performed in a Cytoflex Beckman-Coulter flow cytometer, equipped with a blue laser, FSC/SSC light scattering detectors and five fluorescence detectors. For FC analysis, 5 mL of broth were removed from the cultures, under sterile conditions, and stored in Falcon tubes. These were subsequently subjected to ultrasound treatment for 15 s to disintegrate cellular aggregates. For C. cohnii biomass quantification, the microalgal cell suspension was diluted in PBS buffer, in order to obtain ~300 events/s. C. cohnii cells population was gated in the FSC/SSC dot-plot, and the number of events for that gate was recorded for each sample. The number of cells/mL was calibrated against dry cell weight at 100 °C to constant weight, over 18 h. The medium culture without cells was previously analysed by FC, in order to localize dust and particles in the FSC/SSC dot plot.
For the simultaneous detection of C. cohnii cell enzymatic activity and membrane integrity, samples were diluted in PBS buffer (pH 7.4), using the double staining procedure. The dyes carbofluorescein diacetate (CFDA, Invitrogen, Waltham, CA, USA) and propidium iodide (PI, Invitrogen) were simultaneously added to the samples. A total of 3 µL CFDA stock solution (10 mg/mL) and 2 µL PI stock solution (1 mg/mL) were added to 500 µL cell suspension, and incubated for 10 min in the darkness, before FC analysis. CFDA was detected in the FITC-A detector, and PI was detected in the PC5.5-A detector. All FC analyses were carried out in duplicate.

2.6. Lipid Quantification

Lipids were analysed and quantified as total fatty acids (TFA). The extraction and analysis were carried out according to the protocol described by Taborda et al. [10].

3. Results and Discussion

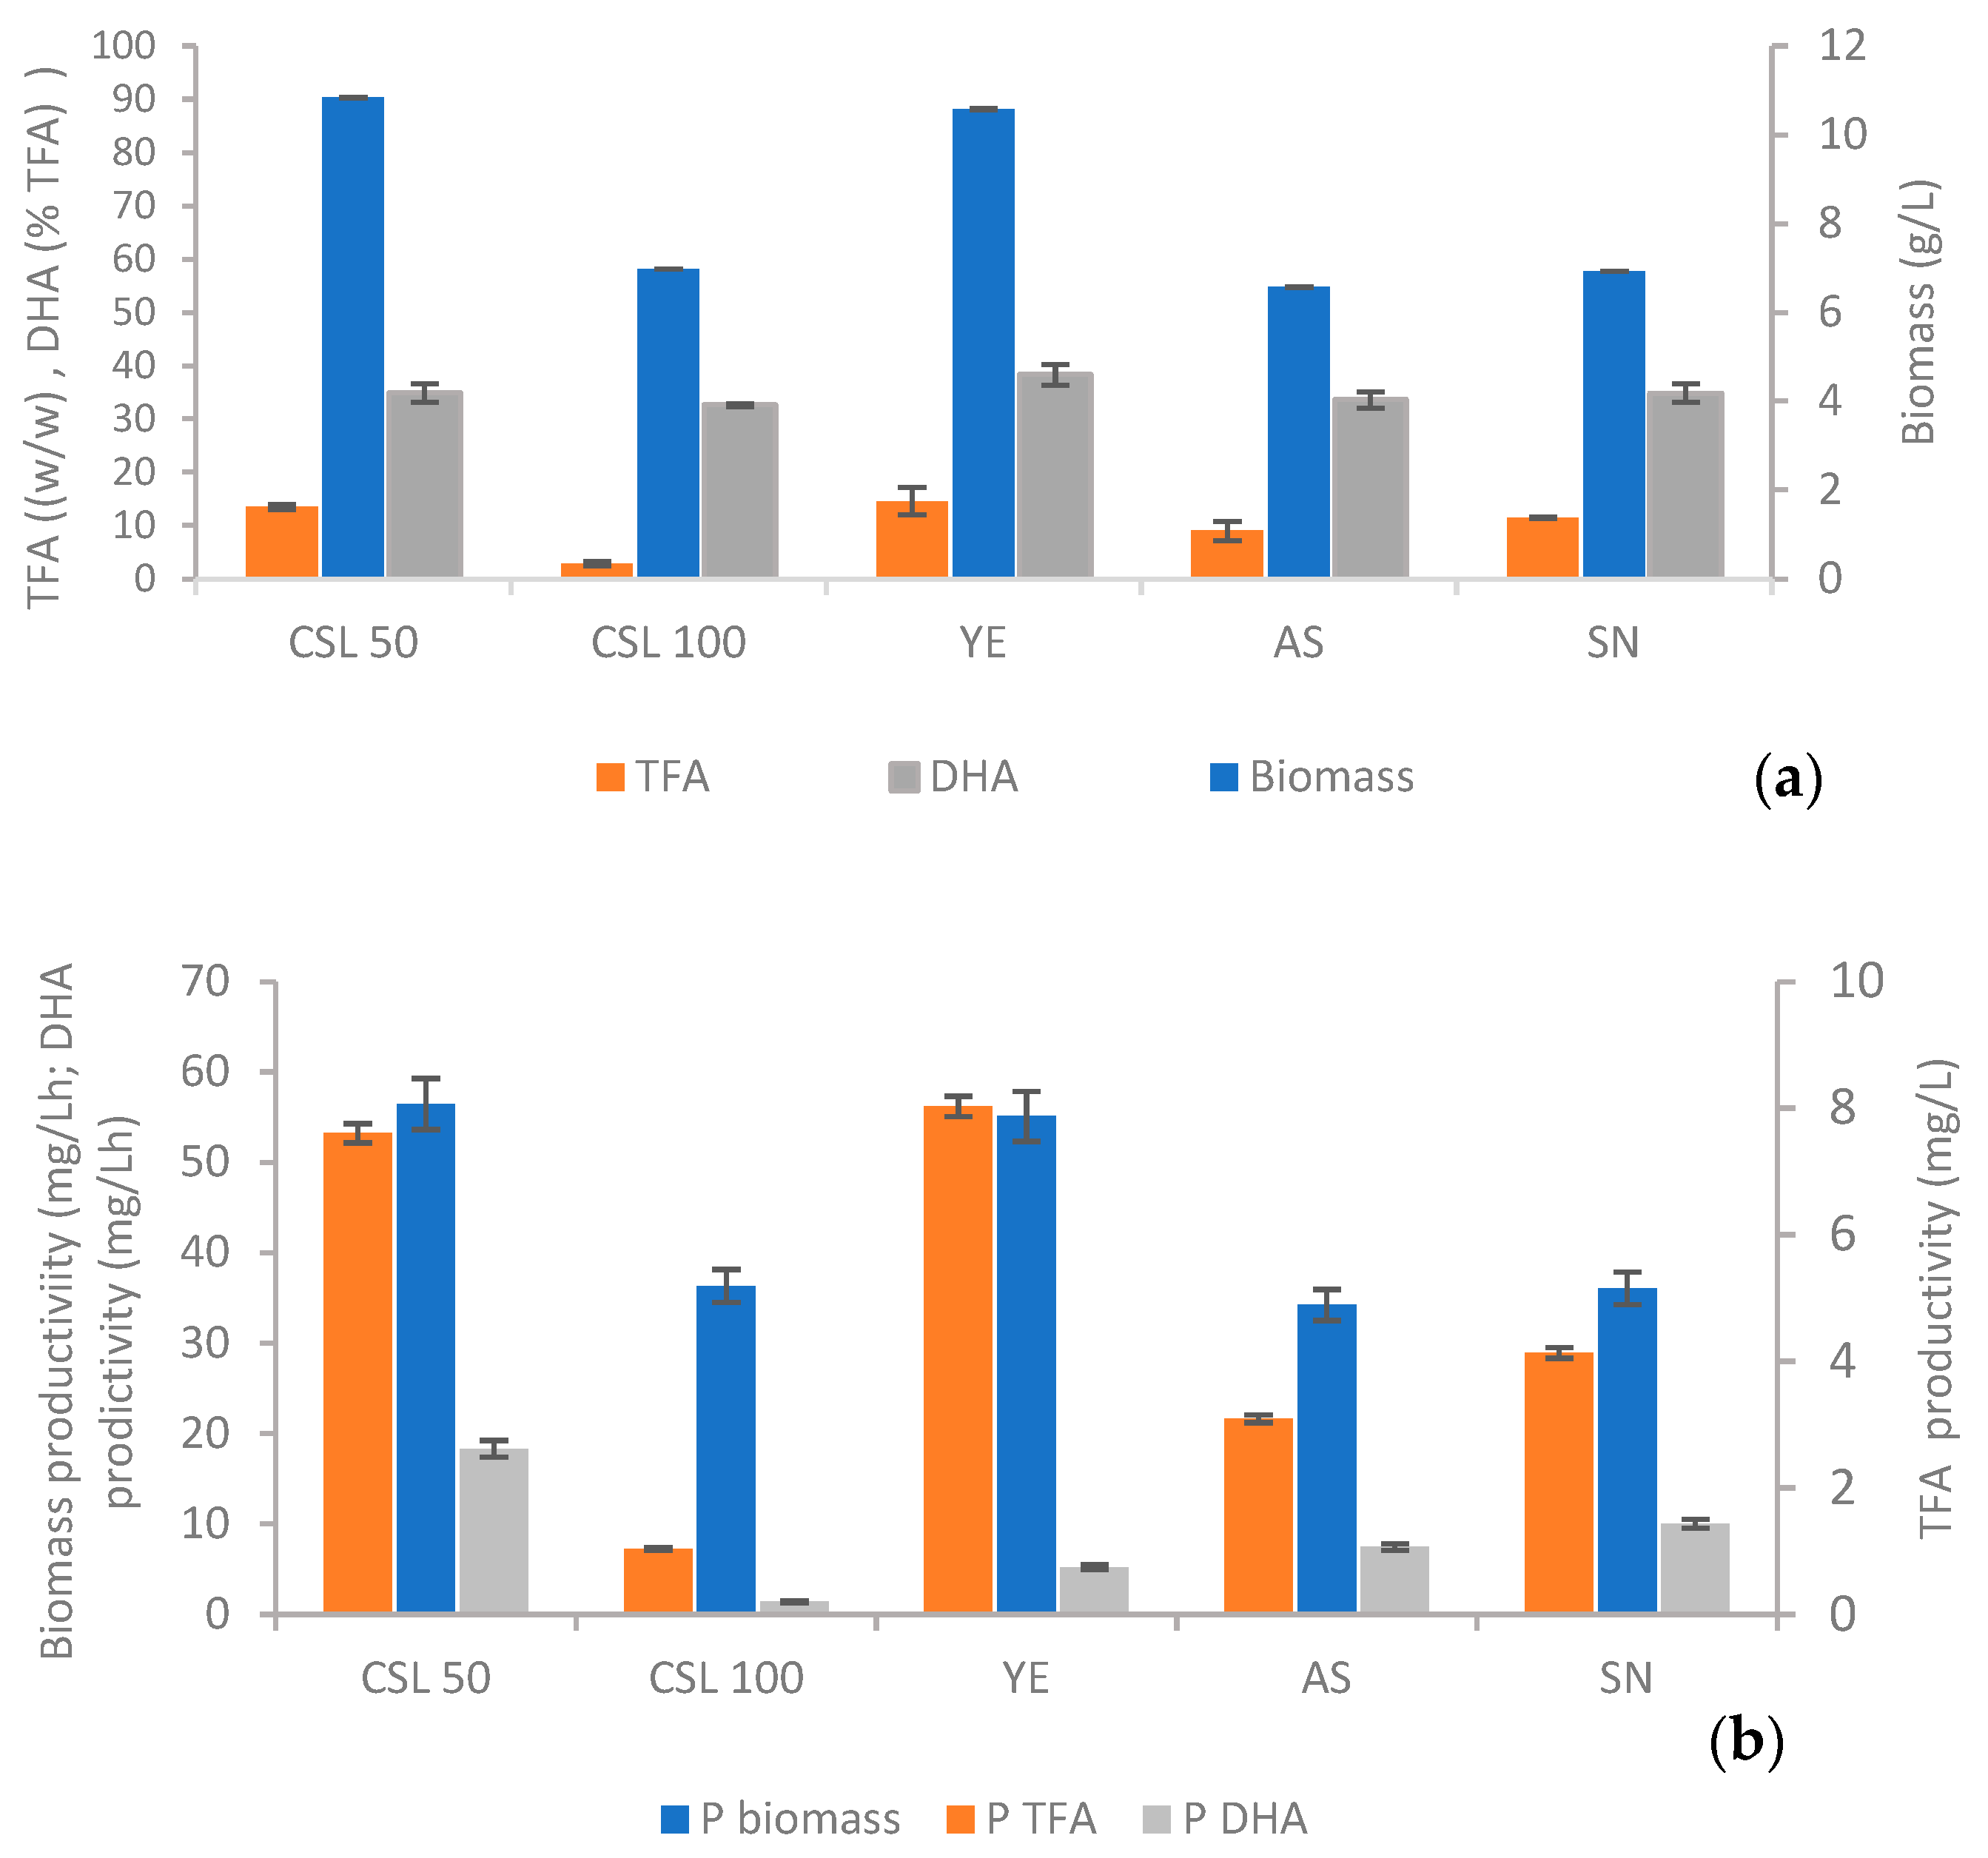
3.1. Nitrogen Source Selection Assays

Different nitrogen sources were tested, in order to reduce the medium formulation costs, since the original medium [10] contained 2 g/L yeast extract, an expensive nitrogen source. Figure 1a,b shows C. cohnii biomass concentration, TFA DHA contents, as well biomass, DHA and TFA productivities, at the end of the microalgal cultivations. The maximum final biomass concentration and TFA content was obtained for YE and CSL 50 assays (10.84 g/L and 10.58 g/L for biomass concentration, respectively; 13.49% (w/w) and 14.47% (w/w) for TFA, respectively). The remaining assays attained similar final biomass concentrations (~6.5 g/L). The lowest TFA content was observed for CSL 100 assay (2.84% w/w), followed AS assay (9.02% w/w) and SN assay (11.45% w/w). The low lipid content observed in all the assays (<20% w/w DCW) was probably due to the inefficient agitation, resulting in low mass transfer rates, leading to oxygen limiting conditions in the shake flasks cultivations [11].
Concerning the DHA amount (% w/w TFA), the maximum proportion was observed for the YE assay (38.35% DHA/TFA), followed by CSL 50 (34.86% DHA/TFA), SN assay (34.85% DHA/TFA) and AS assay (32.65% DHA/TFA). The proportion of DHA in TFA is an important parameter in microbial DHA production, since a high proportion of this compound in the lipid fraction facilitates the DHA extraction and purification, decreasing the downstream steps, thus process costs (OPEX).
Regarding the biomass productivity, the highest was observed for CSL 50 and YE assays (56.46 mg/Lh and 55.10 mg/Lh, respectively). CSL 100 and SN assays displayed similar biomass productivities (~36.09 mg/Lh), followed by AS assay, which showed the lowest value (34.24 mg/Lh).
The maximum TFA productivity was detected for CSL 100 and YE assays (7.60 and 8.05 mg/Lh, respectively), and the lowest TFA productivity was observed for CLS 100 assay.
The highest and lowest DHA productivity was observed for CLS 50 and CSL 100 assays (2.62 mg/Lh and 0.2 mg/Lh, respectively), while YE assay only attained 0.5 mg/Lh.
It was clear that CLS 50 assay growth/TFA/DHA parameters were similar, or even higher, than those obtained for YE assay. On the contrary, for most of the parameters, CSL 100 assay displayed the lowest values, which suggests that CLS, at higher concentrations, can inhibit the microalga growth and lipid synthesis, likely due to inhibitor compounds present in this starch industry byproduct. From these results, CLS 50 was the chosen condition for further experiments at a bench-scale bioreactor.

3.2. Bioreactor Experiments

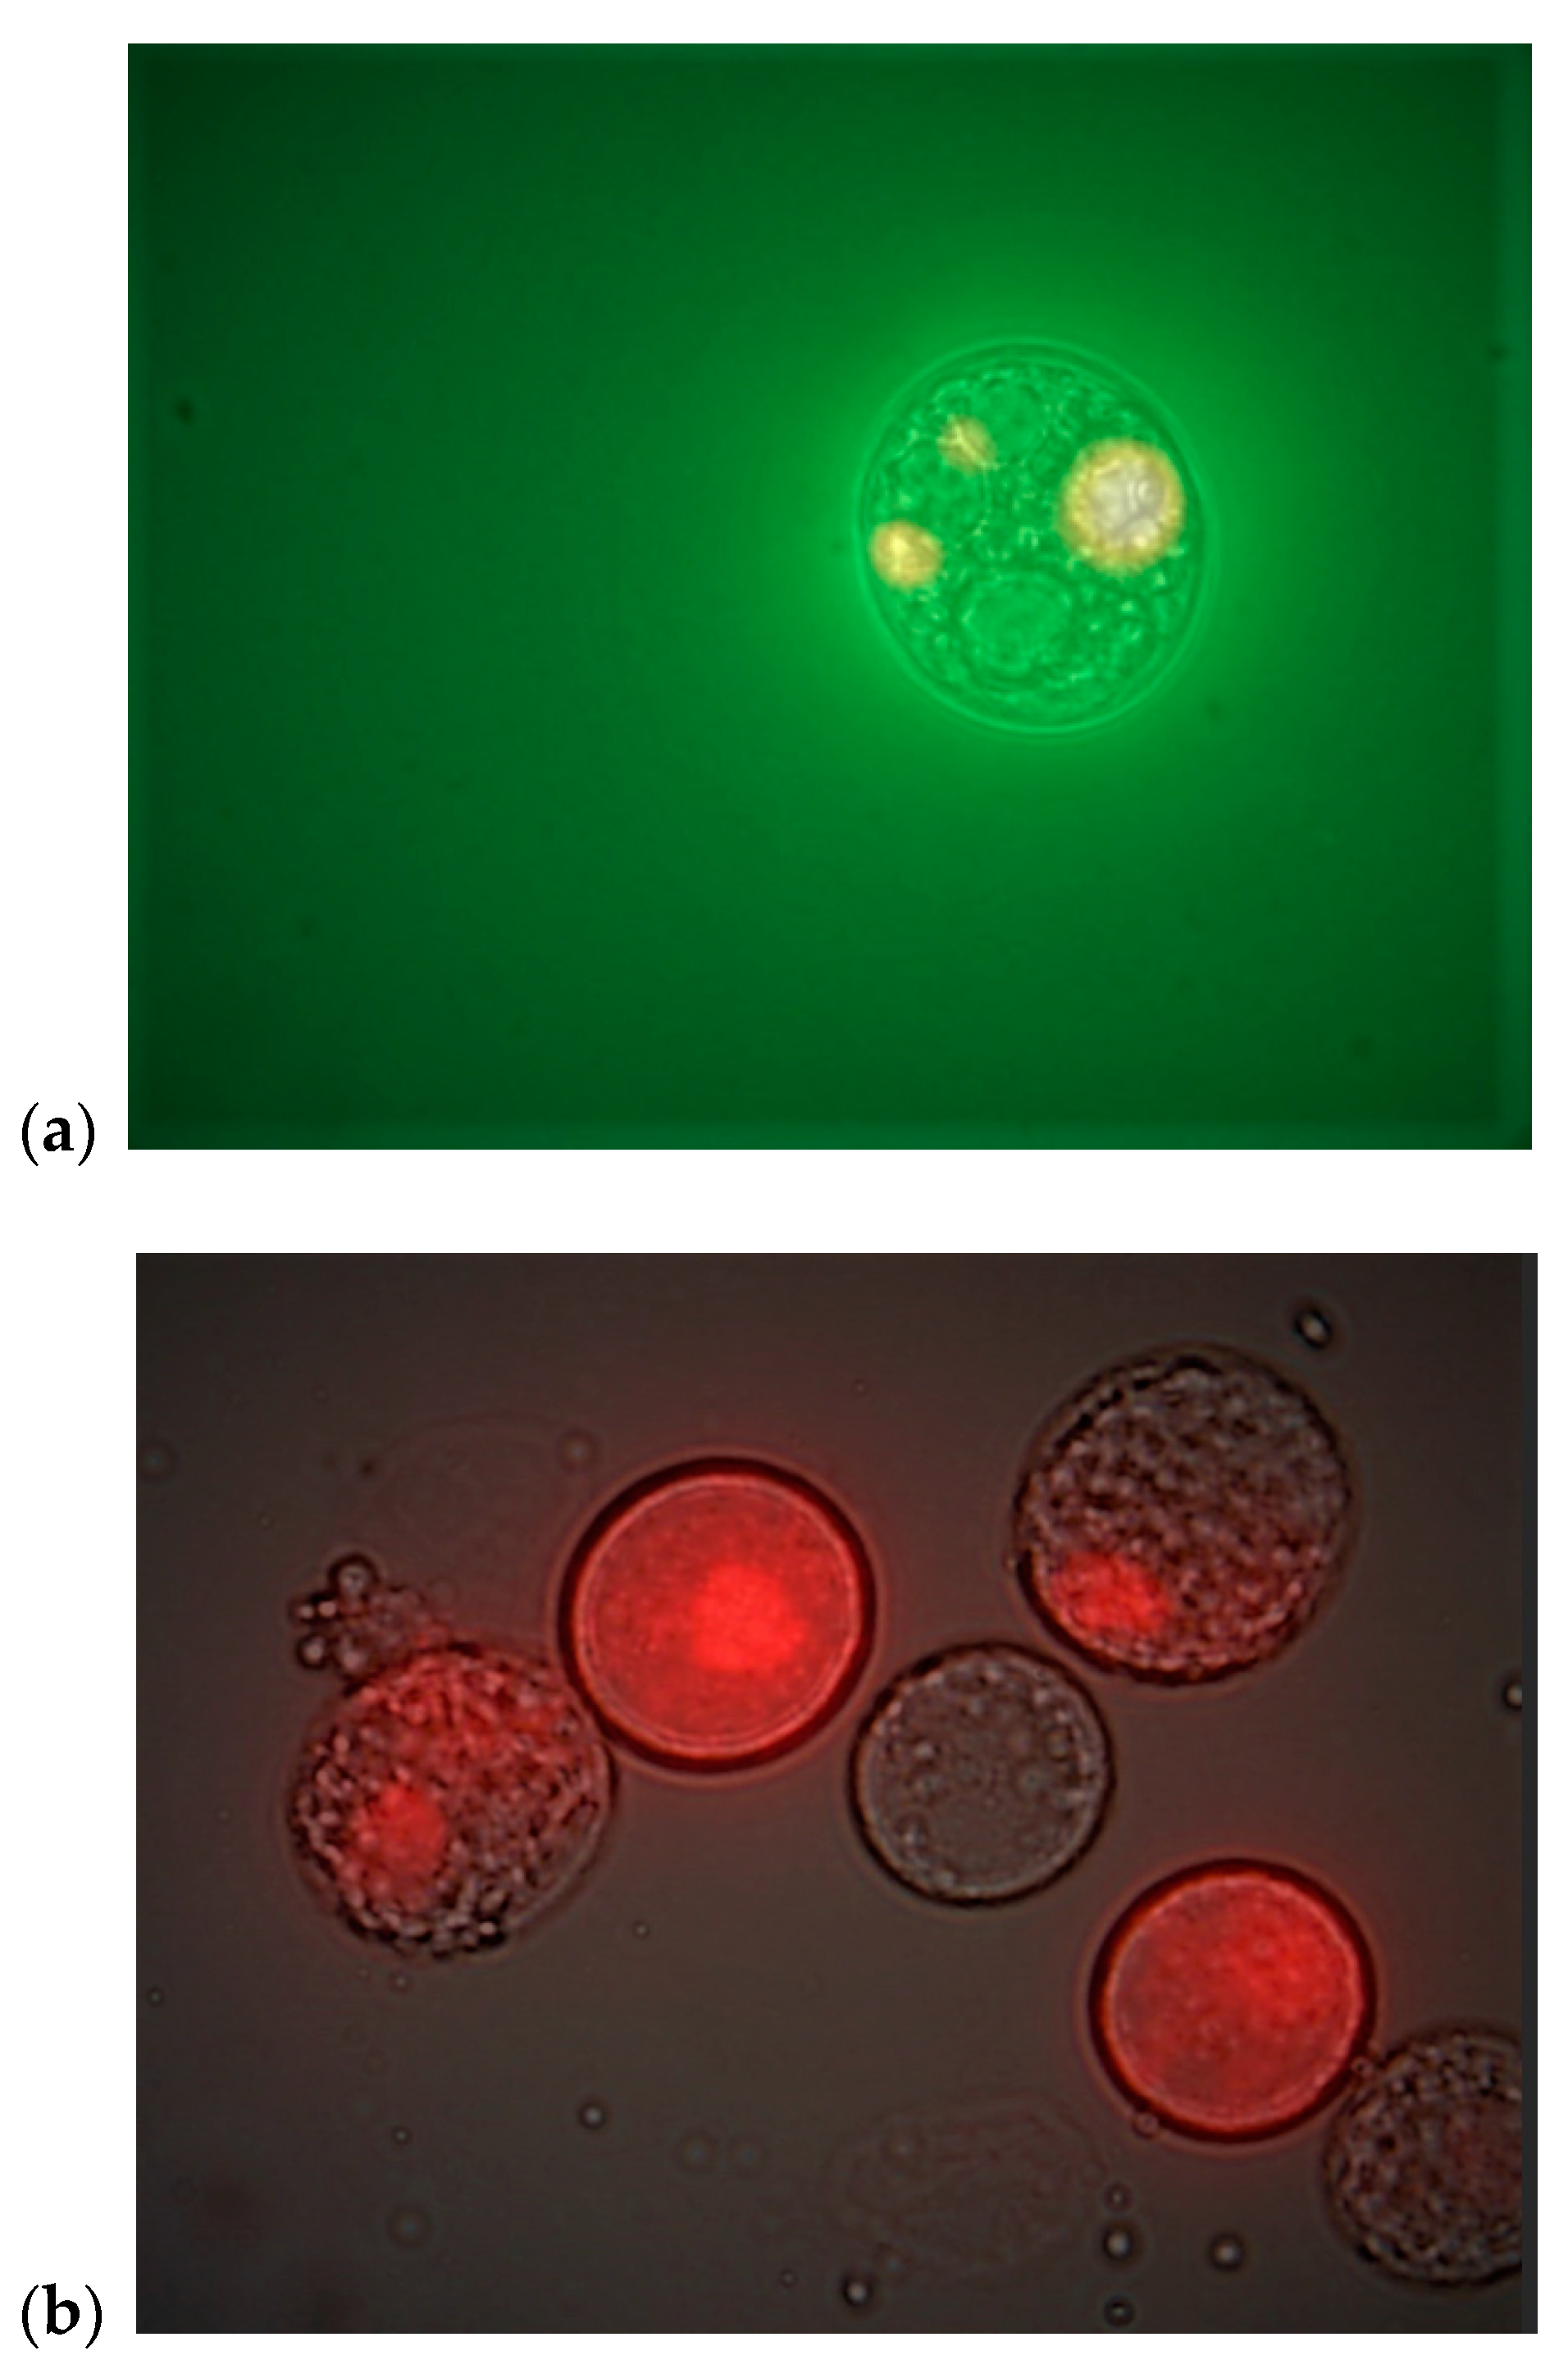
3.2.1. C. cohnii Cells Flow Cytometric Analysis
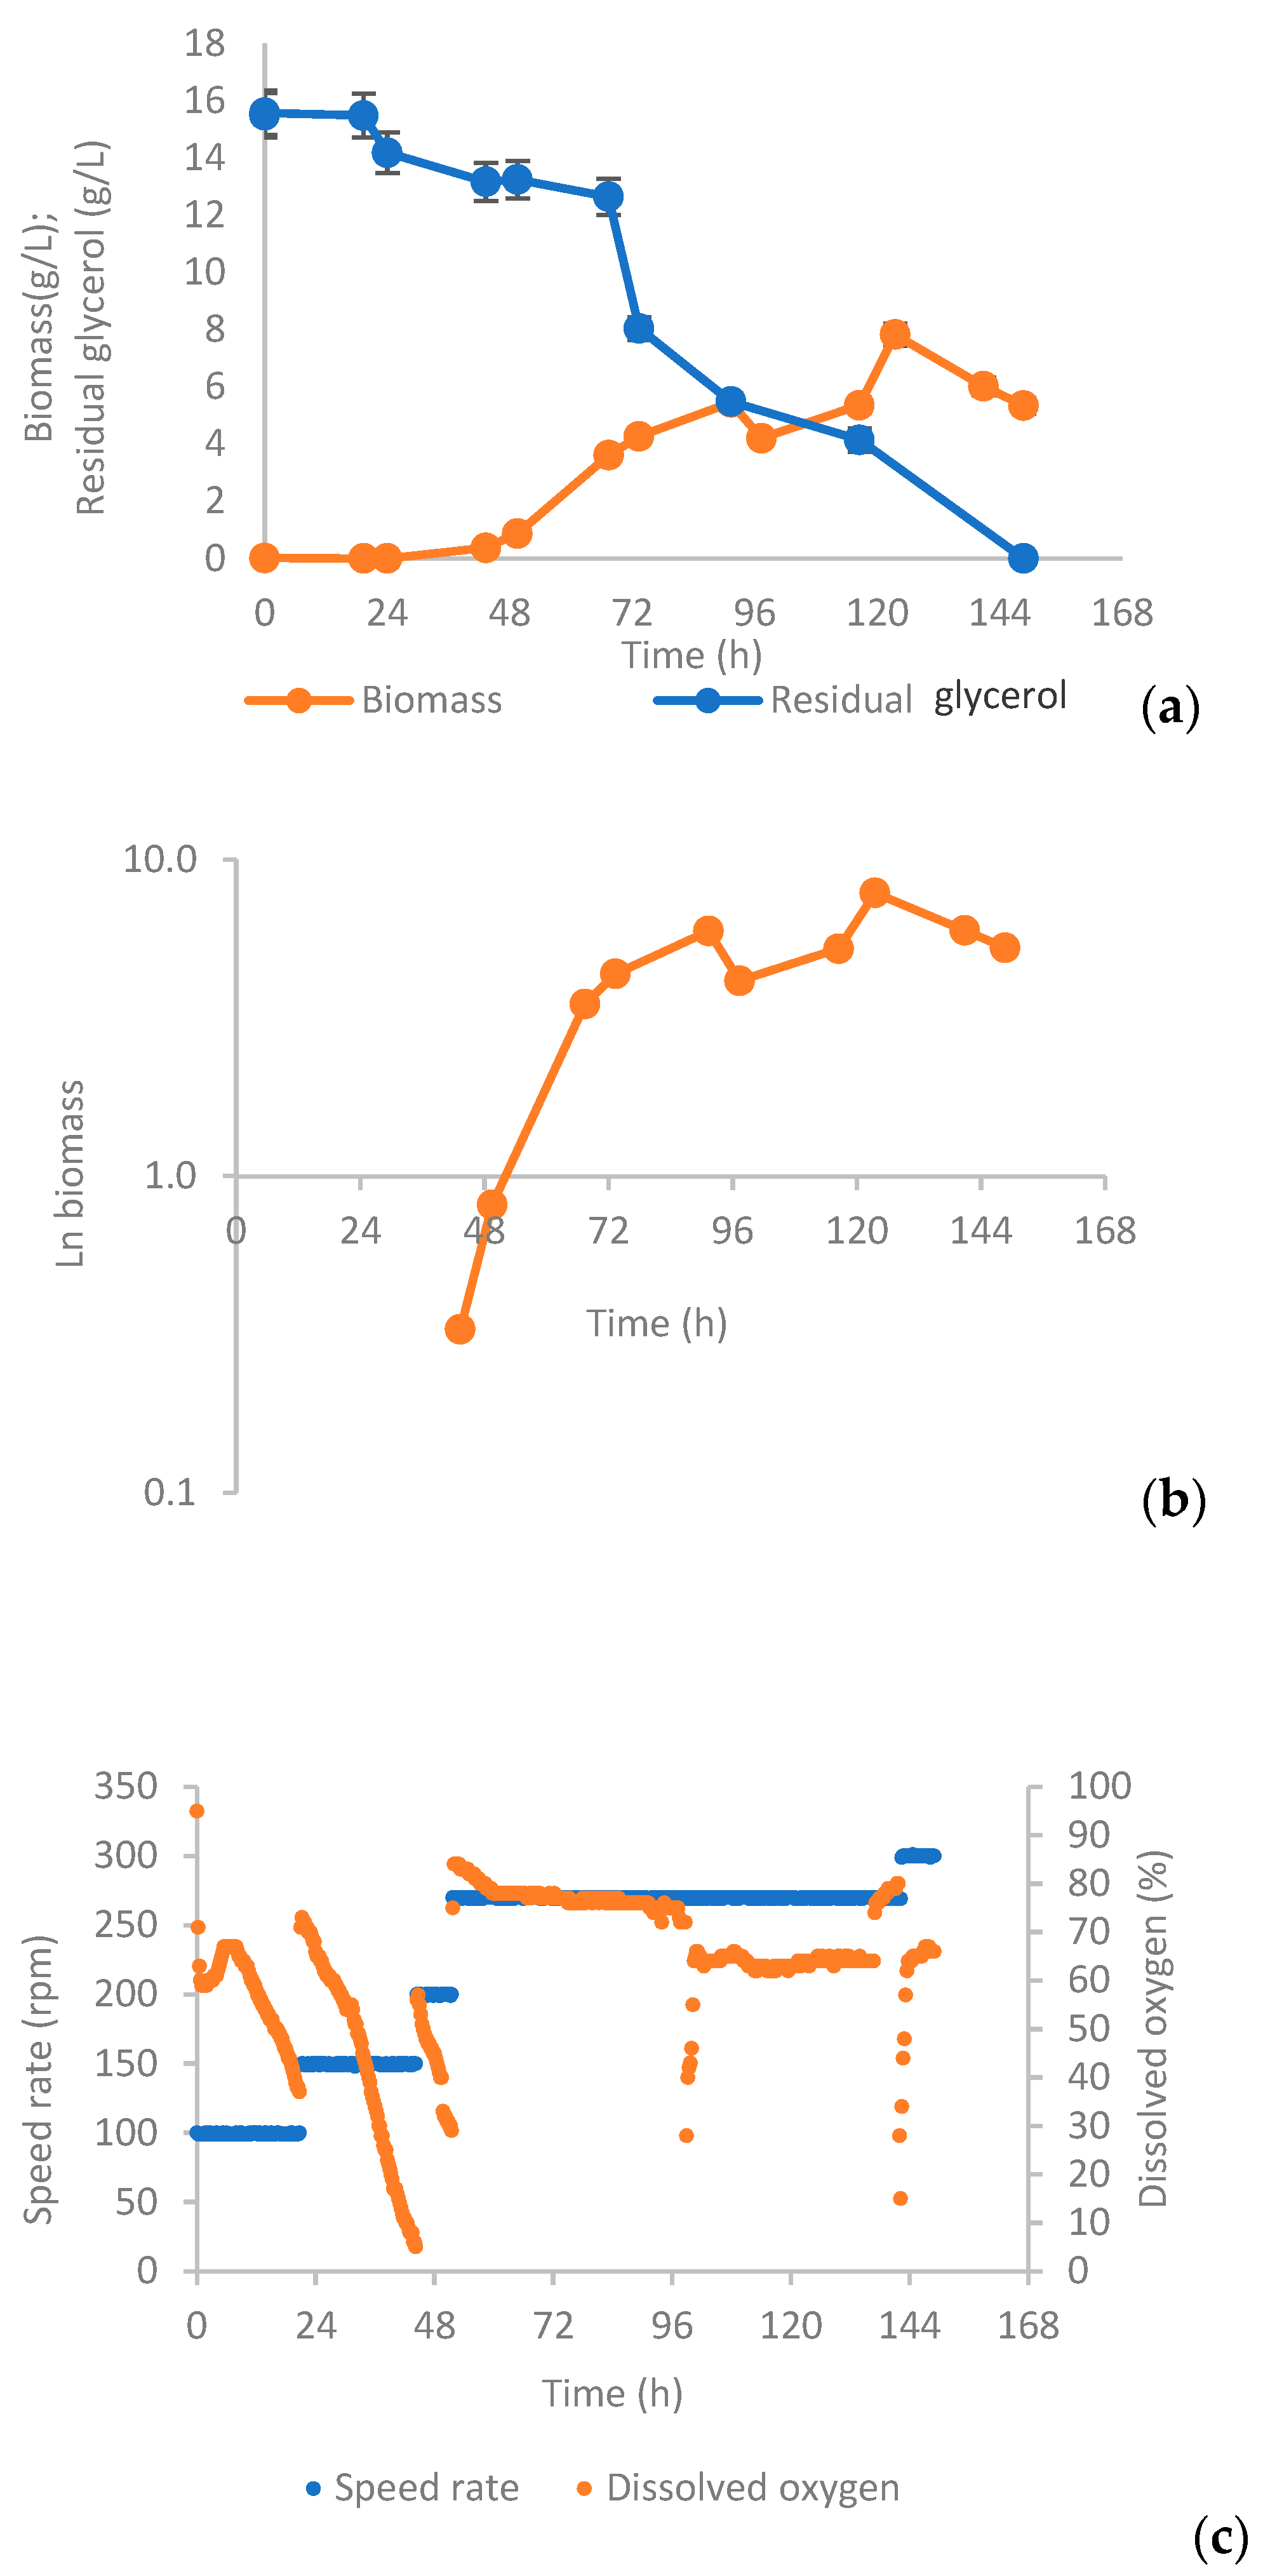
Flow cytometry was used to monitor C. cohnii cell growth, as well as the cell physiological status through enzymatic activity and membrane integrity detection, during the bioreactor experiments.
As above referred, industrial byproducts often contain particles. Indeed, distilled raw glycerol contain particles, which may interfere with the biomass determination. Therefore, the microalga biomass concentration was determined by cell counting, using flow cytometry.
A flow cytometer contains two types of detectors for event detection: (i) forward scatter detector (FSC), which is placed in the plane of the beam, and gives information on cell size; and (ii) side scatter detector (SSC), which is placed at 90° to the laser beam and provides information on cell granularity and internal complexity. Because each particle displays a characteristic profile of scattering signals, FC allows distinguishing different particles types such as debris and microbial populations. Specifically, yeast and microalgae are easier to be distinguished from the background than bacteria, due to their higher size and internal complexity, making the formers microorganisms ideal for FC analysis, since bacteria often cannot be differentiated from cell debris and noise.
Figure 2a shows the FSC/SSC dot plot concerning C. cohnii cells. It can be seen that the microalgal population is well defined, and appeared as an elliptical shape, ranging from 1.5 × 10⁵ to 1.5 × 10⁶ FSC, and 5 × 10⁴ to 5 × 10⁶ SSC signals. Such FSC/SSC signals wide range revealed cell size and internal complexity heterogeneity in C. cohnii cultures. This is supported by the optical microscope observations of the microalgal culture. Figure 2b,c shows microscopic observations at 10 and 100 magnifications. A wide range of microalgal cell shapes can be seen in both figures. A few dividing C. cohnii cells can be seen in Figure 2c.
Dividing cells are larger and have a higher internal complexity (due to a higher DNA content) than the remaining, being responsible for the higher FSC and SSC signals.
The microalga cell counting was performed by selecting the microalgal population inside C. cohnii gate (Figure 2a) which allows a more precise determination of biomass concentration, since debris and other particles are not considered in the FC cell counting.
C. cohnii physiological status were also monitored during the bioreactor experiments, using CFDA and PI double staining. CFDA is a non-fluorescent compound and penetrates the cells by passive diffusion. When it is inside the cell, if esterases are active, they will hydrolyze CFDA to a fluorescent compound that shows the maximum fluorescence at 528 nm, detected by FC in the FITC channel. Therefore, cells stained with CFDA have their enzymatic system (esterases) active and their membrane is intact; cells not stained with CFDA, do not have their enzymatic system active, or their cell membrane is not intact, as permeabilised membrane allows the fluorescent compound to exit the cell. For this reason, when detecting enzymatic activity with CFDA stain (or similar), the cell membrane should always be detected, since the loss of cell fluorescence can be due to inactive esterases or cell membrane rupture.
PI cannot cross intact membranes, but it enters cells with damaged membrane, being used to differentiate cells with injured membranes. Once inside the cells, PI binds to DNA, increasing the cell fluorescence. It shows the maximum fluorescence at 620 nm, being detected in the PC5.5 channel.
Figure 3a,b shows C. cohnii cells collected from a stationary phase culture, stained with CFDA and PI, respectively. In Figure 3a, bright areas inside the cell indicate greater fluorescence, revealing localized esterase activity. In Figure 3b, cells that emit red fluorescence are stained with PI, thus their cell membranes are damaged.

3.2.2. Growth

Figure 4 shows the biomass concentration determined by FC cell counting, and the residual glycerol profiles during C. cohnii growth. During the exponential phase (Figure 4b) the speed rate was maintained at low values (>150 rpm) in order to prevent possible cell damage [2,12]. As a consequence, as the culture entered the exponential phase, the dissolved oxygen (DO) dropped pronouncedly, attaining 5% at t = 48 h, leading to oxygen-limiting conditions in the microalgal culture (Figure 4c).
To overcome this limitation, the speed rate was increased to 270 rpm at t = 48 h, which allowed the DO to reach attained values higher than 70% until the end of the cultivation (allowing oxygen excess conditions) as well as the complete glycerol exhaustion (Figure 4a).
During the exponential phase, the growth rate was 0.06/h. The biomass attained 5.34 g/L at the end of the assay (t = 148 h), with a biomass yield of 0.34 g/g. Isleten-Hosoglu and Elibol [2] reported similar values when C. cohnii CCMP 316 was grown on 16 g/L pure glycerol for 7 days a maximum (biomass concentration 5.7 g/L, with a biomass yield of 0.38 g/g), which supports that the crude glycerol used in this work did not negatively affect the microalga growth.

3.2.3. C. cohnii FC Analysis

The FSC/SSC plot obtained during the microalgal growth (Figure 5a) revealed that the cell size (measured as FSC) and internal complexity (SSC) increased until the end of exponential phase (t = 48 h) attaining 8.5 × 10⁵ and 5.0 × 10⁵, respectively.
Thereafter, both FSC and SSC values decreased to 5.6 × 10⁵ and 2.9 × 10⁵ at t = 48 h, respectively, slowly increasing until the end of the experiment, reaching 7.0 × 10⁵ and 5.8 × 10⁵, respectively. Indeed, it has been reported that cell size and internal complexity increased during the exponential phase, which has been attributed to the higher DNA in dividing cells abundant in the exponential phase [13] as they are larger in size and internal complexity. However, new daughter C. cohnii cells are formed and released during the cell multiplication, which displayed lower FSC/SSC values. Thus, the FSC/SSC average values resulted from a balance between the proportion of daughter and dividing mother cells.
The FSC/SSC profiles allowed the easy and fast C. cohnii growth phase identification, which can be useful to collect metabolites synthesized by the microorganisms at different growth phases (primary and secondary metabolites).
Figure 5b shows C. cohnii cells stained with CFDA and PI mixture, for the microalga stress response monitoring, when grown on crude glycerol and CLS. The proportion of intact cells without enzymatic activity (not stained with CFDA, but stained with PI, designated as CFDA−/PI−) was higher after the inoculation (46.6%), which might be due to the time period that the cells needed to adapt to a new medium (lag phase) but decreased as the cells entered the exponential phase, attaining ~3% during the stationary phase.
Throughout the cultivation, the proportion of cells with intact membrane (intact cells) and with enzymatic activity (CFDA+/PI−) was always equal or higher than 50%, indicating that these substrates, despite may contain inhibitory compounds, did not drastically affect the microalga physiological status. It was also concluded that the speed rate increase from 100 rpm to 300 rpm during the first 48 h of cultivation, did not affect C. cohnii ATCC 30772 cell membrane and enzymatic activity, since the proportion of intact cells with enzymatic activity (CFDA+/PI−) increased during that time period. These results are different from those described by Isleten-Hosoglu and Elibol [2] who reported that a slight speed rate increase (150–250 rpm) negatively affected C. cohnii CCMP 316 growth on glycerol.
Nevertheless, the percentage of cells with enzymatic activity but injured membrane (CFDA+/PI−) increased when the culture entered the stationary phase, attaining 36.9% at t = 140.8 h, which was attributed to the carbon limiting conditions that the cells experienced at that time, negatively affecting the microalga cell status. Indeed, since carbon is the energy source, once depleted, the electronic transport chain will halt, as well as ATP synthesis, which compromises the cell metabolic activity.

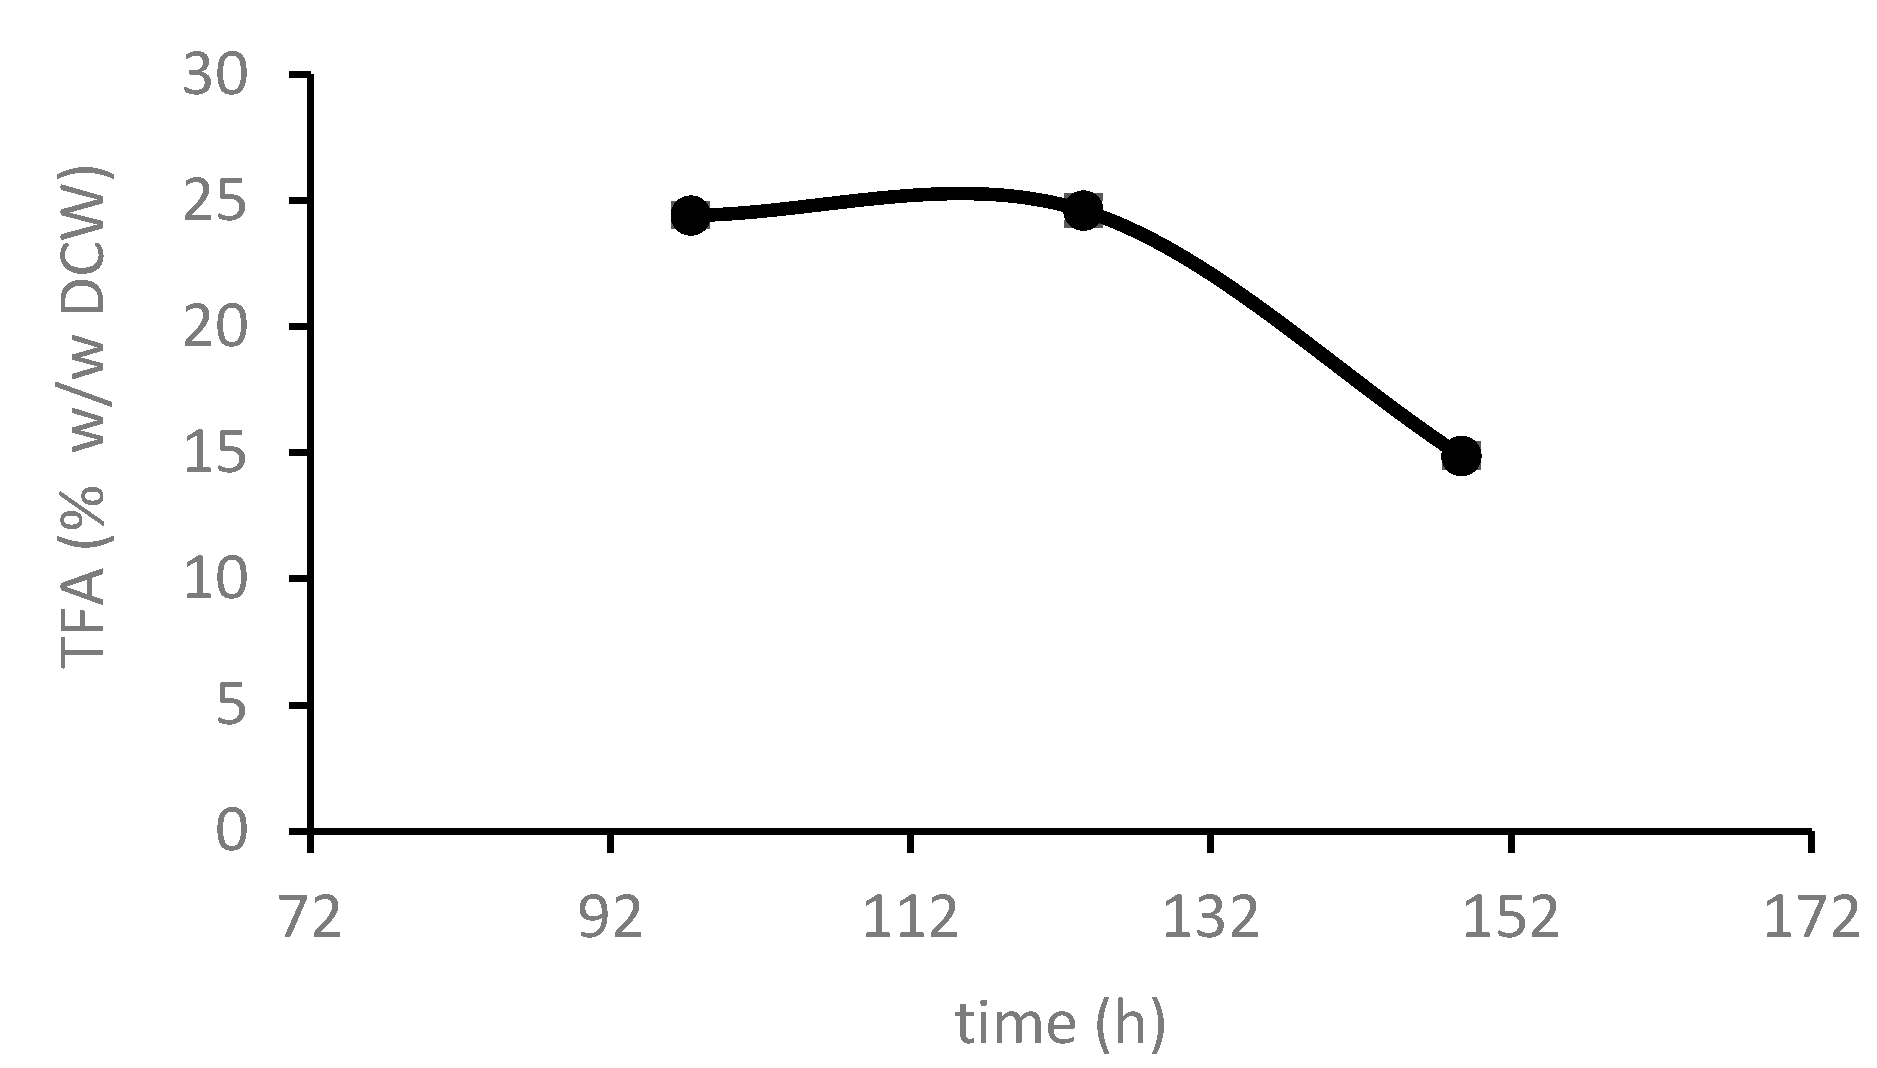
3.2.4. C. cohnii Lipid Production

Usually, microalgal storage lipids are intracellularly accumulated during the stationary phase.
According to Figure 6, the highest lipid (TFA) content was observed at t = 97.33 h (26.66% (w/w DCW), corresponding to a lipid productivity of 0.011 g/Lh. Isleten-Hosoglu and Elibol [2] reported a lipid productivity of 0.042 g/Lh and a lipid content of 30% (w/w DCW) when C. cohnii ATCC 30556 was grown on pure glycerol. Safdar et al. (2017) [14] reported a lipid productivity and content of 0.025 g/Lh and 26.4% (w/w DCW), respectively, when growing C. cohnii ATCC 30555 on pure glycerol, in shake flasks. Isleten-Hosoglu and Elibol [2] showed the highest lipid content and productivity, followed by Safdar et al. [14], and this work. This may due to the use of raw glycerol and CSL used in this work, which may contain the inhibitor compounds, contrarily to the media formulation used by those authors, which have used pure glycerol and yeast extract as carbon and nitrogen sources, respectively.
From Figure 6, it can also be seen that the lowest lipid content was detected at the end of the cultivation (t = 148.67 h, 14.88% DCW (w/w)) as expected, since at that cultivation time, the microalgae were grown under carbon depletion conditions. Carbon is an essential nutrient for the microbial lipid synthesis. Indeed, under carbon limiting conditions, the microalga cells not only cannot produce lipids, as they consume the intracellular lipid storage materials, as a survival mechanism to maintain their metabolism and extend life, under adverse conditions.
Table 2 shows the fatty acid methyl esters (FAME) analyzed during C. cohnii cultivation, at different times.
The FAME profile observed for the three cultivation times was quite similar (Table 2). The dominant fatty acids were 22:6ω3 (DHA) (>37%), 14:0 (myristic acid) (>19%) and 16:0 (palmitic acid) (>16%). A slight increase in the polyunsaturated fatty acid proportion (PUFA) was detected as the culture aged (38.24% at t = 97.33 h to 40.77% at t = 148.67 h) due to DHA percentage increase. Concomitantly, an increase in the saturated fatty acid proportion (SFA) was detected (37.78% at t = 97.33% to 40.09% at t = 148.67 h). The monounsaturated fatty acid proportion (MUFA) remained stable during that period (~13.7%). These profiles are similar to those reported by Taborda et al. [10] for C. cohnii ATTC 30772 grown on other carbon sources (glucose, acetate, sugarcane molasses).
In all cases, the higher PUFA proportion present in C. cohnii oil, mainly composed of DHA (~40% w/w TFA), makes easy its extraction and purification for pharmaceutical and food purposes. Safdar et al. [14] reported a DHA percentage of 38% (w/w TFA) when C. cohnii ATCC 30555 was grown on pure glycerol, similar to the one here reported. This result indicated that the use of crude glycerol as carbon source did not affect C. cohnii DHA percentage in TFA, which will reduce the process costs without saccharifying the DHA proportion.
After the DHA extraction, the remaining lipid fraction, composed of SFA and MUFA, can be directed to biodiesel purposes [15]. If the properties of this fraction does not allow obtaining a final product within the biodiesel quality specifications—EN 14214, it can be used in mixture with vegetable oils containing low SFA content. This approach would be advantageous namely in terms of oxidation stability, leading to a decrease of biodiesel deterioration in long-term storage and/or high-temperature environments. The DHA-free lipid fraction can also be converted into a different type of biofuel by catalytic hydrogenation, a procedure that promotes the removal of oxygen from the organic molecules producing a mixture of hydrocarbons similar to fossil fuels.

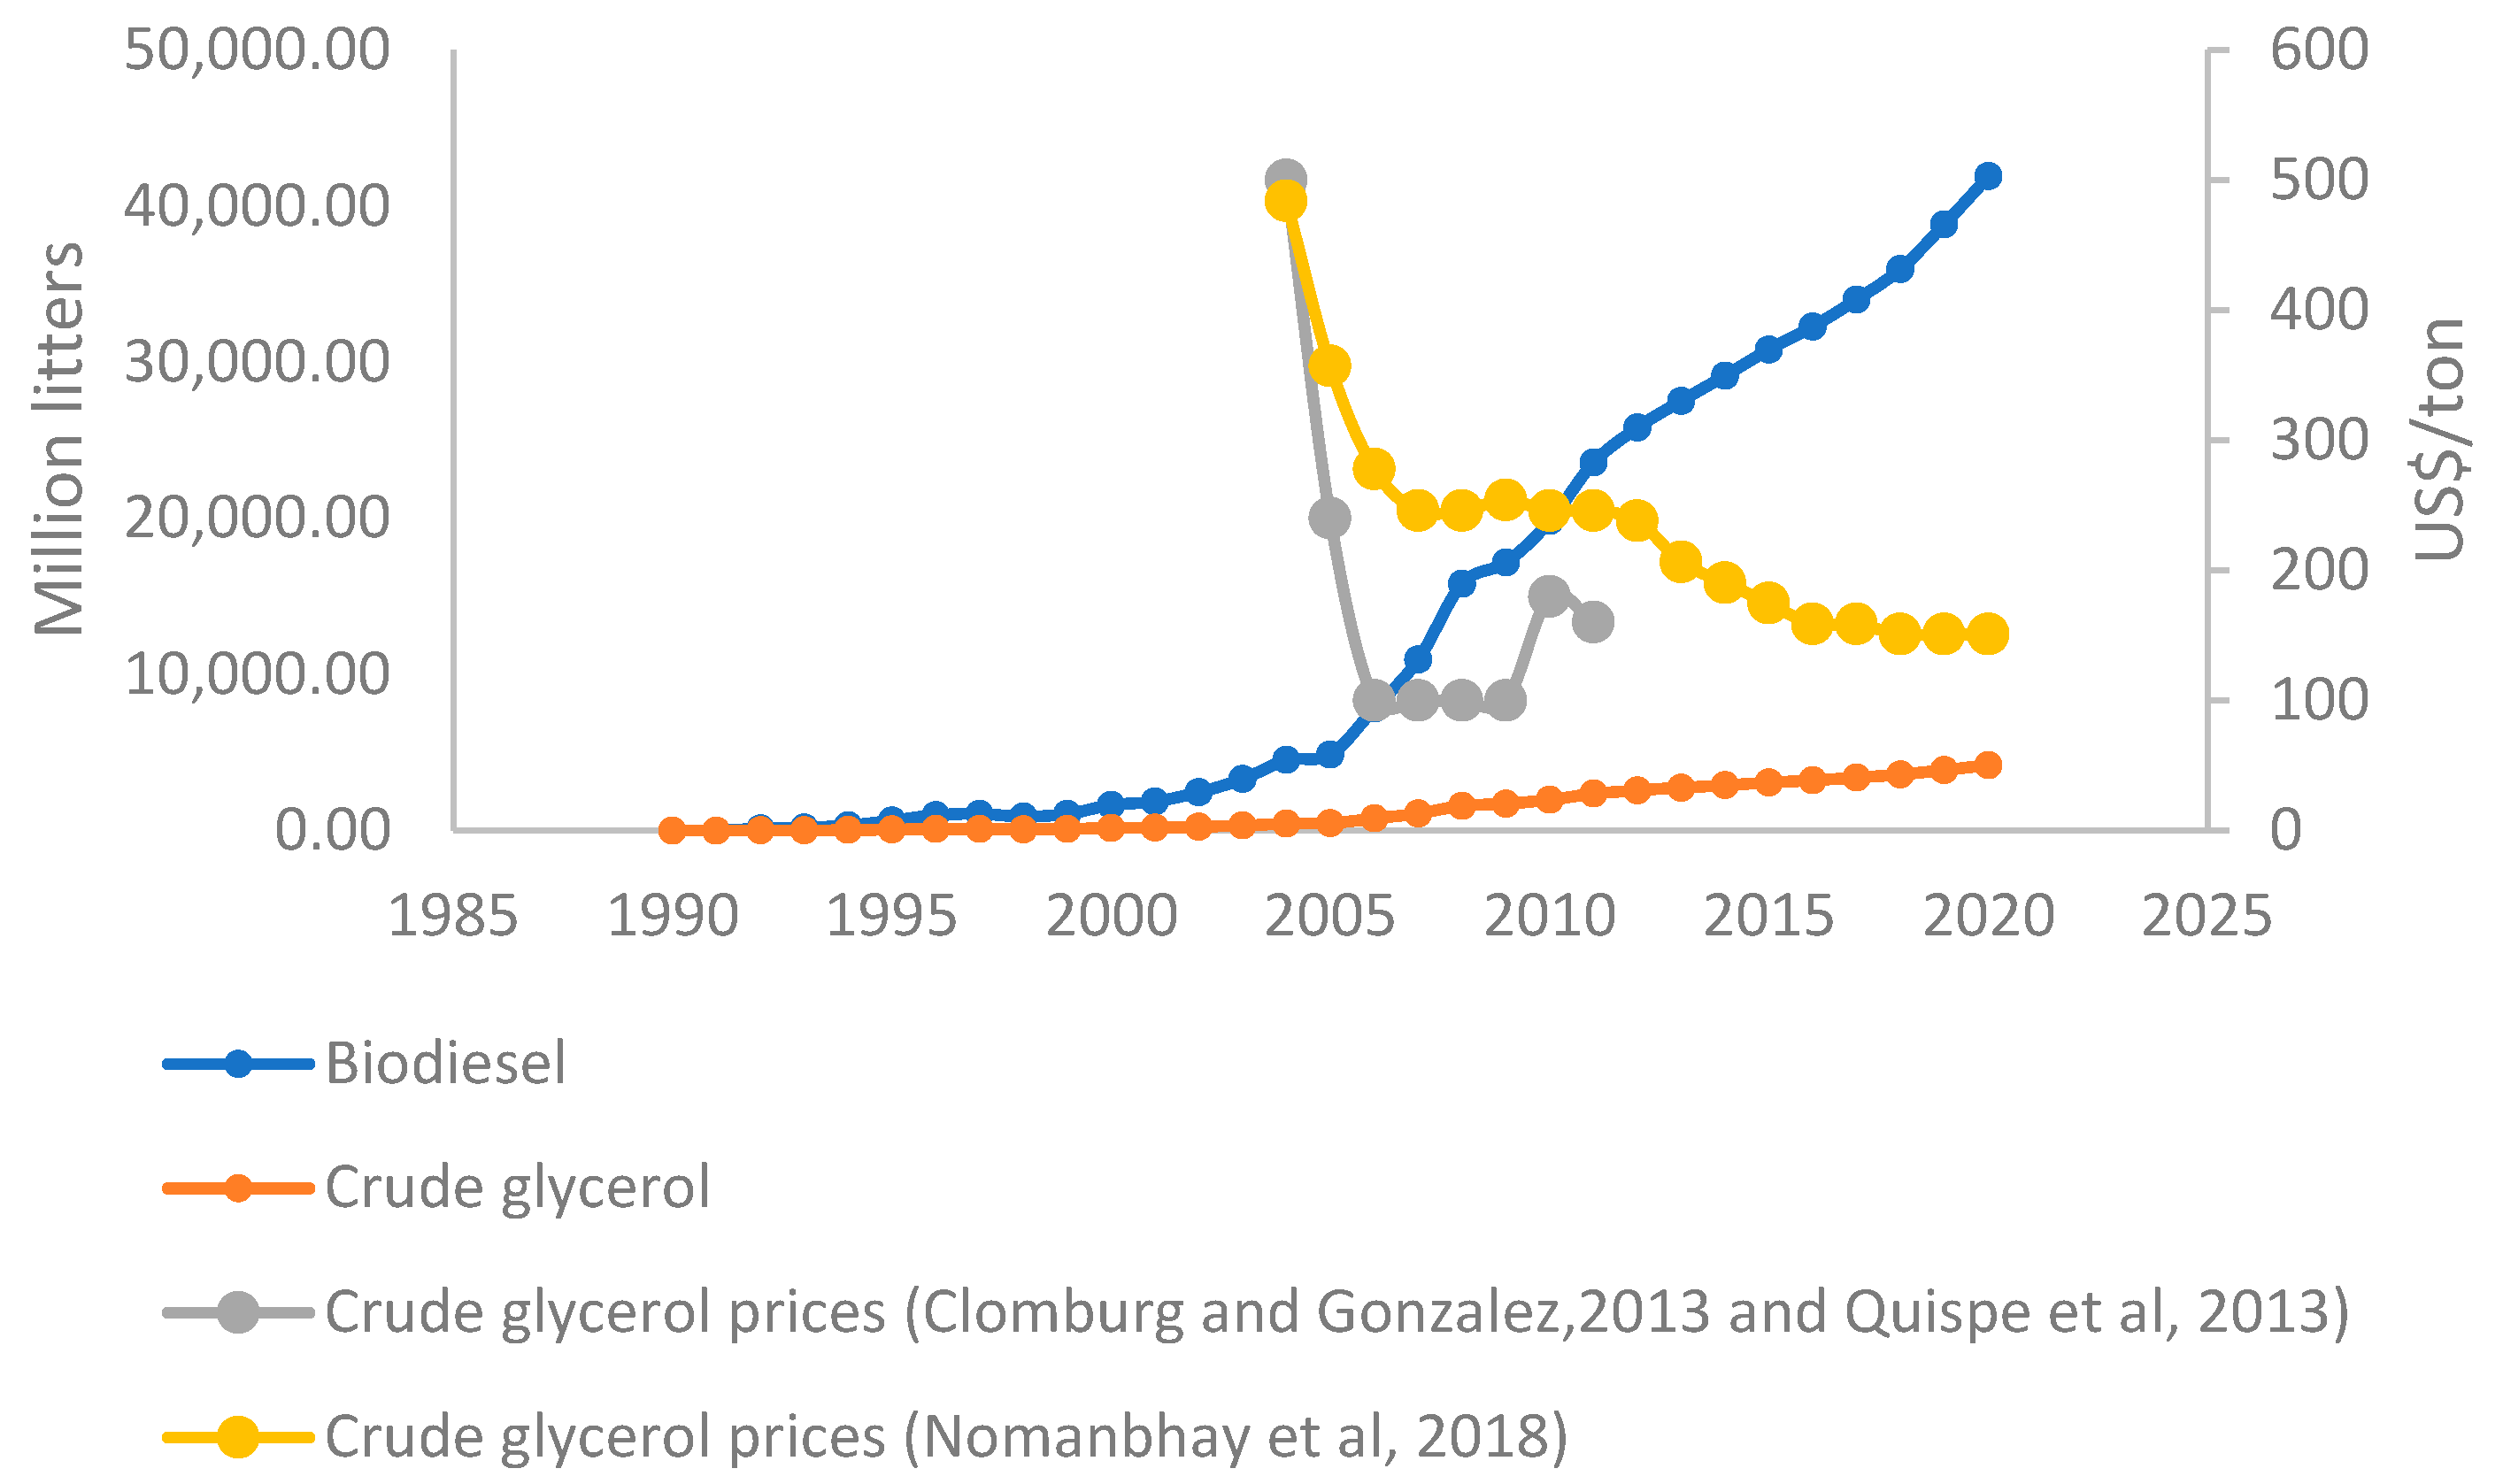
3.3. Potential Costs Impact in Up-Scaled Systems

From an economic point of view, the difference between the reference and alternative system is on the inputs, as depicted in Figure 7, because similar levels of biomass are obtained.
Due to a shortage in the supply of raw materials for yeast extract production its prices have increased and are estimated to remain high in the future. Raw materials such as ammonia and phosphoric acid used in yeast extract production are costly due to their application as fertilizers. As the prices of this raw materials remain high the price of the end-product yeast extract also remains high. In the literature we found a typical range of prices from 1000 USD/ton to 7286 USD/ton [16,17].
Therefore, a range of 1000 USD/ton to 7286 USD/ton was assumed for the calculations. Glucose prices were found to be variable between USD 0.18/lb (360 USD/ton, according to [18] and USD 0.10/lb to USD 0.60/lb in the United States market (200 to 1200 USD/ton [19]). An estimation of a price model of the high fructose corn syrup industry is reported in [19]. Therefore, a range of 200 USD/ton to 1200 USD/ton was assumed for the calculations.
The alternative nitrogen source—corn steep liquor (CSL), is a co-product of starch industry/ethanol fermentation industry from corn. Corn wet milling process produces 6.5% w/w of CSL (for every 10 kg of corn, 0.65 kg of CSL is produced) [20]. The majority of CSL is used as animal feed, fertilizer or in the fermentation industry, according to [21].
Prices in literature range from 2 USD/litter (using density conversion factor of 1.3 kg/L, 1.5 USD/ton) to 200 USD/ton [22]. Therefore, a range of 1.5 USD/ton to 200 USD/ton was assumed for the calculations.
The alternative carbon source—crude glycerol, is a co-product of transesterification process which generates about 10% (w/w) glycerol (for every 10 kg of biodiesel, 1 kg of crude glycerol is produced). Biodiesel is one of the most important energy commodities in the world mainly to use as an alternative to fossil diesel in the transportation sector. The majority of crude glycerol is used as feedstock for production of other value-added chemicals, followed by animal feeds [23]. Looking at the glycerol market worldwide, there has been a rapid increase in glycerol supply since 2003 (Figure 8). The prices of both refined and crude glycerol have been declining due to a surplus of glycerol from biodiesel. Within a year, it also shows high volatility. For example, in 2010, in Europe, price ranged from 150 to 280 USD/ton [24].
Therefore, a range of 100 USD/ton to 500 USD/ton was assumed for the calculations (Table 3).
The logic to give a good estimation for net savings by using alternative carbon and nitrogen sources is to assume the minimum reference and maximum alternative prices (this will tell us how minimum impacts would look alike) and maximum reference and minimum alternative prices (this will tell us how big impacts look alike) (Table 4). Yeast extract in both reference and alternative scenarios should be the same.
The yeast extract present in the alternative system is impacting the potential maximum savings. By simulation model, it was found that if the alternative system would not need yeast extract for the same output, savings would reach 94%. However, using 4.59 g/L CSL supplemented with 0.5 g/L yeast extract, savings achieved 84%.
The electrification of the transportation sector may lead to less economical interest in biofuels and may pose a shortage of biodiesel and corn ethanol co-products and, hence, an increase in their market prices [27]. However, the historical framework, encompassing COVID-19 impact, it is expected to cover all expected price fluctuations.

4. Conclusions

These results demonstrated that crude glycerol derived from biodiesel industry, and CSL derived from starch industry, can be used as carbon and nitrogen sources, respectively, in the media formulations for DHA and lipid production by the microalga C. cohnii, which can significantly reduce the process costs (OPEX). Indeed, using alternative low-cost carbon and nitrogen sources, based on historical price volatility, a maximum 84% savings can be obtained.
Flow cytometry analysis confirmed that the microalgal enzymatic activity and membrane integrity were not affected by the presence of these low-cost substrates.
The lipid content and productivity attained in this study using low-cost carbon and nitrogen sources, encourages the scale-up of this process, which is now in progress.

Author Contributions

Conceptualization, T.L.d.S.; laboratorial work, P.M. and T.L.d.S.; validation, C.S.; writing—original draft preparation, T.L.d.S.; writing—review and editing, A.C.O., C.S. and A.R.; supervision, T.L.d.S.; project administration, T.L.d.S.; funding acquisition, T.L.d.S. All authors have read and agreed to the published version of the manuscript.

Funding

This work was financed by national funds through FCT-Fundação para a Ciência e a Tecnologia, I.P., within the scope of the project PTDC/EAM-AMB/30169/2017, and also by Grant Number UIDB/50019/2021—Instituto Dom Luiz, Lisbon, Portugal.

Acknowledgments

The authors thank the Biomass and Bioenergy Research Infrastructure (BBRI)—LISBOA-01-0145-FEDER-022059, which is supported by Operational Programme for Competitiveness and Internationalization (PORTUGAL2020), by Lisbon Portugal Regional Operational Programme (Lisboa 2020) and by North Portugal Regional Operational Programme (Norte 2020) under the Portugal 2020 Partnership Agreement, through the European Regional Development Fund (ERDF). The authors acknowledge Tiago Taborda for the support in the fluorescence microscopy, Margarida Monteiro for the laboratorial support and Maria do Céu Penedo for the HPLC analysis.

Conflicts of Interest

The authors declare no conflict of interest.

References

  1. Mendes, A.; da Silva, T.L.; Reis, A. DHA concentration and purification from the marine heterotrophic microalga Crypthecodinium cohnii CCMP 316 by winterization and urea complexation. Food Technol. Biotechnol. 2007, 45, 38–44. [Google Scholar]
  2. Choi, H.; Yu, S. Influence of crude glycerol on the biomass and lipid content of microalgae. Biotechnol. Biotechnol. Equip. 2015, 29, 506–513. [Google Scholar] [CrossRef]
  3. Isleten-Hosoglu, M.; Elibol, M. Improvement of medium composition and cultivation conditions for growth and lipid production by Crypthecodinium cohnii. Rom. Biotechnol. Lett. 2017, 22, 13086–13095. [Google Scholar]
  4. Isleten-Hosoglu, M.; Elibol, M. Bioutilization of Cheese Whey and Corn Steep Liquor by Heterotrophic Microalgae Crypthecodinium cohnii for Biomass and Lipid Production. Acad. Food J./Akademik GIDA 2017, 15, 233–241. [Google Scholar]
  5. Song, O.; Kuryatov, A.; Axelsen, P.H. A new synthetic medium for the optimization of docosahexaenoic acid production in Crypthecodinium cohnii. PLoS ONE 2020, 15, e0229556. [Google Scholar] [CrossRef] [PubMed] [Green Version]
  6. De Swaaf, M.E.; Rijk, T.C.; Eggink, G.; Sijtsma, L. Optimization of docosahexaenoic acid production in batch cultivations by Crypthecodinium cohnii. J. Biotechnol. 1999, 70, 185–192. [Google Scholar] [CrossRef]
  7. De Swaaf, M.E.; Pronk, J.T.; Sijtsma, L. Fed-batch cultivation of docosahexaenoic-acid-producing marine alga Crypthecodinium cohnii on ethanol. Appl. Microbiol. Biotechnol. 2003, 61, 40–43. [Google Scholar] [CrossRef]
  8. Ratledge, C.; Kanagachandran, K.; Abdersin, A.J.; Grantham, D.J.; Stephenson, J.C. Production of docosahexaenoic acid by Crypthecodinium cohnii with acetic acid grown in a pH-auxostat culture with acetic acid as principal carbon source. Lipids 2001, 36, 1241–1246. [Google Scholar] [CrossRef]
  9. Alibaba.com. Available online: www.alibaba.com (accessed on 30 June 2021).
  10. Taborda, T.; Moniz, P.; Reis, A.; Lopes da Silva, T. Evaluating low-cost substrates for Crypthecodnium cohnii lipids and DHA production, by flow cytomtery. J. Appl. Phycol. 2020, 33, 263–274. [Google Scholar] [CrossRef]
  11. Lopes da Silva, T.; Moniz, P.; Silva, C.; Reis, A. The dark side of microalgae Biotechnology: A heterotrophic biorefinery platform directed to ω-3 lipid production. Microorganisms 2019, 7, 670. [Google Scholar] [CrossRef] [Green Version]
  12. Yeung, P.K.K.; Wong, J.T.Y. Inhibition of cell proliferation by mechanical agitation involves transient cell cycle arrest at G1 phase in dinoflagellates. Protoplasma 2003, 9, 1–13. [Google Scholar]
  13. Andrade, R.; Leal, R.; Roseiro, J.; Reis, A.; Lopes da Silva, T. Monitoring Rhodosporidium toruloides NCYC 921 batch fermentations growing under carbon and nitrogen limitation by flow cytometry. World J. Microbiol. Biotechnol. 2012, 28, 1175–1184. [Google Scholar] [CrossRef]
  14. Safdar, W.; Zan, X.; Song, Y. Synergistic effects of pH, temperature and agitation on growth kinetics and docosahexaenoic acid production of C. cohnii cultures on different carbon sources. Int. J. Res. Agric. Sci. 2017, 4, 2348–3997. [Google Scholar]
  15. Lopes da Silva, T.; Santos, A.R.; Gomes, R.; Reis, A. Valorizing fish canning industry by-products to produce ω-3 compounds and biodiesel. Environm. Technol. Innov. 2018, 8, 74–81. [Google Scholar] [CrossRef] [Green Version]
  16. Cavka, A.; Martín, C.; Alriksson, B.; Mörtsell, M.; Jönsson, L. Techno-economic evaluation of conditioning with sodium sulfite for bioethanol production from softwood. Bioresour. Technol. 2015, 196, 129–135. [Google Scholar] [CrossRef] [PubMed] [Green Version]
  17. Future Markets Consultancy. Available online: https://www.futuremarketinsights.com/reports/dry-yeast-market (accessed on 14 September 2021).
  18. Lynch, M.D. The bioprocess TEA calculator: An online technoeconomic analysis tool to evaluate the commercial competitiveness of potential bioprocesses. Metab. Eng. 2021, 65, 42–51. [Google Scholar] [CrossRef] [PubMed]
  19. Garcia-Fuentes, P.; Kennedy, P.; Ferreira, C. An Estimation of a Price Model of the High Fructose Corn Syrup Industry in the Unites States. Selected Paper Prepared for Presentation at the Southern Agricultural Economics Association (SAEA) Annual Meeting, Mobile, Alabama, 4–7 February 2017. Available online: https://ageconsearch.umn.edu/record/252722?ln=en (accessed on 14 September 2021).
  20. Galitsky, C.; Worrell, E.; Ruth, M. Energy Efficiency Improvement and Cost Saving Opportunities for the Corn Wet Milling Industry. Report Funded by the U.S. Environmental Protection Agency’s Climate Protection Partnerships Division as Part of ENERGY STAR. 2003. Available online: https://www.energystar.gov/sites/default/files/buildings/tools/LBNL-52307.pdf (accessed on 14 September 2021).
  21. Available online: https://www.marketintellica.com/report/MI49662-global-corn-steep-liquor-csl-market# (accessed on 14 September 2021).
  22. Tan, J.P.; Jahim, J.M.; Wu, T.Y.; Harun, S.; Mumtaz, T. Use of corn steep liquor as an economical nitrogen source for biosuccinic acid production by Actinobacillus succinogenes. Int. Conf. Chem. Eng. Bioproc. Eng. 2016, 26, 01258. [Google Scholar] [CrossRef]
  23. Yang, F.; Hanna, M.; Runcang, S. Value-added used for crude glycerol—A byproduct of biodiesel production. Biotechnol. Fuels 2012, 5, 13. [Google Scholar]
  24. Quispe, C.; Coronado, C.; Carvalho, J. Glycerol: Production, consumption, prices, characterization and new trends in combustion. Ren. Sust. Energy Rev. 2013, 27, 475–493. [Google Scholar] [CrossRef]
  25. Nomanbhay, S.; Hussein, R.; Ong, M. Sustainability of biodiesel production in Malaysia by production of bio-oil from crude glycerol using microwave pyrolysis: A review. Green Chem. Let. Rev. 2017, 11, 137–157. [Google Scholar] [CrossRef]
  26. Clomburg, J.; Gonzalez, R. Anaerobic fermentation of glycerol: A platform for renewable fuels and chemicals. Trends Biotechnol. 2013, 31, 20–28. [Google Scholar] [CrossRef] [PubMed] [Green Version]
  27. Near-Term Transportation Sector Electrification Program. Available online: https://www.iea.org/policies/598-near-term-transportation-sector-electrification-program (accessed on 14 September 2021).
Figure 1. C. cohnii growth parameters calculated at the end of the cultivation (7 days). (a) Biomass concentration, TFA content and DHA content and (b) Biomass, DHA and TFA productivity (P). CSL 50—Assay in which CSL was used, with the corresponding nitrogen half amount that exists in 1.5 g/L yeast extract. CSL 100—Assay in which CSL was used, with the corresponding nitrogen amount that exists in 1.5 g/L yeast extract. YE—Assay in which the yeast extract was used as nitrogen source. AS—Assay in which ammonium sulfate was used as nitrogen source. SN—Assay in which sodium nitrate was used as nitrogen source. Error bars represent ± standard deviation from two independent shake flask experiments.
Processes 09 02005 g001
Figure 2. (a) FSC/SSC density plot concerning a 72 h grown C. cohnii culture; (b) The 72 h C. cohnii culture optical observation (magnification 100×); (c) The 72 h C. cohnii culture optical observation (magnification 1000×); D—diving cells.
Processes 09 02005 g002
Figure 3. C. cohnii cells collected from a stationary phase culture, and stained with CFDA (a) and PI (b). Magnification 1000×.
Processes 09 02005 g003
Figure 4. C. cohnii growth parameters when grown on crude glycerol, in a 7L-bioreactor. (a) Biomass and residual glycerol concentration; (b) biomass logarithmic plot; (c) dissolved oxygen percentage and speed rate. Error bars represent ± standard deviation from two technical replicates of measurement.
Processes 09 02005 g004
Figure 5. (a) FSC/SSC profiles throughout C. cohnii batch cultivation in a bench bioreactor. Error bars represent ± standard deviation from two technical replicates of measurement. (b) C. cohnii cell subpopulations profiles, when grown on crude glycerol and CLS, after staining with CFDA and PI; subpopulation CFDA−/PI− includes cells with intact membrane and no enzymatic activity; subpopulation CFDA+/PI− includes cells with intact membrane and enzymatic activity, and subpopulation CFDA+/PI+ comprises cells with permeabilised membrane and enzymatic activity.
Processes 09 02005 g005
Figure 6. TFA content throughout C. cohnii batch cultivation in a bench bioreactor. Error bars represent ± standard deviation from two technical replicates of measurement.
Processes 09 02005 g006
Figure 7. Difference in the inputs of the reference and alternative system.
Processes 09 02005 g007
Figure 8. Biodiesel production according to FAO OECD-FAO Agricultural Outlook 2011–2020, crude glycerol estimation based on 10% (w/w) and prices on global markets according to literature [24,25,26].
Processes 09 02005 g008
Table 1. Biodiesel industry derived glycerol characterization.
Water Content
(% w/w)
Glycerol
Content
(% w/w)
Ash
Content
(% w/w)
Methanol
Content
(% w/w)
Matter Organic
Non-Glycerol
(% w/w)
Sodium
(% w/w)
Potassium
(mg/kg)
9.9083.86.540.007n.d.1.658.35
n.d.—not detected.
Table 2. C. cohnii fatty acid methyl esters (FAME) profile obtained at three different times of cultivation, using CSL and crude glycerol (7 = 97.33 h, t = 123.50 h, t = 148.67 h). Results are shown as mean ± standard deviation (n = 2). SFA: saturated fatty acids fraction in TFA; MUFA: monounsaturated fatty acids fraction in TFA; PUFA: polyunsaturated fatty acids fraction in TFA. n.d.—not detected. Error bars represent ± standard deviation from two technical replicates of measurement.
Cultivation Time (h)
FAME
(% w/w TFA)
t = 97.33t = 123.50t = 148.67
10:01.10 ± 0.021.28 ± 0.021.03 ± 0.08
12:08.42 ± 0.188.83 ± 0.008.03 ± 0.08
14:020.18 ± 0.5319.95 ± 0.0719.44 ± 0.39
16:017.76 ± 0.4516.71 ± 0.0016.36 ± 0.54
16:1ω92.84 ± 0.103.01 ± 0.022.97 ± 0.01
18:00.65 ± 0.000.51 ± 0.000.47 ± 0.02
18:1ω910.85 ± 0.2810.67 ± 0.1410.90 ± 0.08
18:2ω6n.d.0.06 ± 0.0300.04 ± 0.00
22:5ω30.46 ± 0.090.56 ± 0.020.64 ± 0.00
22:6ω3 (DHA)37.78 ± 1.4839.58 ± 1.4140.09 ± 0.68
SFA48.1147.2845.33
MUFA13.6913,6813.87
PUFA38.2440.2040.77
Table 3. Carbon and nitrogen maximum and minimum prices.
Item/PriceMin USD/tonMax USD/ton
Yeast extract10007286
Glucose1001200
Glycerol100500
CSL1.5200
Table 4. Minimum reference and maximum alternative prices, and maximum reference and minimum alternative prices for the substrates considered in the reference and alternative systems.
Reference
(USD/L
Bioreactor)
Alternative
(USD/L
Bioreactor)
Absolute Savings (USD/L
Bioreactor)
Relative Savings (%)
Minimum 0.0040.01−0.01−242
Maximum 0.0390.0060.03284
Publisher’s Note: MDPI stays neutral with regard to jurisdictional claims in published maps and institutional affiliations.

