The microscopic study was based on cross-sections of the reacted samples including the graphite substrate. A metal phase was not systematically unveiled, as the slag frequently covers or englobes the metal and hides it before the cut. Cut views of reacted samples are provided, sometimes together with close-up views of the interface. It should be noted that the samples from the same charge materials mostly shared a similar aspect. They followed the same trends in terms of reduction behavior, wetting, and reaction interface. In addition, while there was a clear contrast after reduction between the samples from different charges, it seemed that temperature had a lesser role in the mechanism. In the following pictures and for clarity the main elements were delimited using the following colored lines: green for the slag, red for the graphite, and blue for the metal.
3.2.1. Asm and A/HCS Charges
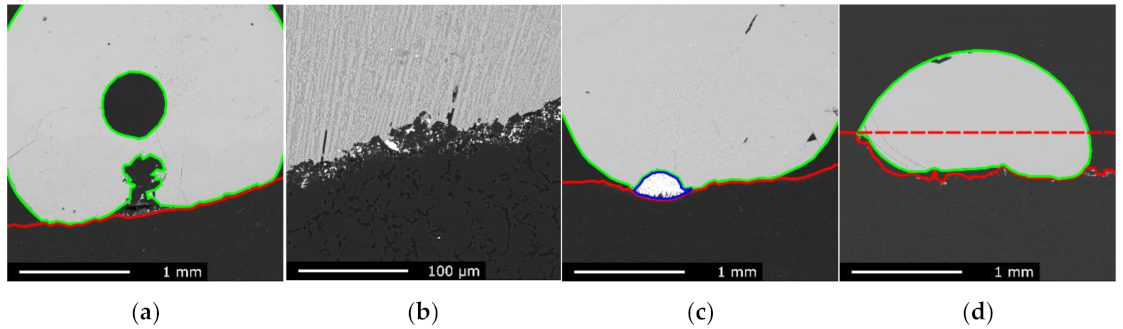
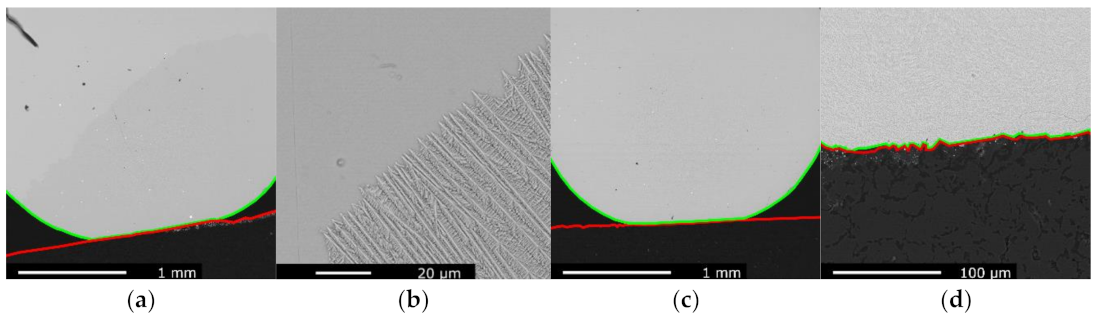
Figure 7a,b respectively show the cut view of an Asm slag droplet and a close-up view of the slag/graphite interface after reaction at 1540 °C for 15 min. A large gas bubble is seen at the center of the slag droplet on
Figure 7a, with a second one visibly forming from the center of the slag/graphite interface. Along the whole slag/graphite interface many micron-sized metal particles were found. These particles penetrate into the graphite but only in a thin porous layer as shown on
Figure 7b. The picture in
Figure 7b also shows that two phases were visible: the slag has, under cooling, precipitated in a eutectic fashion. These two phases were only observed after cooling, as the droplet was expected to be fully molten from the start to the end of the reduction. The graphite substrate was also significantly affected by the reaction. Although it did not seem to be altered deep from the interface, the slag/graphite contact area itself moved during the reaction due to the consumption of carbon. The initial flat surface was thus replaced by a bumpy front.
Samples reacted longer and at higher temperatures showed similarities but also some additional features.
Figure 7c shows the slag droplet of the Asm charge after reaction at 1610 °C for 15 min. The main difference observed was the presence of sizeable metal droplet found between the slag and the graphite substrate. This metal droplet was not necessarily a mark of a substantially stronger reduction: the metal phase was sometimes hidden or mostly containing iron obtained during pre-reduction. However, this metal droplet sits in a distinctly deeper hollow of the graphite substrate which could be explained by graphite being consumed through dissolution in the metal phase and consumption by carbothermic reduction at the slag/metal contact area. In other words, carbon could be reacting faster by going through the metal than directly acting on the slag.
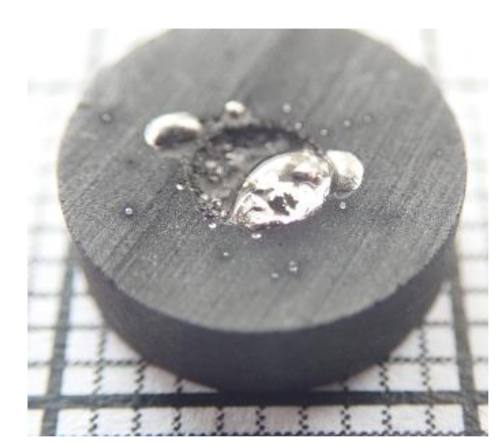
Figure 7d shows the slag droplet of the Asm charge after reaction at 1660 °C for 40 min. This sample witnessed stronger reducing conditions for a longer time, and although it did not appear on the micrograph, two large metal phases were observed aside this sample and can be seen in
Figure 8. The graphite substrate was also considerably consumed. The red, dashed line in
Figure 7d shows the approximate position of the initial substrate’s surface, approximately 500 µm away from its final position. The slag also exhibited an increased wetting, compared to the previous samples; this was attributed to changes in the slag chemical composition during its reduction. Gas pockets could be found between the slag and the substrate.
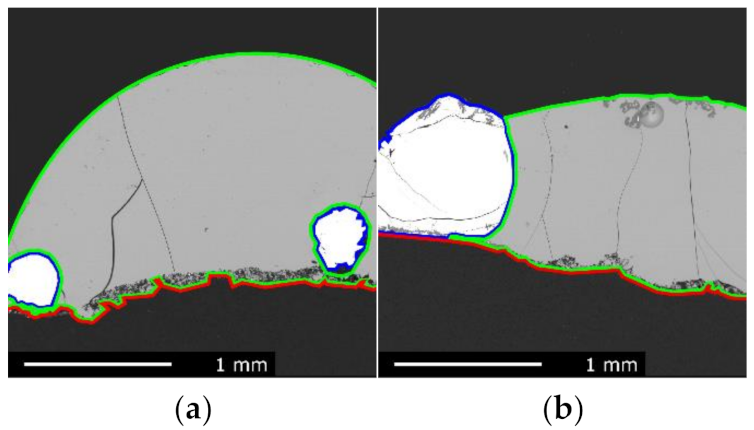
Figure 9a,b show the slag droplet of the A/HCS charge after reaction at 1540 °C for 30 min and 1610 °C for 10 min, respectively. These pictures tell a similar story to what was observed for the Asm sample: good wetting of the sample, significant consumption of the graphite, and mild penetration in the substrate.
3.2.2. Com, Com + S, and Com + 2S Charges
Figure 10a shows the slag droplet of the Com charge after reaction at 1610 °C for 30 min. The Com charge was characterized by a poor wetting over the graphite substrate at all stages of the reduction experiment, and the slag droplet was therefore nearly spherical. In addition, the substrate was left mostly unaffected, and although some metal particles were observed within a thin layer, the graphite was not consumed and remained even. From
Figure 10a, one can consider that the droplet was initially placed towards the right-hand side, where some metallic prills were found but later moved to the left. The other micrographs gave a similar impression: little reaction happened between slag and graphite, and no substantial metal phase was found. Note that the droplet presented in
Figure 10a seems to consist of two distinct domains, noticeable by their shade of grey. In fact, a higher magnification picture in
Figure 10b reveals that this change of grey shade corresponded to the transition between dendrite growing from the bottom of the sample and glassy slag on the top. The WDS analyses did not evidence a composition difference between those two domains.
When sulfur was added to the Com charge, in Com + S and Com + 2S, no significant differences could be observed. The slag droplet of the Com + S charge after reaction at 1610 °C for 10 min and a closer view of its slag/graphite interface are given in
Figure 10c,d, respectively. Two phases can be noticed in
Figure 10d, those were formed during solidification alike what was observed in
Figure 7b. The addition of sulfur did not affect the wetting as both the Com + S and Com + 2S charges were non-wetting. It also did not enhance reduction processes at the slag/graphite interface; the graphite was not consumed, and only limited amounts of micron-sized metallic particles were found. Note that neither the Com + S nor Com + 2S samples reacted at 1610 °C for 30 min were used to compare with
Figure 10a, as both sample droplets rolled from the substrate due to the fact of their non-wetting behavior.
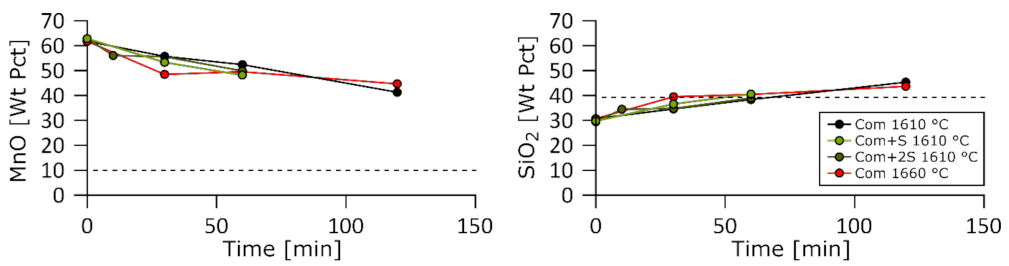
The chemical analysis previously indicated a reduction in MnO and SiO
2. However, the absence of a metallic phase as well as the intact graphite substrate surface indicate the manganese was likely reduced by CO(g) and vaporized. This conclusion was motivated by the high vapor pressure of manganese. Silicon evaporation, however, is thermodynamically less likely but silicon might have been extracted as SiO(g). Again, since the graphite remained unaffected, this would rely on SiO
2 being reduced by the reaction in Equation (7) happening on the free surface of the slag at temperatures around 1600 °C. This was ruled as being thermodynamically unlikely by Berg and Olsen who considered this mechanism in a similar context [
12].
3.2.3. Entrapped Gas and Foaming
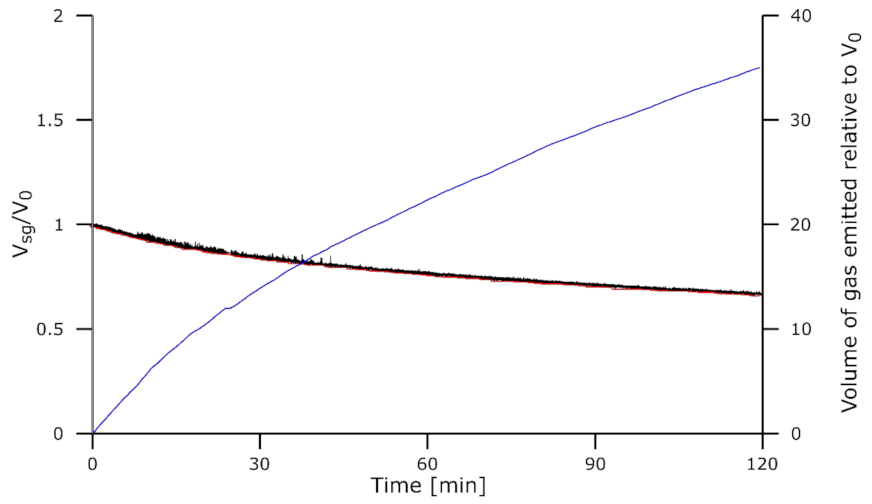
The amount of gas entrapped within the slag was calculated using Equations (3)–(6).
Figure 11 show V
sg/V
0, the calculated volume of slag and gas divided by the initial volume as well as V
s/V
0, the estimated volume of gas-free slag divided by the initial volume. On a second axis, the volume increases in the droplet were summed to render the progress of the chemical reactions generating CO gas within the slag. This last curve cannot be used for quantitative evaluation of the reaction but can indicate a change in mechanism, for example, when displaying a break in its slope. The graphs corresponding to the remaining samples of this study are found in
Supplementary Materials Figures S1–S22 (refer to the electronic
supplementary material). From all these curves, foaming can also be evidenced. Extensive and stable accumulation of gas was detected when the droplet volume V
sg was continuously higher than the estimated slag volume, even when some gas was liberated. This indicates that the gas bubbles were generated faster than they were liberated, creating a build-up. In this section, a few experiments were chosen to show the general trends of the various charges, while the other curves obtained are made available in the
Supplementary Materials.
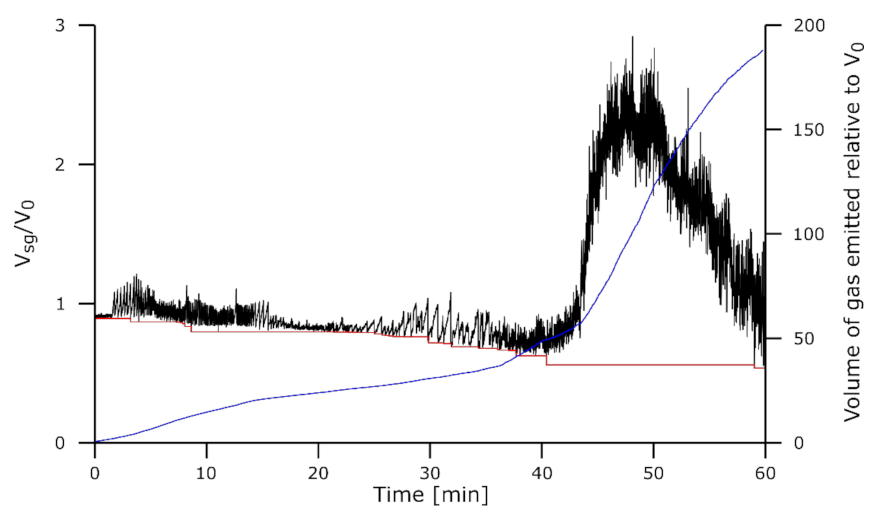
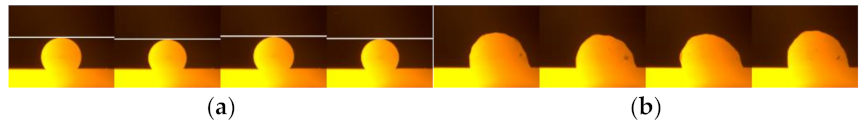
Figure 11 shows the results for the Assmang charge reduced for 60 min at 1610 °C, while the aspect of the droplets is shown in
Figure 12. At the start of the reduction with this sample, single gas bubbles were formed as illustrated on
Figure 12a. Upon their escape, all the gas was released into the atmosphere in one step. This can be seen from the shape of the curve of V
sg/V
0, where decreasing, V
sg/V
0 tended to reach a new minimum and there was thus less material and likely little to no gas in the droplet. After extensive reduction, some experiments entered in a new regime where foaming was observed; despite a continuous flickering in the droplet volume due to the regular escape of some gas, the moving average volume greatly increased, reached a peak, and then slowly decreased. In
Figure 12b, the inflated slag can be observed at this stage. Note that the gas-free slag volume was calculated from the emerged part of the droplet. However, as seen on the micrographs in
Figure 7, the underlying graphite layer was vastly consumed by the reaction.
The foaming seems to be accompanied by a change in the reduction rate as observed on the blue curve. This resembles what was observed in a similar experiment in a previous work [
4]. It seems that the rate change preceded the foaming and could be one of its causes.
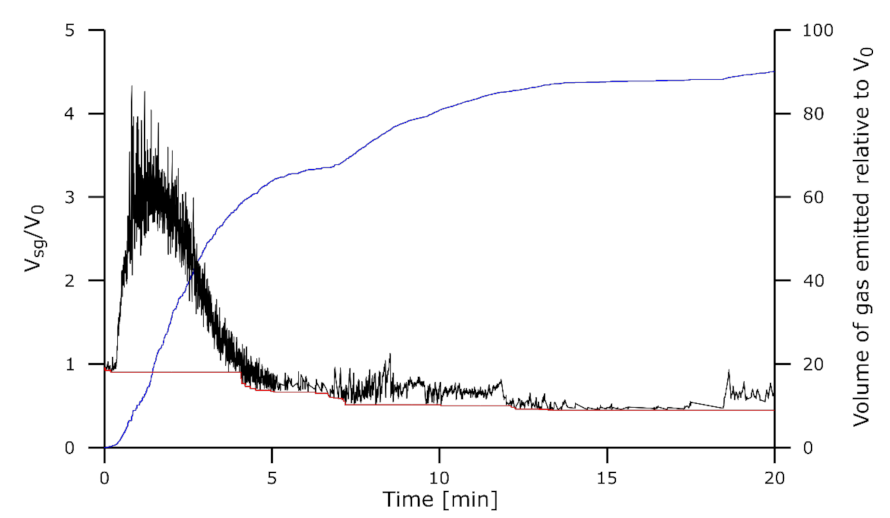
The A/HCS charge reduced 20 min at 1610 °C and shown on
Figure 13 also exhibited foaming but right after the start of the isothermal stage. Under these conditions, the reactions generating CO within the slag did not need additional time or reduction to start. A rapid increase in the droplet volume can be observed before the foaming dissipates after only a couple of minutes. This is once again consistent with observations in tube furnace experiments [
4].
The Comilog charge, however, did not exhibit the same behavior. No gas was released from the slag as observed in
Figure 14 for the Com charge reduced 120 min at 1610 °C. The volume measured did not change enough to be related to gas accumulation; the fast variations in the measured droplet size could be caused by the software itself. The volume change being very limited, its summation was also irrelevant.
In essence, all Com, Com + S, and Com + 2S samples showed no gas accumulation/release from the slag at all temperatures and for all durations. However, the slag droplets did appear to shrink over time, which could be related to the loss of manganese through evaporation previously reported by WDS.
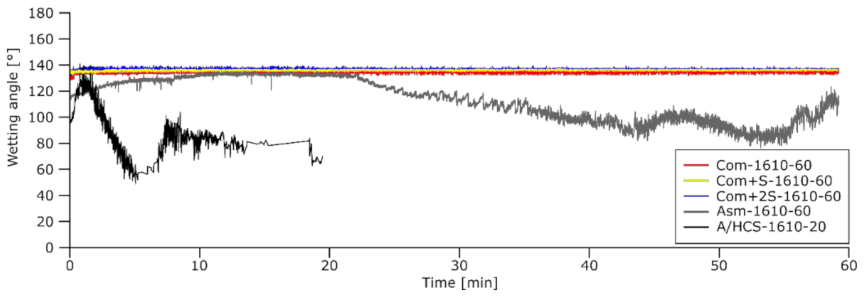
3.2.4. Wetting
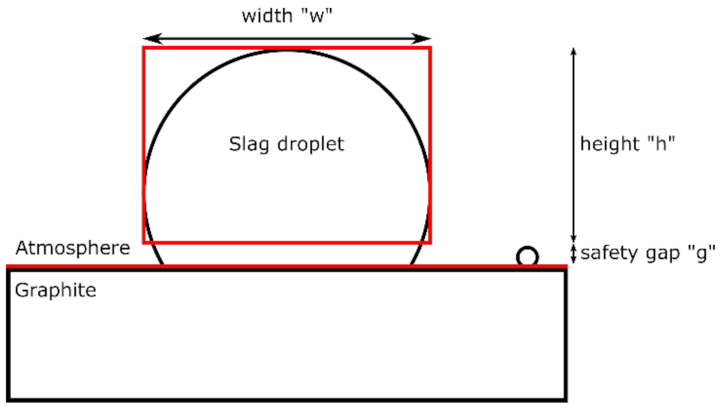
The wetting angle θ was calculated based on the droplet dimensions, assuming a perfectly spherical shape, using Equation (8). The errors due to the consumption of graphite were neglected in these calculations. Some values were not registered due to the failed analysis of the picture from the software.
Figure 15 shows the wetting angle calculated for the 5 charges reacted at 1610 °C. For Com, Com + S, and Com + 2S, the wetting angle was nearly constant at 134, 136, and 137°, respectively, (on average from 5 to 60 min) showing that the addition of sulfur or the manganese evaporation did not affect the wetting. The Asm and A/HCS samples, which reacted significantly with the substrate, also showed changes in their wetting angle throughout the reaction. For the rapidly reacting A/HCS-1610-20 sample, the wetting angle changed correspondingly and dropped significantly early in the reaction. The Asm sample showed various phases over the course of the experiment. The wetting angle first increased to a stable value of 133° (on average from 10 to 20 min); the slag was not wetting the substrate. The angle strongly decreased after 20 min, upon further progress of the reaction.
These results show that the poor wetting of the Com, Com + S, and Com + 2S samples do not explain the lower extent of the reduction observed compared to the results of the tube furnace experiments. The Asm and Com samples had similar wetting angles between 10 and 20 min and, thus, similar slag/graphite interface areas. If the reaction was happening at this slag/graphite interface, consumption of the substrate would have been observed for the Com samples.
3.2.5. Further Discussion
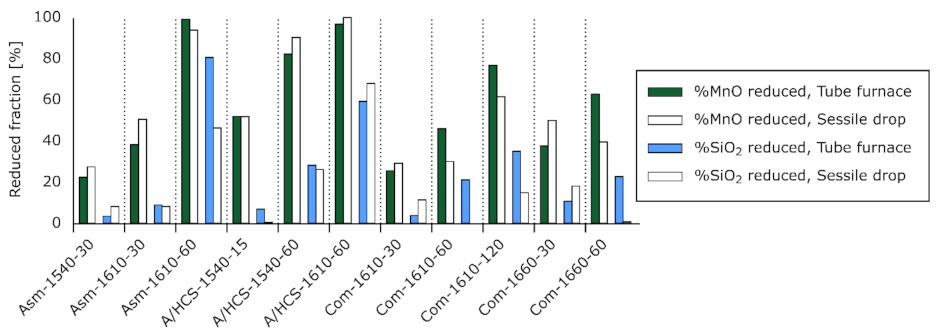
The results obtained in this work were two-fold: they evidence a contrast between the various slags but also show the disagreements between the techniques. The sessile drop technique tended to agree to what was obtained in a tube furnace for some samples (mostly the Asm and A/HCS charges) but disagreed for the Com charge.
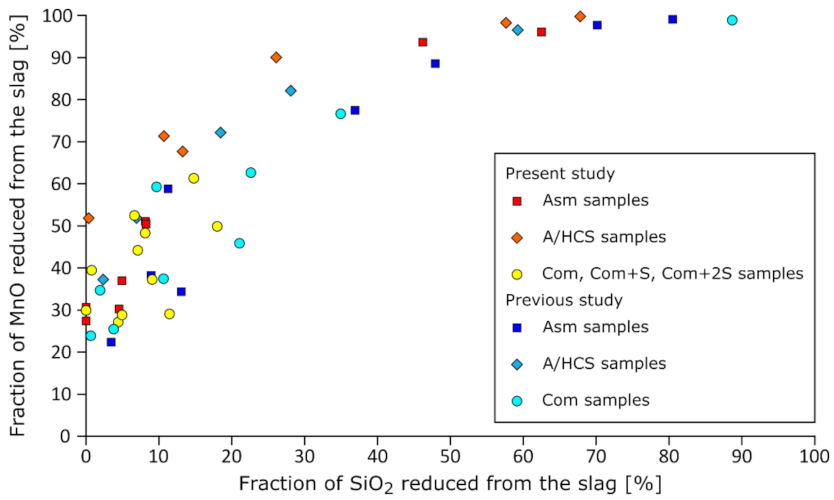
Figure 16 shows the fractions of reduced MnO and SiO
2 for similar experiments run in a tube furnace and sessile drop furnace. For the Asm and A/HCS charges, the results were very close, excepted for the SiO
2 reduction in Asm-1610-60. In comparison, the results for the Com charge were consistently discordant. This affected both MnO and SiO
2 reduction estimates.
This indicates that there was a fundamental difference between the experiments in graphite crucible and on graphite substrate. Firstly, in the graphite crucible, additional polish coke was used therefore modifying the nature of the reductant. Secondly, the experiments differed due to the presence of iron-rich metallic phases formed during the pre-reduction of the charge in the graphite crucibles. Those are believed to have a significant role in the reduction through the thermodynamic conditions and the reaction mechanism. The first point is discussed by Coetsee [
13], who studied the reduction in MnO by CO(g) at temperatures as low as 1200 °C. The presence of metallic iron reduces the activity of manganese, thereby promoting MnO reduction dramatically. Concerning the effect of metallic droplets on the reaction mechanism, Safarian et al. considered that the reduction in MnO by a metallothermic reaction involving Fe is a possible process in FeMn production [
5]. Iron-rich droplets, placed in contact with both the slag and the carbon source, are thought to act as a rapid pathway to dissolve carbon while iron is believed to reduce MnO. In the present study, those iron-rich metallic particles were mostly absent. The slag charges were melted and pre-reduced beforehand to avoid that the gases emitted during pre-reduction inhibit our capacity to track the reduction processes. After formation of the slag charges, small pieces of the slag were selected; at this stage, the visible metal droplets were avoided. This was necessary to observe slag/graphite reactions without large amounts of metal present but might have inhibited the initiation of the reaction by removing the usually present metallic droplets. This could further explain the larger variability in the present study; unseen metallic droplets remaining in small samples might have a large effect. In their study on the reduction of siliceous manganese ores by graphite, Ostrovski and Webb showed that diffusion of MnO is a rate limiting process, even in molten phases [
14]. But in the present case, at high temperatures, it did not seem that diffusion can explain the contrast between the techniques; the samples reacted in the sessile drop setup were very limited in size, a few mm
3, compared to the cm
3 size of the slag in the tube furnace. Diffusion, albeit a potentially important factor, is expected to favor a quicker reduction in the samples in the sessile drop furnace contra those in the tube furnace. This is not what was generally observed.
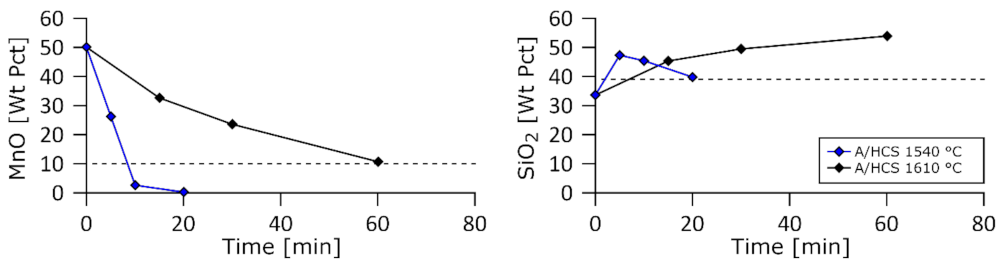
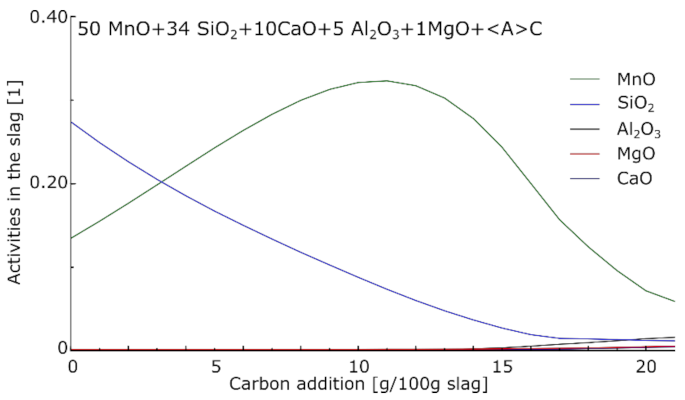
The previous and present works both showed that for all charges, a similar reduction route was observed. MnO tended to reduce first, while most of the SiO
2 reduced afterwards. This can be partly explained by looking at the evolution of the activities in the slag at equilibrium for increasing amounts of carbon in the system.
Figure 17 shows such activities for a starting arbitrary slag of 50MnO–34SiO
2–10CaO–5Al
2O
3–1MgO and increasing carbon additions at 1650 °C. The calculations were performed using FactSage 8.0 [
15] with the FactPS, FToxid (for the slag), and FSstel (for the metal) databases.
During the reduction processes, the activity of MnO started at its maximum value, decreasing during the production of metallic Mn. The activity of SiO
2 first increased due to the decreasing amounts of MnO in the slag; SiO
2 reduction became dominating at a later stage, resulting in the decrease of SiO
2 activity later on. The kinetics of the reaction themselves also had a role, and deviation from the equilibrium was observed by Canaguier et al. [
4].
A two-stage reduction, observed in the first study, could be found in some of the charges reduced in the sessile drop setup. The Asm charge was one of those; its reduction was slow and steady at first but accelerated the second time. The increased CO generation caused the foaming of the slag. The A/HCS charge had peculiar behavior. At low temperatures, no foaming was observed despite an active reaction. But at high temperatures, the reduction behavior resembled that of the Asm charge at its second stage; a high reaction rate and foaming were found. For the Com charge, the results of the previous and present work were contrasting; the two-stage reaction observed in the tube furnace was not obtained in the sessile drop. This could be attributed to a better reaction with coke than with graphite but not to the sulfur present in the coke; slags with additional sulfur failed to enhance the reaction.
The fact that the most reduced sample from both studies was obtained using the Com charge, despite it being very acidic, shows the potential of the Comilog ore. However, it also reinforced the contrast between the behavior in the two setups used.
Overall, these results call for further experiments using Comilog ore and various carbon types to better understand why graphite and coke gave so different results. Additional work using Comilog ore together with HC FeMn slag or doped with CaO, with a similar basicity to the Asm and A/HCS charges, could also be beneficial to compare the ores in an industrial configuration.


