Article

mAb Production Modeling and Design Space Evaluation Including Glycosylation Process

1
Department of Chemical and Biochemical Engineering, Rutgers—The State University of New Jersey, Piscataway, NJ 08854-8058, USA
2
Department of Chemical and Biomolecular Engineering, University of Delaware, Newark, DE 19716-3196, USA
*
Author to whom correspondence should be addressed.
Processes 2021, 9(2), 324; https://doi.org/10.3390/pr9020324
Submission received: 3 January 2021 / Revised: 5 February 2021 / Accepted: 6 February 2021 / Published: 9 February 2021
(This article belongs to the Special Issue Advanced Chemical Reaction Kinetics of Pharmaceutical Processes)

Abstract

:
Due to high demand, monoclonal antibodies (mAbs) production needs to be efficient, as well as maintaining a high product quality. Quality by design (QbD) via predictive process modeling greatly facilitates process understanding and can be used to adjust process parameters to further improve the unit operations. In this work, mechanistic and dynamic kriging models are developed to capture the protein productivity and glycan fractions under different temperatures and pH levels. The design of experiments is used to generate input and output data for model training. The dynamic kriging model shows good performance in capturing the dynamic profiles of cell cultures and glycosylation using only limited input data. The developed model is further used for feasibility analysis, and successfully identifies the operating design space, maintaining high productivity and guaranteed product quality.

Graphical Abstract

1. Introduction

Monoclonal antibodies (mAbs) are the most popular biological products used for the treatment of cancers and micro-bio diseases. On 21 November 2020, the U.S. Food and Drug Administration (FDA) authorized mAbs for the treatment of COVID-19 [1]. These proteins are generally produced from Chinese hamster ovary (CHO) cells in bioreactors. Researchers have been investigating ways to increase the protein production by adjusting operating conditions and culture media formulation to meet the high drug demands. In the meantime, product qualities such as antibody-dependent cellular cytotoxicity (ADCC) and complement-dependent cellular cytotoxicity (CDC) are also critical to maintain. It was found that the presence of a terminal galactose of the Fc region during the N-linked glycosylation process increases the intensity of the CDC response. The reduction of fucosylation would improve the effect of ADCC activities [2]. More than 70% of the approved mAbs belong to the IgG1 isotype [3], and N-linked glycosylation is a critical step in formulating the final IgG product. Glycan fractions representing the levels of afucosylation, galactosylation, high mannose, and sialylation are product quality attributes that greatly affect protein folding and binding, and further control product safety, efficacy, and potency [3,4,5,6].
In general, protein glycosylation is a post-translational processing step that starts from the endoplasmic reticulum, where oligosaccharide sugars are formed. The major glycosylation reactions, where sugar covalently binds to the polypeptide backbone of a protein, happen in the lumina of the cis-, medial- or trans-Golgi cisternae [5]. In the bioreactor culture system, the glycosylation process can be affected by both chemical and physical stimuli for the same cell line [3,7,8]. These stimuli can change the cell metabolism, such as the glycolytic pathway, purine/pyrimidine metabolism or the TCA cycle, which influence the synthesis and function of nucleotide donors, glycosyltransferases and glycosidase, and further affect the biocatalytic reactions of glycosylation [9]. The limitation of glucose, glutamine [10], galactose [11], manganese [12,13], uridine, ManNAc and sialic acid [3] in culture media and feed additions results in a reduction in protein productivity, glycosylation site occupancy, UDP-Gal, UDP-GlcNAc and Neu5Ac synthesis. It should be mentioned that different cell lines perform differently under the same conditions, leading to different glycan fractions compositions. To maintain product quality, understanding and controlling the operating parameters of the glycosylation process is critical.
Quality by design (QbD), proposed by the FDA, defines and ensures the product’s quality through the manufacturing process. Kinetic modeling has been widely used to capture the relations between the operating conditions and the dynamic profile of glycan fractions. In terms of feeding strategies, Radhakrishnan et al. [13] used a kinetic model to quantify the change in glycan fractions under the dynamic addition of media supplements (including MnCl2 and EDTA). Kotidis et al. [14] investigated the effects of glycosylation precursor feeding, including galactose and uridine, on cell growth, protein productivity and quality. The authors also applied dynamic optimization to maximize the concentration of galactosylated mAb fractions. Luo et al. [15] modified the kinetic model by adding a delta function to capture the amino acid and copper effect on the monoclonal antibody productivity and glycosylation. As for process parameters, Villiger et al. [16] captured pH, manganese, and ammonia concentration, and predicted their effect on cell culture and glycosylation process. Sou et al. [17] successfully used their kinetic model to simulate cell culture, nucleotide, nucleotide sugar metabolic, and N-linked glycosylation under two different temperatures. These examples show that kinetic models can be used to assist the media selection and optimize feeding strategies. However, the kinetic models usually contain a large number of kinetic pathways, which can be a challenge in parameter estimation. Many of the above models simulate the process under different conditions separately, for example, to capture the effects of temperature. In addition, the mechanistic model is usually computationally expensive, which can be prohibitive for the evaluation of design space.
To deal with this challenge, statistical analysis tools have been used to capture the influence of multiple independent factors on the system outputs, while reducing the computational cost. Thus, they have been used in media formulation and building process–product correlations to characterize the biological system [18]. Sokolov et al. [19] used sequential multivariate tools with partial least squares regression (PLSR) to predict titer, aggregation, low molecular weight components, and glycan groups in the product under different process scales. They illustrate the capability of multivariate analysis in scale-up and decision-making for biopharmaceutical manufacturing. Zurcher et al. [20] also used PLSR to capture protein glycosylation profiles using process variables and extracellular variables (127 variables). The authors compared the performances achieved using just process variables to that achieved with the addition of extracellular variables, and showed that using only the process variables leads to higher error in predicting afucosyaltion, fucosylation, and galactosylation.
In this paper, we incorporated temperature and pH factors into the mechanistic kinetic model, and captured the dynamic change in the viable cell density, glucose concentration, mAb concentration, as well as the glycan fractions. Further, we applied dynamic kriging to capture the dynamic trend of these outputs under different operating conditions. It is found that dynamic kriging is able to capture the dynamic behavior of output variabilities following a change in process operating parameters with high accuracy. Furthermore, a surrogate-based adaptive sampling approach has been used to determine the feasible operating region (design space) for protein production and glycosylation processes based on the requirement of commercial product quality attributes.

2. Methods

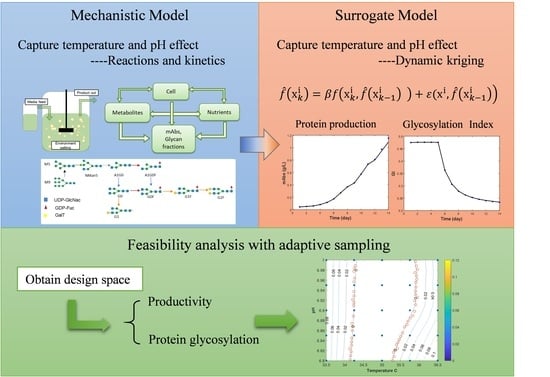
2.1. Kinetic Model Building

The process model includes the integration of an unstructured cell culture dynamics model with a structured intracellular glycosylation model using the model developed by Val et al. [21]. In order to consider the effects of temperature and pH on the kinetic model, it is critical to understand the mechanisms behind them. It has been found that reducing the temperature would reduce GnTII, GalTI, GalTIII and FucT expression levels, leading to a reduction in the intracellular NSD concentration, the mAb productivity, and the mature glycoforms in the final product [22]. Thus, the model is developed based on adding linear regression terms to capture the temperature effect on cell growth kinetics and intracellular enzyme expression. Controlling pH would affect the osmolality and impact the cell metabolism. pH shift also usually affects protein productivity [16]. Thus, pH is only linked to the rate relative to the protein production. The modified kinetic model is based on Val et al.’s work [21]. For brevity in presentation, the entire model is shown in the Supplementary Material, and this section concentrates on the modifications.
The growth rate μ is represented by Equation (1):
μ = ( μ m a x T + a ) ( C G l c K G l c + C G l c [ X v ] α x )
where μ m a x is the maximum growth rate, T is temperature, α x is the cellular carrying capacity, K G l c is the Monod constant for glucose, and a is the regression constant.
Equation (2) represents the death rate μ d :
μ d = ( μ d m a x T + b ) ( K d μ T + c ) ( K d μ T + c ) + μ
where μ d m a x is the maximum death rate, K d μ is the inverse specific death rate, and b and c are the regression constants.
Equation (3) shows the glucose consumption rate q Glc :
q Glc = 1 ( Y X G l c T + d ) [ C G l c ] [ C G l c ] + K G l c
where Y X G l c is the yield coefficient of glucose, C G l c is the glucose concentration, and d is the regression constant.
The mAb production rate can be represented by Equation (4):
q m A b = ( Y m A b G l c T + e ) q G l c exp [ 1 2 ( p H s h i f t p H o p t w ) 2 ]
where Y m A b / G l c is the yield coefficient of mAb production from glucose consumption. e is the regression constant. p H o p t is the optimal culture pH, w is the pH-dependent mAb productivity constant, and p H s h i f t is the pH control during cell culturing.
In terms of the glycosylation process, the Golgi apparatus is used as the plug flow reactor (PFR), wherein, along the axial direction, different distributions of enzymes exist. Enzyme concentration is also linearly correlated to temperature. The mass balance is shown in Equation (5). It assumes that there is no axial dispersion within the compartment through the PFR, and protein transfer maintains a linear velocity. The Golgi diameters are constant, and no mass transfer limitation affects the glycosylation reactions.
[ G m ] t = V 1 [ G m ] z + n E n z y m e v m , n r n
where [ G m ] represents glycan (m) concentration, V 1 represents the linear velocity of glycans through the Golgi apparatus, z is the length of Golgi, r n is the kinetic rate for enzyme reaction n, and v m , n is the reaction coefficient of glycan m that is catalyzed by enzyme n.
It should be mentioned that q p can be obtained from the cell culture model and used as an input condition to calculate the linear velocity of the protein transferred in the Golgi apparatus, as shown in the Equation (6):
( V 1 ) ( Vol Golgi ) [ M a n 9 ] z = 0 = q p M W m A b ( 2 u m o l G l y c u m o l m A b )
where Vol Golgi = 25   μ m 3 is the volume of the Golgi apparatus [21,23], [ M a n 9 ] z = 0 = 55   μ m o l L G o l g i represents the Man9 concentration at the entrance of the Golgi apparatus. M W m A b is the average molecular weight, which is 150 kDa. The reactions with the product and substrate-related inhibitions can be simulated by Michaelis–Menten kinetics, sequential-order Bi–Bi kinetics, and random-order Bi–Bi kinetics [23]. The mechanistic model is built in MATLAB R2018b. The systems of the ordinary differential equation are solved in MATLAB (ODE45), and the partial differential equations from the intracellular structured model are first discretized along the axial using finite difference methods, and solved by ODE solvers in MATLAB.

2.2. Design of Experiment

A design of experiment (DoE) based on a two-level full factorial design with varying temperature and pH has been used to obtain data from the kinetic model, to be used as a training set for kriging model building. By adding the center point, 5 runs can be performed. Viable cell, glucose, and mAbs concentrations are obtained from the model. Glycan fractions, including Man5, G0, G1, G2. G1F, G2F and G2FS1, are predicted. This assumes that the CHO cells are cultured under 37 °C and pH = 7. After day 5, the temperature and pH shift according to the DoE, since mild hypothermia has a positive effect on mAb productivity and a down-shifting pH would increase the level of galactosylation and fucoyslation. The temperature and pH ranges are set as 33.5 °C to 36.5 °C and 6.8 to 7, respectively. The initial culture volume is 50 mL, and it is cultured under fed-batch mode. To maintain the nutrient concentration, the glucose concentration is adjusted to 33 mM on day 5, 50 mM on day 8 and 40 mM on day 11 in the culture. The whole culture lasts for 14 days. The above settings are used as inputs for our kinetic model simulation, wherein the operating procedures and designs are based on the cited papers [21,24]. The aim of this DoE is to generate data for the surrogate model’s training and validation.

2.3. Kriging and Dynamic Kriging Model Building

Kriging or gaussian modeling is an interpolation method that uses the sum of the spatial weighted distance of the observed function values at nearby sample points to predict new points [25,26]. It also provides the mean squared error for the prediction [27]. Equation (7) shows the general equation of the kriging model required to predict f ^ ( x i ) .
f ^ ( x i ) = β f ( x i ) + ε ( x i )
The first part of the equation represents a known regression model that defines the global trend of the data f ( x i ) , and β is the unknown parameter. In this work, constant and linear regression models are tested and the one that gives the least mean squared error is selected. The second part is a residual term, ε ( x i ) , which indicates the error at location x i , which is usually normally distributed with zero mean and variance σ 2 . The covariance function between ε ( x i ) and ε ( x j ) is shown in Equation (8).
Cov ( ε ( x i ) ,   ε ( x j ) = σ 2 R ( x i ,   x j )
where R is the correlation function and exponential, linear and squared exponential models are commonly used in kriging surrogates [28], shown in Equations (9)–(11).
R ( θ , x i , x j ) = exp ( h = 1 d θ h | x h i x h j | θ d + 1 ) 0 < θ d + 1 < 2
R ( θ , x i , x j ) = exp ( h = 1 d θ h | x h i x h j | 2 )
R ( θ , x i , x j ) = max ( 0 , 1 h = 1 d θ h | x h i x h j | )
θ h is an unknown parameter. The parameters θ h , β and σ 2 can be predicted by using maximum likelihood. The detailed derivation of kriging can be found in the papers by Bhosekar and Ierapetritou [28]. In this work, the kriging models are built using the DACE toolbox [29], and different correlation functions are tested and selected for model training.
Dynamic kriging is a modification of the kriging model, as shown in Equation (12):
f ^ ( x k i ) = β f ( x k i , f ^ ( x k 1 i ) ) + ε ( x i , f ^ ( x k 1 i ) )
The dynamic system is first discretized into different time points, k, and the kriging model is used as an autoregressive model that collects the predicted results f ^ ( x k 1 i ) from the previous time point (k−1), and combines these with the state variables or control input x k i to estimate the future time point f ^ ( x k i )   [30]. This means that the kriging algorithm is iteratively called and the database that is used for prediction is dynamically updated. The method maximizes the amount of information available for the dynamic response of the prediction [24].

2.4. Feasibility Analysis with Adaptive Sampling

To find the feasible region of bioreactor operation, the process operations need to satisfy the productivity (product titer) and product quality (different glycan fractions) constraints, as shown in Equation (13):
g i ( x ) 0         j J
where g i ( x ) represents different constraints as mentioned above, and x includes the uncertain variables, including temperature, pH and operating parameters, such as the total operating time, initial conditions of cell density, glucose and mAb concentrations. In this study, we assume that the design parameters and control parameters are constant. To satisfy all the constraints, the feasibility function is defined in Equation (14). If φ < 0 , x represents the feasible region. When φ = 0 , the defined condition is right at the boundary of the feasible region.
φ ( x ) = max j J g i ( x )
Initial sample points can be generated by space filing, and a feasible region can be obtained by calculating the feasibility function. To further simplify the model, kriging is used to determine the feasible region. An adaptive sampling method is used to improve the accuracy of the feasible boundary. By maximizing the modified EI function, shown in Equation (15), the new sample points close to the feasible region and unexplored region are generated to update the kriging model.
E I f e a s ( x ) = s ^ ( x ) ϕ ( y ^ ( x ) s ^ ( x ) ) = s ^ ( x ) 1 2 π e 0.5 ( y ^ ( x ) 2 s ^ ( x ) 2 )
The standard error s ^ ( x ) can be obtained from kriging prediction at location x, and y ^ ( x ) is the predicted value. A detailed explanation of the modified EI function can be found in paper [31]. To test the performance of the feasibility analysis, CF%, CIF% and NC% values are calculated and represented in Equations (16)–(18):
C F % = C F C F + I C I F × 100
C I F % = C I F C I F + I C F × 100
N C % = I C F C F + I C F × 100
CF% represents the percentage of the feasible region that is successfully explored. CIF% represents the percentage of the unfeasible region that is successfully explored. NC% represents the percentage of the feasible region that is overestimated. CF is a feasible region that is correctly defined by the kriging model. CIF is an unfeasible region that is correctly defined by the kriging model. ICF is an unfeasible region but is defined as a feasible region by the kriging model. ICIF is a feasible region but is defined as an unfeasible region by the kriging model.

3. Results and Discussion

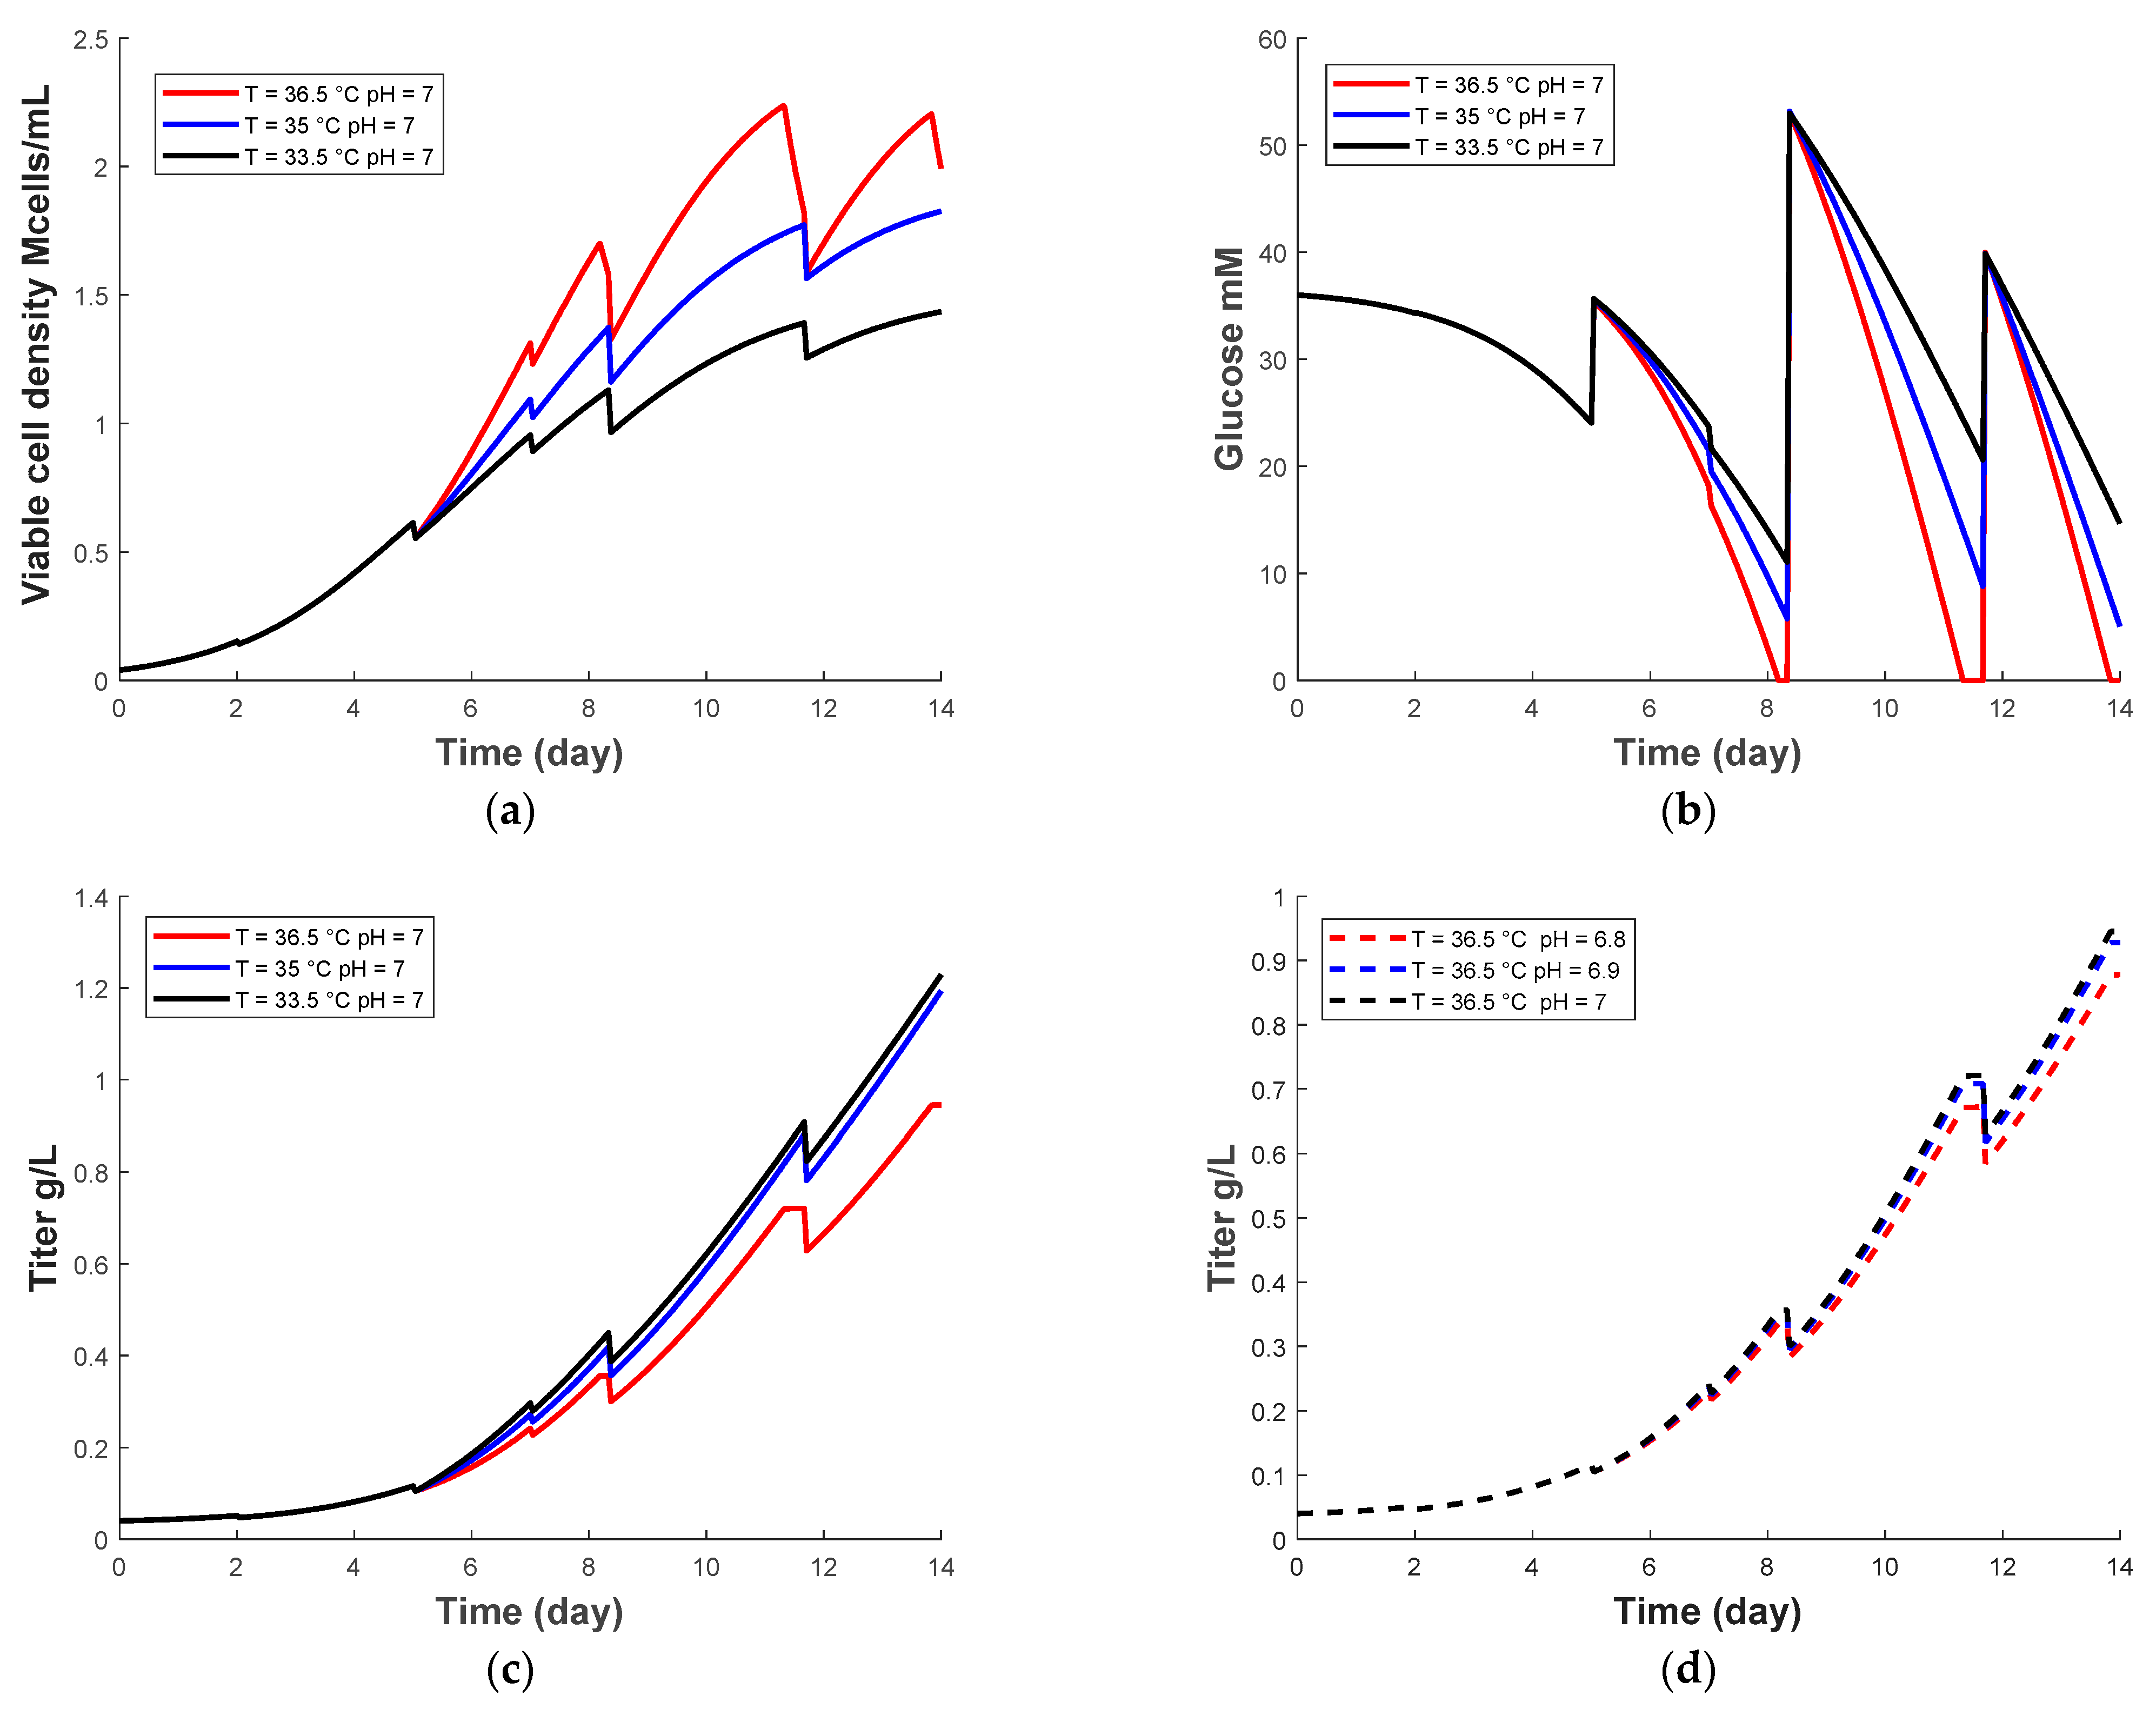
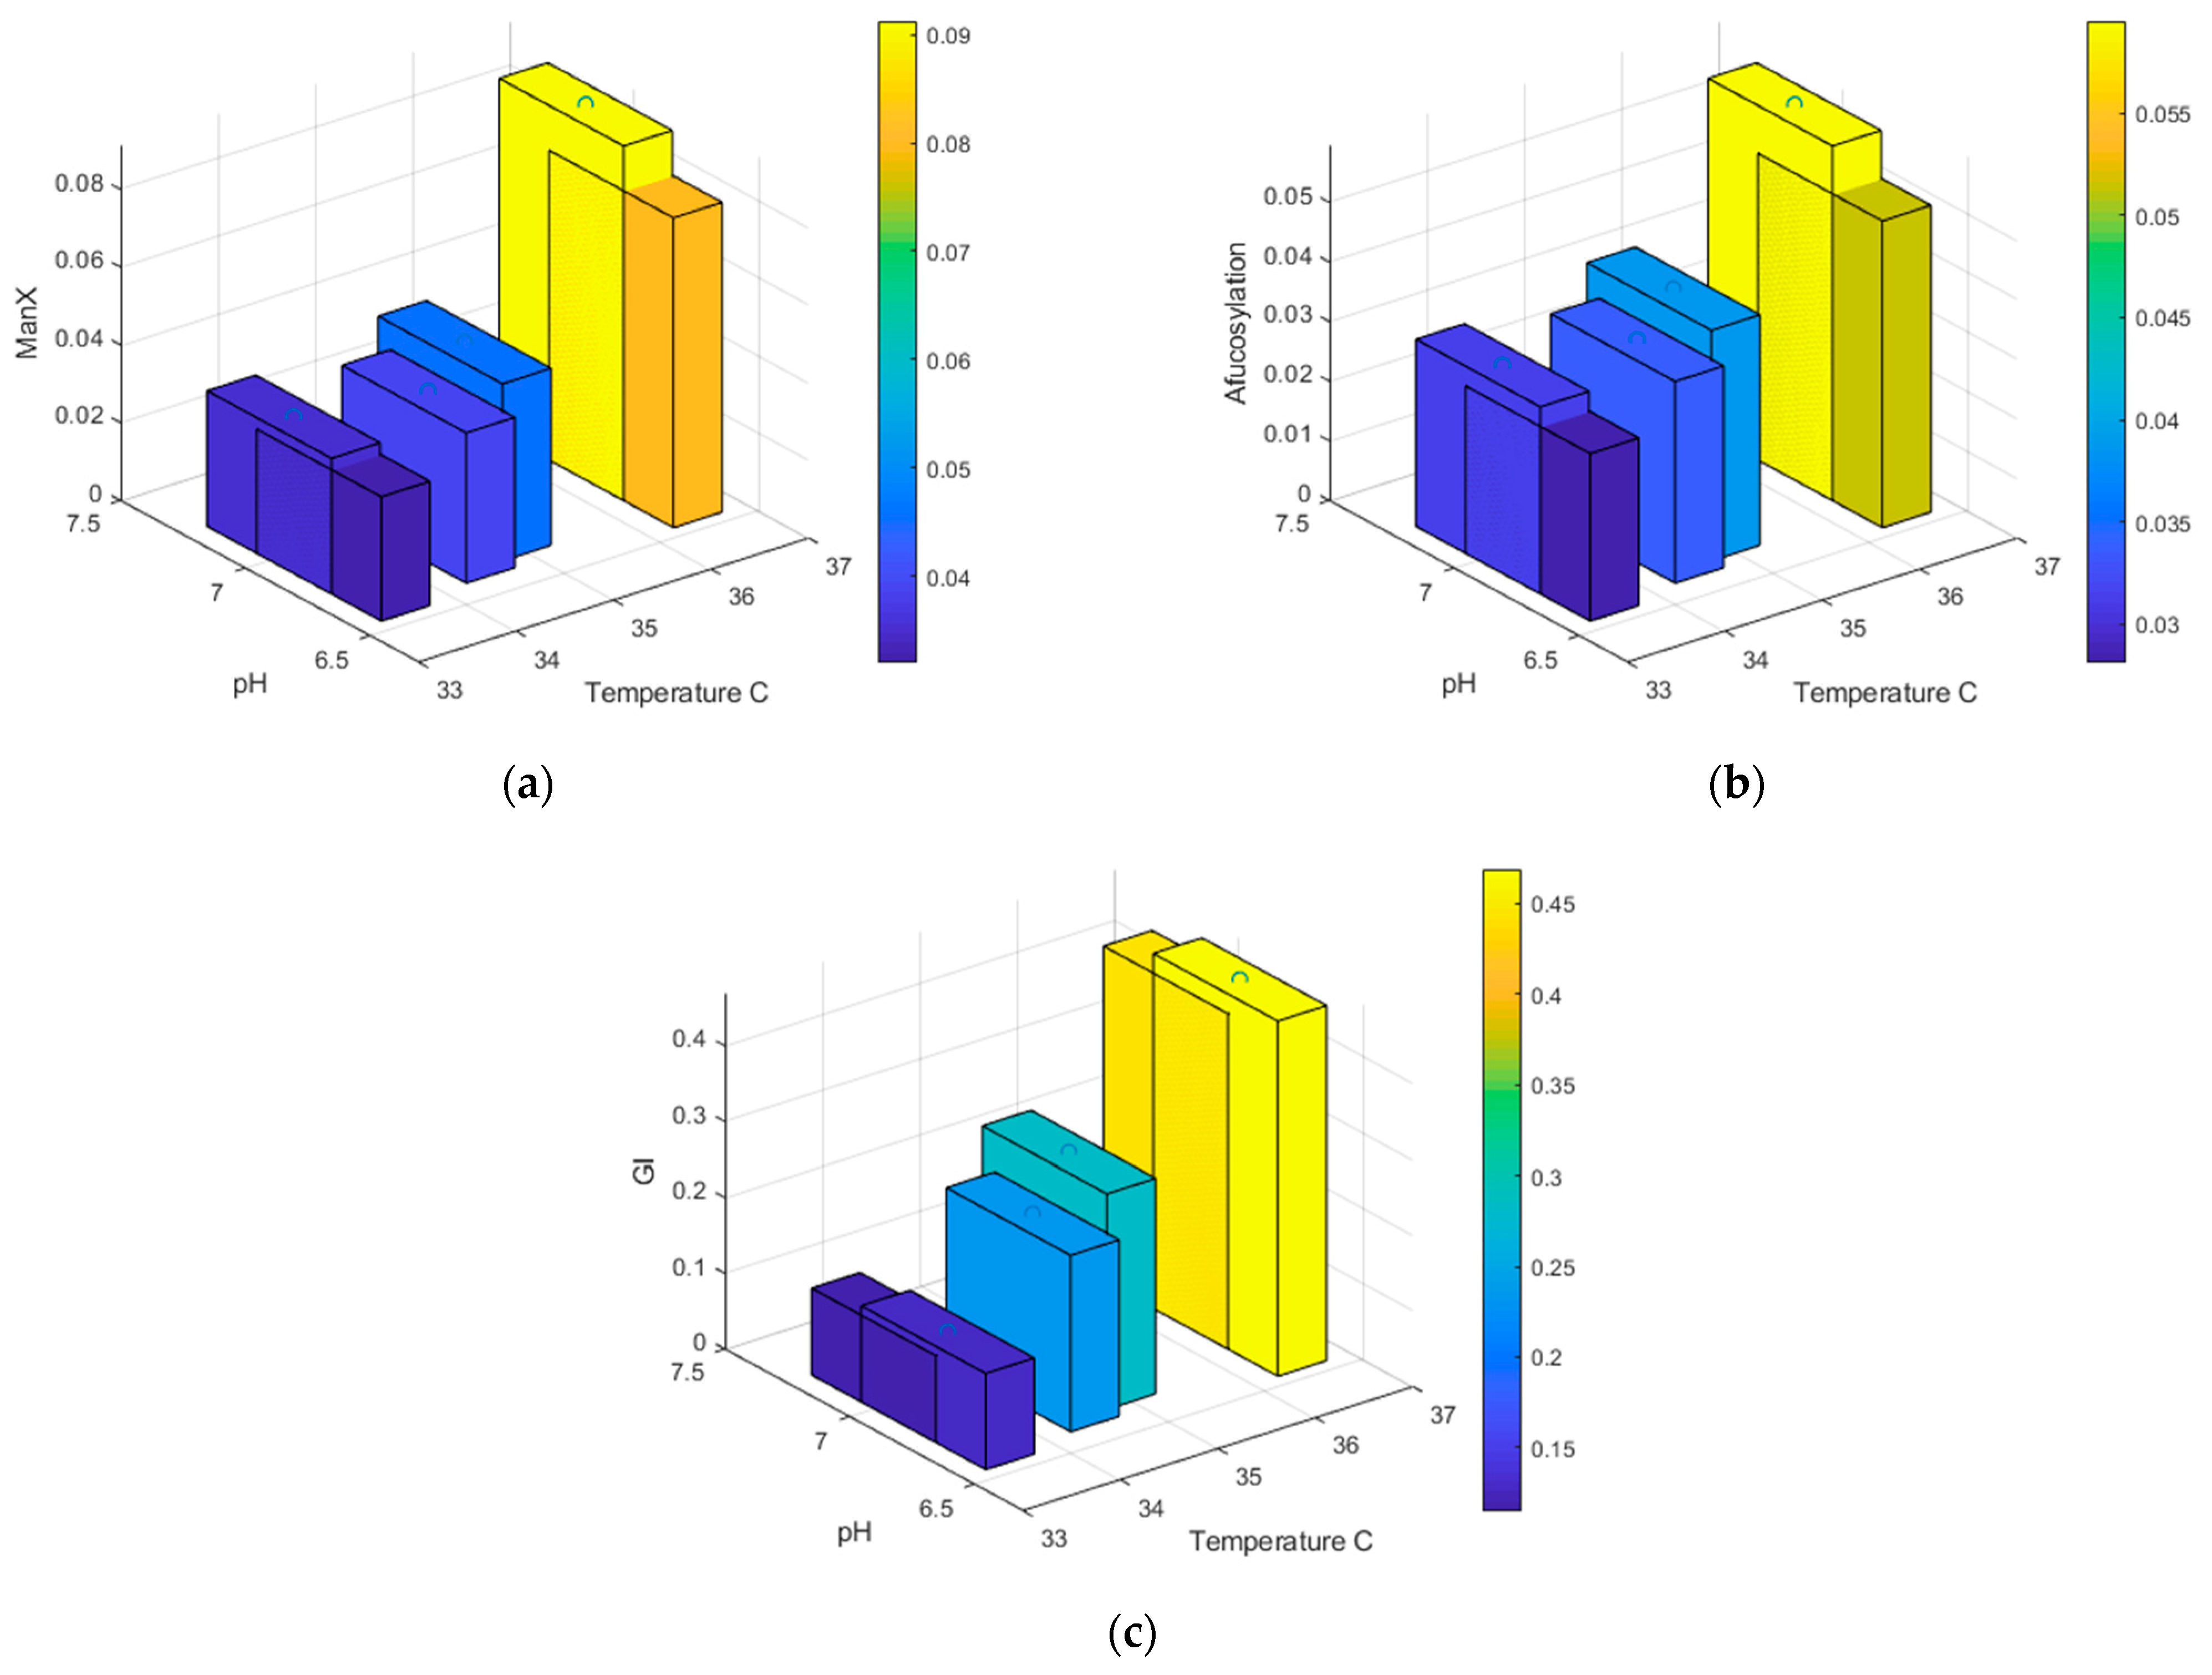
3.1. Prediction of Temperature and pH Effect Using the Kinetic Model

A kinetic model was built to capture the viable cell, glucose, and mAb concentrations under different temperatures and pH values. It assumes the cells were first cultured at 37 °C and pH = 7, and then shifted to a different temperature and pH on day 5. Three runs were used to test the temperature effect. For each of the runs, the pH was set to 7 and the temperature was shifted to 33.5 °C, 35 °C and 36.5 °C, respectively. Similarly, three runs were used to test the pH effect, with pH shifting to 6.8, 6.9 and 7, respectively. The conditions of the cell culture followed the following assumptions. Glucose was added on days 5, 8 and 12 during the cell culturing. A feed with nutrients was also provided to the system on days 2, 5, 8 and 12 to maintain cell growth. Due to a lack of experimental data, all the fittings were based on the regression of the kinetic rate constants under different temperatures from the literature [16,21].
The viable cell numbers and glucose concentrations under different temperatures (constant pH = 7) are shown in Figure 1a,b. Due to the addition of glucose and nutrients, sharp peaks can be observed. The figures indicate that the viable cell concentration is reduced with the temperature shifting down, which also causes a reduction in glucose consumption rate. A similar trend was observed in the studies from Refs. [7,32]. The pH value’s effect on viable cell and glucose concentration is not considered in this work. It has been reported in the literature that no significant effects have been observed within a certain range of pH change. For example, Trummer et al. [33] showed that the specific cell growth rate was not affected when the pH shifted from 7.10 to 6.9 on day 5. Figure 1c shows that the protein titer increased with the reduction in the temperature. Since the viable cell concentration was reduced, the specific protein production rate (qp) increased as the temperature reduced, which is consistent with what is reported in the literature [22,34]. Figure 1d also shows that the reduction in pH reduces the protein titer. This observation has also been reported in Villiger et al. [35].
In a previous study, it was shown that the protein specific production rate and glycan fractions are affected by different temperatures in the CHO cell culture. In general, for mAbs, the shifting of temperature usually causes an increase in protein production rate, while decreasing the temperature usually causes a reduction in glycosylation processes, such that the galactosylation, fucosylation and sialyation are reduced [7,22].
The pH effects on the protein productivity and glycosylation vary from cell line to cell line. It is shown in Table 1 that increasing and decreasing the pH can both cause a decrease in protein productivity. Changing the protein productivity has a great effect on protein glycosylation. Jiang et al. [36] reported that the galactosylation increases as qp decreases, regardless of the shift in pH. However, inconsistency is still observed in the trend of Man5 and G2FS1, as shown in Table 1.
In general, a higher protein production rate reduces the residence time of the protein in the Golgi apparatus. Protein has less contact time with the enzymes, which reduces glycosylation in the final product. Thus, in the model, the production rate is used to connect the cell culture process and protein glycosylation. By incorporating the temperature and pH effects on protein productivity, the glycosylation process can be captured. On the other hand, temperature also affects enzyme expression. The mRNA expressions of the glycosyltransferase, including GnTII, β -GalT and FucT, are significantly lowered when the temperature decreases [22]. The parameters for enzyme concentration under different temperatures are obtained from the literature [17]. We must note that the reduction in temperature reduces the consumption of glucose, which further reduces nucleotide sugar, including UDP-Glc, UDP-Gal and UDP-GlcNAc synthesis, thus reducing the processed glycan structure. Figure 2 shows the change in glycan fractions under different temperature shifts. Decreasing the temperature reduces galactosylation and fucosylation, which is consistent with the results in literature [7,22].
Figure 3 shows the change in glycan fractions under different pH values. Decreasing the pH reduces the afucosylation but increases galactosylation and fucosylation, which coheres with the results shown in Table 1.
All the trends in glycan fractions under different temperatures and pH values are summarized in Table 2. Comparing the results from Table 1 and Table 2, as well as from the literature that focusses on the effect of temperature shifts, indicates that all the predictions from the developed mechanistic model are consistent with the results from the literature. From the prediction, shifting down pH would reduce the titer and increase the fucosylation and galactosylation, and shifting the temperature down would increase the produced titer and reduce the galactosylation.

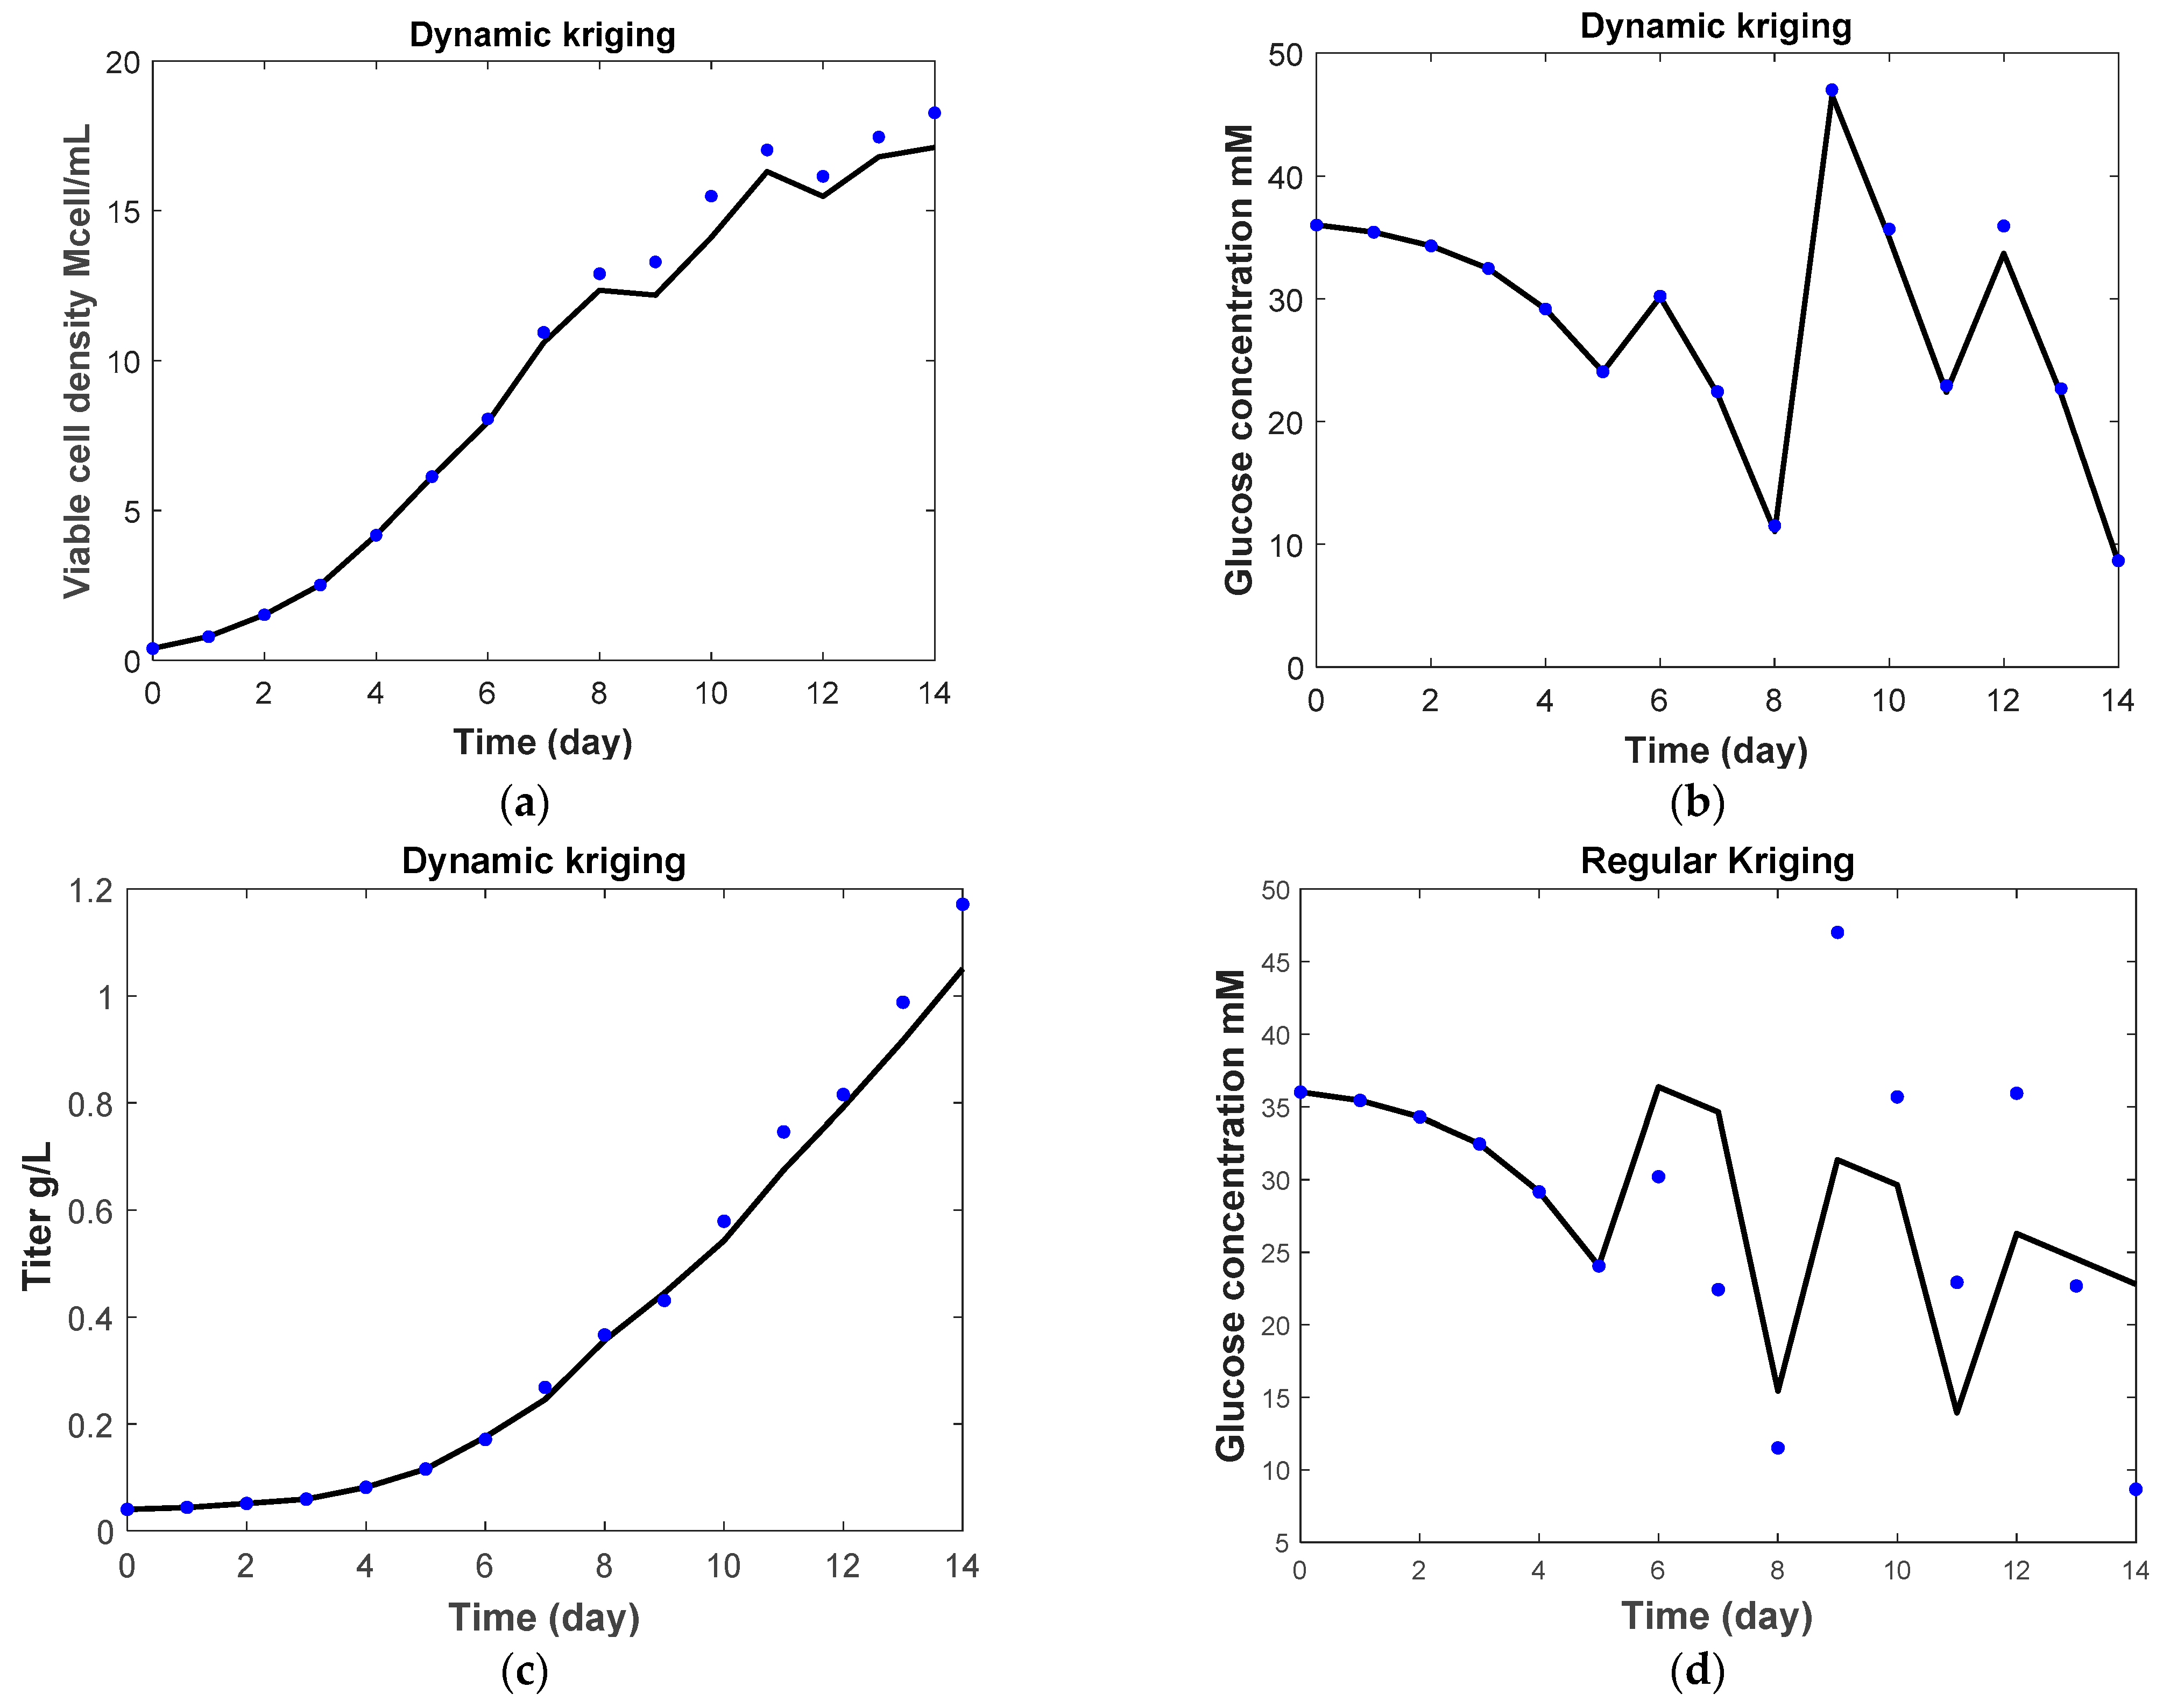
3.2. Kriging and Dynamic Kriging

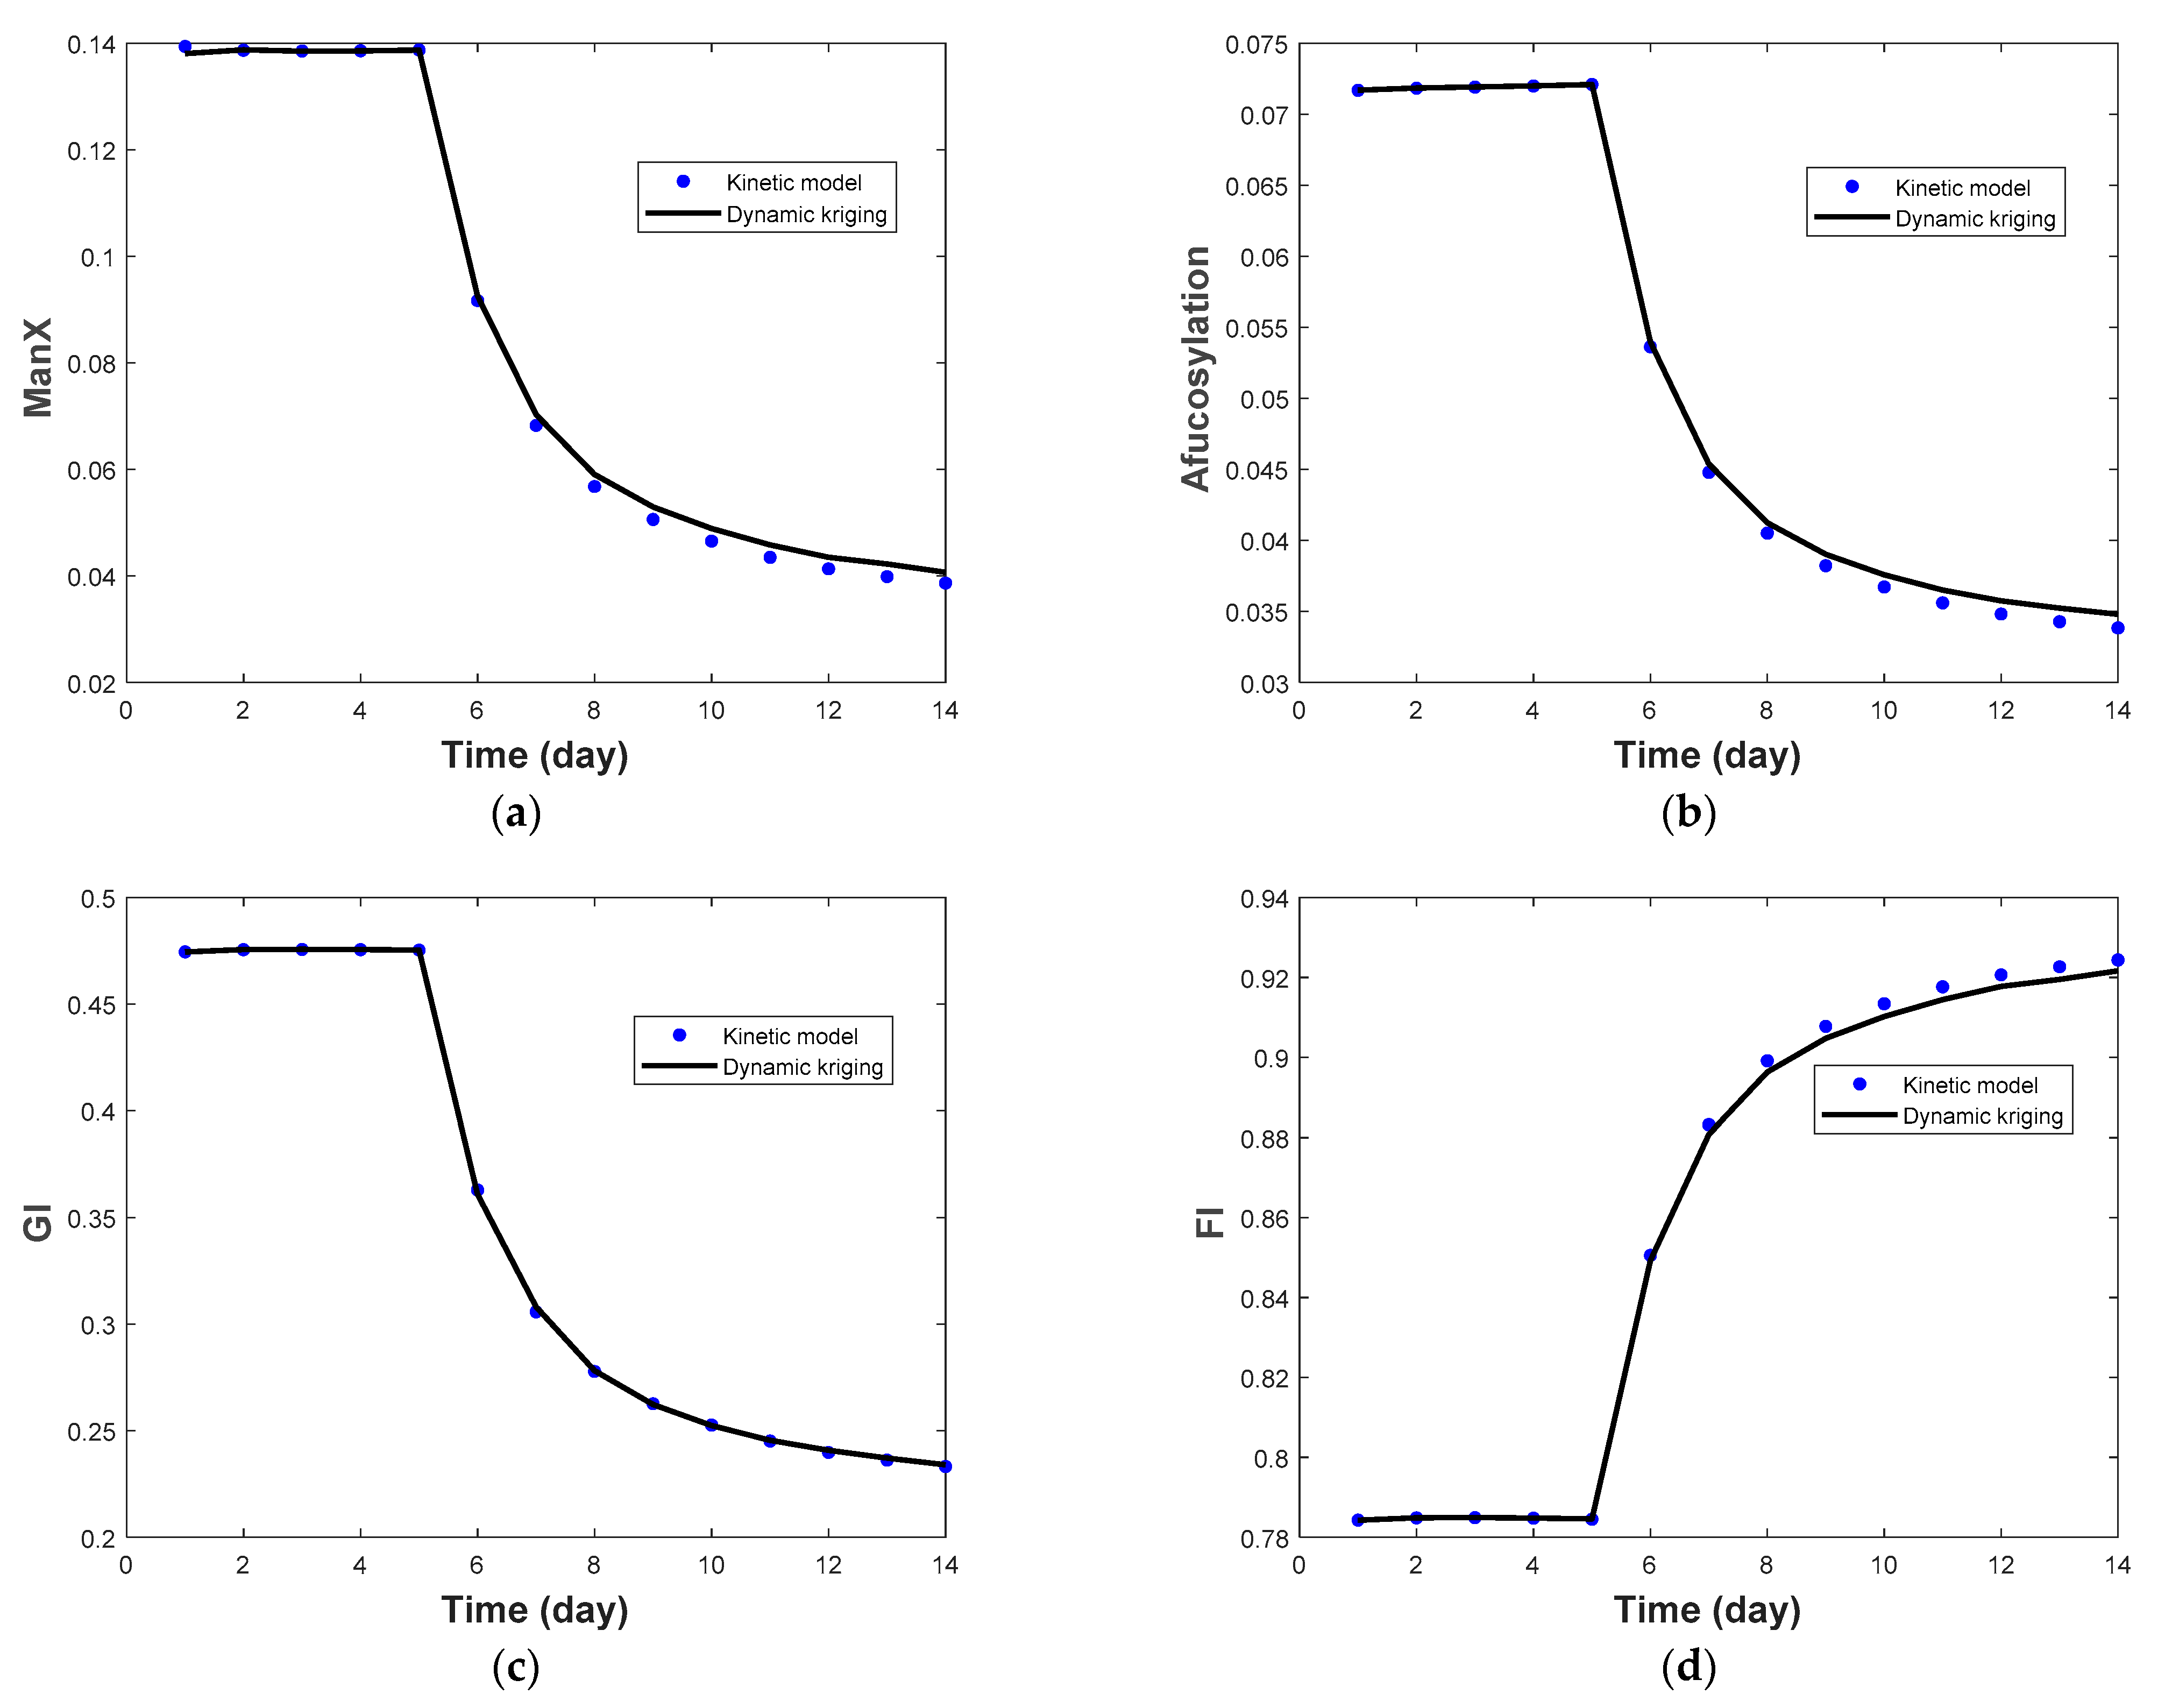
3.2.1. Regular Kriging vs. Dynamic Kriging

The kinetic model’s results are used as training sets to build the regular kriging and dynamic kriging models. Using the design of experiments, five conditions with temperature and pH shifts are used, as follows: (1) T = 33.5 °C, pH = 7; (2) T = 33.5 °C, pH = 6.8; (3) T = 35 °C, pH = 6.9; (4) T = 36.5 °C, pH = 6.8; (5) T = 36.5 °C, pH = 7. The kriging model reduces the computational complexity, provides an easier means of model fitting, and has capabilities in process optimization. The purpose of this section is to test the capabilities of dynamic kriging in the prediction of product concentration and quality with a small amount of data.
For regular kriging, to predict viable cell concentration, glucose and protein titer, input parameters including time, temperature, pH and glucose addition at different time points are used. For dynamic kriging, the input parameters start with the same input parameters as for regular kriging, and the input datasets are dynamically updated based on the predictions from the previous time points. A random culture condition (T = 34.5 °C, pH = 6.85) is selected to test the fitting performance. Figure 4a,b,c show the good prediction of dynamic kriging results for viable cell, glucose and mAbs. In general, dynamic kriging provides higher prediction accuracy than regular kriging, especially in the prediction of glucose concentration, which has a more complicated trend, as shown in Figure 4b,d. This is mainly because dynamic kriging considers more sample points and correlations during the model prediction. By considering the output from previous time points, the prediction of the next time point is very sensitive to system change.
To predict the glycan fractions, the operating parameters, cell culture data and glycan fractions (at t − 1 time points) are used as the input datasets that train the dynamic kriging model. During the prediction, the input parameters together with viable cell concentration, protein titers and Man5 glycan fractions at (t − 1) time points are used as the input to predict the Man5 glycan fractions at t time point by dynamic kriging. The same idea is applied to other glycan fractions.
Theoretically, the prediction can start from day 1, since the mechanistic model provides the glycan fractions at an early stage. Thus, data from day 1 from the mechanistic model can be used as training datasets for data-driven model training, as shown in Figure 5. In the experimental work, however, the glycan fractions’ data for the first 4 days are hard to obtain. This is mainly due to the low product concentration in the solution, which results in a low intensity during the glycan fraction measurements. The predictions from day 1 and day 5 are all tested in this study, and the mean relative squared errors (MRSE) [38] are compared in Table 3. Figures S5 and S6, which illustrate the fitting for all the glycans, can be found in the supplementary information. This shows that dynamic kriging is able to predict the glycan fractions with high accuracy (all the MRSE <10%). As shown in Figure 5, dynamic kriging provides good prediction in the early stage, and the error becomes large at the end of the cell culture. It is found that the higher errors occur in the prediction of G1F, G2F and G2FS1, which could be due to the limited training dataset used in this case study.

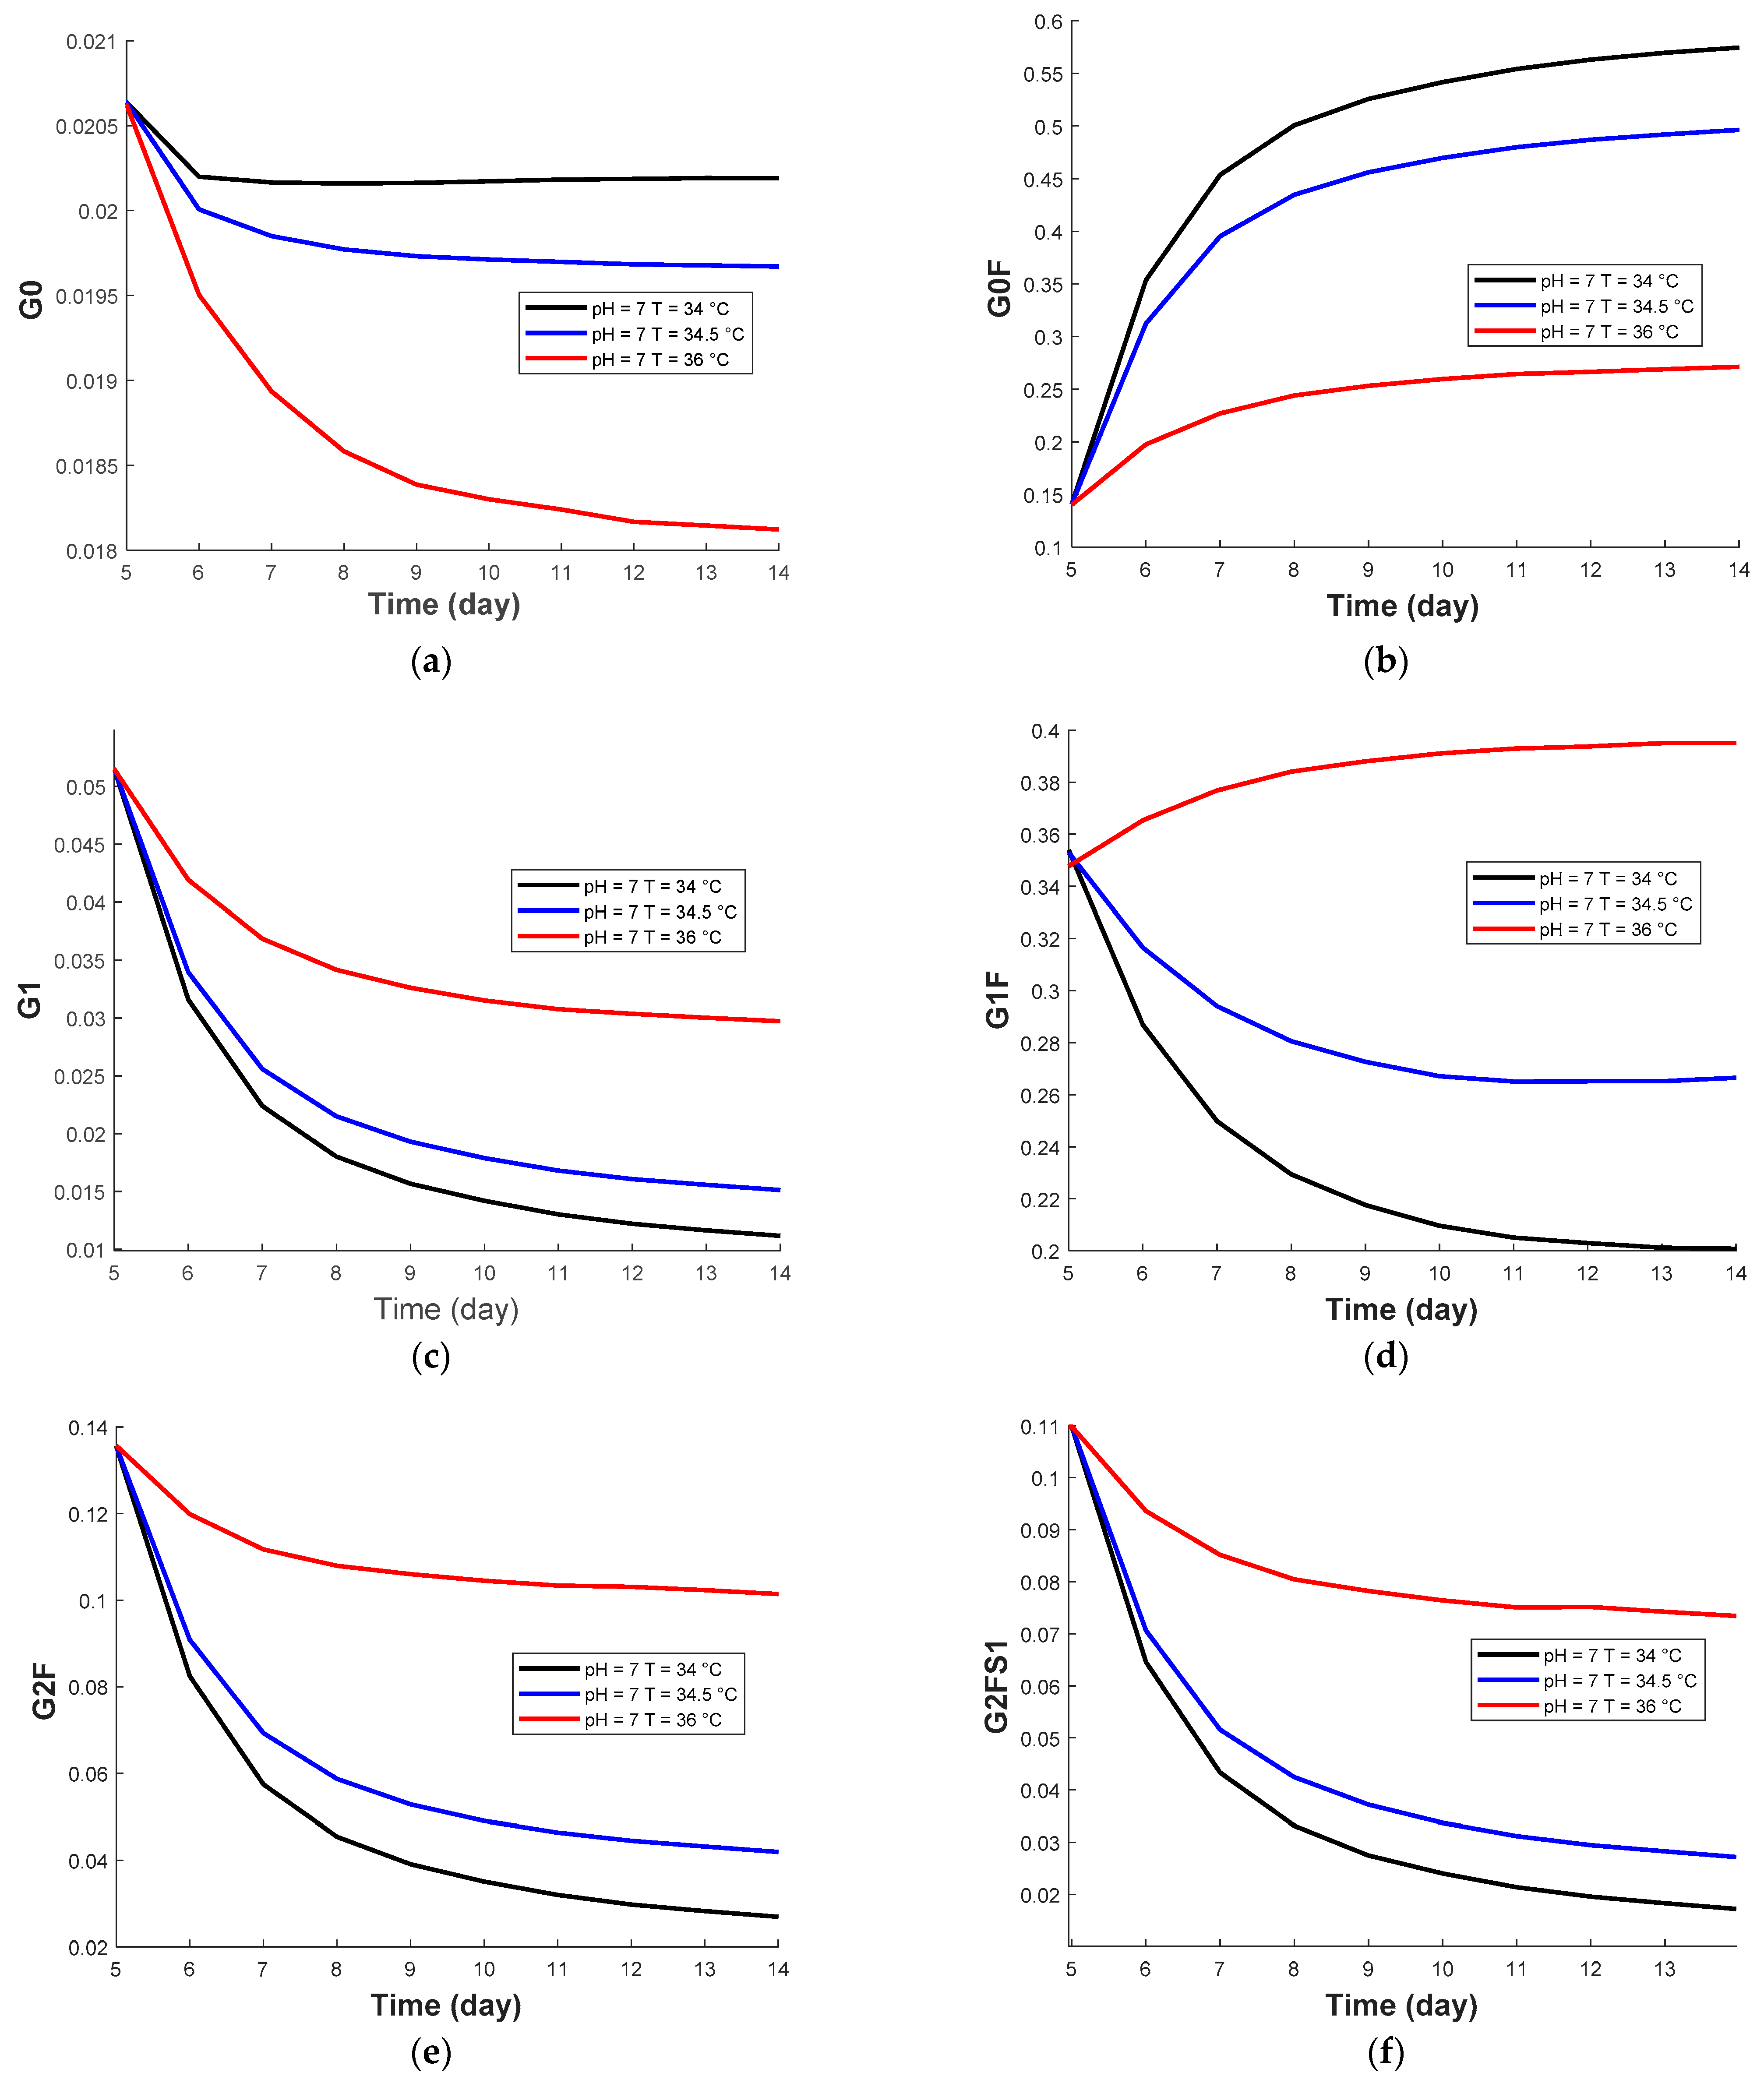
3.2.2. Prediction of Temperature Effect from Dynamic Kriging Model

Different operating conditions are also used to further test the prediction of dynamic kriging. Since 33.5, 35 and 36.5 °C are used as training data sets, different temperatures T = 34, 34.5 and 36 °C are tested at pH 7. With the temperature increasing, G0 and G0F are reduced, while G1, G1F, G2F and G2FS1 are increased. From Figure 6, all the results are matched to those obtained by the mechanistic model.

3.3. Feasibility Analysis and Design Space

As mentioned in the previous section, the glycan fractions are critical quality attributes used to evaluate the biological product’s performance and for the testing of biosimilars. For this case study, three quality attributes (high mannose, afucosyaltion and galactosylation of Herceptin (trastuzumab)) are tested. According to the FDA Briefing Document Oncologic Drugs Advisory Committee Meeting, the requirements for the glycan profile of a product biosimilar to Herceptin are obtained [39]. To satisfy the quality attributes, the total afucosylation needs to be maintained within the range of 2% to 14.5%, galactosylation needs to stay within 20% to 70%, and high mannose needs to be below 8%. Within the operating range, the end points of high mannose, afucosyaltion and galactosylation prediction at day 14, under different temperatures and pH values, are shown in Figure 7. This shows that afucosylation ranges from 2.5% to 6%, that is, within the requirement for the afucosyaltion ratio. However, the galacosylation changes from 5% to 47%, which means that in this range of conditions there is a risk of being lower than the required range of values. Thus, a constraint needs to be considered to ensure that GI can reach at least 20% in the feasibility analysis. Similarly, high mannose reaches up to 9%, which also needs to be considered as a constraint in the feasibility analysis.
From Figure 1c,d, we see that temperature and pH have effects on the protein titer. Thus, in order to maintain high productivity, the protein concentration is set as more than 1 g/L. This section aims to maintain the afucosyaltion and galactosylation within the required range, and these components can be predicted by dynamic kriging. One approach is to develop the dynamic kriging that predicts the glycan index directly based on the culture conditions, viable cell, and mAb concentrations. The predictions of the glycan index are shown in Figure 8. Table 4 shows the MRSE values. The results show that dynamic kriging provides a good prediction of all the glycan indices (MRSE < 2%). The second approach used has a good prediction performance. It should be noticed that although only the end point glycan fractions are important for quality assurance, understanding the dynamic profile of different glycan fractions is important in order to enable better quality control during production.
In total, 25 initial sample points were obtained from the kriging model and used to obtain the initial feasible region. Adaptive sampling is used to improve the accuracy of the feasible region. Figure 9 demonstrates the results of the feasibility analysis. The dark blue line shows the predicted feasible region’s boundary (feasibility function = 0), which indicates the operating region that satisfies all the constraint requirements. The circle points are infill points, which are added to improve the accuracy of the feasible region. Finally, the three performance measures’ distributions are CF = 0.997, CIF = 0.999 and NC = 0.001, which indicates that the feasible region has been accurately determined.

4. Conclusions

In this work, we developed a kinetic model to successfully capture the effects of temperature and pH on protein production and the mAb’s product quality attributes. By using mechanistic relations, the kinetic model improves the understanding of the effects of physical stimuli on the intracellular reactions. The mechanistic model is further simplified using dynamic kriging, which is able to provide dynamic predictions with high accuracy. This step reduces the computational costs and improves the efficiency and accuracy of model fitting. Surrogate-based feasibility analysis is used to determine the design space for bioreactor modeling. The adaptive sampling method is used to determine the design space for process operations efficiently. The developed methods can be used to predict titer and protein qualities under different conditions. They handle multiple constraints and provide the design space boundaries for efficient bioreactor operation. Additional work is needed to implement the proposed framework, using more experimental data for CHO bioreactor operations. In the experimental cell culture system, variabilities and noises may exist. Data cleaning and preprocessing are needed to improve prediction accuracy.

Supplementary Materials

The following are available online at https://www.mdpi.com/2227-9717/9/2/324/s1, Figure S1: Glycan fractions under different temperatures: (a) G0, (b) G0F, (c) G1F, (d) G2F, (e) G1, (f) G2FS1 (pH = 6.8); Figure S2: Glycan fractions under different temperatures: (a) G0, (b) G0F, (c) G1F, (d) G2F, (e) G1, (f) G2FS1 (pH = 6.9); Figure S3: Glycan fractions under different pH values: (a) G0, (b) G0F, (c) G1F, (d) G2F, (e) G1, (f) G2FS1 (T = 33.5 °C); Figure S4: Glycan fractions under different pH values: (a) G0, (b) G0F, (c) G1F, (d) G2F, (e) G1, (f) G2FS1 (T = 35 °C); Figure S5: Glycan fractions fitting from day 1 by using dynamic kriging, Figure S6: Glycan fraction fitting from day 5 using dynamic kriging.

Author Contributions

Conceptualization, O.Y. and M.I.; methodology, O.Y. and M.I.; software, O.Y. and M.I.; validation, O.Y. and M.I.; formal analysis, O.Y. and M.I.; investigation, O.Y. and M.I.; resources, M.I.; data curation, O.Y. and M.I.; writing original draft preparation, O.Y. and M.I.; writing review and editing, O.Y. and M.I.; visualization, O.Y. and M.I.; supervision, M.I.; project administration, M.I.; funding acquisition, M.I. All authors have read and agreed to the published version of the manuscript.

Funding

This research was funded by US FOOD and DRUG ADMINISTRATION, grant number DHHS-FDA-R01FD006588.

Conflicts of Interest

The authors declare no conflict of interest.

References

  1. Tantibanchachai, C. Coronavirus (COVID-19) Update: FDA Authorizes Monoclonal Antibodies for Treatment of COVID-19. 2020. Available online: https://www.fda.gov/news-events/press-announcements/coronavirus-covid-19-update-fda-authorizes-monoclonal-antibodies-treatment-covid-19 (accessed on 19 December 2020).
  2. Kiyoshi, M.; Caaveiro, J.M.; Tada, M.; Tamura, H.; Tanaka, T.; Terao, Y.; Morante, K.; Harazono, A.; Hashii, N.; Shibata, H.; et al. Assessing the Heterogeneity of the Fc-Glycan of a Therapeutic Antibody Using an engineered FcγReceptor IIIa-Immobilized Column. Sci. Rep. 2018, 8, 1–11. [Google Scholar] [CrossRef] [Green Version]
  3. Del Val, I.J.; Kontoravdi, C.; Nagy, J.M. Towards the implementation of quality by design to the production of therapeutic monoclonal antibodies with desired glycosylation patterns. Biotechnol. Prog. 2010, 26, 1505–1527. [Google Scholar] [CrossRef]
  4. Ehret, J.; Zimmermann, M.; Eichhorn, T.; Zimmer, A. Impact of cell culture media additives on IgG glycosylation produced in Chinese hamster ovary cells. Biotech-Nol. Bioeng. 2019, 116, 816–830. [Google Scholar]
  5. Lodish, H.; Berk, A.; Zipursky, S.L.; Matsudaira, P.; Baltimore, D.; Darnell, J. Protein Glycosylation in the ER and Golgi Complex. In Molecular Cell Biology; W.H. Freeman: New York, NY, USA, 2000. [Google Scholar]
  6. Higel, F.; Seidl, A.; Sörgel, F.; Friess, W. N-glycosylation heterogeneity and the influence on structure, function and pharmacokinetics of monoclonal antibodies and Fc fusion proteins. Eur. J. Pharm. Biopharm. 2016, 100, 94–100. [Google Scholar] [CrossRef] [Green Version]
  7. Aghamohseni, H.; Spearman, M.; Ohadi, K.; Braasch, K.; Moo-Young, M.; Butler, M.; Budman, H.M. A semi-empirical glycosylation model of a camelid monoclonal antibody under hypothermia cell culture conditions. J. Ind. Microbiol. Biotechnol. 2017, 44, 1005–1020. [Google Scholar] [CrossRef]
  8. Kim, S.-M.; Chang, K.-H.; Oh, D.J. Effect of Environmental Parameters on Glycosylation of Recombinant Immunoglobu-lin G Produced from Recombinant CHO Cells. Biotechnol. Bioprocess Eng. 2018, 23, 456–464. [Google Scholar] [CrossRef]
  9. Sumit, M.; Dolatshahi, S.; Chu, A.-H.A.; Cote, K.; Scarcelli, J.J.; Marshall, J.K.; Cornell, R.J.; Weiss, R.; Lauffenburger, U.A.; Mulukutla, B.C.; et al. Dissecting N-Glycosylation Dynamics in Chinese Hamster Ovary Cells Fed-batch Cultures using Time Course Omics Analyses. iScience 2019, 12, 102–120. [Google Scholar] [CrossRef] [Green Version]
  10. Wong, D.C.F.; Wong, K.T.K.; Goh, L.T.; Heng, C.K.; Yap, M.G.S. Impact of dynamic online fed-batch strategies on metabolism, productivity and N-glycosylation quality in CHO cell cultures. Biotechnol. Bioeng. 2004, 89, 164–177. [Google Scholar] [CrossRef] [PubMed]
  11. Raju, T.S.; Jordan, R.E. Galactosylation variations in marketed therapeutic antibodies. mAbs 2012, 4, 385–391. [Google Scholar] [CrossRef] [PubMed] [Green Version]
  12. Surve, T.; Gadgil, M. Manganese increases high mannose glycoform on monoclonal antibody expressed in CHO when glucose is absent or limiting: Implications for use of alternate sugars. Biotechnol. Prog. 2015, 31, 460–467. [Google Scholar] [CrossRef] [PubMed]
  13. Radhakrishnan, D.; Robinson, A.S.; Ogunnaike, B.A. Controlling the Glycosylation Profile in mAbs Using Time-Dependent Media Supplementation. Antibodies 2017, 7, 1. [Google Scholar] [CrossRef] [Green Version]
  14. Kotidis, P.; Jedrzejewski, P.; Sou, S.N.; Sellick, C.; Polizzi, K.M.; Del Val, I.J.; Kontoravdi, C. Model-based optimization of antibody galactosylation in CHO cell culture. Biotechnol. Bioeng. 2019, 116, 1612–1626. [Google Scholar] [CrossRef] [PubMed]
  15. Luo, Y.; Lovelett, R.J.; Price, J.V.; Radhakrishnan, D.; Barnthouse, K.; Hu, P.; Schaefer, E.; Cunningham, J.; Lee, K.H.; Shivappa, R.B.; et al. Modeling the Effect of Amino Acids and Copper on Monoclonal Antibody Productivity and Glycosylation: A Modular Approach. Biotechnol. J. 2020, 16, 2000261. [Google Scholar] [CrossRef]
  16. Villiger, T.K.; Scibona, E.; Stettler, M.; Broly, H.; Morbidelli, M.; Soos, M. Controlling the time evolution of mAb N-linked glycosylation—Part II: Model-based predictions. Biotechnol. Prog. 2016, 32, 1135–1148. [Google Scholar] [CrossRef]
  17. Sou, S.N.; Jedrzejewski, P.M.; Lee, K.; Sellick, C.; Polizzi, K.M.; Kontoravdi, C. Model-based investigation of intracellular processes determining antibody Fc-glycosylation under mild hy-pothermia. Biotechnol. Bioeng. 2017, 114, 1570–1582. [Google Scholar] [CrossRef]
  18. Narayanan, H.; Luna, M.F.; Von Stosch, M.; Bournazou, M.N.C.; Polotti, G.; Morbidelli, M.; Butté, A.; Sokolov, M. Bioprocessing in the Digital Age: The Role of Process Models. Biotechnol. J. 2020, 15, e1900172. [Google Scholar] [CrossRef] [PubMed]
  19. Sokolov, M.; Morbidelli, M.; Butté, A.; Souquet, J.; Broly, H. Sequential Multivariate Cell Culture Modeling at Multiple Scales Supports Systematic Shaping of a Mono-clonal Antibody Toward a Quality Target. Biotechnol. J. 2018, 13, 1700461. [Google Scholar] [CrossRef] [PubMed]
  20. Zürcher, P.; Sokolov, M.; Brühlmann, D.; Ducommun, R.; Stettler, M.; Souquet, J.; Jordan, M.; Broly, H.; Morbidelli, M.; Butté, A. Cell culture process metabolomics together with multivariate data analysis tools opens new routes for bio-process development and glycosylation prediction. Biotechnol. Prog. 2020, 36, e3012. [Google Scholar] [CrossRef]
  21. Del Val, I.J.; Fan, Y.; Weilguny, D. Dynamics of immature mAb glycoform secretion during CHO cell culture: An integrated modelling framework. Biotechnol. J. 2016, 11, 610–623. [Google Scholar] [CrossRef] [Green Version]
  22. Sou, S.N.; Sellick, C.; Lee, K.; Mason, A.; Kyriakopoulos, S.; Polizzi, K.M.; Kontoravdi, C. How does mild hypothermia affect monoclonal antibody glycosylation? Biotechnol. Bioeng. 2015, 112, 1165–1176. [Google Scholar] [CrossRef] [Green Version]
  23. Jimenez del Val, I.; Nagy, J.M.; Kontoravdi, C. A dynamic mathematical model for monoclonal antibody N-linked glyco-sylation and nucleotide sugar donor transport within a maturing Golgi apparatus. Biotechnol. Prog. 2011, 27, 1730–1743. [Google Scholar] [CrossRef]
  24. Fan, Y.; Del Val, I.J.; Müller, C.; Lund, A.M.; Sen, J.W.; Rasmussen, S.K.; Kontoravdi, C.; Baycin-Hizal, D.; Betenbaugh, M.J.; Weilguny, D.; et al. A multi-pronged investigation into the effect of glucose starvation and culture duration on fed-batch CHO cell culture. Biotechnol. Bioeng. 2015, 112, 2172–2184. [Google Scholar] [CrossRef] [PubMed] [Green Version]
  25. Davis, E.; Ierapetritou, M. A kriging method for the solution of nonlinear programs with black-box functions. AIChE J. 2007, 53, 2001–2012. [Google Scholar] [CrossRef]
  26. Boukouvala, F.; Muzzio, F.J.; Ierapetritou, M.G. Dynamic Data-Driven Modeling of Pharmaceutical Processes. Ind. Eng. Chem. Res. 2011, 50, 6743–6754. [Google Scholar] [CrossRef]
  27. Sacks, J.; Welch, W.J.; Mitchell, T.J.; Wynn, H.P. Design and Analysis of Computer Experiments. Stat. Sci. 1989, 4, 409–423. [Google Scholar] [CrossRef]
  28. Bhosekar, A.; Ierapetritou, M. Advances in surrogate based modeling, feasibility analysis, and optimization: A review. Comput. Chem. Eng. 2018, 108, 250–267. [Google Scholar] [CrossRef]
  29. Lophaven, S.N.; Nielsen, H.B.; Søndergaard, J. DACE: A Matlab Kriging Toolbox; Technical Report IMM-TR-2002-12; Technical University of Denmark: Lyngby, Denmark, August 2002; Volume 2. [Google Scholar]
  30. Hernandez, A.F.; Grover, M.A. Stochastic dynamic predictions using Gaussian process models for nanoparticle synthesis. Comput. Chem. Eng. 2010, 34, 1953–1961. [Google Scholar] [CrossRef]
  31. Boukouvala, F.; Ierapetritou, M.G. Derivative-free optimization for expensive constrained problems using a novel ex-pected improvement objective function. AIChE J. 2014, 60, 2462–2474. [Google Scholar] [CrossRef]
  32. Vergara, M.; Becerra, S.; Berrios, J.; Osses, N.; Reyes, J.G.; Rodríguez-Moyá, M.; Gonzalez, R.; Altamirano, C. Differential Effect of Culture Temperature and Specific Growth Rate on CHO Cell Behavior in Chemostat Culture. PLoS ONE 2014, 9, e93865. [Google Scholar] [CrossRef] [PubMed]
  33. Trummer, E.; Fauland, K.; Seidinger, S.; Schriebl, K.; Lattenmayer, C.; Kunert, R.; Vorauer-Uhl, K.; Weik, R.; Borth, N.; Katinger, H.; et al. Process parameter shifting: Part II. Biphasic cultivation—A tool for enhancing the volumetric productivity of batch processes using Epo-Fc expressing CHO cells. Biotechnol. Bioeng. 2006, 94, 1045–1052. [Google Scholar] [CrossRef] [PubMed]
  34. Xu, J.; Tang, P.; Yongky, A.; Drew, B.; Borys, M.C.; Liu, S.; Li, Z.J. Systematic development of temperature shift strategies for Chinese hamster ovary cells based on short duration cultures and kinetic modeling. MAbs 2019, 11, 191–204. [Google Scholar] [CrossRef] [Green Version]
  35. Villiger, T.K.; Roulet, A.; Périlleux, A.; Stettler, M.; Broly, H.; Morbidelli, M.; Soos, M. Controlling the time evolution of mAb N-linked glycosylation, Part I: Microbioreactor experiments. Biotechnol. Prog. 2016, 32, 1123–1134. [Google Scholar] [CrossRef] [PubMed]
  36. Jiang, R.; Chen, H.; Xu, S. pH excursions impact CHO cell culture performance and antibody N-linked glycosylation. Bioprocess Biosyst. Eng. 2018, 41, 1731–1741. [Google Scholar] [CrossRef] [PubMed]
  37. Agarabi, C.D.; Schiel, J.E.; Lute, S.C.; Chavez, B.K.; Boyne, M.T., 2nd; Brorson, K.A.; Khan, M.; Read, E.K. 2nd; Brorson, K.A.; Khan, M.; Read, E.K. Bioreactor process parameter screening utilizing a Plackett-Burman design for a model monoclonal an-tibody. J. Pharm. Sci. 2015, 104, 1919–1928. [Google Scholar] [CrossRef] [PubMed]
  38. Ažman, K.; Kocijan, J. Application of Gaussian processes for black-box modelling of biosystems. ISA Trans. 2007, 46, 443–457. [Google Scholar] [CrossRef]
  39. FDA. FDA Briefing Document Oncologic Drugs Advisory Committee Meeting. 2017. Available online: https://www.fda.gov/media/106566/download (accessed on 22 December 2020).
Figure 1. Dynamic change in (a) viable cell density, (b) glucose concentration and (c) mAb concentration under different temperatures. (d) Dynamic change in mAb concentration under different pH values.
Processes 09 00324 g001
Figure 2. Glycan fractions under different temperature (a) G0, (b) G0F, (c) G1F, (d) G2F, (e) G1, (f) G2FS1.
Processes 09 00324 g002aProcesses 09 00324 g002b
Figure 3. Glycan fractions under different pH values: (a) G0, (b) G0F, (c) G1F, (d) G2F, (e) G1, (f) G2FS1.
Processes 09 00324 g003aProcesses 09 00324 g003b
Figure 4. Prediction of viable cell (a), glucose (b), and mAbs (c) from dynamic kriging. Prediction of glucose concentration (d) from regular kriging.
Processes 09 00324 g004
Figure 5. Prediction of different glycan fractions from dynamic kriging: (a) Man5, (b) G0F, (c) G2F, (d) G2FS1.
Processes 09 00324 g005
Figure 6. The prediction of glycan fractions under different temperatures from dynamic kriging: (a) G0, (b) G0F, (c) G1, (d) G1F, (e) G2F, (f) G2FS1.
Processes 09 00324 g006
Figure 7. (a) High mannose, (b) afucosylation, (c) GI fractions within the defined operating ranges. The color variation represents glycan fractions.
Processes 09 00324 g007
Figure 8. Glycosylation index predicted by dynamic kriging: (a) high mannose, (b) afucosylation, (c) GI, (d) FI.
Processes 09 00324 g008
Figure 9. Feasible operating region obtained from adaptive sampling. Contour plot for feasibility function values under different pH values and temperatures. Zero line represents the feasible region’s boundary. Initial sampling points are shown as blue dots and red circles are adaptive sampling points.
Processes 09 00324 g009
Table 1. pH effect on titer and glycan fractions’ production from the CHO cell.
Protein pH RangeqpGlycan FractionRef
mAb   pH 7.15–6.70. Reduced: G0F, G0, Man5
Increased: G1F, G2F, G2FS1
[16]
mAb   pH 7.2–6.9 -Reduced: G0 [37]
mAb   pH 6.9–6.7 Increased: G1F+G2F, Man5, galactosylation
Reduced: Sialylation
[36]
  pH 6.9–7.3
Table 2. Model-predicted glycan fractions under different temperatures and pH values.
ConditionsTiterG0G0FG1/G2G1F/G2FG2F1S
pH shifted down
Temperature shifted down
Table 3. Mean relative squared error (MRSE) of dynamic kriging prediction.
Glycan FractionsMan5G0G1G1FG2FG2FS1
Day 50.0290.0040.0270.0880.0730.088
Day 10.0180.0040.0170.0720.0440.0510
Table 4. Means relative squared error (MRSE) of dynamic kriging prediction.
Glycan IndexAfucoyslation ManXGIFI
MRSE0.01210.01860.00250.0026
Publisher’s Note: MDPI stays neutral with regard to jurisdictional claims in published maps and institutional affiliations.

