Article

The Complexity of Lignin Thermal Degradation in the Isothermal Context

by
Jorge López-Beceiro
,
Ana María Díaz-Díaz
,
Ana Álvarez-García
,
Javier Tarrío-Saavedra
,
Salvador Naya
and
Ramón Artiaga
*
Campus Industrial, Escola Politécnica Superior, University of A Coruña, Avda. Mendizábal s/n, 15403 Ferrol, Spain
*
Author to whom correspondence should be addressed.
Processes 2021, 9(7), 1154; https://doi.org/10.3390/pr9071154
Submission received: 21 May 2021 / Revised: 18 June 2021 / Accepted: 30 June 2021 / Published: 2 July 2021
(This article belongs to the Special Issue Kinetic Modeling of Biomass Pyrolysis Processes)

Abstract

:
Thermal degradation of lignin in nitrogen atmosphere is evaluated by linear heating and isothermal tests. While linear heating suggests that thermal decomposition in the 200–400 °C range mainly consists of a single step, a careful analysis of isothermal tests points to different lignin fractions having different stabilities. This is an important point for practical predictions, since kinetics obtained as if the degradations at different temperatures were the same would lack practical utility. Instead, stairway type tests are proposed to evaluate the degradation rates and sample quantities involved at the temperatures of interest.

1. Introduction

Lignin is a natural phenolic polymer with high molecular weight and a complex composition and structure [1,2,3,4,5]. It is a highly heterogeneous polymer derived mainly from three different precursor lignols that crosslink in different ways: paracoumaryl alcohol, coniferyl alcohol and sinapyl alcohol [6]. Many phenolics are recognized as lignin monomers and they couple radically, resulting in a polymer with bewildering complexity [2]. While the presence of these monomers has been largely reported, the development of new analytical tools, along with analyses of lignin structures from a broader range of plant species, has led to the discovery of many additional monomers, giving rise to a rich diversity of polymers with different physicochemical properties [7]. Lignin, along with cellulose and hemicellulose, is one of the main components of plant cell walls and plays an important role in the plant growth, water management and its environmental adaptability [1]. Covalent bonds appear between hemicellulose and lignin, conferring mechanical strength to the cell wall and therefore to the plant [8]. Lignin is the major cause of lignocellulosic biomass recalcitrance to efficient industrial processing [9]. It represents a highly underutilized natural polymer that is generated during papermaking and biomass fractionation [10]. A number of processes are used to extract and isolate lignin from the cells, resulting in materials of different composition and properties [11].
From an engineering point of view, lignin is a promising renewable aromatic feed-stock [12,13] used to produce high-value products, such as biochemicals, biomaterials, and biofuels, as a sustainable alternative to petroleum [14]. Some of these products can be obtained by pyrolysis, but the yield of polymeric compounds remains too low to be economically attractive. It was suggested that oxygen in the biopolymer may oxidize the first degradation monomeric products. Thus, it was proposed that addition of other substrates may help to achieve a selective oxidation of the monomers to chemicals instead of gas or solid [15]. Some studies focused on obtaining lignins with different structures from mutant and transgenic plants [5]. Thus, shorter and less hydrophobic lignins with fewer bonds to hemicelluloses can be obtained [16]. Moreover, a number of chemical methods have been proposed to obtain lignin copolymers [17,18,19]. Several types of industrial lignin exist as a result from the inherent natural variation in lignin subunit composition and structure, and the process by which it is extracted from the biomass [14,20]. Pyrolysis, which is defined as thermal degradation in the absence of oxygen, is the most economical way to generate energy from lignocellulosic biomass [21]. Thermogravimetry (TG) is frequently used to evaluate thermal degradation of lignin. Pyrolysis of lignin is a highly complex process involving an enormous amount of initial, intermediate and final products. In the midst of all these complexities, a variety of kinetic studies have been conducted, making use of different approaches [22,23,24,25,26]. Faravelli et al. proposed a lignin devolatilization model that allows for the prediction of its degradation rates [22], while Poletto and Zattera applied Kissinger’s method to TG data to study Klason lignin degradation processes [23]. In addition, Jiang et al. extended these studies to alkaline lignin, hydrolytic lignin and organosolv lignin [24]. As shown above, given the interest and complexity of the study of lignin composition and structure, there is a large number of works focused on the kinetic study of pyrolysis processes. Apart from those mentioned above, we can mention the works of Ferdous et al. where the distributed activation energy model was used to analyze the pyrolysis reactions and calculate the kinetic parameters of Alcell and Kraft lignins from TGA [27], as Beis et al. conducted from fast pyrolysis [28]. Additionally from TG data, Manya et al. claim that lignin pyrolysis degradation follows a third-order reaction rate law [29], while Murugan extended the kinetic study to Differential Scanning Calorimetry (DSC) [30]. Recently, numerous papers related to the kinetic study of lignin pyrolysis have appeared [25,31,32,33,34]. It was reported that, due to the heterogeneous features of lignin, its thermal degradation behavior depends on the pyrolysis temperature. Primary pyrolysis reactions were reported around 350 °C while secondary reactions were described in the ranges from 400 to 450 °C and from 550 to 600 °C [13]. However, initial degradation was also reported between 120 and 300 °C [35]. A maximum degradation rate was reported to take place in the 246–259 °C range [30]. Other studies identified three stages of pyrolytic reactions, being one-step isoconversional analysis not suitable to analyze lignin pyrolysis kinetics as it involves multi-step reactions [32]. Despite extensive study on the thermal degradation of lignin, the mechanisms and kinetics of the reaction are still not entirely clear [22]. Therefore, a thorough understanding of the dependence of thermal degradation on temperature and time is crucial to improve efficiency of pyrolysis systems. The interest of this work is to evaluate to what extent it makes sense to study the kinetics of lignin decomposition at different temperatures as if it were the same process or if, on the contrary, degradations at different temperatures should be considered as different processes. From a practical point of view, stairway type tests are tested as a method to evaluate the degradation rates and sample quantities involved at the temperatures of interest.

2. Materials and Methods

The material used for this work was an alkali, a low sulphonate content lignin with Mn = 10,000 and Mw = 60,000, which was purchased from Aldrich.
A TA Instruments SDT 2950 was used for all experiments. It is a simultaneous DSC-TGA instrument that has thermocouples in contact with the sample and reference capsules, and therefore measures the sample temperature more directly than pure TGA instruments, in which the thermocouple is located close to, but not in direct contact with, the sample.
Samples of about 10 mg were placed into open alumina crucibles. A purge of N2 was used at a rate of 100 mL/min in all experiments. Three types of experiments were done:
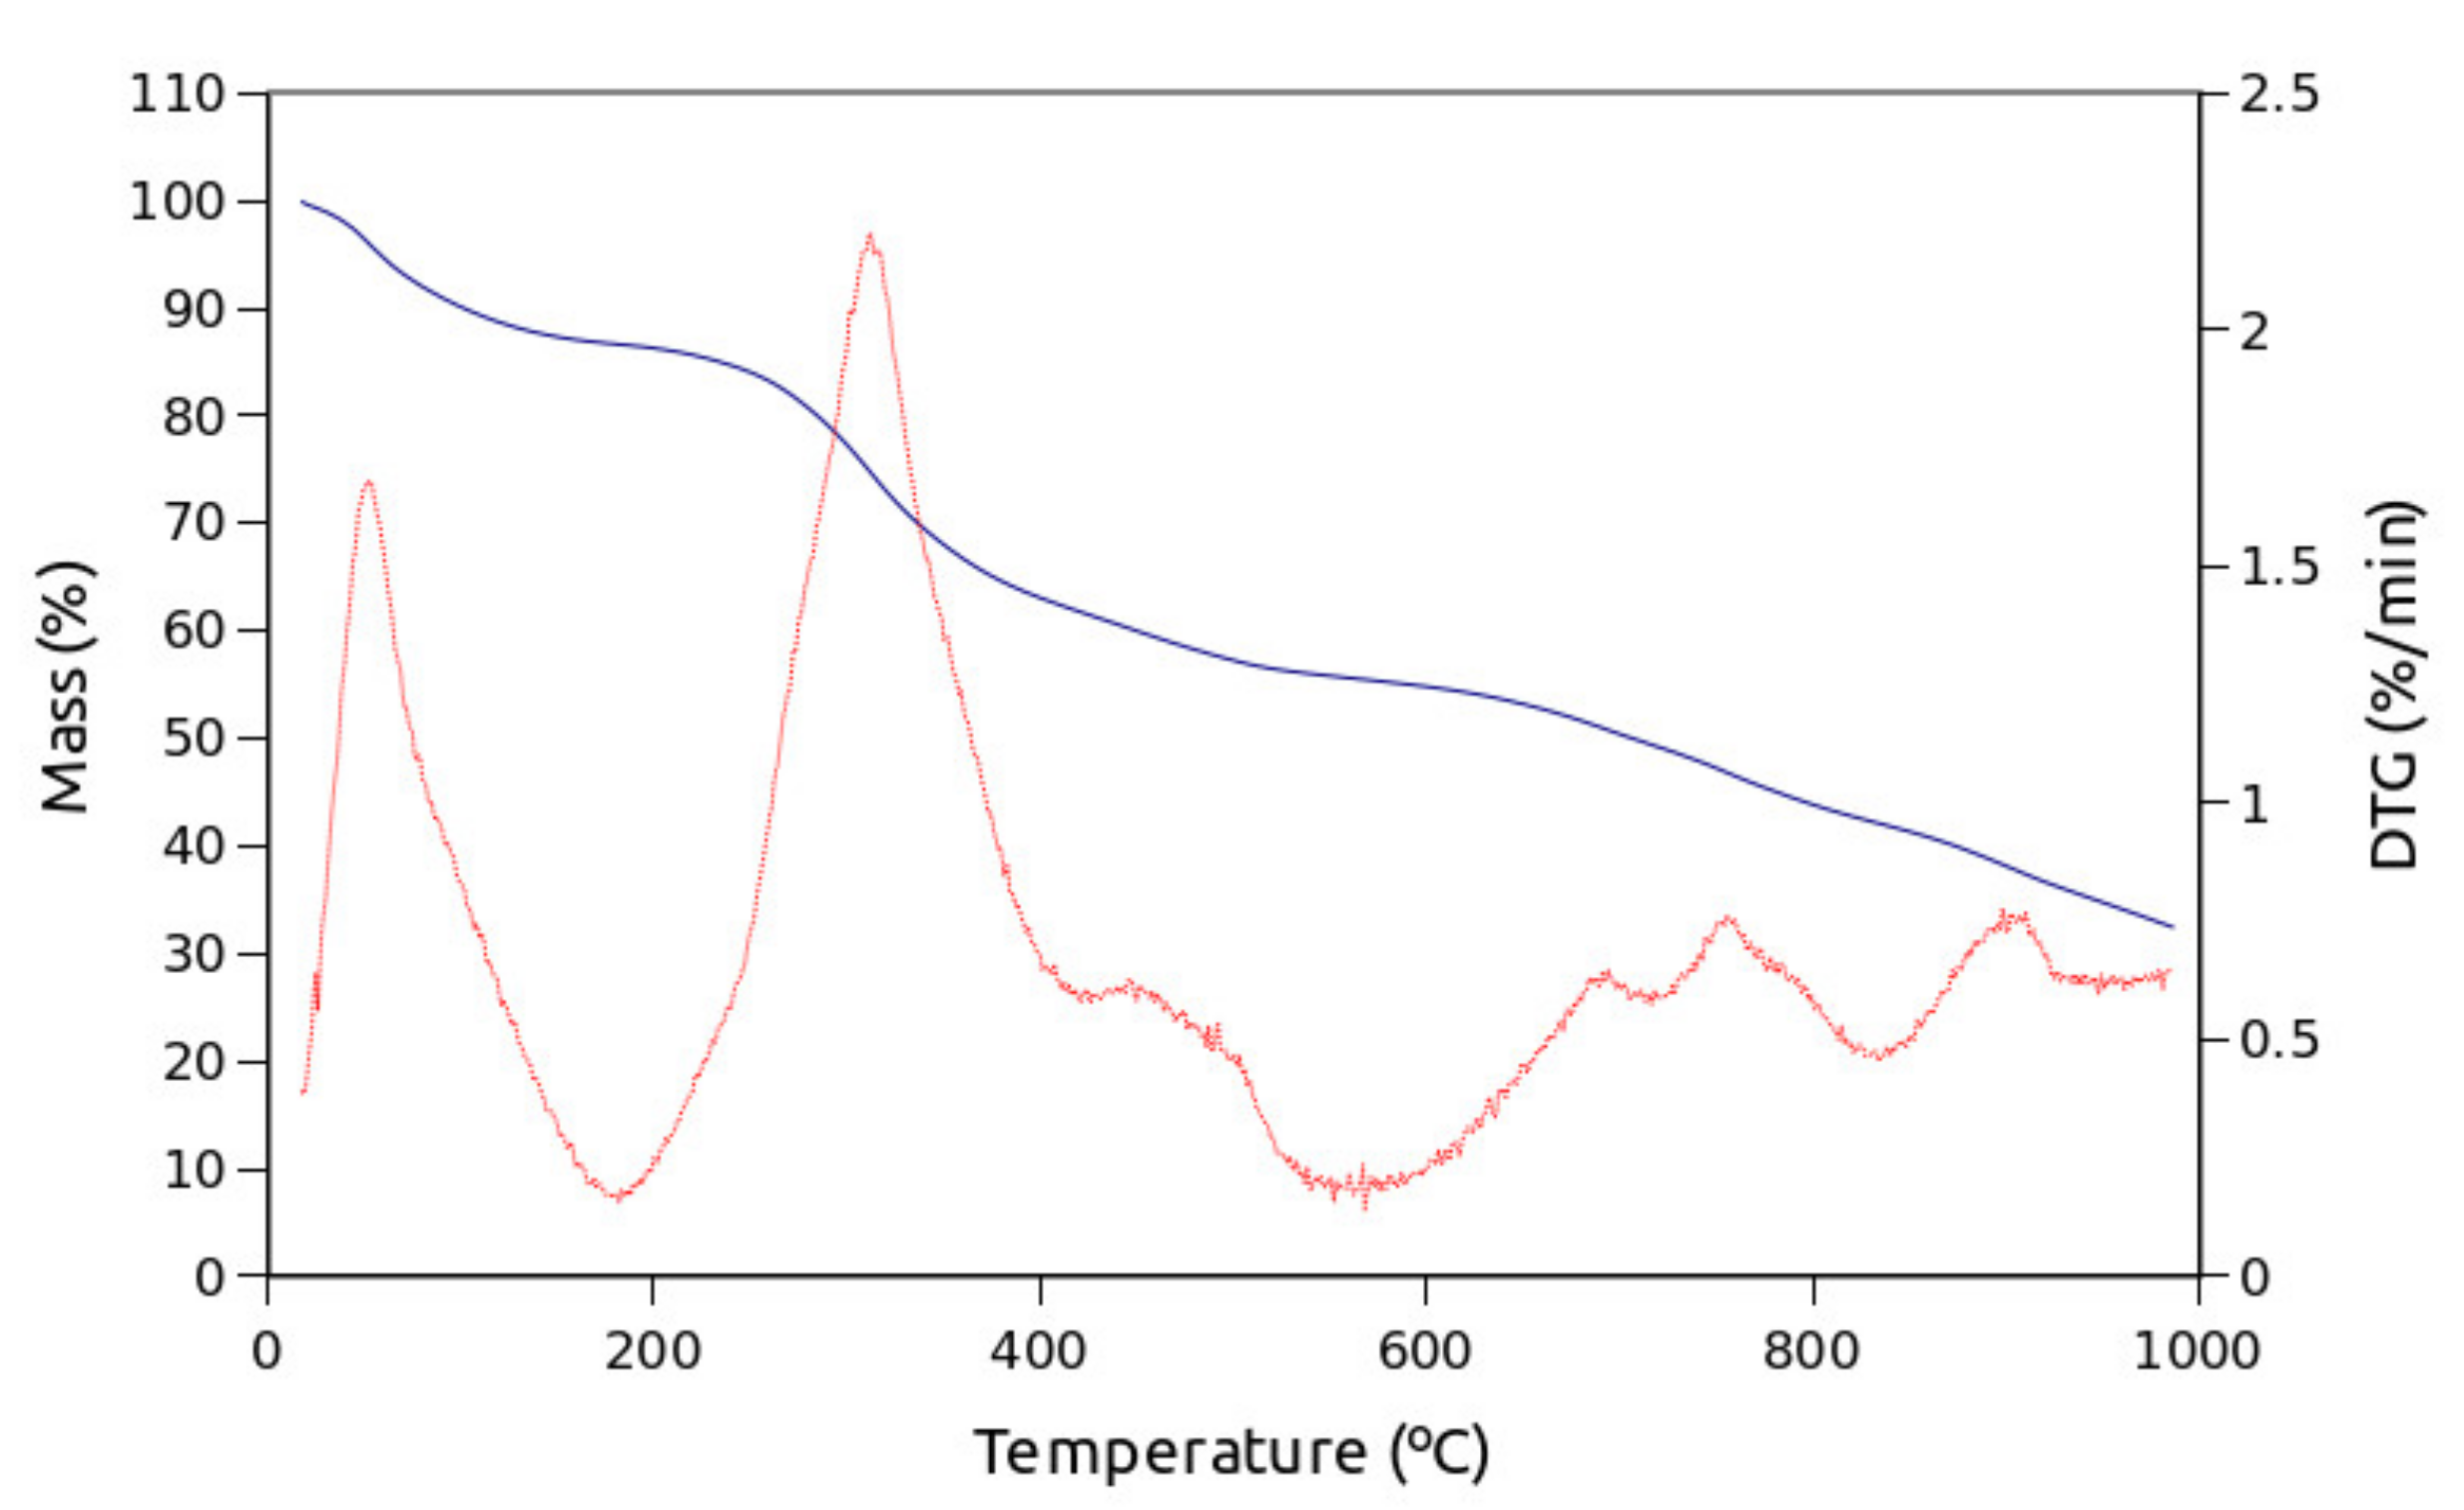
Linear heating. A constant 10 °C/min heating rate was applied through the experiment.
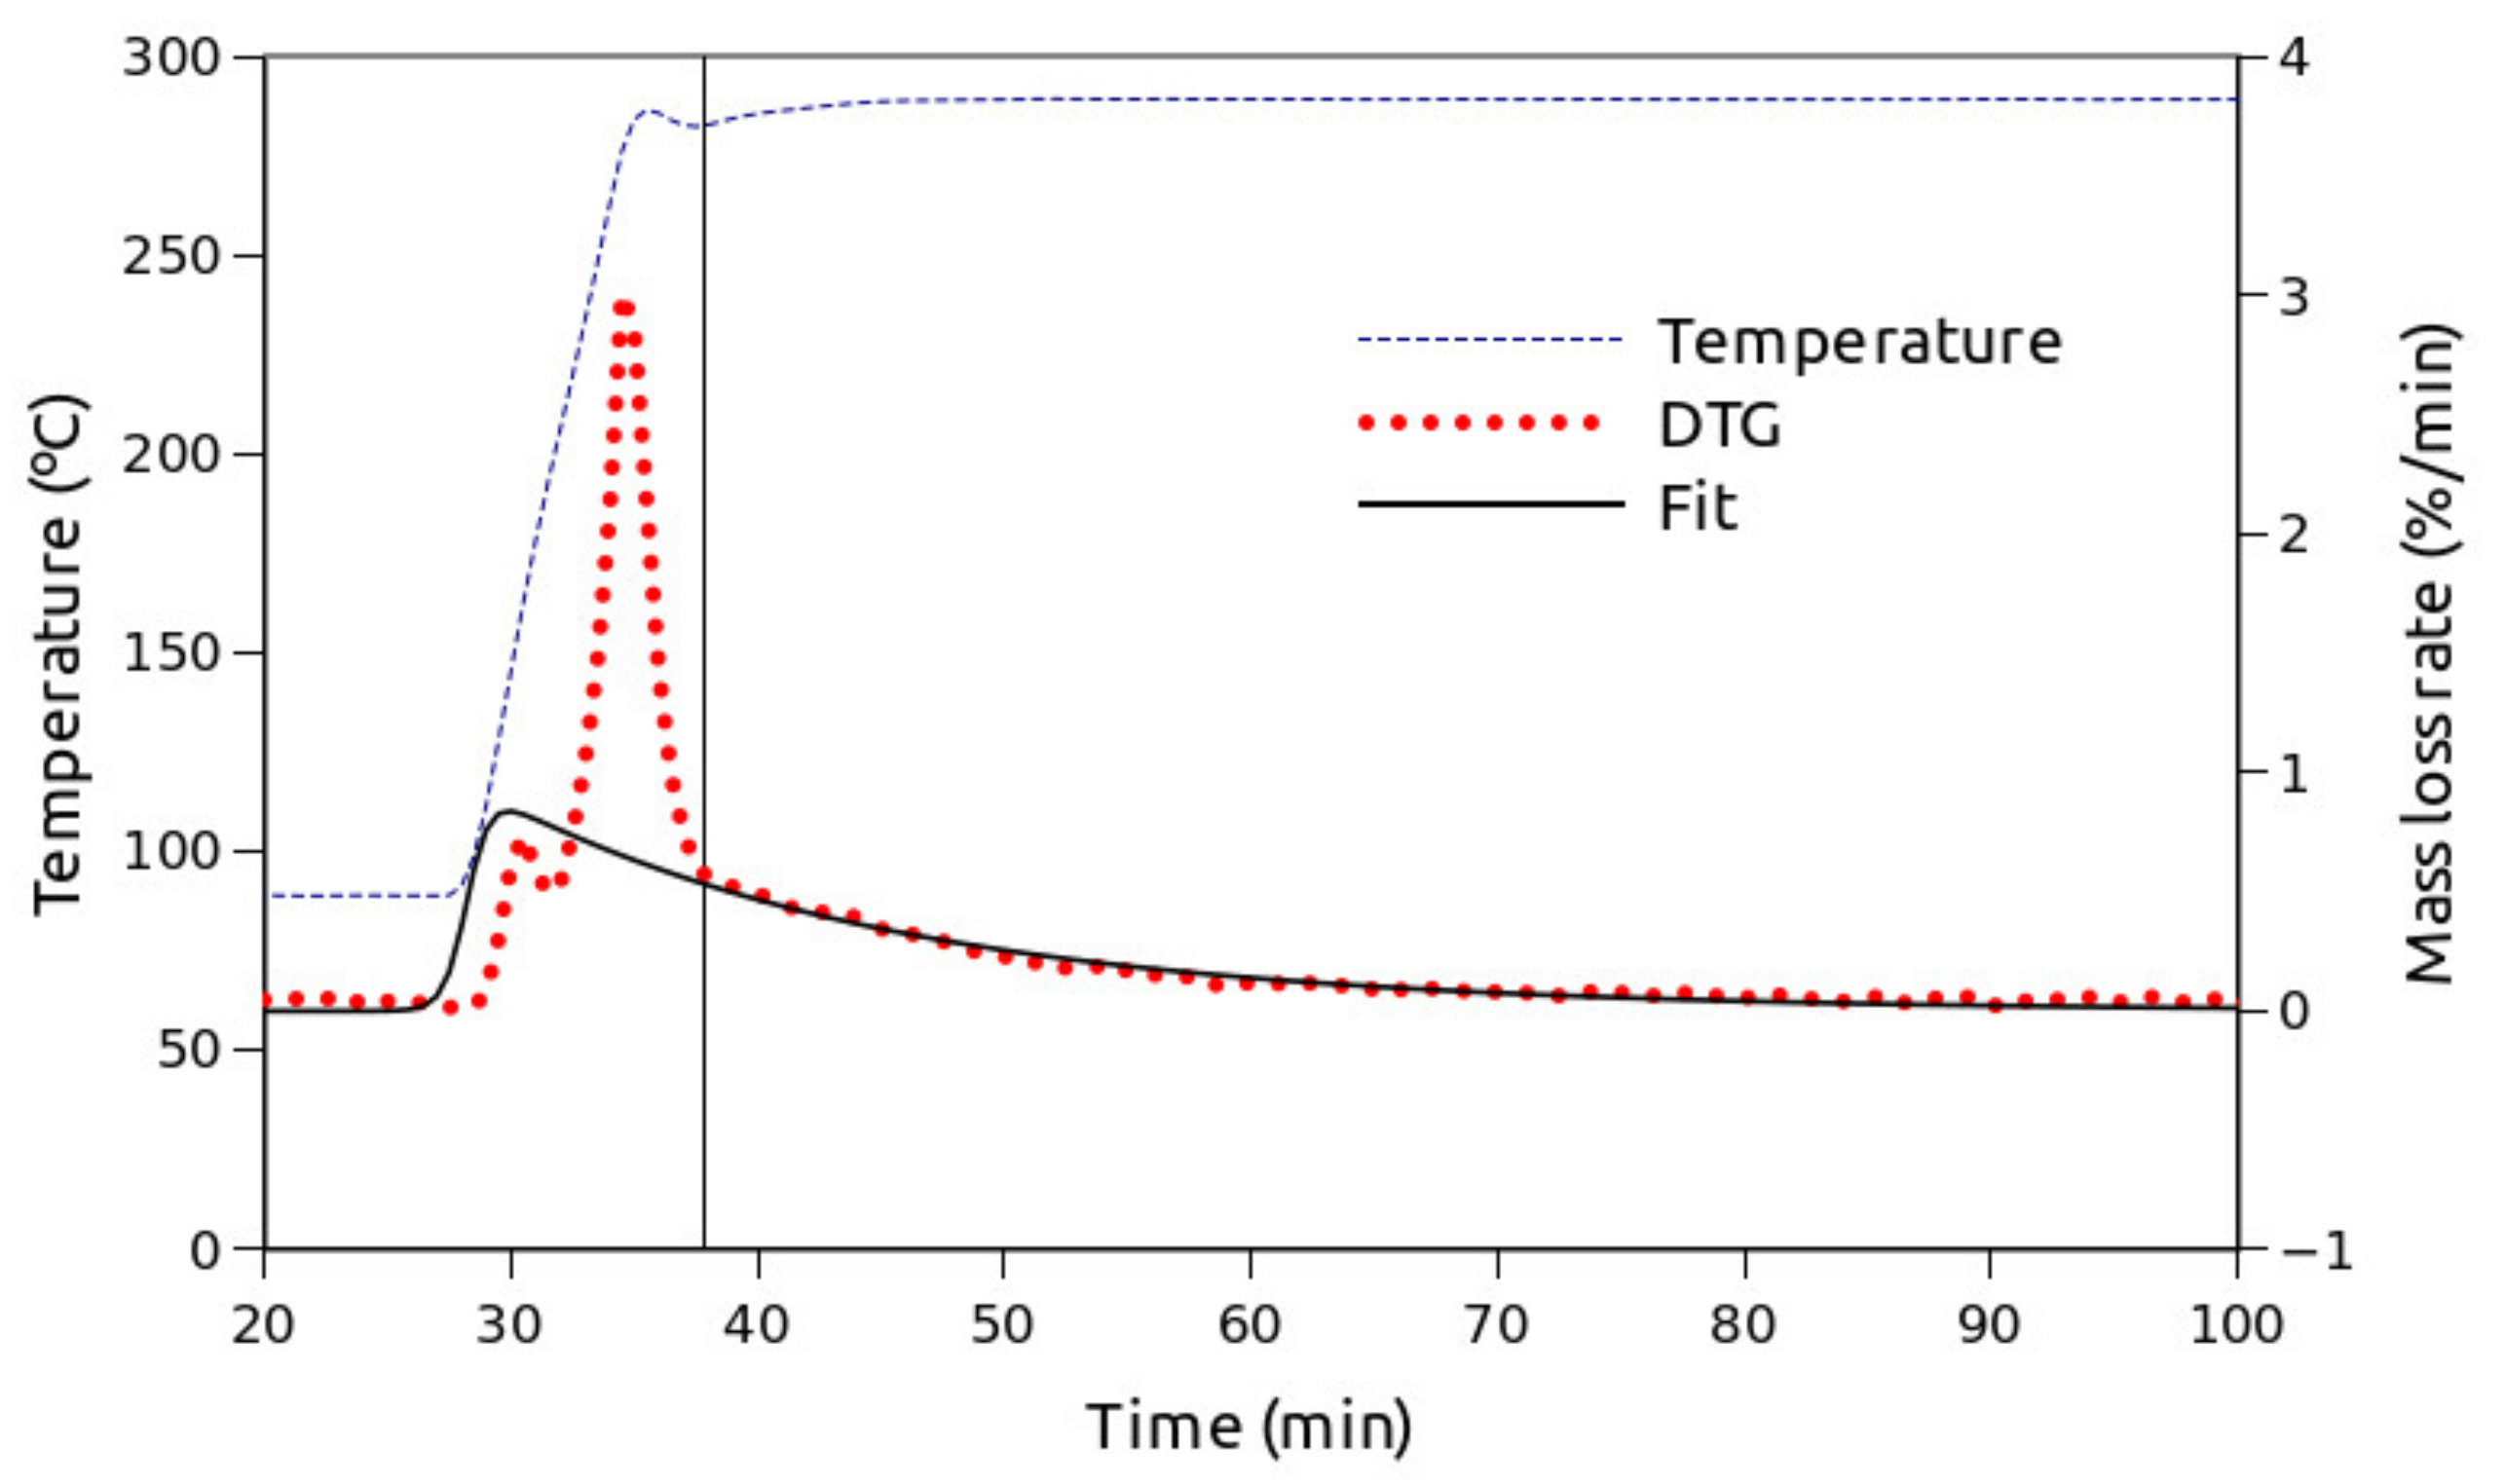
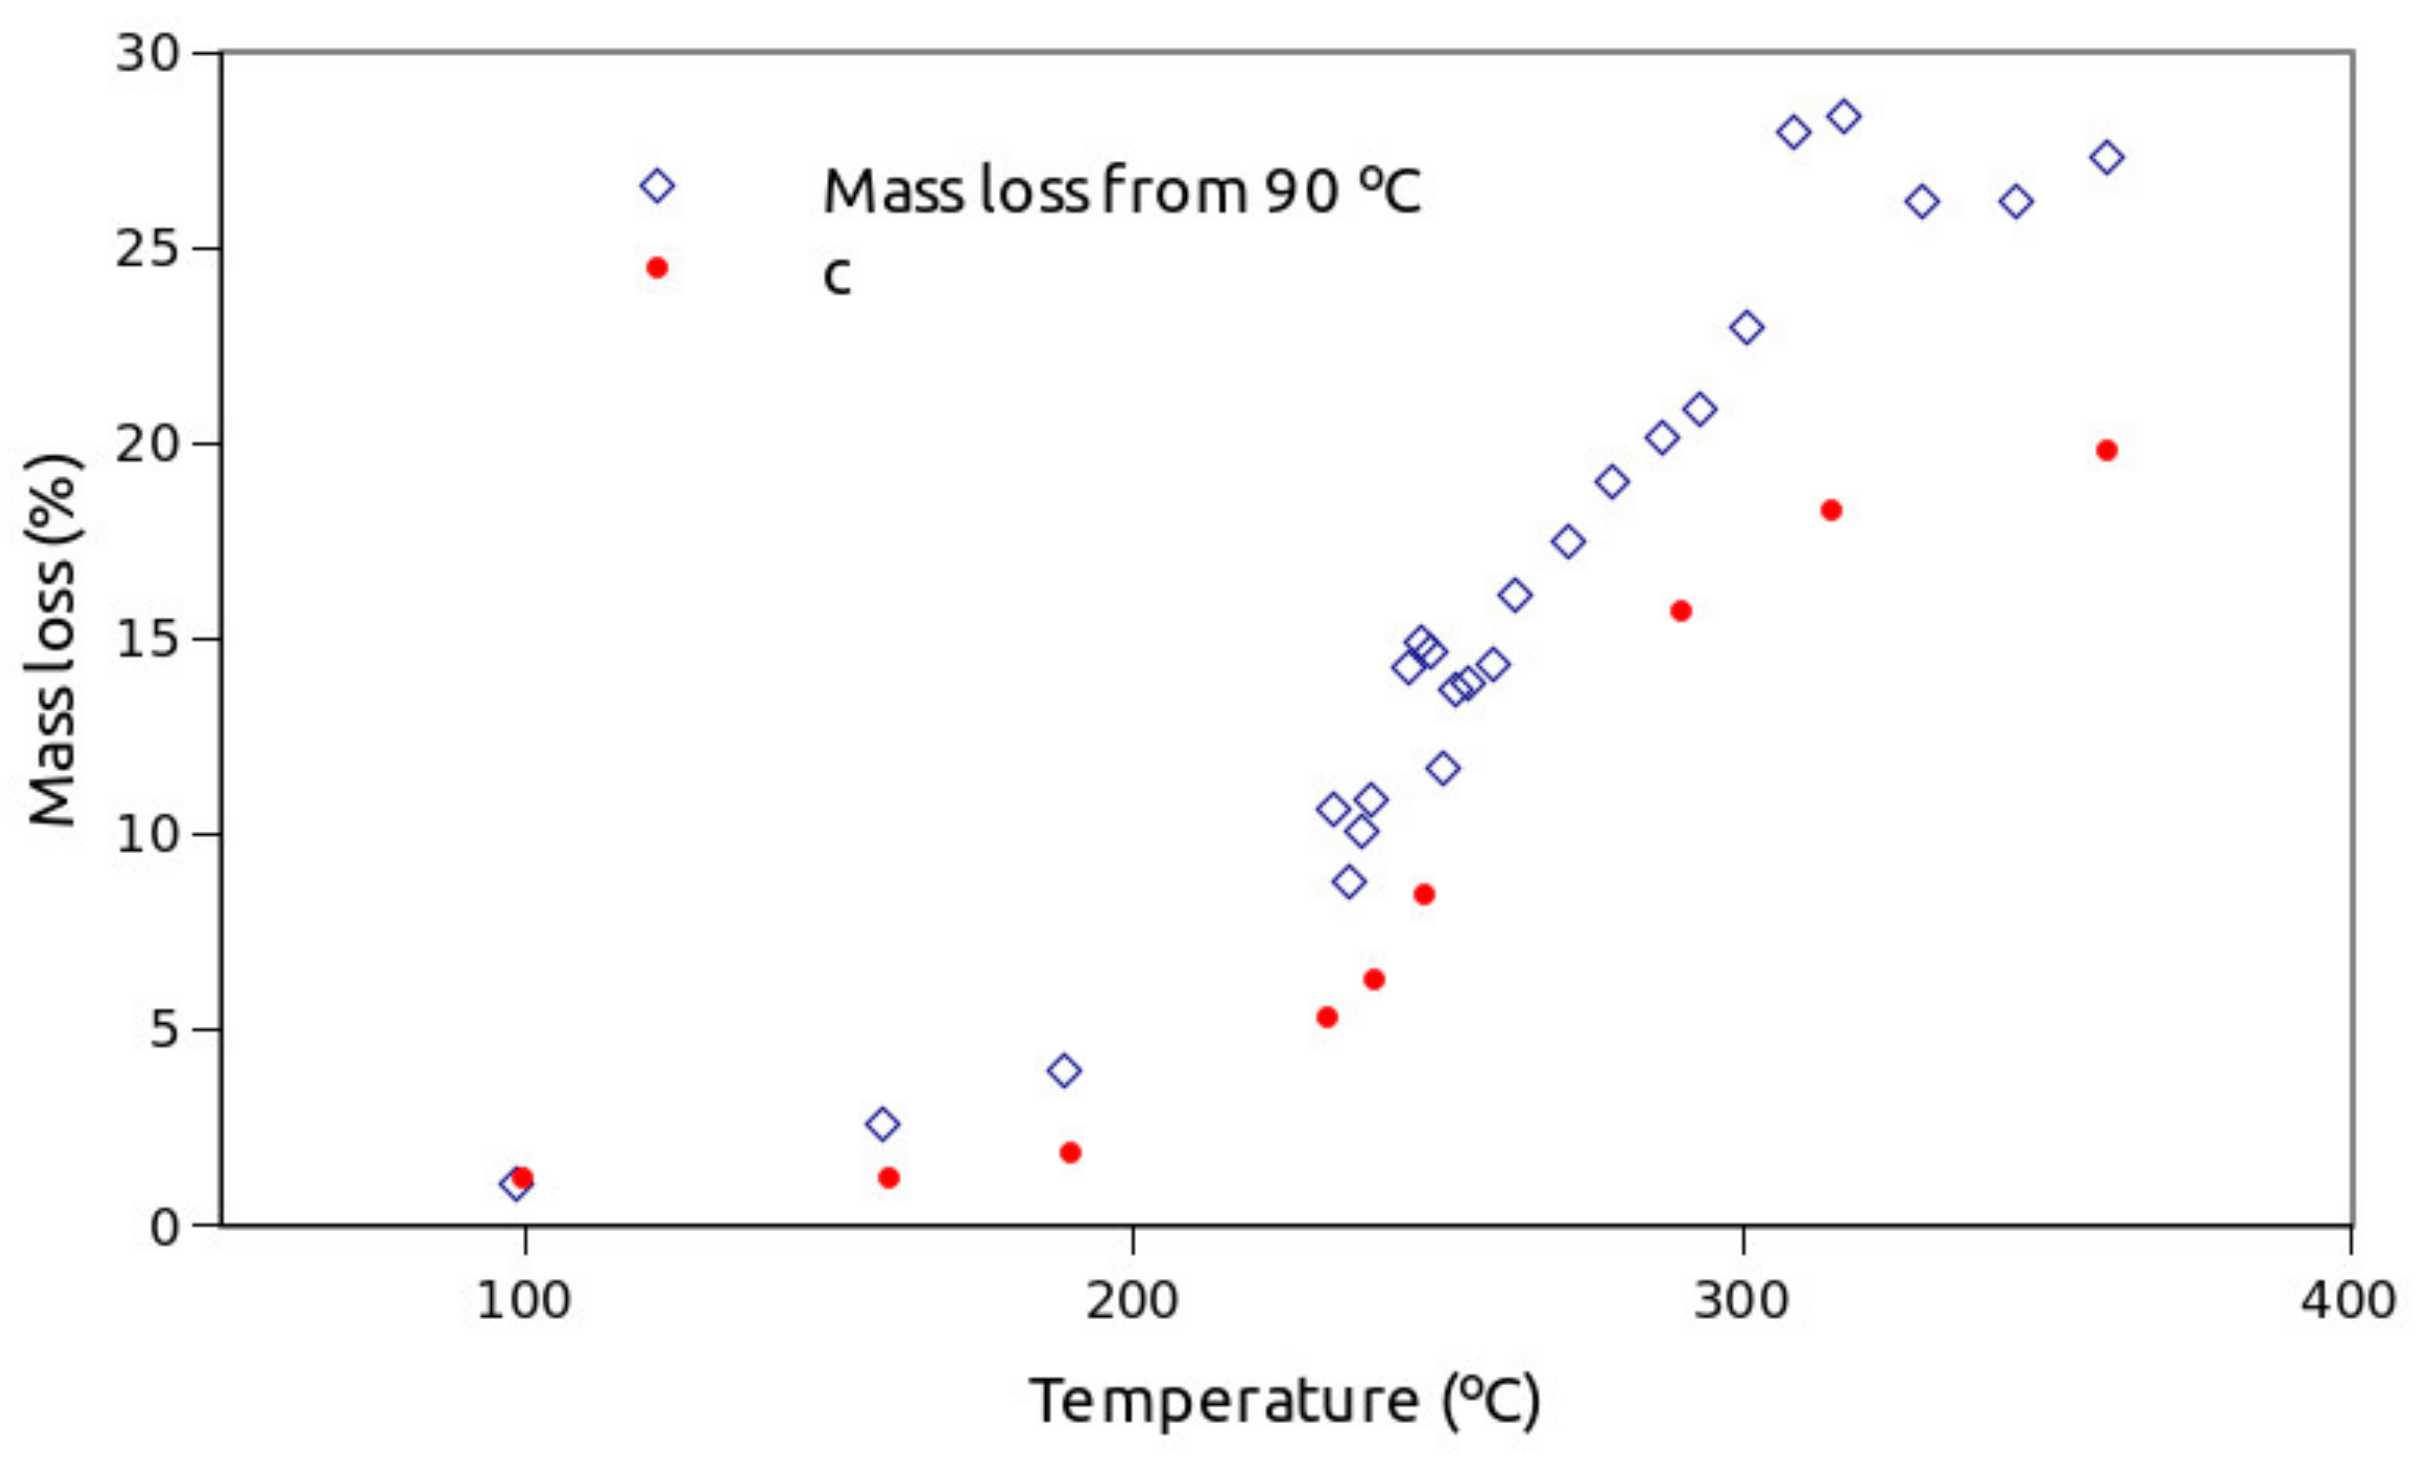
Two-step isothermal experiments. An isothermal step at the desired temperature was preceded by a linear 10 °C/min heating ramp from room temperature to 90 °C, followed by a 20 min isothermal step and a linear 30 °C/min heating step up to the targeted temperature. The experiment was then allowed to continue until a clear trend of the mass evolution with time was observed.
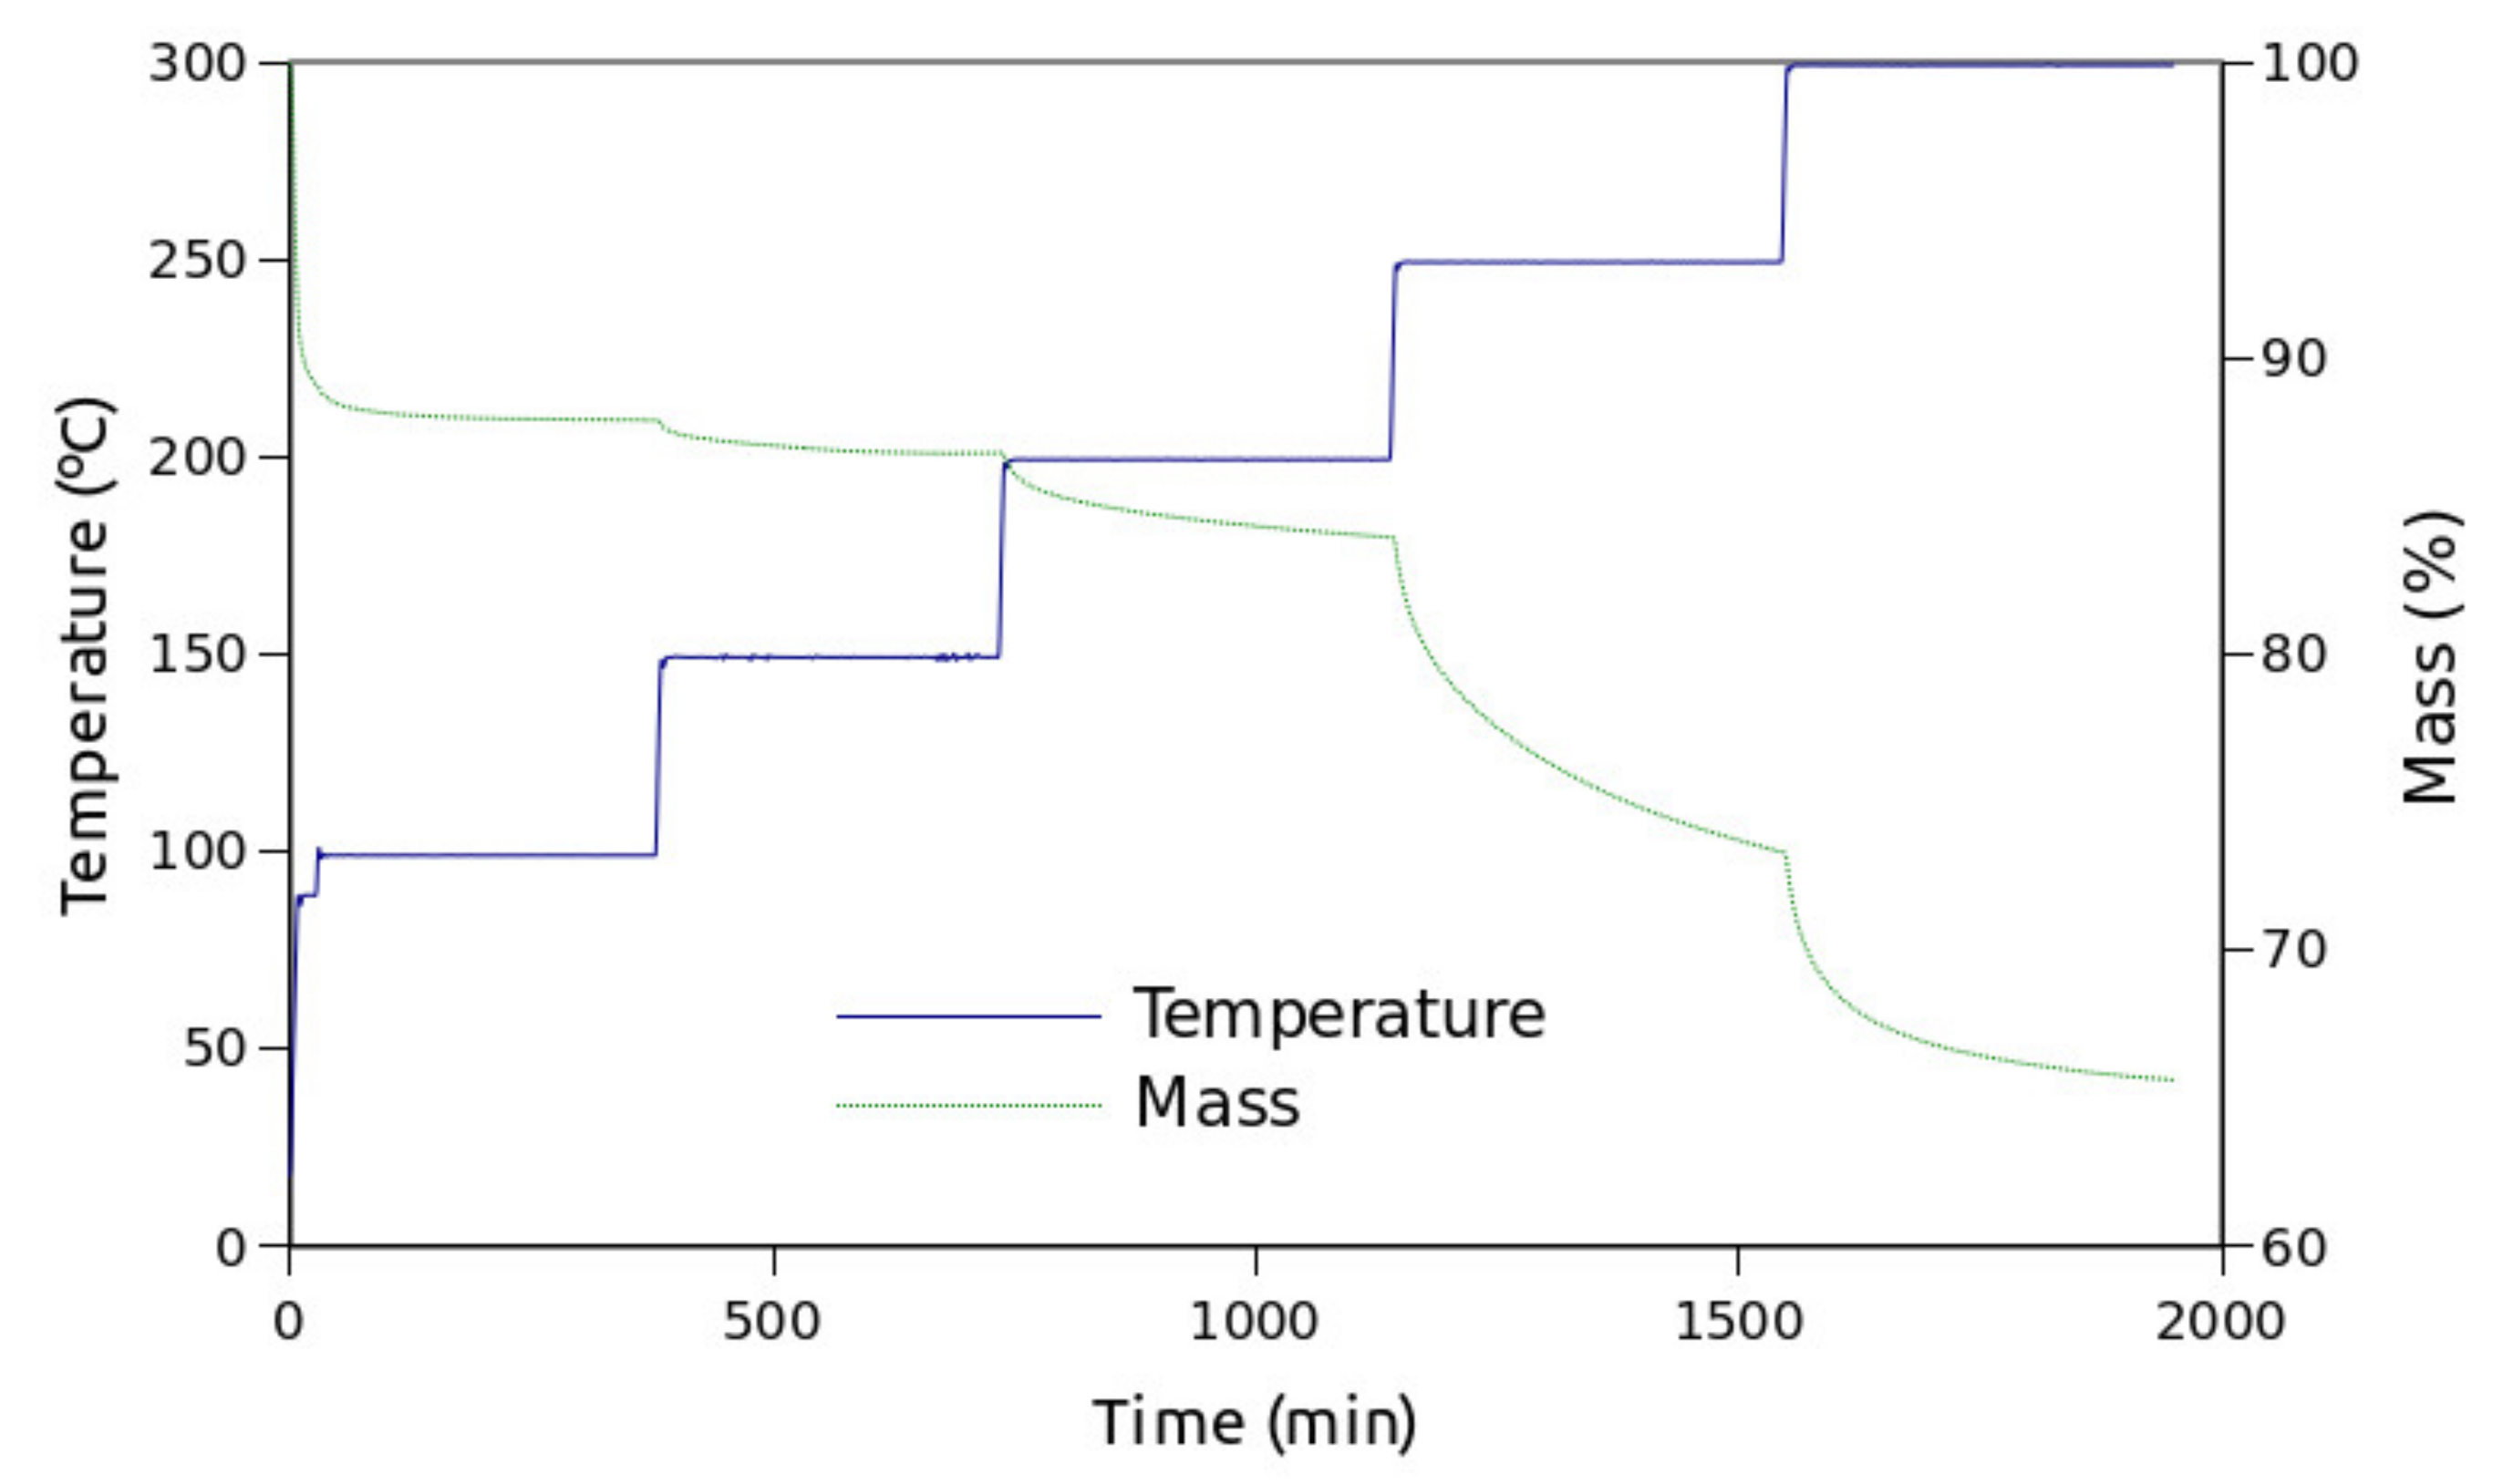
Stairway heating. Isothermal steps at 90, 100, 150, 200, 250 and 300 °C were chained by 10 °C linear heating steps.
The experimentally obtained isothermal time derivative TG (DTG) curves were fitted by a time derivative logistic function. This function is suitable for accurately representing degradation curves of cellulose and other polymers accurately [36,37,38].

3. Results

Figure 1 shows a TG plot together with a DTG plot obtained from a 10 °C/min linear heating ramp of lignin. The strongly overlapping mass loss processes can be easily identified as peaks and shoulders in the DTG curve. The processes appear predominantly grouped in three temperature ranges: (a) from the beginning of the experiment to approximately 185 °C, (b) from 185 to 565 °C and (c) from 565 to the end of the experiment. The peak with maximum at 58 °C mainly corresponds to water. There is a shoulder in this peak at about 100 °C that can be assigned to volatile compounds other than water. Some initial degradation reactions were also reported in this temperature range [35]. In the 185–565 °C range a maximum is observed at 315 °C. This peak along with a small shoulder in the low temperature side can be assigned to primary pyrolysis reactions, while a big shoulder in the 400–565 °C range can be assigned to secondary reactions [13]. Strongly overlapping processes also appear in the high temperature range, above 565 °C. These processes correspond to further degradation of char and were not concluded at 1000 °C. Figure 2 shows an overlay of the TG and temperature curves obtained from the two-step isothermal tests. During the first isothermal step, the measured temperature was practically the same in all experiments. Differences in mass between experiments during that step are not relevant compared to the degradation process and come from sample variability. A vertical line in the temperature and mass plots helps to see that the higher the target temperature, the longer the time needed to reach that target temperature. Simultaneously, a higher mass loss is observed for higher target temperatures. It can be observed how the mass tends to stabilize more slowly at temperatures in the middle range. A close look at the ramp transition to the isothermal state, Figure 3, allows one to see that before the temperature stabilizes, a temperature oscillation occurs. Simultaneously to that temperature oscillation, the DTG curve shows that the process triggered during the ramp has not yet entered a stable condition. For this reason, only the data to the right of the vertical line in this figure were used to fit the time derivative generalized logistic function. It can be seen that the fit line matches quite well with the DTG curve to the right of the vertical line. Figure 4 shows how the mass loss as measured from the end of the first isothermal step to the end of the experiment increases with temperature. The mass loss obtained from the isothermal segment fits of the DTG curves, represented by the c parameter of Equation (1), is also displayed on the same figure. Figure 5 plots the rate factor values, represented by the b parameter of Equation (1), obtained from the fittings with respect to the temperature at which each isotherm took place. Figure 6 represents the TG curve obtained in a stairway heating along with temperature. It is clearly seen that the mass losses below 250 °C are little in comparison with those at 250 °C and 300 °C.

4. Discussion

Figure 1 shows that when the sample is subjected to linear heating, there are several strongly overlapping mass loss processes. It is important to note that the DTG curve does not reach a zero value at any time, confirming that all mass loss processes overlap at least with one other. The mass loss observed in the range from room temperature to about 186 °C, with maximum at 72 °C, can be attributed to water evaporation. However, there is a significant asymmetry in the DTG peak, with a shoulder on the right side that can be attributed to other volatiles. A major degradation step, with a maximum at 317 °C, is consistent with primary pyrolysis reactions. A prominent shoulder in the 425 to 570 °C can be assigned to secondary lignin pyrolysis reactions [13]. Assuming that the process with maximum at 72 °C mainly corresponds to water and minor volatiles, an isothermal step at 90 °C was maintained for 20 min in all two-step isothermal tests. That step is aimed to minimize any possible overlap of the first mass loss process with the primary pyrolysis. Figure 2 shows the TG curves obtained in these two-step isothermal tests. In principle, if what was being studied at different temperatures after the 90 °C step was a single process, the mass loss measured from the end of the 90 °C step to the end of the experiment would be the same, although the time required to obtain the constant mass would be shorter at higher temperatures. However, the plots of Figure 2 show a different mass loss at each temperature, which suggests that different mass loss processes exist at different temperatures. Being different processes, the temperature dependence can be different from one to another. In addition, some of the processes may co-exist at some temperatures, which would add complexity to a possible kinetic interpretation. That is consistent with the fact that lignin is a complex compound. Thus, different lignin fractions may behave differently in respect of thermal stability. It can be observed that for temperatures below 187 and above 285 °C, a constant mass is practically reached in the experimental time. But, at temperatures between 187 and 289 °C, a constant mass is not reached in the same period of time. That is an indication that, in that temperature range, reactions occur at a much slower rate. It is also observed that, when enough time is provided, different amounts of residue are obtained at different temperatures. This confirms that the sample fractions involved in processes occurring at different temperatures is also different. In general, these isothermal TG curves seem to follow asymptotic trends, which can be reproduced by generalized logistic functions. In line with previous works, fitting on DTG curves is preferred to that on TG curves in order to better reproduce the mass loss rate [36,37,38]. Thus, time-derivative generalized logistic functions were used to fit the segments of DTG curves obtained under isothermal conditions. These functions can be written as
y(t) = (c ⋅ b ⋅ exp(−b⋅(tapm − t)))/(1 + τ ⋅ exp(−b⋅(tapm − t))) (1+τ)/τ
where c represents the area of the peak, tapm is the time at the peak maximum, b is a rate factor and τ is a symmetry factor. Thus, c, represents the mass loss involved in the process, and the same value of c should be obtained for the same process at any temperature. The higher the extent of the process recorded under isothermal conditions, the higher the possibility of comparing the shape of the fitting with that of the DTG curve. Although, ideally, the whole process could be recorded under isothermal conditions, in practice, that is not possible. In the experiments presented in Figure 2, the TG curves show that an important part of the process took place along the ramp step preceding the isotherm. Nevertheless, the c parameter represents the mass loss of a single process as a whole, no matter if only a part of the process is used for the fitting. Consequently, apart from reliability, the fact of including a higher or lower extent of the process in the fitting does not affect the value of c. The fitting of each of the isothermal curves was performed with the Gnumeric software by means of the NLsolve algorithm [39]. Figure 4 shows a comparison of the c values obtained from the fittings with the mass losses measured from the end of the isothermal step at 90 °C to the end of the experiment. While at 97 °C the value of c practically matches that of the measured mass losses, there is an increasing difference with temperature so that the measured mass loss is higher than the c parameter. This is a clear indication that the measured mass loss, which is measured from the end of the first isotherm, involves more processes than inferred from the isothermal data used for the fitting. In fact, Figure 3 clearly shows two overlapping peaks that appear to continue during the isothermal step. While the rate factor was expected to grow with temperature, Figure 5 shows a different trend which suggests that important parts of the degradations took place before the isotherm and therefore, could not be used for the fittings. Thus, no reliable kinetics can be extracted from these data, but the isothermal tests provide a better understanding on how different degradation rates can be obtained at different temperatures and why a degradation process can last longer at an intermediate range of temperatures. Finally, Figure 6 clearly shows that, in general, mass tends to stabilize with time at each given temperature step. Then, a further increase in temperature leads to a new mass loss process, and so on, illustrating how different mass loss processes take place at different temperatures. However, it is remarkable that the step at 250 °C involves a higher mass content than the other steps at lower and higher temperatures. It is at that temperature where the highest degradation rate is observed, which is in line with other observations [30]. In addition, the mass stabilization trend observed at 250 °C is slower than that observed at the other temperatures. This can be considered as the result of a significant amount of sample undergoing a process that is relatively slow at that temperature.

5. Conclusions

Thermal degradation of lignin in nitrogen atmosphere was evaluated through linear heating and isothermal tests.
Linear heating suggests that thermal decomposition in the 200–400 °C range mainly consists of a single step; however, isothermal tests indicate that there are different degradation processes within that temperature range. This points to the fact that different lignin fractions have different stabilities. The mass losses that can be obtained at temperatures below 250 °C are little in comparison with those at 250 °C and 300 °C.
It is suggested that practical predictions on thermal stability of lignin cannot be based only on kinetics obtained as if lignin degradations at different temperatures were the same process. Instead, temperature stairway type tests similar to the one used here could be applied to the different types of lignin in order to be able to evaluate their degradation rates and amounts of sample involved at the temperatures of interest.
In the end, isothermal tests provide a better understanding on how different degradation rates can be obtained at different temperatures, and why a degradation process can take a longer time at an intermediate range of temperatures.

Author Contributions

Conceptualization, J.L.-B. and R.A.; methodology, S.N.; software, J.T.-S., A.Á.-G. and A.M.D.-D.; validation, S.N., J.T.-S. and A.M.D.-D.; formal analysis, J.L.-B.; investigation, all authors; resources, J.T.-S., S.N., J.L.-B. and R.A.; data curation, A.Á.-G.; writing—original draft. Preparation, R.A. and J.L.-B.; writing—review and editing, R.A., J.L.-B. and J.T.-S.; visualization, A.M.D.-D. and A.Á.-G.; supervision, S.N., J.T.-S. and J.L.-B.; project administration, R.A.; funding acquisition, all authors. All authors have read and agreed to the published version of the manuscript.

Funding

This research was funded by MINECO, grant number MTM2017-82724-R and by Xunta de Galicia (Grupos de Referencia Competitiva ED431C-2020-14 and Centro de Investigación del Sistema universitario de Galicia ED431G 2019/01), all of them through the ERDF.

Institutional Review Board Statement

Not applicable.

Informed Consent Statement

Not applicable.

Data Availability Statement

Not applicable.

Acknowledgments

The authors would like to thank the Spanish Ministry of Economy and Competitiveness (MINECO) and the Xunta de Galicia for funding this research.

Conflicts of Interest

The authors declare no conflict of interest.

References

  1. Liu, Q.; Luo, L.; Zheng, L. Lignins: Biosynthesis and Biological Functions in Plants. Int. J. Mol. Sci. 2018, 19, 335. [Google Scholar] [CrossRef] [PubMed] [Green Version]
  2. Ralph, J.; Lapierre, C.; Boerjan, W. Lignin structure and its engineering. Curr. Opin. Biotechnol. 2019, 56, 240–249. [Google Scholar] [CrossRef]
  3. Vanholme, R.; Demedts, B.; Morreel, K.; Ralph, J.; Boerjan, W. Lignin Biosynthesis and Structure. Plant Physiol. 2010, 153, 895–905. [Google Scholar] [CrossRef] [Green Version]
  4. Olsson, A.-M.; Salmén, L. The effect of lignin composition on the viscoelastic properties of wood. Nord. Pulp Pap. Res. J. 1997, 12, 140–144. [Google Scholar] [CrossRef]
  5. Bonawitz, N.D.; Chapple, C. The Genetics of Lignin Biosynthesis: Connecting Genotype to Phenotype. Annu. Rev. Genet. 2010, 44, 337–363. [Google Scholar] [CrossRef]
  6. Amthor, J.S. Efficiency of Lignin Biosynthesis: A Quantitative Analysis. Ann. Bot. 2003, 91, 673–695. [Google Scholar] [CrossRef] [Green Version]
  7. Boerjan, W.; Ralph, J. Editorial overview: Plant biotechnology-lignin engineering. Curr. Opin. Biotechnol. 2019, 56, 3–5. [Google Scholar] [CrossRef]
  8. Chabannes, M.; Ruel, K.; Yoshinaga, A.; Chabbert, B.; Jauneau, A.; Joseleau, J.-P.; Boudet, A.-M. In situ analysis of lignins in transgenic tobacco reveals a differential impact of individual transformations on the spatial patterns of lignin deposition at the cellular and subcellular levels: In Situ Analysis of Lignin Deposition. Plant J. 2001, 28, 271–282. [Google Scholar] [CrossRef] [PubMed] [Green Version]
  9. Vanholme, R.; Morreel, K.; Darrah, C.; Oyarce, P.; Grabber, J.H.; Ralph, J.; Boerjan, W. Metabolic engineering of novel lignin in biomass crops. N. Phytol. 2012, 196, 978–1000. [Google Scholar] [CrossRef] [PubMed] [Green Version]
  10. Lora, J.H.; Glasser, W.G. Recent Industrial Applications of Lignin: A Sustainable Alternative to Nonrenewable Materials. J. Polym. Environ. 2002, 10, 39–48. [Google Scholar] [CrossRef]
  11. Lignin.Org-Dialogue/Newsletters. Available online: https://web.archive.org/web/20071009010219/http://www.lignin.org/01augdialogue.html (accessed on 11 May 2021).
  12. Xu, M.; Khachatryan, L.; Kibet, J.; Lomnicki, S. Lumped kinetic modeling of isothermal degradation of lignin under conventional pyrolytic and oxidative conditions. J. Anal. Appl. Pyrolysis 2017, 127, 377–384. [Google Scholar] [CrossRef]
  13. Kawamoto, H. Lignin pyrolysis reactions. J. Wood Sci. 2017, 63, 117–132. [Google Scholar] [CrossRef] [Green Version]
  14. Grossman, A.; Vermerris, W. Lignin-based polymers and nanomaterials. Curr. Opin. Biotechnol. 2019, 56, 112–120. [Google Scholar] [CrossRef] [PubMed]
  15. Lotfi, S.; Mollaabbasi, R.; Patience, G.S. Kinetics of softwood kraft lignin inert and oxidative thermolysis. Biomass Bioenergy 2018, 109, 239–248. [Google Scholar] [CrossRef]
  16. Mottiar, Y.; Vanholme, R.; Boerjan, W.; Ralph, J.; Mansfield, S. Designer lignins: Harnessing the plasticity of lignification. Curr. Opin. Biotechnol. 2016, 37, 190–200. [Google Scholar] [CrossRef] [Green Version]
  17. Gupta, C.; Washburn, N.R. Polymer-Grafted Lignin Surfactants Prepared via Reversible Addition–Fragmentation Chain-Transfer Polymerization. Langmuir 2014, 30, 9303–9312. [Google Scholar] [CrossRef]
  18. Kim, Y.S.; Kadla, J.F. Preparation of a Thermoresponsive Lignin-Based Biomaterial through Atom Transfer Radical Polymerization. Biomacromolecules 2010, 11, 981–988. [Google Scholar] [CrossRef]
  19. Kai, D.; Zhang, K.; Jiang, L.; Wong, H.Z.; Li, Z.; Zhang, Z.; Loh, X.J. Sustainable and Antioxidant Lignin–Polyester Copolymers and Nanofibers for Potential Healthcare Applications. ACS Sustain. Chem. Eng. 2017, 5, 6016–6025. [Google Scholar] [CrossRef]
  20. Kouisni, L.; Gagné, A.; Maki, K.; Holt-Hindle, P.; Paleologou, M. LignoForce System for the Recovery of Lignin from Black Liquor: Feedstock Options, Odor Profile, and Product Characterization. ACS Sustain. Chem. Eng. 2016, 4, 5152–5159. [Google Scholar] [CrossRef]
  21. Zaman, C.Z.; Pal, K.; Yehye, W.A.; Sagadevan, S.; Shah, S.T.; Adebisi, G.A.; Marliana, E.; Rafique, R.F.; Bin Johan, R. Pyrolysis: A Sustainable Way to Generate Energy from Waste. In Pyrolysis; Samer, M., Ed.; InTech: London, UK, 2017; ISBN 978-953-51-3311-7. [Google Scholar]
  22. Faravelli, T.; Frassoldati, A.; Migliavacca, G.; Ranzi, E. Detailed kinetic modeling of the thermal degradation of lignins. Biomass Bioenergy 2010, 34, 290–301. [Google Scholar] [CrossRef]
  23. Poletto, M.; Zattera, A.J. Materials produced from plant biomass: Part III: Degradation kinetics and hydrogen bonding in lignin. Mater. Res. 2013, 16, 1065–1070. [Google Scholar] [CrossRef] [Green Version]
  24. Jiang, G.; Nowakowski, D.; Bridgwater, T. A systematic study of the kinetics of lignin pyrolysis. Thermochim. Acta 2010, 498, 61–66. [Google Scholar] [CrossRef]
  25. Dussan, K.; Dooley, S.; Monaghan, R. A model of the chemical composition and pyrolysis kinetics of lignin. Proc. Combust. Inst. 2019, 37, 2697–2704. [Google Scholar] [CrossRef]
  26. Cho, J.; Chu, S.; Dauenhauer, P.J.; Huber, G.W. Kinetics and reaction chemistry for slow pyrolysis of enzymatic hydrolysislignin and organosolv extracted lignin derived from maplewood. Green Chem. 2012, 14, 428–439. [Google Scholar] [CrossRef] [Green Version]
  27. Ferdous, D.; Dalai, A.K.; Bej, S.K.; Thring, R.W. Pyrolysis of Lignins: Experimental and Kinetics Studies. Energy Fuels 2002, 16, 1405–1412. [Google Scholar] [CrossRef]
  28. Beis, S.; Mukkamala, S.; Hill, N.; Joseph, J.; Baker, C.; Jensen, B.; Stemmler, E.; Wheeler, C.; Frederick, B.G.; Heiningen, A.; et al. Fast Pyrolysis of Lignins. Bioresources 2010, 5, 1408–1424. [Google Scholar]
  29. Manyà, J.J.; Velo, A.E.; Puigjaner, L. Kinetics of Biomass Pyrolysis: A Reformulated Three-Parallel-Reactions Model. Ind. Eng. Chem. Res. 2003, 42, 434–441. [Google Scholar] [CrossRef]
  30. Murugan, P.; Mahinpey, N.; Johnson, K.E.; Wilson, M. Kinetics of the Pyrolysis of Lignin Using Thermogravimetric and Differential Scanning Calorimetry Methods. Energy Fuels 2008, 22, 2720–2724. [Google Scholar] [CrossRef]
  31. Huang, Y.; Kuan, W.; Chiueh, P.; Lo, S. A sequential method to analyze the kinetics of biomass pyrolysis. Bioresour. Technol. 2011, 102, 9241–9246. [Google Scholar] [CrossRef]
  32. Yeo, J.Y.; Chin, B.L.F.; Tan, J.K.; Loh, Y.S. Comparative studies on the pyrolysis of cellulose, hemicellulose, and lignin based on combined kinetics. J. Energy Inst. 2019, 92, 27–37. [Google Scholar] [CrossRef]
  33. Ojha, D.K.; Viju, D.; Vinu, R. Fast pyrolysis kinetics of alkali lignin: Evaluation of apparent rate parameters and product time evolution. Bioresour. Technol. 2017, 241, 142–151. [Google Scholar] [CrossRef] [PubMed]
  34. Yanez-McKay, A.J.; Natarajan, P.; Li, W.; Mabon, R.; Broadbelt, L.J. Coupled Structural and Kinetic Model of Lignin Fast Pyrolysis. Energy Fuels 2018, 32, 1822–1830. [Google Scholar] [CrossRef]
  35. Fenner, R.A.; Lephardt, J.O. Examination of the thermal decomposition of kraft pine lignin by Fourier transform infrared evolved gas analysis. J. Agric. Food Chem. 1981, 29, 846–849. [Google Scholar] [CrossRef]
  36. López-Beceiro, J.; Álvarez-García, A.; Martins, S.; Zaragoza, S.; Menéndez-Valdés, J.; Artiaga, R. Thermal degradation kinetics of two acrylic-based copolymers. J. Therm. Anal. Calorim. 2015, 119, 1981–1993. [Google Scholar] [CrossRef]
  37. López-Beceiro, J.; Álvarez-García, A.; Sebio-Puñal, T.; Zaragoza, S.; Díaz-Díaz, A.; Janeiro, J.; Artiaga, R.; Álvarez-García, B. Kinetics of Thermal Degradation of Cellulose: Analysis Based on Isothermal and Linear Heating Data. BioResources 2016, 11, 5870–5888. [Google Scholar] [CrossRef] [Green Version]
  38. López-Beceiro, J.; Díaz-Díaz, A.; Álvarez-García, A.; Tarrío-Saavedra, J.; Naya, S.; Artiaga, R. A Logistic Approach for Kinetics of Isothermal Pyrolysis of Cellulose. Processes 2021, 9, 551. [Google Scholar] [CrossRef]
  39. Nash, J.C. Spreadsheets in Statistical Practice—Another Look. Am. Stat. 2006, 60, 287–289. [Google Scholar] [CrossRef]
Figure 1. TG and DTG plots obtained from a 10 ºC/min linear heating ramp of lignin.
Processes 09 01154 g001
Figure 2. Overlays of TG (a) and temperature (b) curves obtained from 12 two-step isothermal tests.
Processes 09 01154 g002
Figure 3. Plot of the fitting of a DTG curve by a time derivative generalized logistic function.
Processes 09 01154 g003
Figure 4. Plot of the mass loss obtained in isotherms versus the temperature of the isotherm.
Processes 09 01154 g004
Figure 5. Plot of the rate factor obtained from the fittings versus the temperature at which the isotherms were performed.
Processes 09 01154 g005
Figure 6. TG plots obtained in a stairway heating.
Processes 09 01154 g006
Publisher’s Note: MDPI stays neutral with regard to jurisdictional claims in published maps and institutional affiliations.

