Article

Advanced Kinetic Modeling of Bio-co-polymer Poly(3-hydroxybutyrate-co-3-hydroxyvalerate) Production Using Fructose and Propionate as Carbon Sources

1
Institute for Automation Engineering, Otto von Guericke University Magdeburg, 39106 Magdeburg, Germany
2
Process Synthesis and Process Dynamics, Max Planck Institute for Dynamics of Complex Technical Systems, 39106 Magdeburg, Germany
*
Author to whom correspondence should be addressed.
Processes 2021, 9(8), 1260; https://doi.org/10.3390/pr9081260
Submission received: 29 June 2021 / Revised: 13 July 2021 / Accepted: 15 July 2021 / Published: 21 July 2021
(This article belongs to the Special Issue Mathematical Modeling and Control of Bioprocesses)

Abstract

:
Biopolymers are a promising alternative to petroleum-based plastic raw materials. They are bio-based, non-toxic and degradable under environmental conditions. In addition to the homopolymer poly(3-hydroxybutyrate) (PHB), there are a number of co-polymers that have a broad range of applications and are easier to process in comparison to PHB. The most prominent representative from this group of bio-copolymers is poly(3-hydroxybutyrate-co-3-hydroxyvalerate) (PHBV). In this article, we show a new kinetic model that describes the PHBV production from fructose and propionic acid in Cupriavidus necator (C. necator). The developed model is used to analyze the effects of process parameter variations such as the CO 2 amount in the exhaust gas and the feed rate. The presented model is a valuable tool to improve the microbial PHBV production process. Due to the coupling of CO 2 online measurements in the exhaust gas to the biomass production, the model has the potential to predict the composition and the current yield of PHBV in the ongoing process.

1. Introduction

One suitable alternative to conventional petroleum-based plastics is that of the group of polyhydroxyalkanoates (PHAs) [1,2]. These polyesters stand out because of their favorable processing properties, e.g., their melting behavior or different blending options [3]. Furthermore, these are produced microbially by many bacteria and some archaea using a wide variety of non-fossil carbon sources [1]. There is a repertoire of possible and cheap substrates, such as those of inexpensive sugars in waste streams from the manufacturing industry (juice production, sugar cane processing), volatile fatty acids (VFAs) from biogas plants and wastewater in sewage treatment plants and even CO 2 [4,5,6,7,8,9,10,11]. In addition to the diverse possibilities of microbially producing bio-based PHAs, this plastic raw material has another important property: PHAs are degradable under environmental conditions [12]. However, from an economic point of view, the industrial production of PHAs is about five times more expensive than the production of petroleum-based polymers [13]. In addition to an improved extraction and processing of the polymers, a large part of the costs can be saved through optimized bioprocesses with increased PHA yield. This can be achieved by the incorporation of the sophisticated experimental investigation of different process modes or the optimization of substrates and feeding strategies with mathematical modeling [2,14,15]. Furthermore, model approaches represent the basic component in the development of advanced process control and intensification strategies [16,17].
In the research area of PHA production, a large number of models can be found that greatly differ in terms of modeling approach and complexity. Due to the complexity and variability of the bioprocess, there is no universal tool for predicting product yields regardless of the producing organism, bioreactor or process conditions such as temperature or pH [18]. Some approaches appear promising due to their simplicity and are able to reproduce the concentration curves in a qualitative manner, while they contain only little metabolic information [19,20,21]. Other approaches take the metabolism into account, however, due to their complexity, they can only be used to a limited extent for model-based process control intensification and are difficult to transfer to other PHA producers [22,23,24,25,26,27].
Many of the modeling approaches focus on the microbial production of the best-known representative from the group of PHAs: poly(3-hydroxybutyrate) (PHB). From an industrial point of view, however, the experimentally well-investigated bio-co-polymer poly(3-hydroxybutyrate-co-3-hydroxyvalerate) (PHBV) is more interesting, because of its lower melting temperature, higher elongation-to-break values and higher biocompatibility in comparison to PHB [28]. However, only a few model approaches already exist to investigate microbial PHBV production [21,29]. PHBV is also the target product of the present work. In order to develop a universal simulation tool, the mathematical model must contain a balanced amount of metabolic information. Such a modeling approach is rarely found in the literature: in [21], the description of the metabolism was reduced to central points with respect to PHA production (e.g., acetyl-CoA production), which can be found in many organisms in mixed cultures.
In the mathematical model presented here, we applied a time-dependent, kinetic parameter for the formation of residual biomass from fructose and propionic acid in C. necator, in order to map the dynamics of the present metabolic activity without detailed metabolic information. As the researchers at the University of Antioquia (Colombia) already have shown [30,31], the online measurement for the CO 2 content in exhaust gas serves as an excellent measure of the dynamic growth rate. Here, we also apply this correlation and hence, the model is a suitable candidate for the online estimation of PHBV product yields. In addition, it can be used to predict the polymer composition, since 3-hydroxybutyrate (3HB) and 3-hydroxyvalerate (3HV) amounts in the chains are considered in the model. For the parameter adaption, two data sets from aerobic PHA production in C. necator were used, and one experimental setup with only fructose as a carbon source and the other with fructose and propionic acid as carbon sources. In the last part of this manuscript, the model is used in a simulation study to investigate the influence of the feed rate for the propionic acid and of constant CO 2 in the exhaust gas on the bio-co-polymer yield and the 3HV proportion in the polymer.
The presented model approach is a suitable candidate for the development of a soft sensor for the online prediction of the polymer yield and composition. This opens new options to increase the flexibility, productivity and quality of the PHBV production process. With further model extensions, e.g., by coupling to polymerization kinetics [32], it will be possible to additionally estimate the chain length distribution during the process to obtain more information about polymer properties.

2. Experimental Methods

2.1. Mircoorganism and Cultivation Conditions

C. necator (H16, DSM 428) obtained from DSMZ GmbH Braunschweig was used for the fermentations. Bacteria were precultured in a shake flask with 10 vol% LB medium (Carl Roth, Karlsruhe, Germany) at 30 °C and 150 rpm. After reaching an optical density of 4 at 600 nm, the bacteria were transferred to an shake flask filled with 10 vol% of M81 medium supplemented with 20 g/L fructose and 1.5 g/L ammonium chloride. The recipe for the Medium 81 can be found in [23] or on the web page of the DSMZ. The M81 preculture was grown until an OD of 4.8 and used as an inoculum for the bioreactors. The fermentations were performed in a DASGIP parallel bioreactor system (Eppendorf AG, Juelich, Germany) with an inoculation OD of 0.4. During the experiments, the pH was kept at 6.8 and the dissolved oxygen (DO) was 70%. The DO measurements were performed with sensors from Mettler Toledo (Gießen, Germany). In the case of fructose as a single carbon source, the pH-control was performed with 2 M H 2 SO 4 . During the reactor experiment with fructose and propionic acid, the pH was stabilized with 20 g/L solution propionic acid as shown in [33]. The detection of the exhaust gas composition was done with the GA4 module of the DASGIP parallel bioreactor system (Eppendorf AG, Juelich, Germany). The initial conditions for the reactor experiments are shown in Table A1. All bioreactor experiments were performed with M81 media at 30 °C.

2.2. Determination of Total Biomass

For the determination of total biomass (TBM), 1 ml culture broth was centrifuged for 10 min at 9600× g and 4 °C (VWR MicroStar 17R, Pennsylvania, PA, USA). In a second step, the cell pellet was dried over night at 80 °C and weighted.

2.3. Enzyme Assay

By using enzymatic test kits (Kit No. 5390 and No. 10139106035, R-Biopharm AG, Darmstadt, Germany) and following the manufacturer’s instructions, ammonium and fructose concentrations were determined from the supernatant of the sample.

High-Pressure Liquid Chromatography

Concentrations of 3HB and 3HV were determined by applying the procedure published in [34] using an Agilent 1100 high-performance liquid chromatography (HPLC). For this, 1 mL of the culture broth was alkaline digested as reported in [35]. The samples were filtered through a 0.25 μ m nylon membrane and 10 μ L were loaded on the reverse phase column (Inertsil 100A ODS-3, 5 μ m poresize, 250 × 4.6 mm, MZ-Analysentechnik GmbH, Mainz, Germany) and isocratically eluted with 1 mL·min 1 at 60 °C with 92% low concentrated H 2 SO 4 (0.025% solution, Carl Roth, Karlsruhe, Germany) and 8% acetonitrile (Carl Roth, Karlsruhe, Germany). The 3HB and 3HV concentrations in the polymer chains of the samples were determined by using crotonic (Carl Roth, Karlsruhe, Germany) and 2-pentenoic acid standard samples (Sigma Aldrich, St. Louis, MO, USA), respectively. In parallel, a PHBV sample (12% 3HV, Sigma-Aldrich /Merck, Darmstadt, Germany) with known concentration must be measured to calculate the conversion yields Y H B and Y H B [34]:
Y H B = 2 · c C A c H B ,
Y H V = 2 · c P A c H V .
Here, the dilution ratio (D) is 2, c H B is the known HB and c H V the known 3HV concentration of the PHBV test sample. Due to the standard measurement of crotonic acid c C A and 2-pentenoic acid c P A , the conversion yields Y H B and Y H V can be determined, respectively. Detection takes place with a photodiode-array detector (G7115A, Agilent, Waldbronn, Germany) at 210 nm.

3. Kinetic Modeling Approach

The description of the formation and degradation in the microbial PHA production is an important building block for the complete production process. There are already a number of model candidates for the formation of PHB [18,20,23,36] that can accurately reflect the development of the homopolymer concentration over time. Compared to the homopolymer PHB, the copolymer PHBV has significantly improved processing properties. However, so far, only simple kinetic approaches for the formation of PHBV were developed [21]. Furthermore, the model from Špoljarić and colleagues was developed for the conversion of fatty acid methyl esters (FAMES) from biofuel to PHBV using lumped metabolic pathways [19]. The model presented here describes the formation and degradation of 3HB and 3HV in the polymer chains using fructose and propionate, two carbon sources that frequently occur in inexpensive residues or can be produced from them, e.g., by using waste streams from juice, cheese and paper production. In our model approach, detailed metabolic reaction pathways were not taken into account to keep the model structure as simple as possible.
The following assumptions were made for the model:
  • A simple mass-action kinetic is assumed for the dynamics of the substrates;
  • Propionate has an inhibiting effect and decelerates the growth of bacteria [33];
  • The conversion of PHA into enzymatically active biomass (residual) is not affected by external propionic acid concentrations, as this is an internal process;
  • C. necator begins to produce PHA already before nitrogen is depleted [18]. This behavior is considered in the model via an inhibitory term with nitrogen by a Michaelis–Menten kinetics approach (see Equation (3), term inh2);
  • Steric effects in the granules prevent the further production of PHA after reaching a total amount of 89% of the total biomass (TBM, P t , m a x ) [36,37].
In the following, a set of ordinary differential equations for the dynamics of the system with fructose and propionic acid as substrates and residual biomass, 3HB and 3HV in the polymer chains as products is described. The dynamic state equation for the fructose concentration is given as
d c f r u d t = k 1 · b C O 2 ( t ) · c r e s · c f r u · c n · i n h 1 k 4 · c r e s · c f r u · i n h 2 · i n h 3 k 7 · b C O 2 ( t ) · c f r u · c r e s D · c f r u
with:
i n h 1 = m a x 0 , 1 c p c p , i n h , i n h 2 = m a x 0 , 1 c n c n + c n , s w , i n h 3 = m a x 0 , 1 P t P t , m a x .
Fructose can be metabolized for biomass production with the rate parameter k 1 , the accumulation of 3HB in the polymer with k 4 or the conversion to CO 2 with k 7 . The growth of biomass through fructose is controlled by the activity coefficient b C O 2 ( t ) based on the CO 2 ratio in the exhaust gas and inhibited by the concentration of propionate with the term i n h 1 . At a concentration of 1.5 g/L propionic acid ( c p , i n h ), the substrate uptake for biomass is completely inhibited [33]. Since CO 2 in the exhaust gas is often defined as a proportion of the gas composition, we chose the relative CO 2 proportion to describe the metabolic activity b C O 2 ( t ) as follows:
b C O 2 ( t ) = C O 2 , o u t ( t ) C O 2 , i n .
The metabolic activity is described by the quotient of CO 2 , o u t in the exhaust gas and CO 2 , i n in the fresh inlet air. Since C. necator is a PHA producer of group 2 according to Novak et al. [18], the build-up of 3HB from fructose begins when there is still a small amount of ammonium in the medium. This effect is modeled by the term i n h 2 . As described in [36], steric effects at high polymer concentrations inhibit the conversion of substrates to PHA (term i n h 3 ). According to literature values [1], the maximum achievable amount P t , m a x is 0.89 (89% of the total biomass).
The inhibitory steric effect is given as the ratio between overall HA concentration and total biomass concentration:
P t = c h b + c h v c h b + c h v + c r e s .
Finally, the dilution factor in the fed-batch process:
D = F i n V ,
is the ratio of the feed flow rate F i n and reactor volume V.
For the computational study, a volume balance is necessary:
d V d t = F i n .
As for fructose, a state equation can be set up for propionate dynamics:
d c p d t = k 2 · b C O 2 ( t ) · c r e s · c p · c n · i n h 1 k 5 + k 6 · c r e s · c p · i n h 2 · i n h 3 k 8 · b C O 2 ( t ) · c p · c r e s + D · c p , i n c p .
It describes the consumption of propionate for biomass with a rate coefficient k 2 , CO 2 with k 8 and 3HB production with k 5 . In addition to the generation of 3HB, propionate can also be converted into 3HV ( k 8 ). In fed-batch mode, a propionate solution according to Table A1 is fed to the system with the feed flow rate F i n .
For growth, organisms need ammonium. The state equation for the ammonium dynamics is:
d c n d t = c r e s · c n · b C O 2 ( t ) · k 1 · c f r u + k 2 · c p · i n h 1 k 3 · c r e s · c n · c h b + c h v D · c n .
In addition to the ammonium uptake for biomass growth by consuming external carbon sources (first term in Equation (9)), ammonium is needed to convert the biopolymer to catalytically active biomass with the degradation rate parameter k 3 .
The dynamical behavior of residual (non-PHA, catalytically active) biomass is described as follows:
d c r e s d t = c r e s · c n · i n h 1 · k 1 · c f r u + k 2 · c p · b C O 2 + k 3 · c h b + c h v D · c r e s .
Residual biomass is produced through the consumption of external carbon sources such as fructose and propionate and the conversion of 3HB and 3HV from the polymer chains in the presence of ammonium.
The following ordinary differential equations (ODEs) account for the dynamics of the monomers 3HB and 3HV in the polymer chains:
d c h b d t = c r e s · i n h 2 · i n h 3 · k 4 · c f r u + k 5 · c p k 3 · c r e s · c n · c h b D · c h b .
d c h v d t = k 6 · c r e s · c p · i n h 2 · i n h 3 k 3 · c r e s · c n · c h v D · c h v .
For the accumulation and breakdown of the biopolymer (3HB and 3HV), CO 2 formation is negligible, since the metabolic reaction pathways produce only little CO 2 compared to the breakdown of sugars and organic acids into catalytically active components of the total biomass.

3.1. Numerical Solution
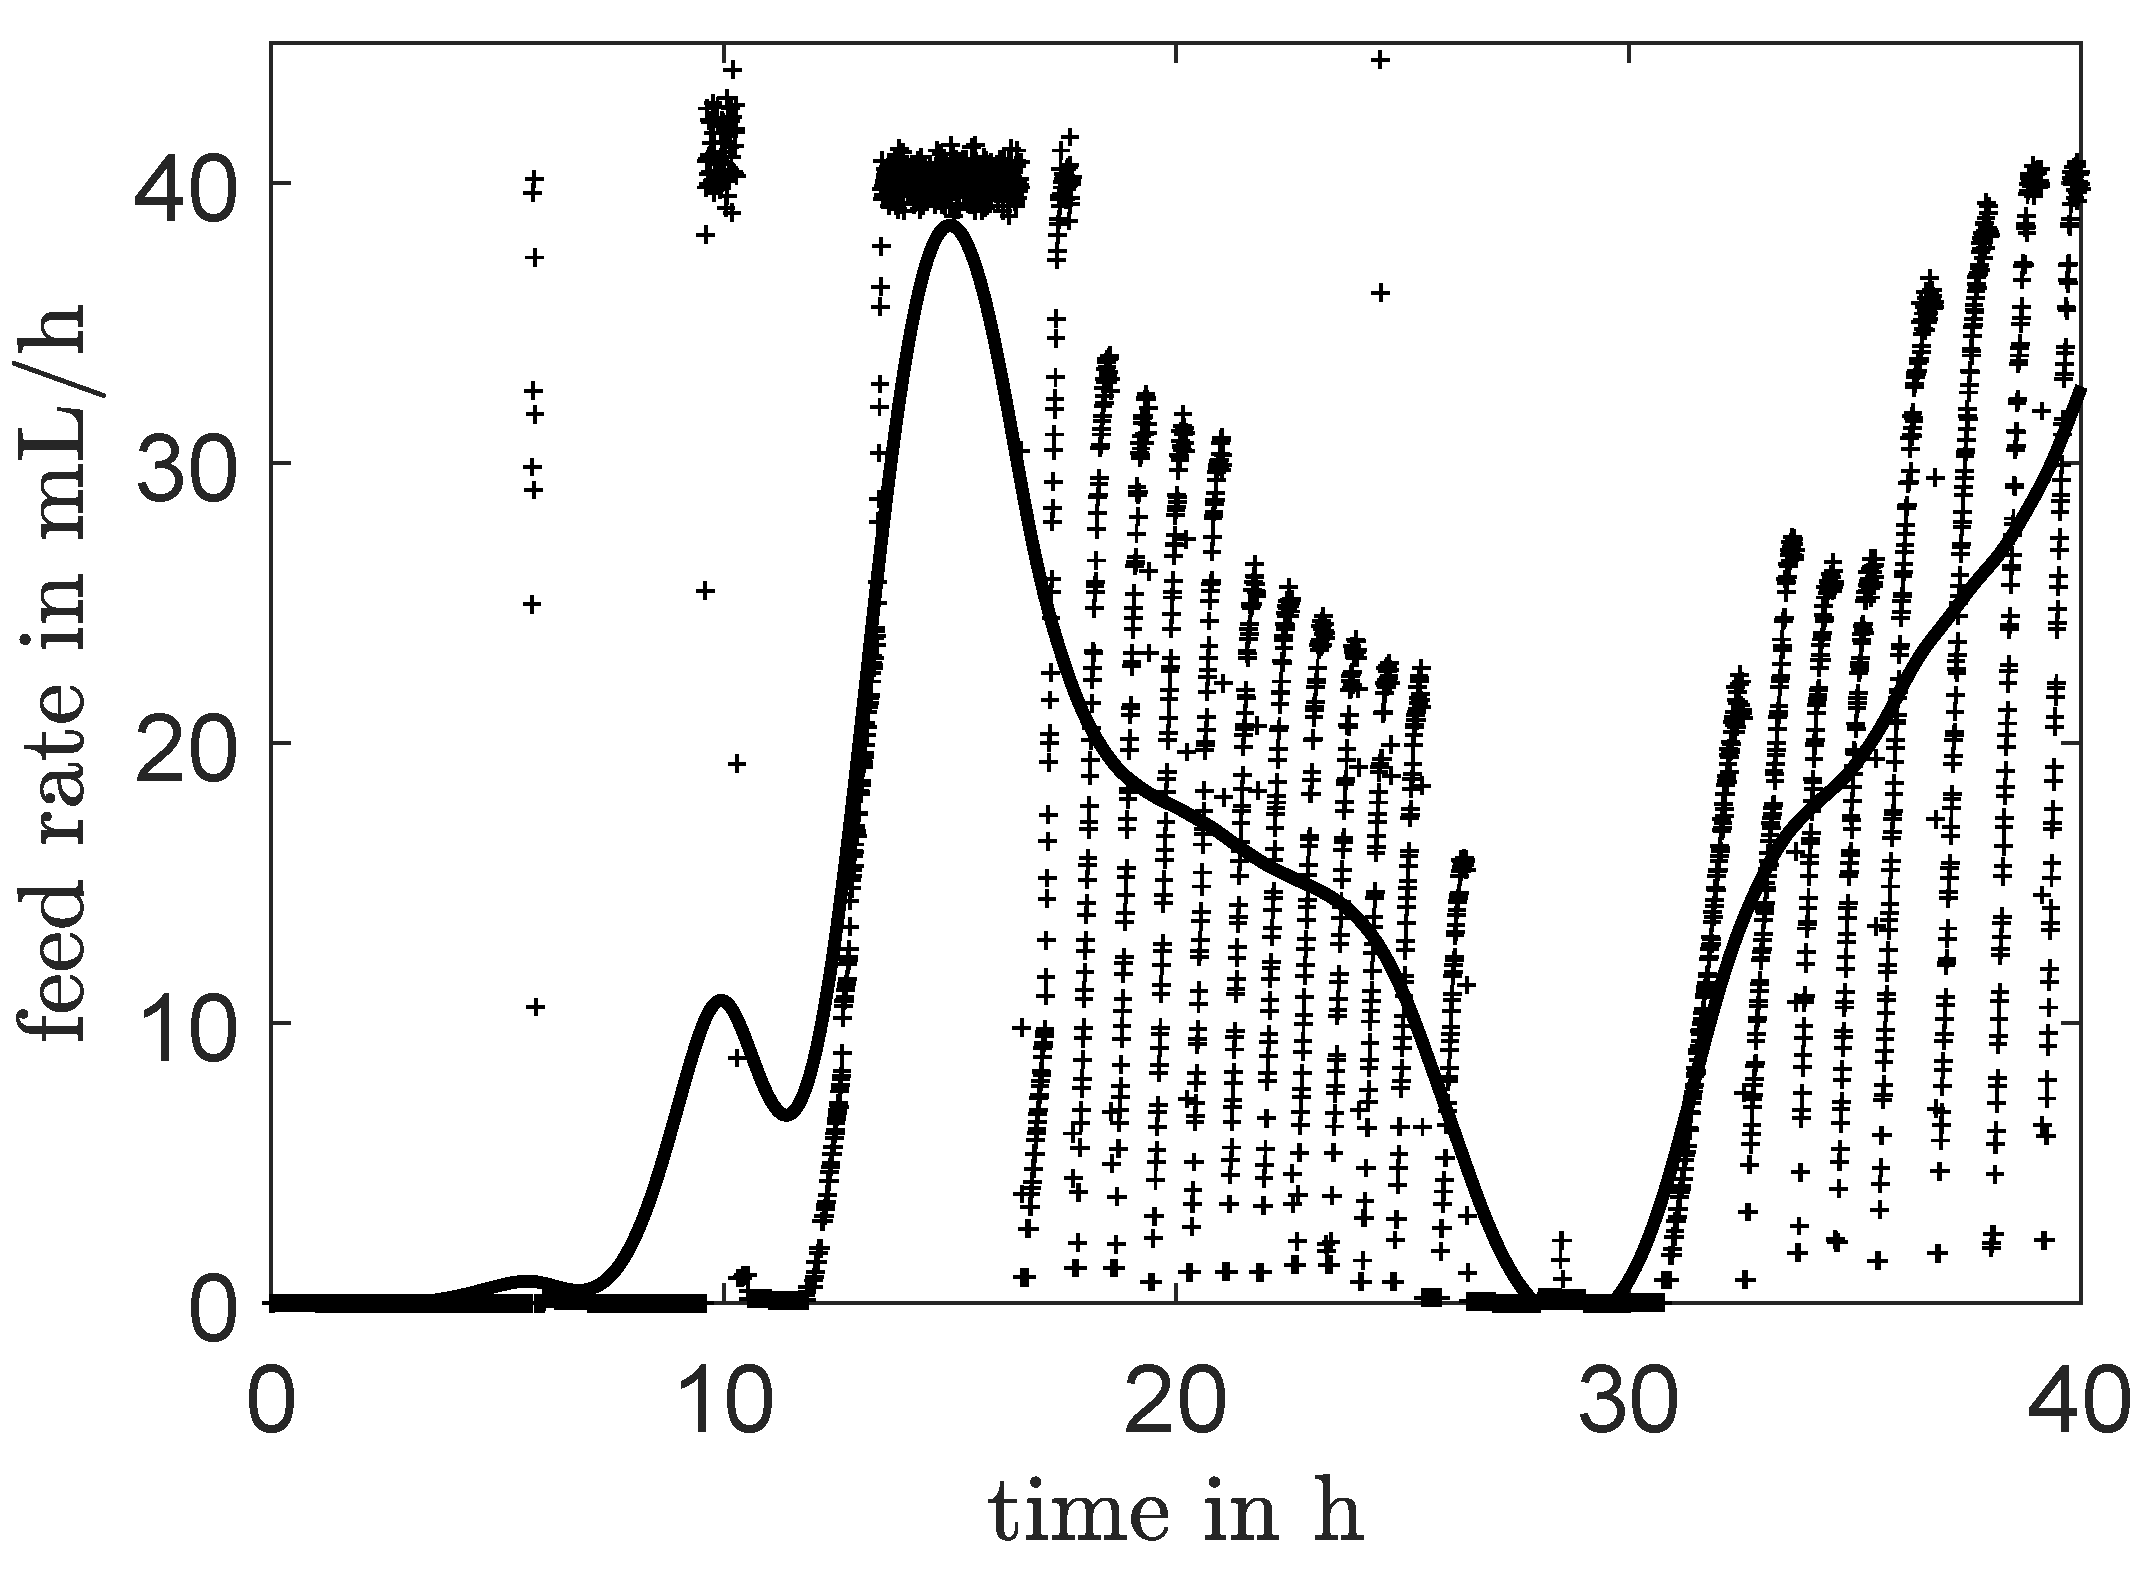
3.1.1. Interpolation for Volume, CO 2 , o u t and Feed Rate

For the simulation of the model, the temporal evolution of the CO 2 amount in the exhaust gas from reactor experiments is required. Since the online measurement often fluctuates and does not provide a smooth curve, the data were interpolated to integrate them into the ODE model. For this, a smoothing spline interpolation was carried out with the MATLAB command csaps. For both experiments, different smoothing factors were evaluated. A smoothing factor of 0.2 was selected for the experiment with fructose as the only carbon source (data set 1), while the data from the reactor experiment with fructose and propionic acid as carbon sources (data set 2) achieved a smooth and well-fitted curve with a smoothing factor of 0.02. For the interpolation, the splines are evaluated at the sampling points. The evaluation was carried out with the MATLAB command ppval. The curves and online data are shown in Figure 1 for both data sets.
The feeding of the odd carbon source propionic acid was achieved by pH control. If the pH increases, a certain amount of propionic acid with 20 g/L in the feed is added to the bioreactor to stabilize the pH at 6.8. The pre-implemented PI controller of the DASGIP parallel bioreactor system (Eppendorf AG, Jülich, Germany) was used for this purpose. As for the activity factor, frequent fluctuations are observed because of the special pH-dependent feeding strategy and thus the feed rate for propionic acid was interpolated and evaluated in the same way as the CO 2 amount in the exhaust gas (Figure 2). Here, a factor of 0.02 delivered a smooth curve.
Furthermore, an interpolation of the volume was necessary for the fed-batch experiment with fructose and propionic acid as carbon sources (data set 2). For this purpose, a polynomial of order 10 was determined with the MATLAB command polyfit and evaluated with polyval at the sampling times. As seen in Figure 3, volume reduction by sampling was also taken into account. Hence, a decrease in volume was recorded despite an average feed rate of approximately 20 mL/h between 15 and 25 h (see Figure 2). In the experiment with fructose as the single carbon source, the reactor was operated in batch mode. Since it was assumed that the system was ideally mixed, the changes in concentration were only caused by internal sinks and sources (no substrate was pumped in), and the volume reduction due to sampling can be neglected in data set 1. All simulations, interpolations and evaluations were carried out with MATLAB 2019b.

3.1.2. Parameter Identification

For parameter identification, the following objective function was minimized:
E S S = i = 1 n x exp ( t i ) x sim ( t i ) m a x ( x exp ) 2 .
Here, the error between the simulated x sim and experimental data x exp at time point t i is determined and weighted with the maximum value in the experimental data set.
The kinetic parameters were determined using the algorithm fmincon in MATLAB 2019b. The ODEs were numerically solved with the algorithm ode15s with a relative tolerance of 10 9 . To prevent a sub-optimal initial parameter set a multi-start approach with N = 10,000 was applied. To further validate the resulting parameter set obtained by the local optimization strategy, the global optimization algorithm differential evolution (DE) was selected [38]. The resulting set of parameters can be found in Table A1.
To prove the parameter identifiability, profile likelihoods are determined for the parameter set [39]. Appendix B shows all profile likelihoods and the corresponding likelihood-based confidence intervals. All profile likelihoods show a distinct minimum at the estimated parameter set and thus all parameters and the model itself are (locally) identifiable. The confidence intervals are obtained by calculating the value of a χ 2 -distribution with a confidence level α = 0.95 and one degree of freedom as proposed in [39].

4. Results

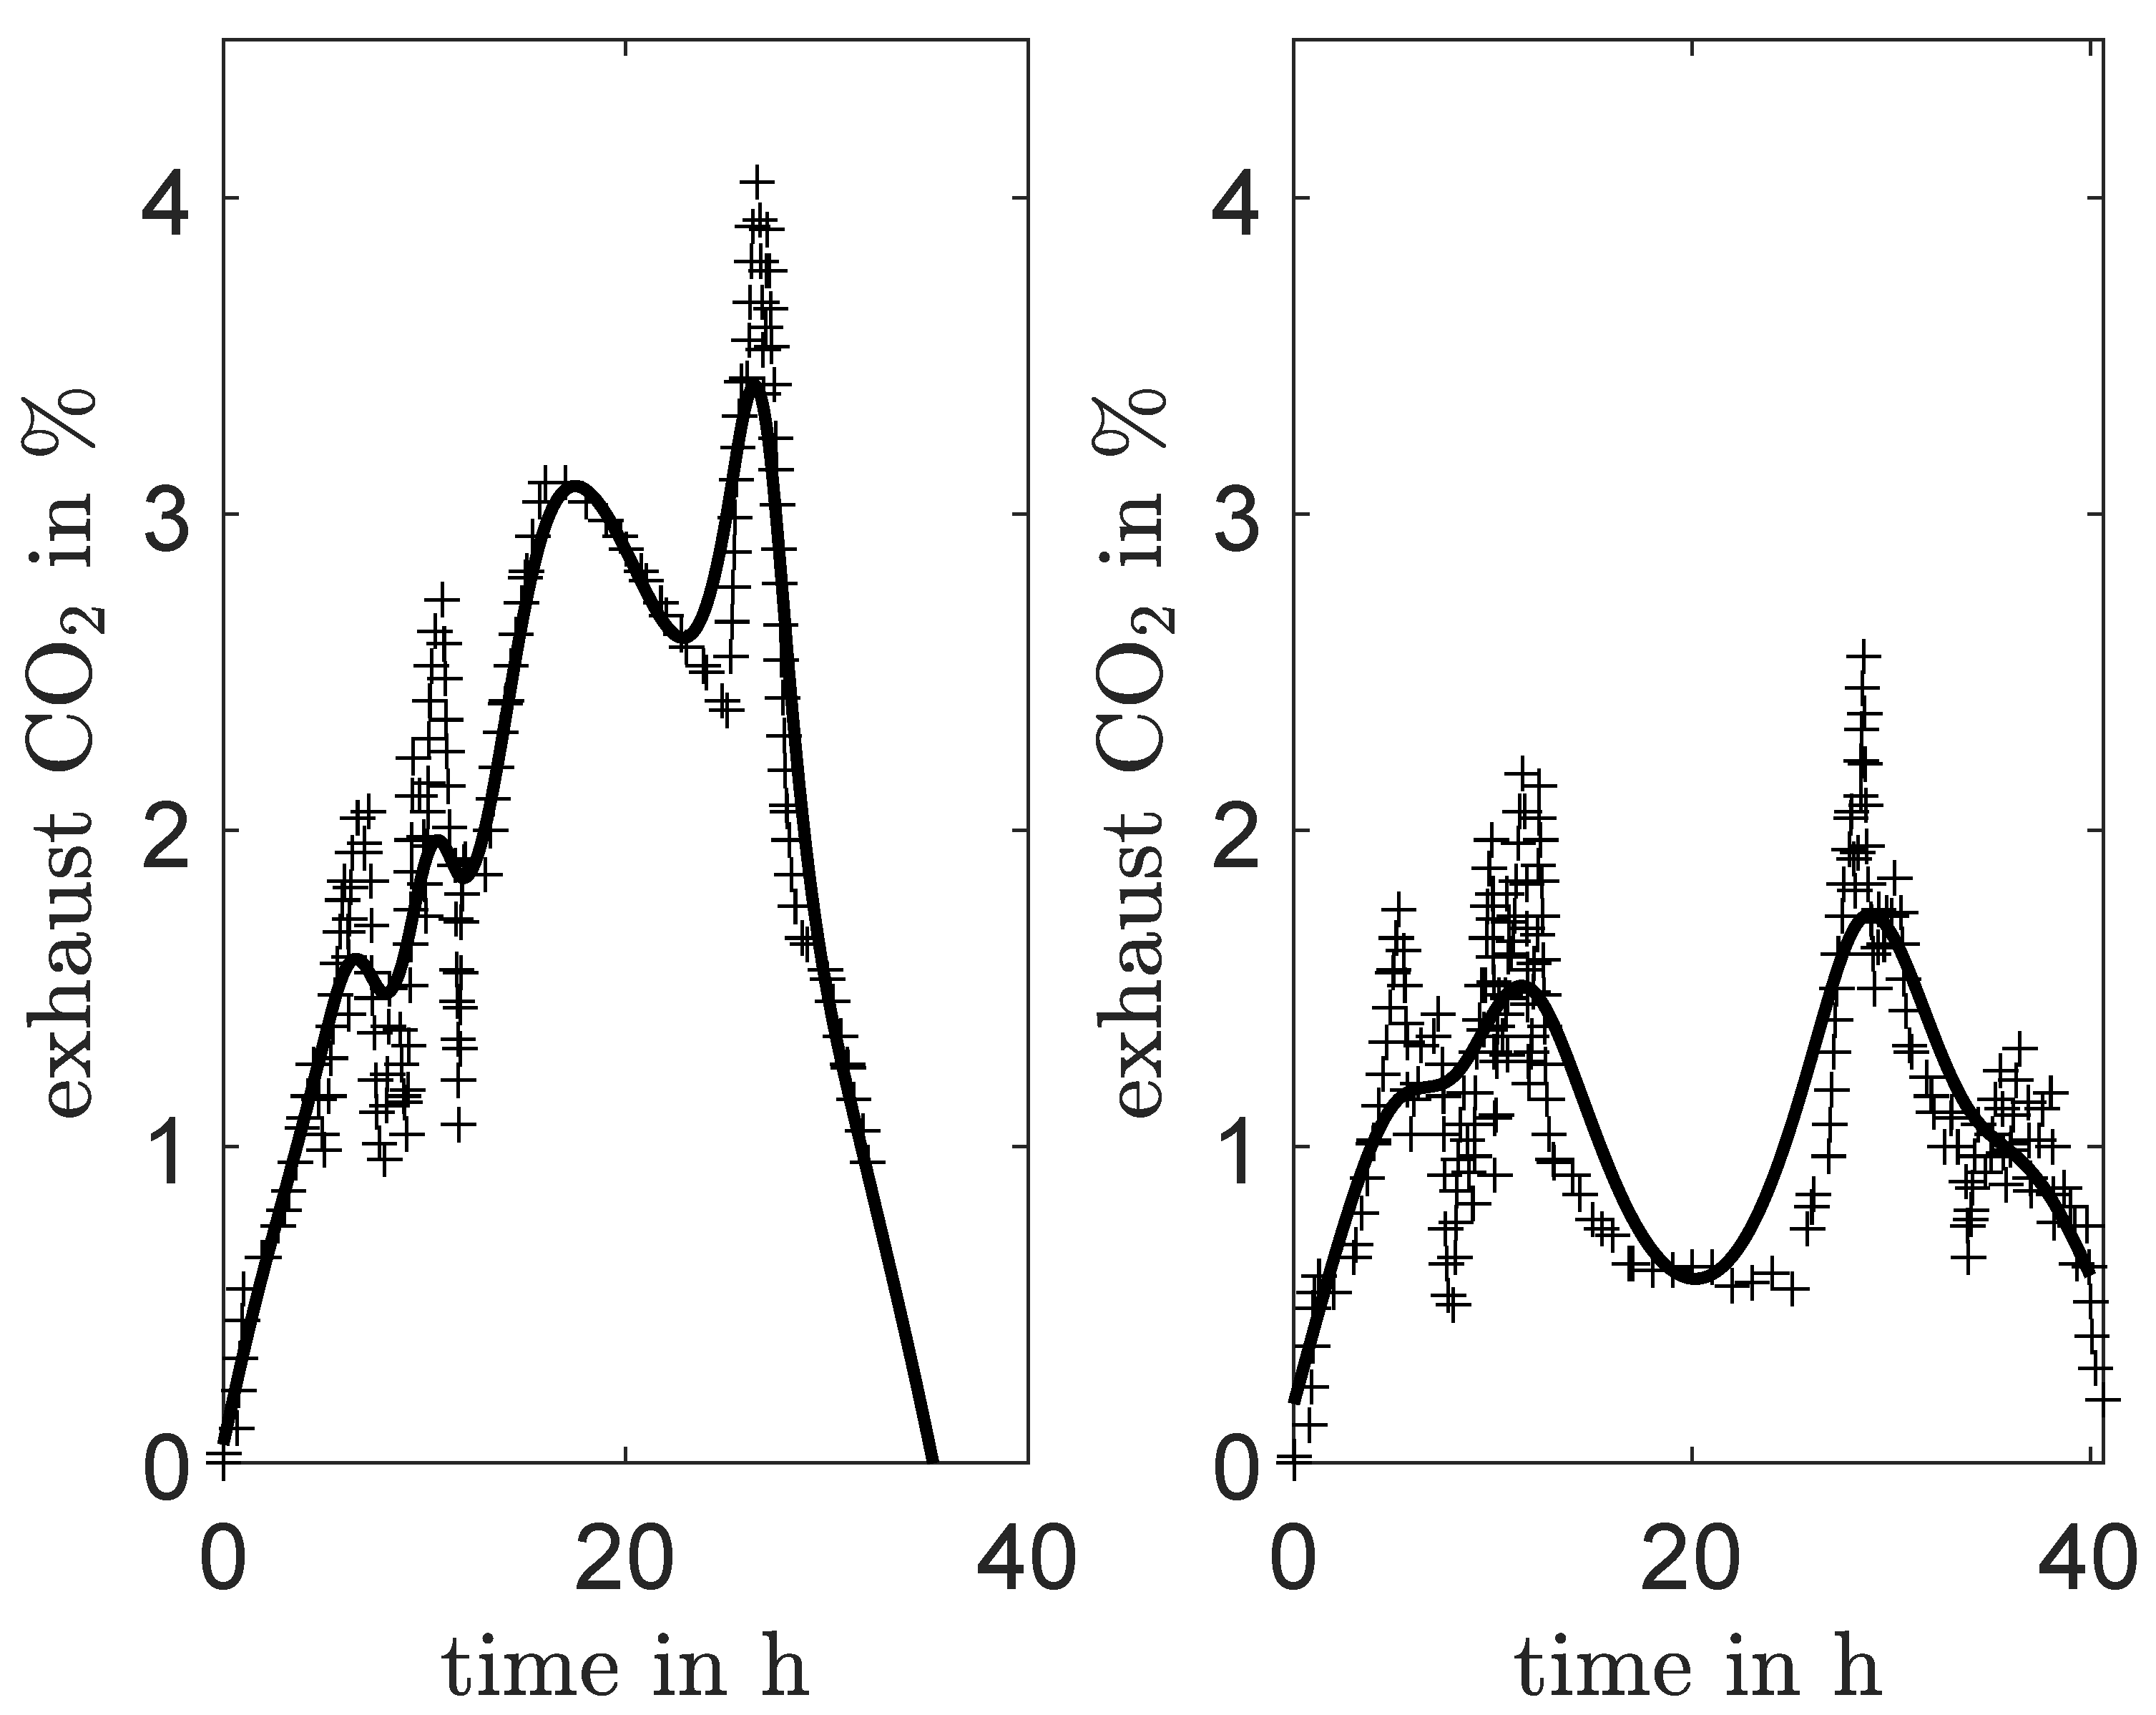
4.1. Identification Using Different Data Sets

The kinetic model was adapted to two data sets from bioreactor experiments with a working volume of 1.2 L. In the first data set, fructose was the only carbon source that was metabolized under aerobic conditions. The second data set was also obtained under aerobic conditions with fructose and propionic acid as carbon sources. Here, propionic acid was added via a pH-regulated feed as proposed by Kim and coworkers [33] aiming for a constant pH value of 6.8. From the available data of these sets, the online data for the CO 2 content in the inflow and in the exhaust gas, the feed rate for the propionic acid and the exact volume considering the sampling volume were used in the case of data set 2. In the case of the data set 1, online data for the CO 2 content in the inflow and in the exhaust gas were also used, but a constant volume and a batch mode (F i n = 0) were considered. The CO 2 content in the exhaust gas, the feed stream for the propionic acid and the reactor volume were approximated as described in Section 3.1.1. The smoothed measurement data were used for the model simulation. Furthermore, the concentrations for total biomass, biopolymer, fructose and propionic acid were determined offline in both data sets (see Section 2).
The dynamic behavior for the conversion of the substrates from data set 1 (only fructose) can be reproduced well with the present model (solid lines, Figure 4a). The model shows larger deviations for the substrates from data set 2 (fructose and propionic acid), especially in the last time segment from 25 h (dashed lines, Figure 4b). On the one hand, this is due to the approximation of the inflow rate for propionic acid (see Figure 2), and on the other hand, the measurement of the propionic acid in the medium becomes more difficult. It seems to be, that there are more and more apoptosis fragments, e.g., matrix, RNA and proteins in the culture supernatant that disrupt the signal obtained by HPLC (own experimental findings). These fragments could be avoided by elaborate sample preparation before HPLC measurement, e.g., additional filtration, boiling procedures or the supplementation of organic acids. Furthermore, the chromatographic peak consisting of propionic acid can be be fractionated and separated from impurities by a second HPLC run with an adjusted mobile phase.
The model for the case of fructose as a single substrate can reproduce the production and depletion of total biomass and 3HB with sufficient accuracy (Figure 5a). The same applies to the case with fructose and propionic acid as carbon sources (Figure 5b). In particular, the degradation of 3HB and 3HV in the polymer chains after an NH 4 Cl shot at 24 h can be mapped very well by the model. This property is important when working with waste streams which also contain nitrogen sources and which are added during the ongoing process in order to keep the carbon in excess. Since the model can reproduce the product concentrations very well, it can further be used for a simulation study.

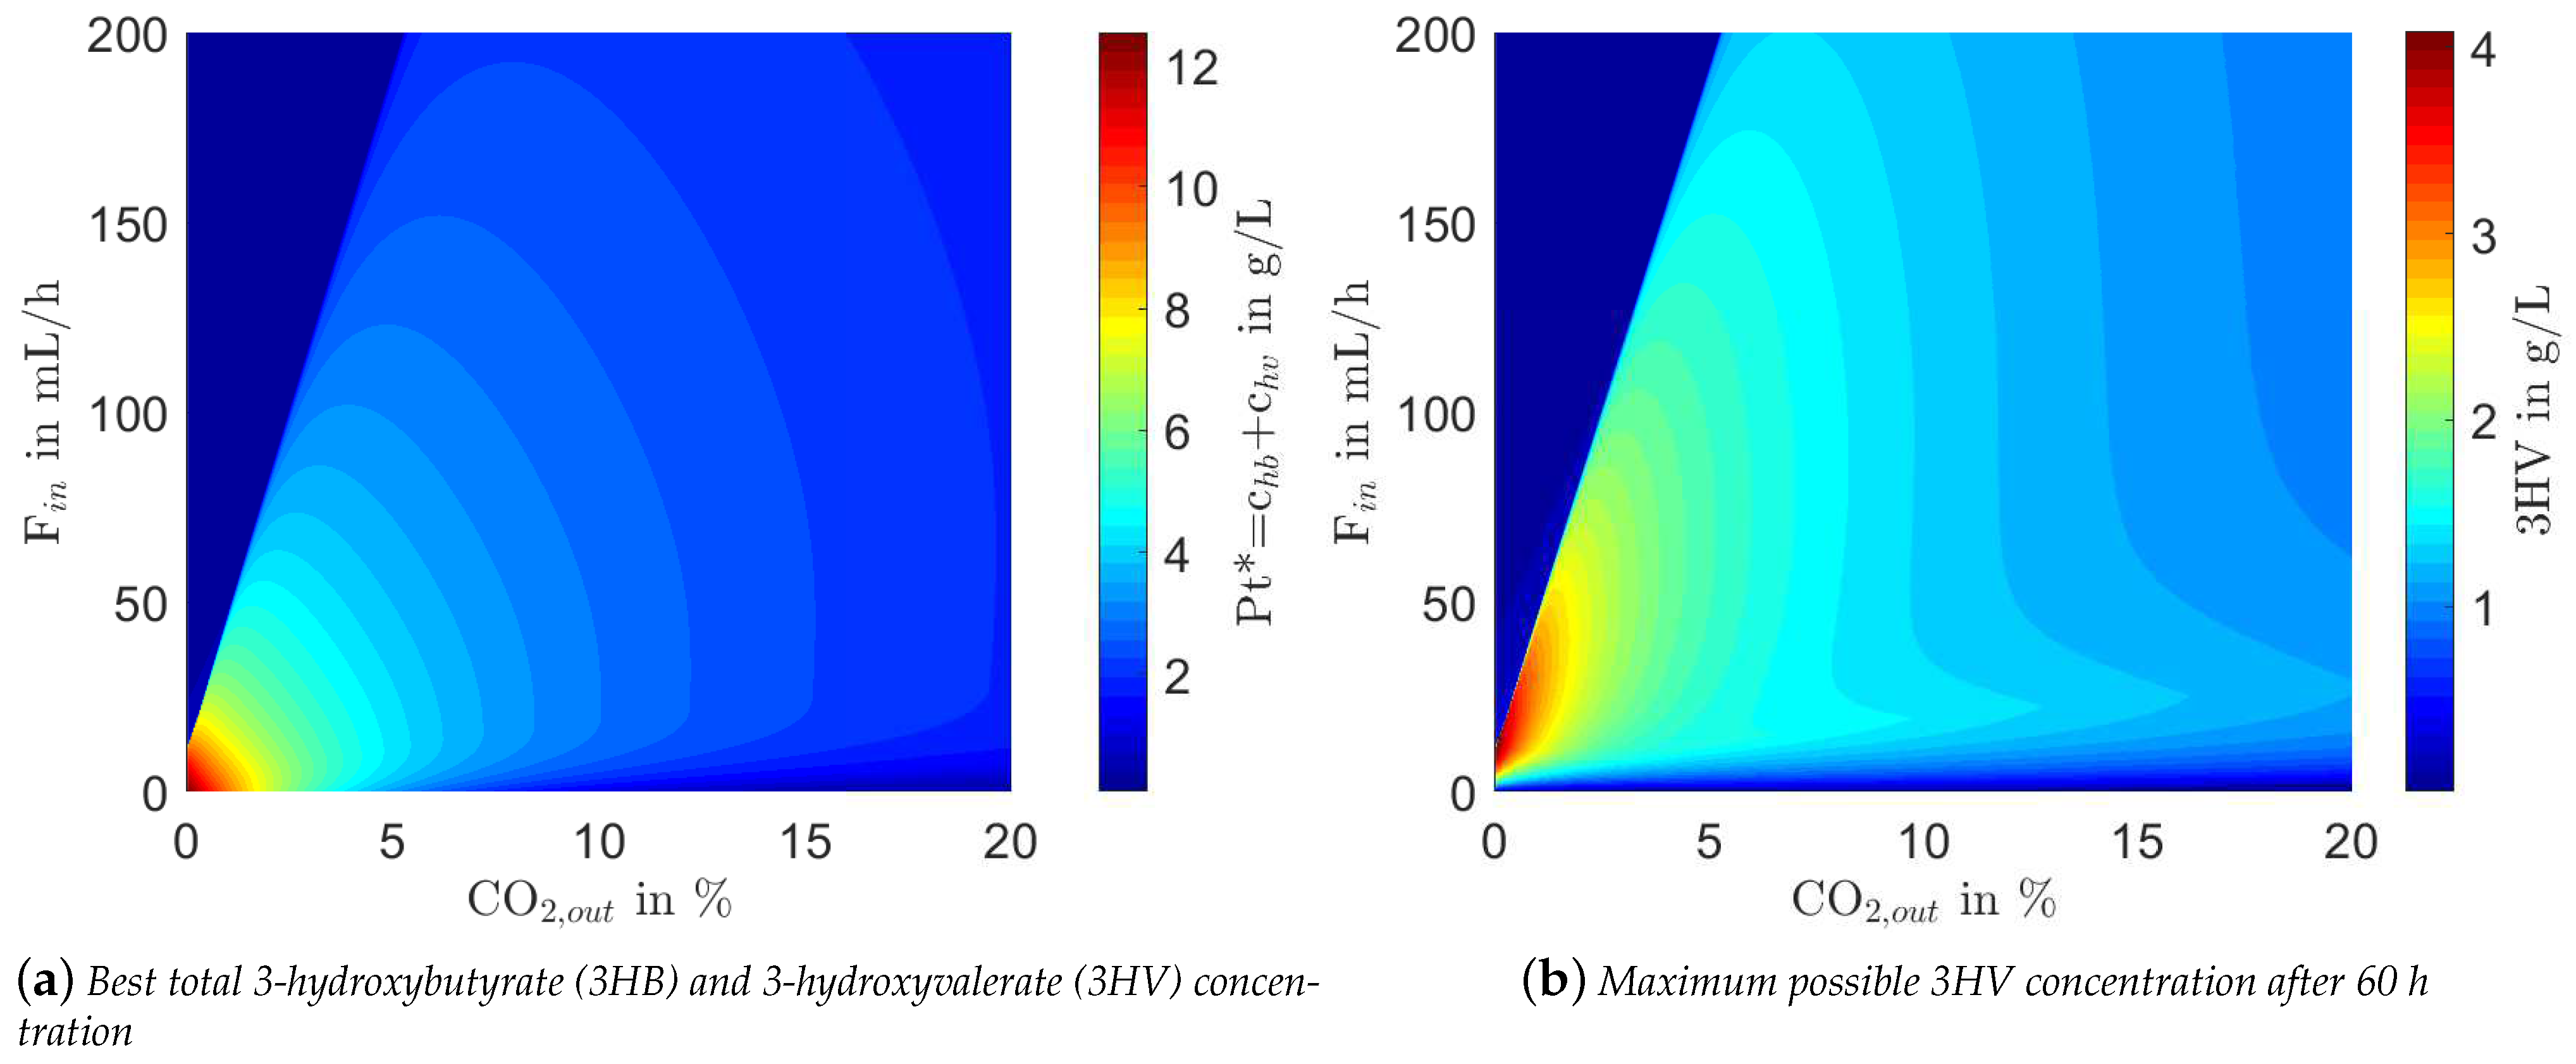
4.2. Computational Study

In the following, the identified model was used to investigate the maximum product concentrations by applying different constant CO 2 and propionic acid feed profiles. A constant feed rate can easily be implemented on every bioreactor system with continuous pumps. The constant CO 2 in the exhaust gas represents a complex control task, as CO 2 is produced by the bacteria themselves (autogenous CO 2 ). However, the research work in [40] shows the feasibility of this control task which can also be used in future validation experiments.
In the simulation study (Figure 6), a constant CO 2 proportion in the exhaust gas and a constant feed rate for propionate were assumed for the process time. The propionic acid concentration in the feed was set to 20 g/L as in data set 2. Figure 6a shows the maximum total 3HB and 3HV in the polymer chains P t * as a function of CO 2 in the exhaust gas and the feed rate for propionic acid. The inhibitory area is clearly visible on the left side. In this range, the propionic acid concentration in the medium becomes too high so that growth is inhibited. In the case of increased CO 2 values in the exhaust gas, the feed rate can also be increased without triggering growth inhibition. This behavior can be justified as follows: a higher exhaust gas value for CO 2 produced by the microorganisms (autogenous CO 2 ) is triggered by an increased uptake of substrates from the medium. In C. necator, the degradation of pentoses and hexoses takes place via the Entner–Doudoroff (ED) pathway. Furthermore, the tricarboxylic acid cycle (TCA) is mainly responsible for the generation of energy and precursor molecules for biomass synthesis from the precursors of metabolic sugar degradation and organic acids. Both the ED pathway and the TCA generate CO 2 as a by-product, which can be found in the exhaust gas values of the simulation study. With other words, increased autogenous CO 2 in the exhaust gas can be translated into stronger residual biomass growth with increased substrate uptake. As a result, the growth inhibition with increased CO 2 in the exhaust gas only occurs at higher feeding rates for propionic acid. In addition to the beneficial effect of higher exhaust CO 2 , the total biopolymer concentration decreases in the non-inhibitory area. This effect occurs because the CO 2 output is related to the higher residual biomass growth and hence, the substrates were less translated into biopolymers.
The highest total biopolymer concentration of 12.5 g/L within 60 h simulation time can be achieved without feeding propionic acid to the system and with a very low CO 2 content in the exhaust gas. However, without an active feed rate, no 3HV will be produced and the 3HV content is decisive for improved processing of copolymers compared to their homopolymers. The maximum HV concentration in the polymer is shown in Figure 6b for different constant autogenous CO 2 and propionic acid feeding rates. Here, the inhibiting region can be seen again due to a high propionate concentration in the medium. For a high 3HV concentration, our model predicts feed rates between 12 and 40 mL/h depending on the CO 2 in the exhaust. In general, less than 2.5% CO 2 in the exhaust gas leads to higher 3HV concentrations. As our simulation results show, the feed rate for propionic acid must be chosen very carefully because of their strong correlation with the CO 2 value: overly high feed rates at higher CO 2 in the exhaust gas lead to less residual biomass and a decreased 3HV concentration (see Figure A1). Further characteristic values of the simulation study are shown in Figure A1 (e.g., residual biomass at the maximum total 3HB and 3HV concentration, total monomer/total biomass ratio).
Three exemplary time courses for different production goals were illustrated in Figure 7. In case A, the dynamic behavior to achieve a high total polymer concentration (3HB + 3HV) with the given initial conditions is shown. For this purpose, the feed rate was set to 0 mL/h and the CO 2 amount to 1%. For case B, the same CO 2 value as in case A was applied together with a feed rate of 25 mL/h to show an example time course for a high 3HV concentration. In addition to the two preferred fermentation results (cases A and B, Figure 7), the inhibitory case was also shown (case C, Figure 7) by increasing the feed rate to 105 mL/h.

5. Concluding Remarks

In this manuscript, a model approach is presented which enables the integration of online data for the estimation of the yield and the composition of the copolymer PHBV in C. necator. Compared to other approaches, no genome-scale metabolic networks or reduced variants are necessary [23,41], since it is a pure kinetic approach that describes changes in the metabolism due to a CO 2 -dependent biomass production rate that changes over time. Despite the lack of detailed metabolic information, our kinetic model can display the data sets with fructose as a single substrate and fructose and propionate as substrate with high accuracy. The model approach has similar complexity as the models presented in Koller et al. [36] and Dias et al. [21], whereby the metabolic activity that controls the biomass growth can be described by the CO 2 profile in the exhaust gas. Because of the compact model structure and smart coupling to available online measurements the approach can be applied as a soft sensor for the prediction of biomass, substrates, product yield and the composition of the biopolymer (e.g., 3HV/3HB ratio). First steps in this direction where already successfully applied for a vinasse-molasse PHA process [30,31]. In comparison to the model approach used in [30,31], our more complex model represents an excellent basis to predict 3HV and 3HB amounts in the polymer chains. In addition to the application options during the process, CO 2 profiles can be estimated in optimization studies with predefined concentrations profiles for the substrates and products. As a first step, we investigated in our simulation study the effect of constant CO 2 fractions in the exhaust gas and constant feed rates for propionic acid on biopolymer yield and composition. The lower the feed rate was set and the less CO 2 was in the exhaust gas, the more PHA was produced but with less 3HV content in the polymer. A suitable feed rate for propionic acid input was predicted to be between 12 and 40 mL/h in order to achieve high 3HV concentration in the final co-biopolymer. Furthermore, the model approach can be used for the design of observers and state estimators for the reconstruction of non-measurable states. A first example in this direction was recently presented by Carius and coworkers [16]. Here, an unscented Kalman filter and a moving horizon estimation based on a hybrid cybernetic PHB model [23] was designed and evaluated.
Future work should focus on the design of model-based soft sensor approaches, since this will enable the reliable online estimation of the PHBV content using measurements of the exhaust gas online without the need for additional expensive hardware sensors. Furthermore, the transferability of the kinetic model to other PHA producers must be researched. Here, the focus should be on PHA producers, which are already producing PHA under growth conditions, e.g., C. necator DSM 515, as the model was designed for this group of bacteria. Furthermore, it should be checked whether a characteristic CO 2 profile occurs during the accumulation of other copolymer building blocks, such as 4-hydroxybutyrate. Finally, a control concept should be developed which is able to keep CO 2 in the exhaust gas on a desired level over a longer period of time. The work of Shang and colleagues [40] shows that it is in principle possible to control a process parameter that is strongly influenced or caused by the bacteria. The CO 2 amount in the exhaust gas was adjusted in the work of Shang and coworkers in order to investigate the inhibitory effects of CO 2 . Such an effect has not yet been taken into account in the model presented in this manuscript, but should be considered in future model extensions.
Overall, our model approach provides the basis for a broad range of possible future applications and will help make the production process of biopolymers more reliable and less expensive.

Author Contributions

S.D. and R.D. conceived and designed research. S.D. and J.B. conducted the experiments. S.D. analyzed and visualized the data and wrote the original draft of the manuscript. R.D. and A.K. supervised the work and edited the original draft. All authors have read and agreed to the published version of the manuscript.

Funding

We would like to acknowledge the EU-programme ERDF (European Regional Development Fund) for the funding of the project DIGIPOL.

Institutional Review Board Statement

Not applicable.

Informed Consent Statement

Not applicable.

Data Availability Statement

The data presented in this study are available on request from the corresponding author.

Conflicts of Interest

The authors declare no conflict of interest.

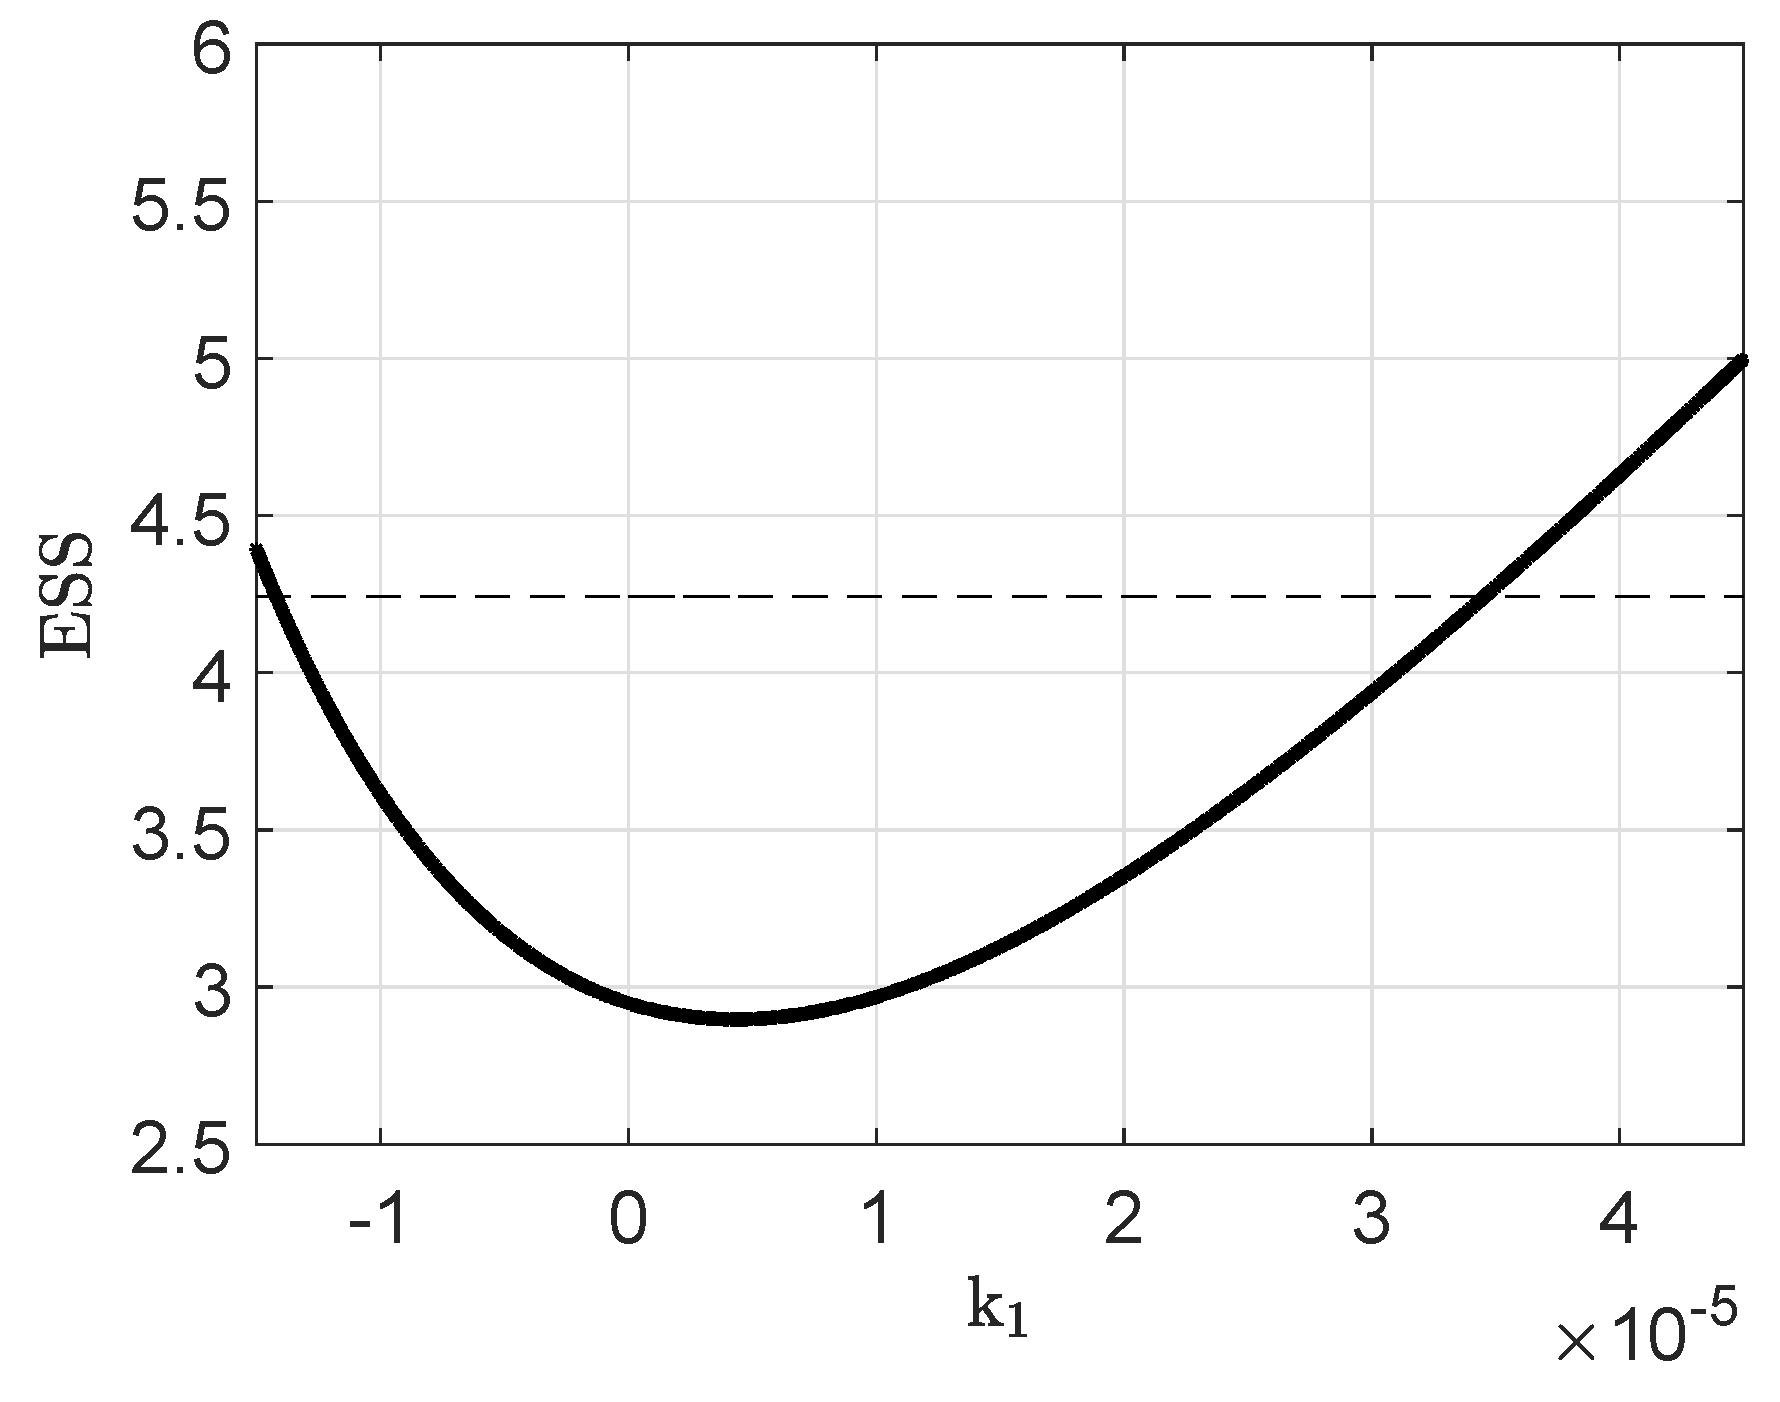
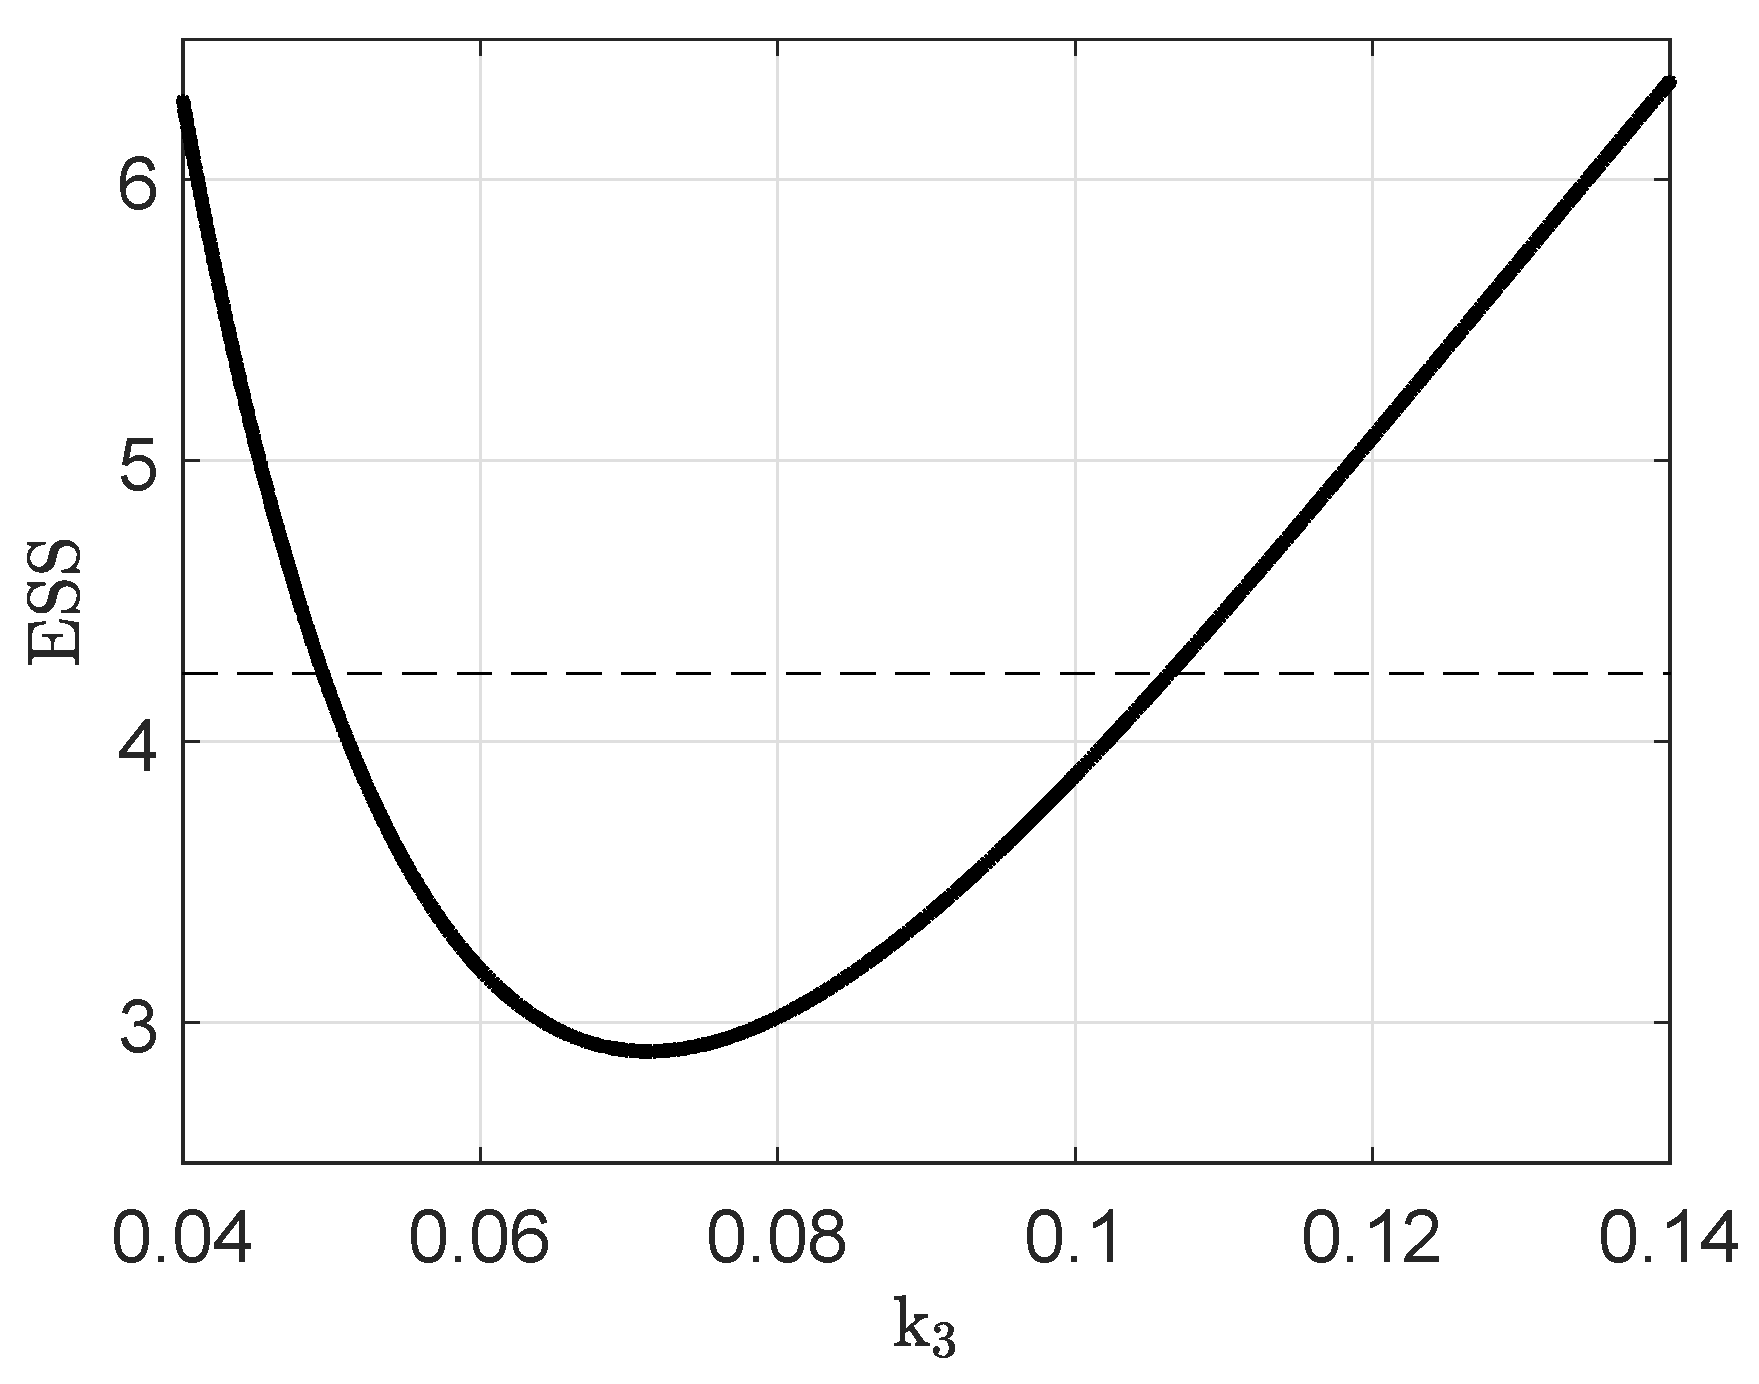
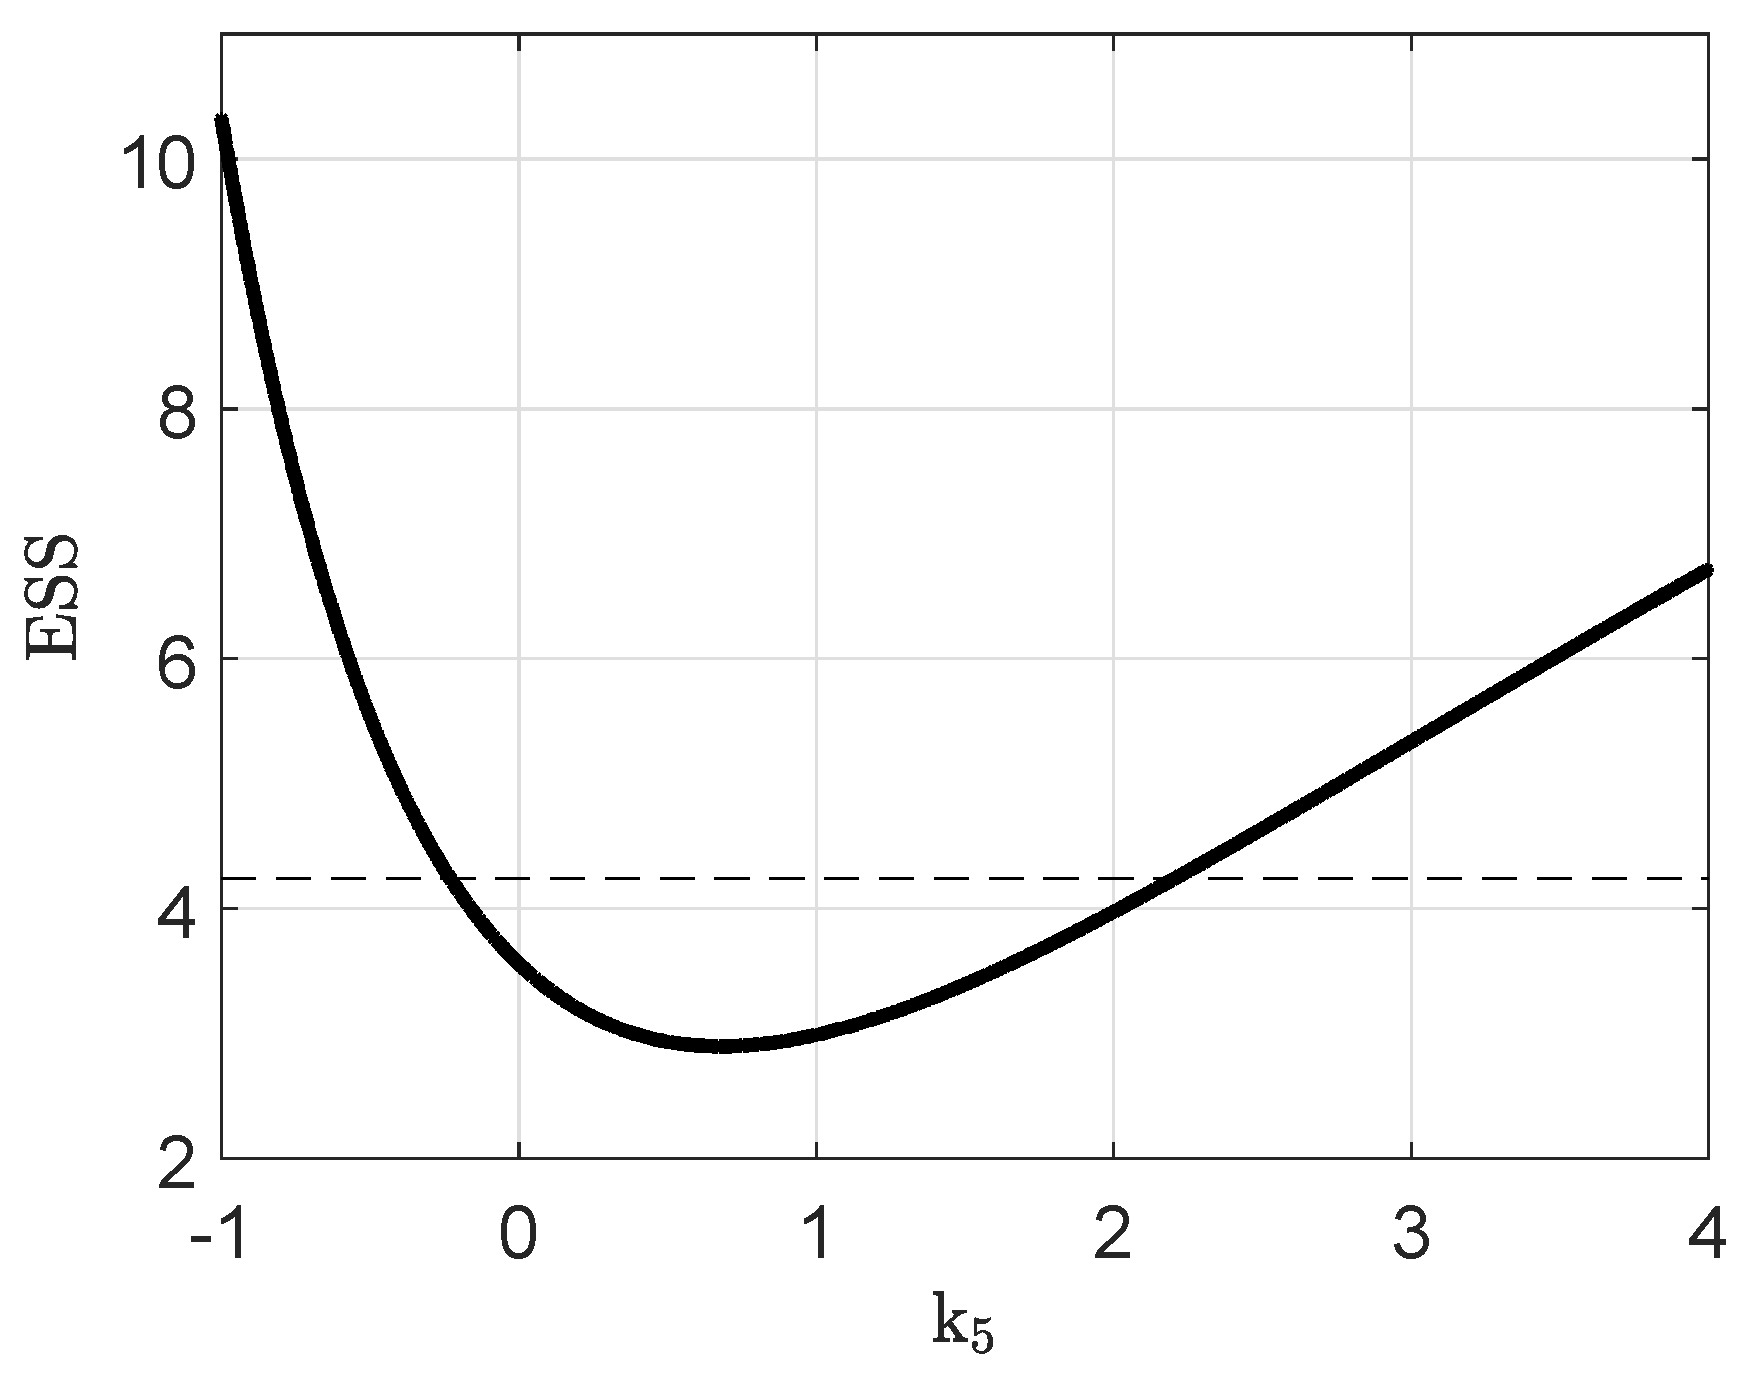
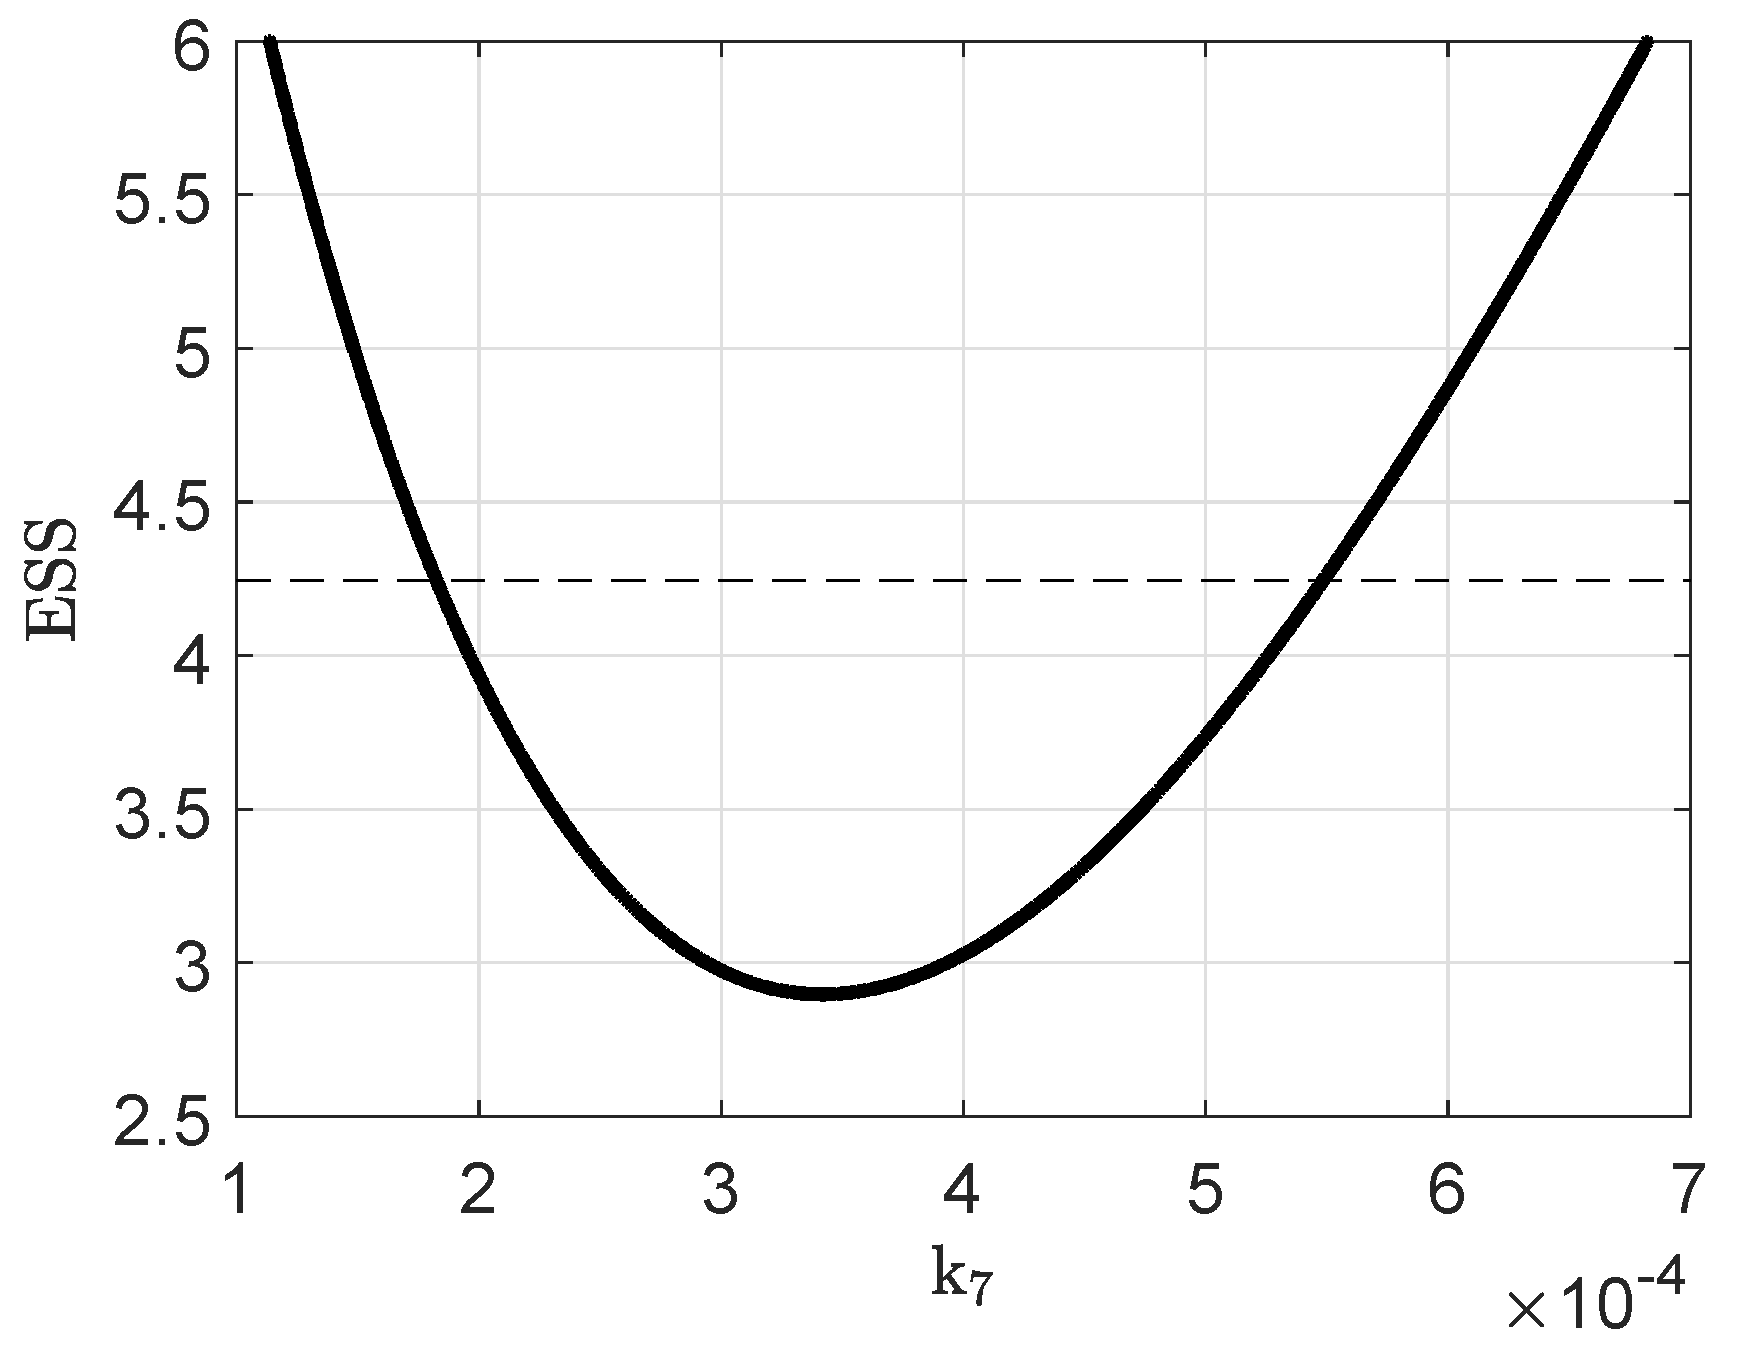
Appendix A. Additional Figures—Profile Study

Figure A1. Simulation study with constant values for CO 2 and F i n —3HV content (a), residual biomass (b), PHA/BTM ratio (c), time (d).
Processes 09 01260 g0a1
Figure A2. Reactor volume V, feed rate F i n , dilution rate D and CO 2 in the exhaust for the three example cases. Legend: A, maximum total biopolymer concentration; B, high 3HV concentration; and C, inhibition caused by propionic acid.
Processes 09 01260 g0a2

Appendix B. Parameter Identifiability

Figure A3. Profile likelihood of k 1 . Horizontal dashed line represents the explained sum of squares (ESS) value of the 95% confidence interval.
Processes 09 01260 g0a3
Figure A4. Profile likelihood of k 2 . Horizontal dashed line represents the ESS value of the 95% confidence interval.
Processes 09 01260 g0a4
Figure A5. Profile likelihood of k 3 . Horizontal dashed line represents the ESS value of the 95% confidence interval.
Processes 09 01260 g0a5
Figure A6. Profile likelihood of k 4 . Horizontal dashed line represents the ESS value of the 95% confidence interval.
Processes 09 01260 g0a6
Figure A7. Profile likelihood of k 5 . Horizontal dashed line represents the ESS value of the 95% confidence interval.
Processes 09 01260 g0a7
Figure A8. Profile likelihood of k 6 . Horizontal dashed line represents the ESS value of the 95% confidence interval.
Processes 09 01260 g0a8
Figure A9. Profile likelihood of k 7 . Horizontal dashed line represents the ESS value of the 95% confidence interval.
Processes 09 01260 g0a9
Figure A10. Profile likelihood of k 8 . Horizontal dashed line represents the ESS value of the 95% confidence interval.
Processes 09 01260 g0a10

Appendix C. Parameter Values and Initial Conditions

Table A1. Kinetic parameters, states and variables.
ParameterUnitDescriptionValue
fitted
k 1 (L 2 /(g 2 h))consumption of fructose
and ammonium for growth4.34 × 10 6
k 2 (L 2 /(g 2 h))consumption of propionic acid
and ammonium for growth0.0048
k 3 (L 2 /(g 2 h))HA consumption0.0713
k 4 (L/(g h))consumption of fructose
for 3HB accumulation0.0563
k 5 (L/(g h))consumption of propionic acid
for 3HB accumulation0.6803
k 6 (L/(g h))consumption of propionic acid
for 3HV accumulation2.0208
k 7 (L 2 /(g 2 h))fructose consumption
for maintenance3.4184 × 10 4
k 8 (L 2 /(g 2 h))propionic acid consumption
for maintenance0.0125
fixed
c p , i n h (g/L)inhibitory propionic acid concentration1.5 [33]
c n , s w (g/L)Michalis–Menten rate for ammonium0.2
c p , i n (g/L)propionic acid concentration in the feed20
c f r u (0)(g/L)initial fructose concentration
data set 1/data set 221.96/21.75
c p (0)(g/L)initial propionic acid concentration
data set 1/data set 20/0.48
c n (0)(g/L)initial ammonium concentration
data set 1/data set 21.74/1.40
c r e s (0)(g/L)initial residual biomass concentration
data set 1/data set 21.47/1.16
c h b (0)(g/L)initial 3HB concentration
data set 1/data set 20.03/0.03
c h v (0)(g/L)initial 3HV concentration
data set 1/data set 20/0.01
P t (g/L)HA (3HB+3HV) concentrationtime dependent
CO 2 , o u t (%)exhaust CO 2 measurement
CO 2 , i n (%)inlet CO 2 measurement
b C O 2 (-)CO 2 dependent metabolic activitytime dependent
D(-)dilution ratetime dependent
F i n (%)feed rate for propionic acidpH controlled [33]
P t , m a x (g/L)maximum concentration of PHA0.89 [37]

References

  1. Tan, G.Y.A.; Chen, C.L.; Li, L.; Ge, L.; Wang, L.; Razaad, I.M.N.; Li, Y.; Zhao, L.; Mo, Y.; Wang, J.Y. Start a research on biopolymer polyhydroxyalkanoate (PHA): A review. Polymers 2014, 6, 706–754. [Google Scholar] [CrossRef] [Green Version]
  2. Koller, M. A review on established and emerging fermentation schemes for microbial production of polyhydroxyalkanoate (PHA) biopolyesters. Fermentation 2018, 4, 30. [Google Scholar] [CrossRef] [Green Version]
  3. Bugnicourt, E.; Cinelli, P.; Lazzeri, A.; Alvarez, V. Polyhydroxyalkanoate (PHA): Review of synthesis, characteristics, processing and potential applications in packaging. Express Polym. Lett. 2014, 8, 791–808. [Google Scholar] [CrossRef] [Green Version]
  4. Nielsen, C.; Rahman, A.; Rehman, A.U.; Walsh, M.K.; Miller, C.D. Minireview Food waste conversion to microbial polyhydroxyalkanoates. Microb. Biotechnol. 2017, 10, 1338–1352. [Google Scholar] [CrossRef] [PubMed]
  5. Koller, M.; Atli, A.; Dias, M.; Reiterer, A.; Braunegg, G. Plastics from Bacteria—Microbial PHA Production from Waste Raw Materials; Springer: Berlin/Heidelberg, Germany, 2010; Volume 14, pp. 85–119. [Google Scholar] [CrossRef]
  6. Riedel, S.L.; Jahns, S.; Koenig, S.; Bock, M.C.E.; Brigham, C.J.; Bader, J.; Stahl, U. Polyhydroxyalkanoates production with Ralstonia eutropha from low quality waste animal fats. J. Biotechnol. 2015, 214, 119–127. [Google Scholar] [CrossRef] [PubMed]
  7. Brigham, C.J.; Riedel, S.L. The potential of polyhydroxyalkanoate production from food wastes. Appl. Food Biotechnol. 2019, 6, 7–18. [Google Scholar] [CrossRef]
  8. Garcia-Gonzalez, L.; De Wever, H. Acetic acid as an indirect sink of CO2 for the synthesis of polyhydroxyalkanoates (PHA): Comparison with PHA production processes directly using CO2 as feedstock. Appl. Sci. 2018, 8, 1416. [Google Scholar] [CrossRef] [Green Version]
  9. Jia, Q.; Xiong, H.; Wang, H.; Shi, H.; Sheng, X.; Sun, R.; Chen, G. Production of polyhydroxyalkanoates (PHA) by bacterial consortium from excess sludge fermentation liquid at laboratory and pilot scales. Bioresour. Technol. 2014, 171, 159–167. [Google Scholar] [CrossRef]
  10. Bengtsson, S.; Karlsson, A.; Alexandersson, T.; Quadri, L.; Hjort, M.; Johansson, P.; Morgan-Sagastume, F.; Anterrieu, S.; Arcos-Hernandez, M.; Karabegovic, L.; et al. A process for polyhydroxyalkanoate (PHA) production from municipal wastewater treatment with biological carbon and nitrogen removal demonstrated at pilot-scale. New Biotechnol. 2017, 35, 42–53. [Google Scholar] [CrossRef]
  11. Sabapathy, P.C.; Devaraj, S.; Meixner, K.; Anburajan, P.; Kathirvel, P.; Ravikumar, Y.; Zabed, H.M.; Qi, X. Recent developments in Polyhydroxyalkanoates (PHAs) production—A review. Bioresour. Technol. 2020, 306, 123–132. [Google Scholar] [CrossRef]
  12. Meereboer, K.W.; Misra, M.; Mohanty, A.K. Review of recent advances in the biodegradability of polyhydroxyalkanoate (PHA) bioplastics and their composites. Green Chem. 2020, 22, 5519–5558. [Google Scholar] [CrossRef]
  13. Gholami, A.; Mohkam, M.; Rasoul-Amini, S.; Younes, G. Industrial production of polyhydroxyalkanoates by bacteria: Opportunities and challenges. Minerva Biotecnol. 2016, 28, 59–74. [Google Scholar]
  14. Atli, A.; Koller, M.; Scherzer, D. Continuous production of poly ([R]-3-hydroxybutyrate) by Cupriavidus necator in a multistage bioreactor cascade. Biotechnol. Prod. Process. Eng. 2011, 91, 295–304. [Google Scholar] [CrossRef]
  15. Penloglou, G.; Vasileiadou, A.; Chatzidoukas, C.; Kiparissides, C. Model-based intensification of a fed-batch microbial process for the maximization of polyhydroxybutyrate (PHB) production rate. Bioprocess Biosyst. Eng. 2017, 40, 1247–1260. [Google Scholar] [CrossRef] [PubMed]
  16. Carius, L.; Pohlodek, J.; Morabito, B.; Franz, A.; Mangold, M.; Findeisen, R.; Kienle, A. Model-based State Estimation Based on Hybrid Cybernetic Models. IFAC-PapersOnLine 2018, 51, 197–202. [Google Scholar] [CrossRef]
  17. Morabito, B.; Kienle, A.; Findeisen, R.; Carius, L. Multi-mode Model Predictive Control and Estimation for Uncertain Biotechnological Processes. IFAC-PapersOnLine 2019, 52, 709–714. [Google Scholar] [CrossRef]
  18. Novak, M.; Koller, M.; Braunegg, G.; Horvat, P. Mathematical Modelling as a Tool for Optimized PHA Production. Chem. Biochem. Eng. 2015, 29, 183–220. [Google Scholar] [CrossRef]
  19. Špoljaric’, I.V.; Lopar, M.; Koller, M.; Muhr, A.; Salerno, A.; Reiterer, A.; Malli, K.; Angerer, H.; Strohmeier, K.; Schober, S.; et al. Mathematical modeling of poly [(R)-3-hydroxyalkanoate] synthesis by Cupriavidus necator DSM 545 on substrates stemming from biodiesel production. Bioresour. Technol. 2013, 133, 482–494. [Google Scholar] [CrossRef] [PubMed]
  20. Dias, J.M.; Serafim, L.S.; Lemos, P.C.; Reis, M.A.; Oliveira, R. Mathematical modelling of a mixed culture cultivation process for the production of polyhydroxybutyrate. Biotechnol. Bioeng. 2005, 92, 209–222. [Google Scholar] [CrossRef]
  21. Dias, J.M.; Oehmen, A.; Serafim, L.S.; Lemos, P.C.; Reis, M.A.; Oliveira, R. Metabolic modelling of polyhydroxyalkanoate copolymers production by mixed microbial cultures. BMC Syst. Biol. 2008, 2, 1–21. [Google Scholar] [CrossRef] [Green Version]
  22. Duvigneau, S.; Dürr, R.; Carius, L.; Kienle, A. Hybrid Cybernetic Modeling of Polyhydroxyalkanoate Production in Cupriavidus necator using Fructose and Acetate as Substrates. IFAC-PapersOnLine 2020, 53, 16872–16877. [Google Scholar] [CrossRef]
  23. Franz, A.; Song, H.S.; Ramkrishna, D.; Kienle, A. Experimental and theoretical analysis of poly(beta-hydroxybutyrate) formation and consumption in Ralstonia eutropha. Biochem. Eng. J. 2011, 55, 49–58. [Google Scholar] [CrossRef]
  24. Katoh, T.; Yuguchi, D.; Yoshii, H.; Shi, H.D.; Shimizu, K. Dynamics and modeling on fermentative production of poly(β-hydroxybutyric acid) from sugars via lactate by a mixed culture of Lactobacillus delbrueckii and Alcaligenes eutrophus. J. Biotechnol. 1999, 67, 113–134. [Google Scholar] [CrossRef]
  25. Duvigneau, S.; Dürr, R.; Kranert, L.; Wilisch-Neumann, A.; Carius, L.; Findeisen, R.; Kienle, A. Hybrid Cybernetic Modeling of the Microbial Production of Polyhydroxyalkanoates Using Two Carbon Sources. Comput. Aided Chem. Eng. 2021, 50, 1969–1974. [Google Scholar] [CrossRef]
  26. Franz, A.; Dürr, R.; Kienle, A. Population balance modeling of biopolymer production in cellular systems. IFAC Proc. Vol. 2014, 47, 1705–1710. [Google Scholar] [CrossRef] [Green Version]
  27. Dürr, R.; Franz, A.; Kienle, A. Combination of limited measurement information and multidimensional population balance models. IFAC-PapersOnLine 2015, 48, 261–266. [Google Scholar] [CrossRef]
  28. Strong, P.; Laycock, B.; Mahamud, S.; Jensen, P.; Lant, P.; Tyson, G.; Pratt, S. The Opportunity for High-Performance Biomaterials from Methane. Microorganisms 2016, 4, 11. [Google Scholar] [CrossRef]
  29. Jiang, Y.; Hebly, M.; Kleerebezem, R.; Muyzer, G.; van Loosdrecht, M.C. Metabolic modeling of mixed substrate uptake for polyhydroxyalkanoate (PHA) production. Water Res. 2011, 45, 1309–1321. [Google Scholar] [CrossRef]
  30. García, C.; Alcaraz, W.; Acosta-Cárdenas, A.; Ochoa, S. Application of process system engineering tools to the fed-batch production of poly(3-hydroxybutyrate-co-3-hydroxyvalerate) from a vinasses–molasses Mixture. Bioprocess Biosyst. Eng. 2019, 42, 1023–1037. [Google Scholar] [CrossRef]
  31. Ochoa, S.; García, C.; Alcaraz, W. Real-time optimization and control for polyhydroxybutyrate fed-batch production at pilot plant scale. J. Chem. Technol. Biotechnol. 2020, 95, 3221–3231. [Google Scholar] [CrossRef]
  32. Dürr, R.; Duvigneau, S.; Kienle, A. Microbial Production of Polyhydroxyalkanoates—Modeling of Chain Length Distribution. Comput. Aided Chem. Eng. 2021, 50, 1975–1981. [Google Scholar] [CrossRef]
  33. Kim, J.H.; Kim, B.G.; Choi, C.Y. Effect of propionic acid on poly (β-hydroxybutyric-co-β-hydroxyvaleric) acid production by Alcaligenes eutrophus. Biotechnol. Lett. 1992, 14, 903–906. [Google Scholar] [CrossRef]
  34. Duvigneau, S.; Kettner, A.; Carius, L.; Griehl, C.; Findeisen, R.; Kienle, A. Fast, inexpensive, and reliable HPLC method to determine monomer fractions in poly (3-hydroxybutyrate-co-3-hydroxyvalerate). Appl. Microbiol. Biotechnol. 2021, 105, 4743–4749. [Google Scholar] [CrossRef] [PubMed]
  35. Satoh, H.; Sakamoto, T.; Kuroki, Y.; Kudo, Y.; Mino, T. Application of the Alkaline-Digestion-HPLC Method to the Rapid Determination of Polyhydroxyalkanoate in Activated Sludge. J. Water Environ. Technol. 2016, 14, 411–421. [Google Scholar] [CrossRef] [Green Version]
  36. Koller, M.; Horvat, P.; Hesse, P.; Bona, R.; Kutschera, C.; Atlić, A.; Braunegg, G. Assessment of formal and low structured kinetic modeling of polyhydroxyalkanoate synthesis from complex substrates. Bioprocess Biosyst. Eng. 2006, 29, 367–377. [Google Scholar] [CrossRef] [PubMed]
  37. Mohidin Batcha, A.F.; Prasad, D.M.; Khan, M.R.; Abdullah, H. Biosynthesis of poly(3-hydroxybutyrate) (PHB) by Cupriavidus necator H16 from jatropha oil as carbon source. Bioprocess Biosyst. Eng. 2014, 37, 943–951. [Google Scholar] [CrossRef] [PubMed] [Green Version]
  38. Storn, R.; Price, K. Differential Evolution—A Simple and Efficient Heuristic for global Optimization over Continuous Spaces. J. Glob. Optim. 1997, 11, 341–359. [Google Scholar] [CrossRef]
  39. Raue, A.; Kreutz, C.; Maiwald, T.; Bachmann, J.; Schilling, M.; Klingmüller, U.; Timmer, J. Structural and practical identifiability analysis of partially observed dynamical models by exploiting the profile likelihood. Bioinformatics 2009, 25, 1923–1929. [Google Scholar] [CrossRef] [PubMed] [Green Version]
  40. Shang, L.; Jiang, M.; Ryu, C.H.; Chang, H.N.; Cho, S.H.; Lee, J.W. Inhibitory effect of carbon dioxide on the fed-batch culture of Ralstonia eutropha: Evaluation by CO2 pulse injection and autogenous CO2 methods. Biotechnol. Bioeng. 2003, 83, 312–320. [Google Scholar] [CrossRef]
  41. Park, J.M.; Kim, T.Y.; Lee, S.Y. Genome-scale reconstruction and in silico analysis of the Ralstonia eutropha H16 for polyhydroxyalkanoate synthesis, lithoautotrophic growth, and 2-methyl citric acid production. BMC Syst. Biol. 2011, 5, 101. [Google Scholar] [CrossRef] [Green Version]
Figure 1. Exhaust CO 2 for data set 1 (fructose as carbon source, left panel, +) and data set 2 (fructose and propionic acid as carbon sources, right panel, +) and the interpolations (solid lines).
Processes 09 01260 g001
Figure 2. Experimental feed rate and polynomial for the propionic acid inlet of data set 2 (fructose and propionic acid as carbon sources).
Processes 09 01260 g002
Figure 3. Experimental volume (small blue line) and polynomial (black curve) of data set 2 (fructose and propionic acid as carbon sources).
Processes 09 01260 g003
Figure 4. Consumption of substrates for two feeding scenarios: (a) fructose as a single carbon source without additional feeding (batch); (b) fructose and propionic acid as carbon sources with pH-dependent propionic acid feeding.
Processes 09 01260 g004
Figure 5. Production and degradation of polyhydroxyalkanoate (PHA) monomers (chb, chv) and total biomass (cbio = cres + chb + chv).
Processes 09 01260 g005
Figure 6. Simulation study with constant values for CO 2 and F i n .
Processes 09 01260 g006
Figure 7. Three example cases of dynamical behavior applying constant exhaust CO 2 and feed rate for propionic acid (profile study 1). Legend: A, maximum total biopolymer concentration (chb + chv); B, high 3HV concentration (chv); and C, inhibition caused by propionic acid (cp).
Processes 09 01260 g007
Publisher’s Note: MDPI stays neutral with regard to jurisdictional claims in published maps and institutional affiliations.

