Article

A New Symmetrical Thiazolidinedione Derivative: In Silico Design, Synthesis, and In Vivo Evaluation on a Streptozotocin-Induced Rat Model of Diabetes

by
Samuel Álvarez-Almazán
1,2,3,
Gabriel Navarrete-Vázquez
4,
Itzia Irene Padilla-Martínez
5,
José Correa-Basurto
6,
Diana Alemán-González-Duhart
3,
Feliciano Tamay-Cach
2,* and
Jessica Elena Mendieta-Wejebe
3,*
1
Laboratorio 4 de Biotecnología, Facultad de Estudios Superiores Cuautitlán, Campo 1, Universidad Nacional Autónoma de México, Avenida 1° de Mayo s/n, Santa María las Torres, Cuautitlán Izcalli, Estado de México 54740, Mexico
2
Laboratorio de Investigación en Bioquímica Aplicada, Sección de Estudios de Posgrado e Investigación, Escuela Superior de Medicina, Instituto Politécnico Nacional, Plan de San Luis y Salvador Díaz Mirón s/n, Casco de Santo Tomás, Ciudad de México 11340, Mexico
3
Laboratorio de Biofísica y Biocatálisis, Sección de Estudios de Posgrado e Investigación, Escuela Superior de Medicina, Instituto Politécnico Nacional, Plan de San Luis y Salvador Díaz Mirón s/n, Casco de Santo Tomás, Ciudad de México 11340, Mexico
4
Laboratorio de Química Farmacéutica, Facultad de Farmacia, Universidad Autónoma del Estado de Morelos, Av. Universidad 1001, Chamilpa, Cuernavaca 62209, Mexico
5
Laboratorio de Química Supramolecular y Nanociencias, Departamento de Ciencias Básicas, Unidad Profesional Interdisciplinaria de Biotecnología, Instituto Politécnico Nacional, Av. Acueducto s/n, Barrio La Laguna Ticomán, Ciudad de México 07340, Mexico
6
Laboratorio de Modelado Molecular, Bioinformática y Diseño de Fármacos, Sección de Estudios de Posgrado e Investigación, Escuela Superior de Medicina, Instituto Politécnico Nacional, Plan de San Luis y Salvador Díaz Mirón s/n, Casco de Santo Tomás, Ciudad de México 11340, Mexico
*
Authors to whom correspondence should be addressed.
Processes 2021, 9(8), 1294; https://doi.org/10.3390/pr9081294
Submission received: 2 July 2021 / Revised: 21 July 2021 / Accepted: 23 July 2021 / Published: 27 July 2021
(This article belongs to the Special Issue Animal Models for Diabetes)

Abstract

:
By activating PPAR-γ, thiazolidinediones normalize glucose levels in animal models of type 2 diabetes and in patients with this pathology. The aim of the present study was to analyze 219 new derivatives in silico and select the best for synthesis, to be evaluated for acute oral toxicity in female rats and for control of diabetes-related parameters in a rat model of streptozotocin-induced diabetes. The best compound was chosen based on pharmacokinetic, pharmacodynamic, and toxicological parameters obtained in silico and binding orientation observed by docking simulations on PPAR-γ. Compound 1G was synthesized by a quick and easy Knoevenagel condensation. Acute oral toxicity was found at a dose greater than 2000 mg/Kg. Compound 1G apparently produces therapeutic effects similar to those of pioglitazone, decreasing glycaemia and triglyceride levels in diabetic animals, without liver damage. Moreover, it did not cause a significant weight gain and tended to reduce polydipsia and polyphagia, while diminishing systemic inflammation related to TNF-α and IL-6. It lowered the level of endogenous antioxidant molecules such as reduced glutathione and glutathione reductase. In conclusion, 1G may be a candidate for further testing as an euglycemic agent capable of preventing the complications of diabetes.

1. Introduction

Diabetes is a complex and progressive metabolic disorder capable of generating a dreadful health condition. It derives from low or absent insulin activity [1] that results in hyperglycemia, defined as a blood glucose level above 126 mg/dL. When chronic, the latter condition triggers insulin resistance and many other possible long-term complications, including cardiovascular disease, diabetic nephropathy, and loss of vision.
The many strategies investigated to cure diabetes or attenuate disease progression are related to different pathogenic factors. Diabetes fosters greater insulin resistance in peripheral tissues (adipose, skeletal muscle, and liver tissue), causing a deterioration in the ability of this hormone to suppress hepatic glucose production, which in turn brings about an upregulated release of glucose from the liver. Additionally, the decrease in insulin secretion by β-pancreatic cells contributes to the chronic state of hyperglycemia [2], a condition resulting from the incapacity of glucose to cross the plasma membrane. The alteration in transmembrane glucose transport is due to pathogenic effects on the insulin signaling pathway, leading to a decrease in the activity of phosphatidylinositol-3-kinase (PI3K) and protein kinase B (PKB, also known as Akt). Hence, there is a poor translocation of glucose transporter type 4 (GLUT-4) to the membrane [1,3].
Because the activation of peroxisome proliferator-activated receptor gamma (PPAR-γ) produces an euglycemic effect (the normalization of glucose levels), it is a widely studied approach for treating diabetes [4]. These receptors are found in diverse tissues. Through the activation of PPAR-γ, thiazolidinediones (TZDs, also known as glitazones) modify the transcription of genes that encode for factors involved in the intake of glucose (e.g., GLUT-4 [5,6]) and in the metabolism of glucose and fatty acids [4,7]. Accordingly, they promote the sensitization of tissues to insulin.
PPAR-γ is bound to chromatin condensation corepressors in the cell nucleus in a latent state [4]. For PPAR-γ to be activated, its ligands have to reach the nucleus. Hydrophobic ligands of PPAR-γ bind to intracellular lipid-binding lipoproteins (iLBPs), which provide protection from the extracellular fluid and facilitate translocation to the cell nucleus, where ligand-receptor binding takes place. The consequent conformational change in PPARγ favors its binding to the retinoid X receptor alpha (RXR-⍺), and subsequently to 9-cis-retinoid acid if available (depending on the cell type). The permissive PPAR-γ/RXR-α heterodimer exhibits synergistic activity in the transcription of genes relevant to euglycemic activity [4].
Regarding TZDs that serve as PPAR-γ agonists (Figure 1), the structure contains an acid region (a TZD ring acting as the pharmacophore), an aromatic center, and a cyclic polar/nonpolar region or hydrophobic side chain [5,6,7,8,9,10]. Due to the relatively large ligand-binding pocket (1200 Å3) of the receptor [4,7], numerous chemical modifications have been proposed to construct glitazone derivatives, generating great structural diversity [5,6,7,8,9,10]. Several authors have suggested that the presence of a double bond in carbon 5 of glitazone derivatives is a favorable characteristic [5,6,7,8,11]. The resulting unsaturated tail prevents racemization and provides rigidity to the molecule [7], possibly explaining the capacity of such glitazone derivatives to increase PPAR-γ expression in vitro and in vivo (in rat models of type 2 diabetes), and thus to decrease hyperglycemia [5,6,8].
The many variations possible for PPAR-γ ligands implies a long and costly process for the discovery of the best compound to normalize blood glucose in tissues. A shortcut in this task is provided by computational studies, which are now widely used for rational drug design. These studies greatly facilitate the exploration of different aspects of ligands, such as their physicochemical and biological properties and their binding orientation with the corresponding receptor. Therefore, the search for molecules with good activity is more efficient [12], leading to lower costs and more rapid discovery of new drugs to improve patient treatment.
The first aim of the present study was to design 219 compounds in accordance with the desirable structural characteristics for glitazones, including a second pharmacophore nucleus (the red moiety in Figure 1). Based on pharmacokinetic, pharmacodynamic, and toxicological parameters obtained in silico, (5Z,5′Z)-5,5′-((oxybis(4,1-phenylene))bis-(methanylylidene))bis(thiazolidine-2,4-dione) was chosen for synthesis. This compound, herein denominated 1G, was evaluated for its acute oral toxicity in female rats and for its capacity to control blood glucose levels, redox parameters, and inflammation in a rat model of streptozotocin (STZ)-induced diabetes. Finally, the protein targets of 1G were predicted theoretically.

2. Materials and Methods
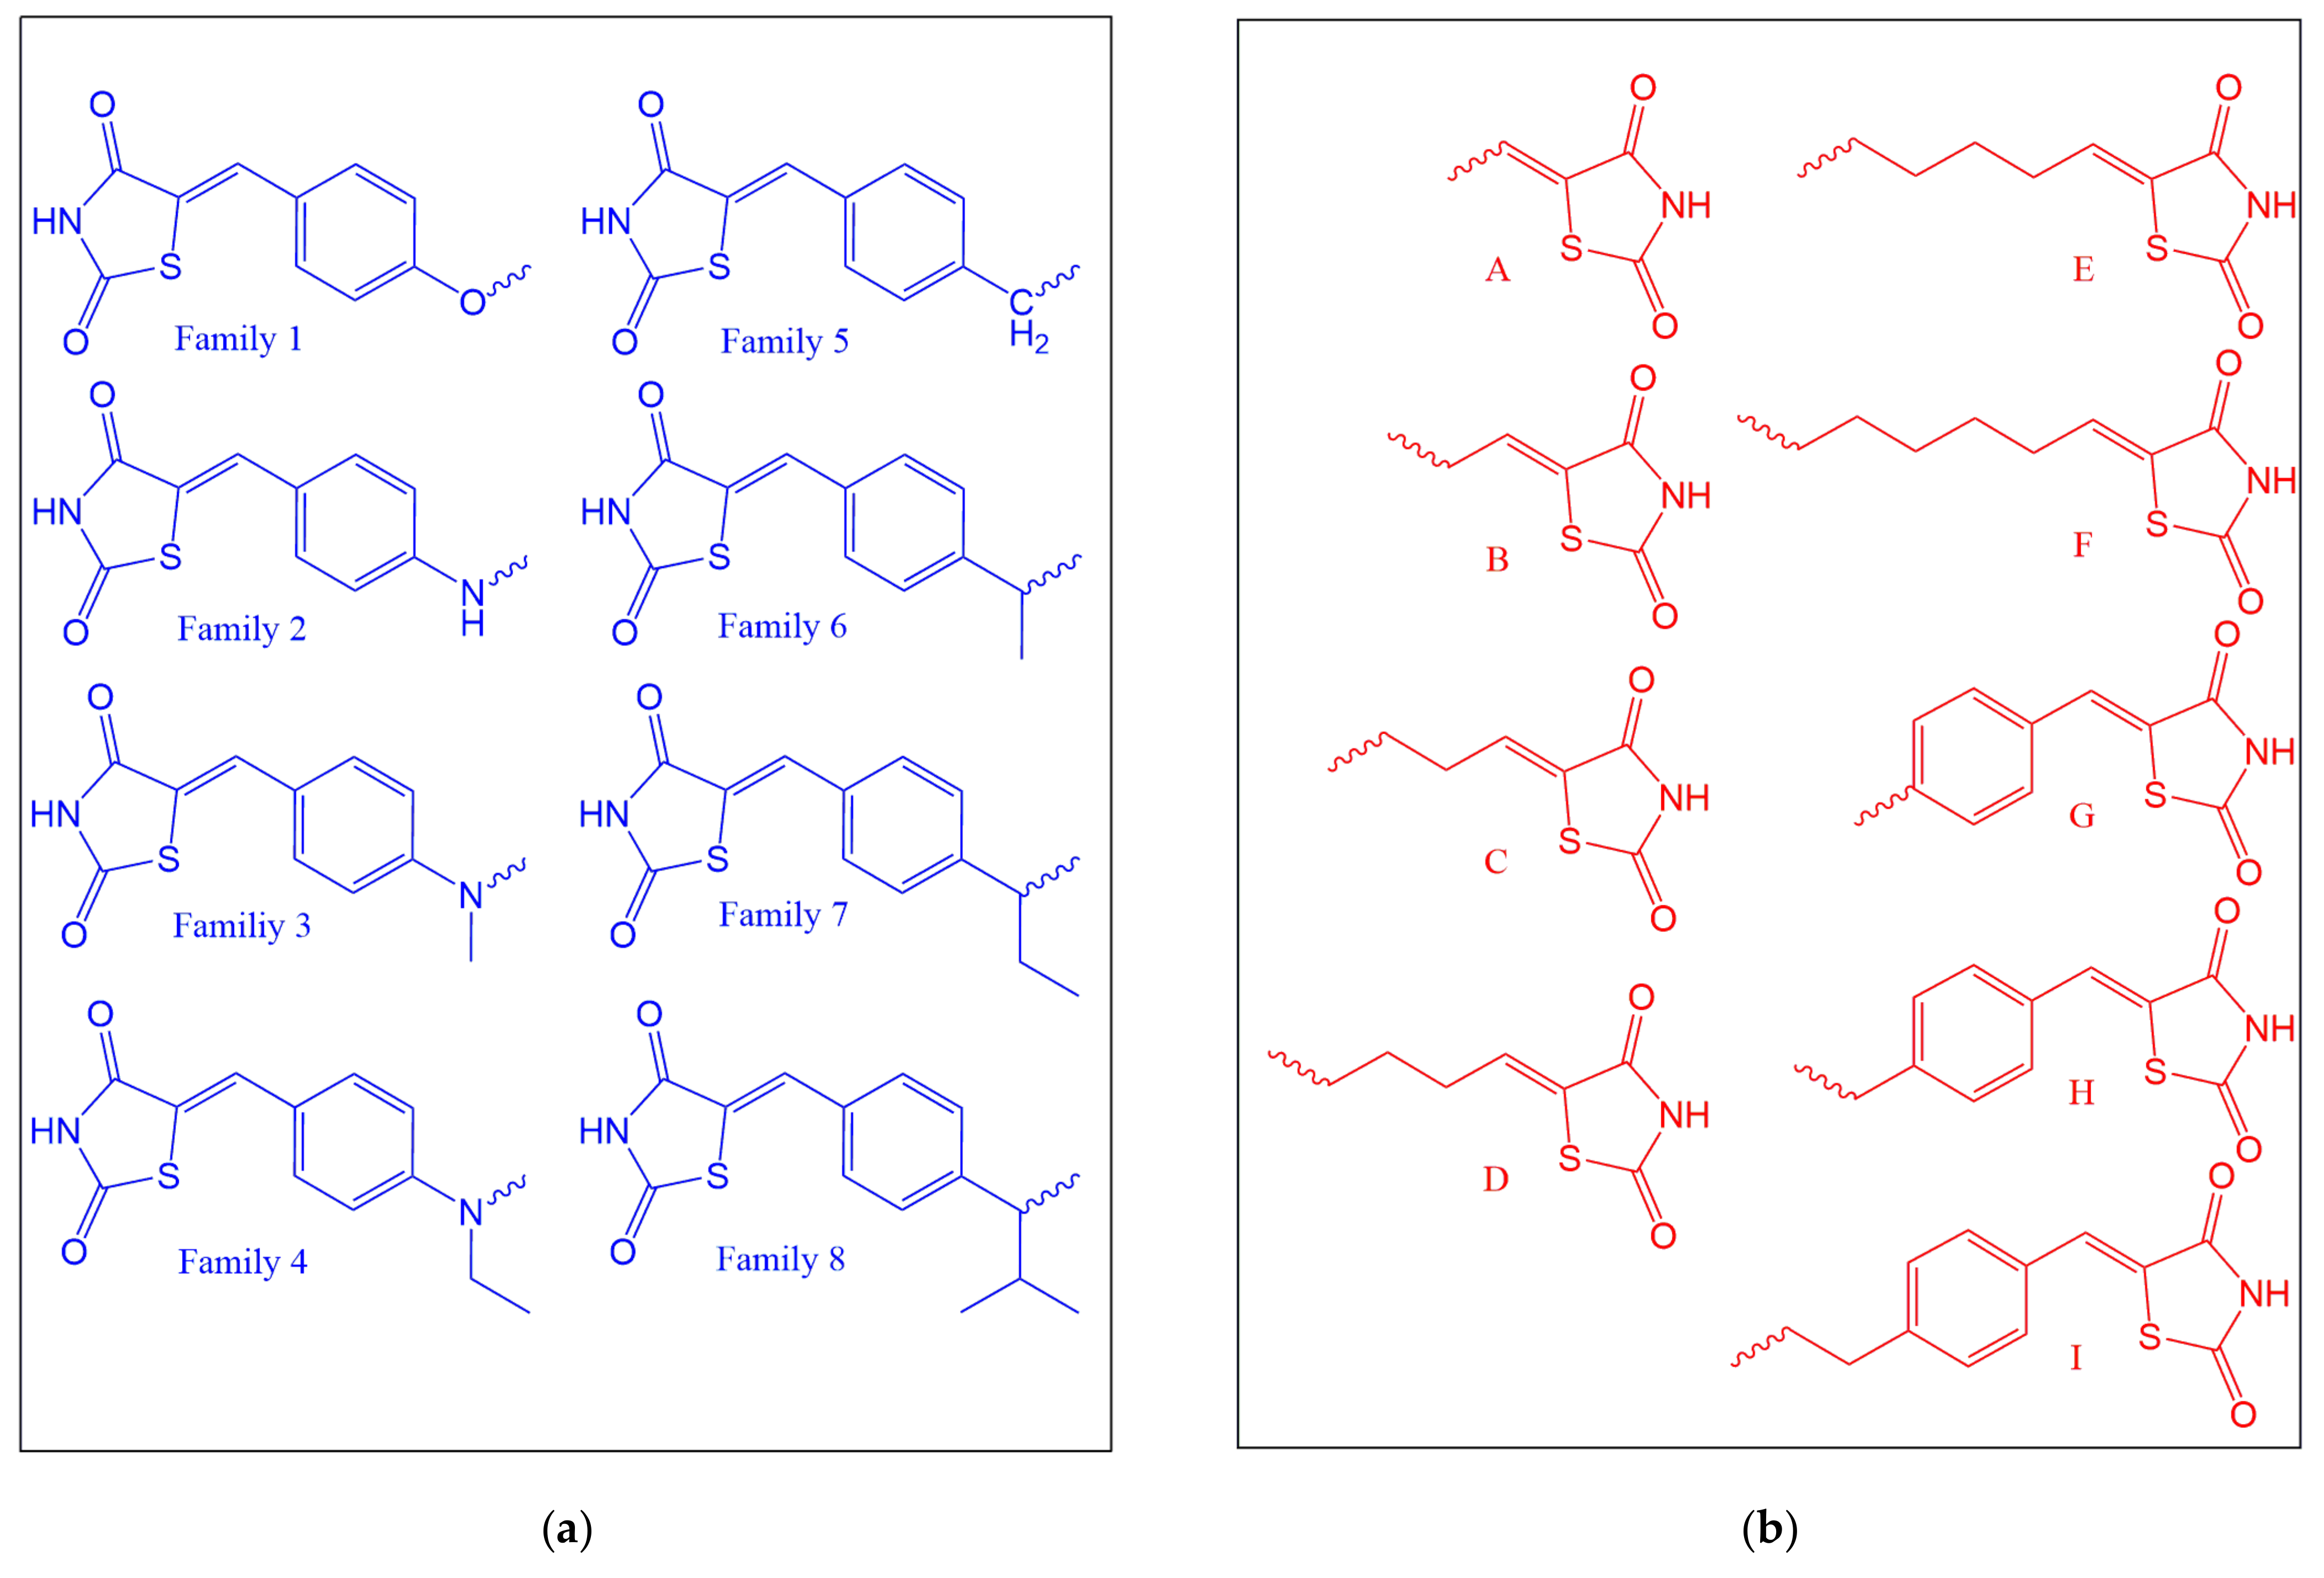
2.1. Ligand Design

The 219 compounds, designed to have a length and geometry similar to pioglitazone (PIO), were grouped into eight families. The names of the compounds were designated as a number, a capital letter, and a lowercase letter. The number refers to the family (Figure 2a, in blue), the capital letter to the structure of the tail (Figure 2b, in red), and the lowercase letter to the condition of being unsaturated on the aliphatic chain of the tail (Figure 2c, bonds in green). In families 1 and 4, number 1 was added at the end of the name when atom A cannot form a double bond, as occurs with oxygen and nitrogen in a tertiary amine. The families were clustered into three main groups: the oxygen group (family 1), the nitrogen group (families 2–4), and the carbon group (families 5–8).

2.2. Theoretical Determination of Physicochemical and Biological Properties

Physicochemical and biological properties were evaluated on two online servers: Molinspiration Cheminformatics [13] (http://www.molinspiration.com/cgi-bin/properties?textMode=1, accessed on 19 July 2020) and Osiris Property Explorer [14] (https://www.organic-chemistry.org/prog/peo/ accessed on 19 July 2020). The molecules were drawn using the chemical structure drawing menu that appears in each window. The following properties were found with Molinspiration Cheminformatics: the octanol-water partition coefficient (LogP), topological polar surface area (TPSA), molecular weight (MW), number of acceptors and donors of hydrogen bonds (H-bonds), number of rotatable bonds, volume, and number of violations of the recommendations by Veber et al. [15]. in relation to the bioavailability of drugs administered orally (PO). In addition, the simplified molecular input line entry specification (SMILES) code was obtained for compound 1G, being O(c1ccc(cc1)\C=C2\SC(NC2=O)=O) c3ccc(cc3)\C=C4\SC(NC4=O)=O [13]. The following biological and physicochemical properties of the test ligands were generated with the Osiris Property Explorer server [14]: mutagenicity, tumorigenicity, irritant effect, reproductive effects, LogP, water solubility (LogS), MW, TPSA, drug likeness and drug score [16].

2.3. Docking Studies

The two dimensional (2D) structure of ligands was drawn and optimized by the AM1 semi-empirical method, and the crystal protein data bank (PDB) ID entry for the ligand-binding domain of human PPAR-γ (2PRG) [17] was pre-optimized, in both cases as described previously [7]. The “A” chain was chosen, removing water, ligands, cofactors, and homodimers by using AutoDock Tools 1.5.6 Software (© 1999–2011, The Scripps Research Institute; http://www.scripps.edu/mb/olson/doc/autodock accessed on 15 December 2018). The grid maps were generated with AutoGrid4 software [8].
Protein-ligand interactions were simulated on AutoDock Tools 4.0.1 software in the Fedora Linux platform [8]. A 60 Å3 grid box was centered on the alpha carbon of the Leu 330 residue located on helix 3 (H3) of the crystallographic coordinates: X = 45.421, Y = −30.316, and Z = 15.349 [7]. The ligands were docked by utilizing a Lamarckian genetic algorithm with 100 runs and 1 × 10⁷ evaluations in a population of 100. The 2PRG crystal was considered a rigid molecule and the ligands as flexible. The binding free energy is expressed as ΔG, and the lowest value found for each ligand was the basis for making comparisons [7]. Docking was validated with rosiglitazone (BRL-49653) [17] on AutoDock 4.2 software, as previously reported [7], to determine whether the parameters for the simulations were capable of reproducing the ligand-protein interactions of the 2PRG entry [7].

2.4. Visualization of Interactions

H-bond interactions were analyzed with Visual Molecular Dynamics 1.9.1 software [(c) The Beckman Institute, University of Illinois at Urbana-Champaign [18]]. The H-bonds were assumed to have a distance of less than 3Å [19].

2.5. Selection of the Compound to Be Synthesized

The 219 compounds were screened by comparing the theoretical parameters related to physicochemical and biological properties as well as binding orientation. A numerical value was assigned to these parameters (Table 1), from which the drug score was calculated (blue column in Table S1, Supplementary Material). It includes all the values and punctuation of the parameters, along with the absolute numerical value of ΔG. All the compounds having a score of 20.0–23.2 (Table S1) and 3 or 4 rotatable bonds were selected. From the latter group, the compound with the lowest ΔG and the simplest synthetic route was selected for synthesis, and this was 1G.

2.6. Prediction of Pharmacokinetic/Toxicological Properties and Protein Targets of Compound 1G

Information was gathered in silico with the Molinspiration SMILES code. The prediction of absorption, metabolism and toxicity were furnished by the admetSAR program (http://lmmd.ecust.edu.cn/admetsar2 accessed on 20 February 2019). Values are expressed along with their probability (0–100%) of being accurate [16]. Toxicity was predicted on the ACD/Tox Suite program version 2.95. The following modules were employed: acute toxicity group 2.95, mean lethal dose (LD50) 2.95, the human ether-à-go-go related gene (hERG) 2.95, and cytochrome P450 (CYP450) inhibition 2.95 [20]. The program predicts cardiotoxicity, the inhibition of CYP450, the LD50 in rats and mice by different vias of administration, and acute toxicity.
A search was conducted on the SwissTargetPrediction server (http://www.swisstargetprediction.ch/ accessed on 24 February 2019) to find the targets of 1G in Homo sapiens, Mus musculus and Rattus norvegicus with the SMILES code. The target proteins (Table S2, Supplementary Material) appear in the order of estimated probability, according to the 2D and three dimensional (3D) similarity of the structure of 1G to that of other reported ligands in the database [21].

2.7. Chemical Synthesis of Compound 1G

All reagents were acquired from commercial suppliers and used as received. Compound 1G was afforded by the reaction of (4-(4-formylphenoxy)benzaldehyde (2.26 g, 1.0 mmol) (MKBK3285VP, Sigma-Aldrich, Toluca, Estado de México, México) as the limiting reagent and 2,4-thiazolinedinedione (0.28 g, 2.4 mmol, 2.4 equivalents) (BCBK1726V, Sigma-Aldrich, Toluca, Estado de México, México), in presence of piperidine (0.03 mL, 0.3 mmol, 30%, 05919ME, Sigma-Aldrich, Toluca, Estado de México, México) and benzoic acid (0.04 g, 0.3 mmol, 30%) (0946, Chemical Products Monterrey, Mexico). The reactants were crushed in an agate mortar. Benzoic acid, 2,4-TZD, and 5 mL of dry toluene were mixed by stirring for 30 min and then (4-(4-formylphenoxy)benzaldehyde was added. A Vigreux column was put in place and the mixture was heated to 40 °C, at which point piperidine was added, the Dean-Stark trap was connected to the system (with dry toluene [244511, Sigma-Aldrich, Toluca, Estado de México, México), and a refrigerant was utilized to initiate reflux (110 °C) under a nitrogen (N2) atmosphere. The reaction was monitored by thin-layer chromatography (TLC) with chloroform/methanol (95:5) for 3 h. The product was obtained from a Knoevenagel condensation (Figure 3). After evaporating the solvent and washing the solid with cold H2O, the solution was stirred for 10 min, filtered under vacuum, and washed eight times with 3 mL of ethanol [5,6,8]. As part of the chemical characterization, purity was first verified by TLC (SiO2), then by high-performance liquid chromatography (HPLC), and finally by the determination of the melting point on an IA 91,000 device (Electrothermal, Staffordshire, ST15 OSA, UK). Identification was carried out by means of infrared spectroscopy (IR), 1H and 13C nuclear magnetic resonance (NMR), and mass spectrometry (MS) (Figures S1–S6, Supplementary Material).
The IR spectrum (Figure S2) was recorded at 25 °C on a Frontier Spectrum 65 FT IR spectrophotometer (Perkin Elmer, Shelton, CT, USA) equipped with an ATR device. 1H- (Figure S3) and 13C (Figure S4)-NMR spectra were captured on a Mercury NMR spectrometer (Varian, Palo Alto, CA, USA) operating at 300 MHz (1H) and 75.46 MHz (13C) with deuterated dimethyl sulfoxide (DMSO-d6) as solvent. All chemical shifts (δ) are reported in parts per million (ppm) and coupling constants nJ (H–H) are expressed in Hz. The residual solvent peak served as the reference (1H, δ 2.50; 13C, δ 39.52). The signals are designated as a: s (singlet), d (doublet), t (triplet), q (quartet), m (multiplet) and br (broad). Electrospray ionization (ESI) liquid chromatography/MS was performed on an 6400 Series Triple Quadrupole instrument (Agilent Technologies, Waldbronn, Baden-Württemberg, Germany).
Compound 1G was purified with HPLC. The compound (18 mg) was dissolved in 1 mL of DMSO and diluted (1:9) in acetonitrile to produce a concentration of 1.8 mg/mL. The solution was filtered (Millipore Miller-HN Nylon 0.45 µm filter), and a sample of 20 µL was injected at 35 °C (at a flow rate of 1 mL/min) with a methanol/H2O mobile phase (60:40) for 11 min. A Zorbax SB C18 column was used (150 × 4.6 mm 5 µm) on an Agilent 1260 HPLC set with OpenLab EZChrom software.

2.8. Animals

Three female (135 ± 15 g, for the acute toxicity assay) and forty male (240 ± 20 g, for the diabetes model) albino Wistar rats were acquired from the bioterium of the Universidad Autónoma Metropolitana, Xochimilco Campus. They were kept in standard polypropylene boxes under controlled temperature (22 ± 2 °C) on a 12 h light/dark cycle and provided food and water ad libitum [2]. The feed was a conventional rodent laboratory diet (formula 5012, Rat Chow). The groups for the diabetes model (n = 6) were as follows: STZ vehicle (control, group 1), diabetic animals without treatment (group 2), and diabetic animals treated with 1G (group 3) or PIO (group 4). After experimentation, the animals were taken to the humanitarian endpoint by the intraperitoneal (ip) administration of 75 mg/kg of sodium pentobarbital to perform a necropsy [22] in the Biophysics and Biocatalysis Laboratory of the Escuela Superior de Medicina, Instituto Politécnico Nacional (Mexico). During the necropsy, internal organs and tissues were examined macroscopically, and liver tissue and blood serum were extracted to quantify the liver and blood parameters described in Section 2.14. The study was conducted based on the guidelines of the Declaration of Helsinki and approved by the Institutional Review Board: Internal Committee for the Care and Use of Lab Animals (CICUAL, according to the initials in Spanish, 10/21 June 2017) of the Escuela Superior de Medicina, Instituto Politécnico Nacional (Mexico). It complies with the Mexican norm for this matter (NOM-062-ZOO-1999, Technical Specifications for the Production, Care and Use of Laboratory Animals, SAGARPA), as well as the “Guide for the Care and Use of Laboratory Animals” of the National Research Council and National Institutes of Health (NIH Publications No. 8023, revised 1978).

2.9. Blood Sample Collection and Processing

A sample of 5 mL of blood was taken by cardiac puncture of the exposed heart of each Wistar rat under anesthesia. Subsequent to blood coagulation, the samples were centrifuged at 2500 rpm (1200× g) for 10 min to obtain the serum [23,24], which was frozen at −80 °C until needed. The serum samples were thawed at room temperature just before use.

2.10. Evaluation of Acute Oral Toxicity

Due to their greater sensitivity to toxicity risks, female Wistar rats (n = 3) were employed in the toxicity experiment, which was based on the procedures of Guide number 425 of the Organization for Economic Cooperation and Development (OECD) [25]. An initial dose of 175 mg/kg of compound 1G was administered PO to the first rat (according to the guidelines), which was monitored for 48 h. Since the animal showed no signs of toxic effects, the dose for the next rat was increased by a progression factor of 3.2 (550 mg/kg), also producing no signs of toxicity. Finally, the third rat received 2000 mg/kg [11,25].

2.11. Rat Model of Diabetes Induced by Streptozotocin

After a week of acclimation, a single ip dose (45 mg/kg of body weight) of STZ (Sigma Chemical Co. Toluca, Estado de México, México) was administered during week 1 to rats in groups 2, 3 and 4, following overnight fasting for 12 h [2,26] with free access to water. STZ was dissolved in 0.1 M sodium citrate buffer (pH 4.5) and administered in a final volume of 5 mL/kg [27]. Seven days later (week 2), the tail vein blood glucose level was measured with a glucometer (Accu-Check Active, Roche, Mannheim, Germany) and reactive strips (Accu-Check Active Glucose test strips, Roche). All rats having blood glucose levels ≥126 mg/dL were considered diabetic. The presence of hyperglycemia and the level of insulin confirmed a model very similar to type 2 diabetes. Since STZ induces type 2 diabetes with an effectiveness of 40 to 70% [28], the final number of animals is substantially reduced, in this case to 24 male rats for the pharmacological study.

2.12. Administration of Treatments

For the diabetic animals in groups 3 and 4, an equimolar dose of 1G (35.7 mg/kg/day) or PIO (30 mg/kg/day) was administered PO in a distilled water suspension during 2 weeks (weeks 5 and 6) [24,29,30]. For each administration, the dose was adjusted to the weight of the individual rat. A commercial PIO tablet of (Agopar®, Laboratorios Grinn, CDMX, México, 30 mg) was crushed in 7.5 mL of distilled water [26,28] and given to each animal in 4 mg/mL of water suspension.

2.13. The Glucose Tolerance Curve

Prior to the glucose tolerance test, the animals in all groups were fasted overnight for 12 h with free access to water. Each rat was weighed and then received a 2 g/kg glucose overload ip, and blood samples were taken from the tail vein for the first measurement of the blood glucose level [24]. Glucose levels were determined with a glucometer (Accu-Check Active, Roche, Mannheim, Germany) at 0, 15, 30, 45, 60, 90, 120, 180, 240 and 300 min after glucose administration [8,28]. To compare the effectiveness of the treatments, the area under the curve (AUC) of the glucose tolerance curve (GTC) (based on the blood glucose concentration over time) [6,22] was calculated on the GraphPad Prism 5.01 package (GraphPad Software; Science Inc., San Diego, CA, USA).

2.14. Liver and Blood Parameters

Glycemia, insulinemia, and metabolic parameters (cholesterol, triacylglycerides (TAG), and total proteins) were analyzed. Additionally, parameters related to heart and liver integrity were examined, including the following plasma enzymes: alkaline phosphatase (ALP), alanine aminotransferase (ALT), and aspartate aminotransferase (AST). An evaluation was also made of some molecules linked to the antioxidant system: glutathione reductase (GRed), glutathione peroxidase (GSHpx), catalase (CAT) and superoxide dismutase (SOD). Two molecules related to inflammation were monitored: tumor necrosis factor alpha (TNF-α) and interleukin (IL)-6. The levels and activity of all these molecules were assessed with commercial kits, using Randox (Crumlin, County Antrim, UK) kits for determinations of glucose (GLUC-PAP, Cat. GL 2614), cholesterol (Cat. CH 201), TAG (Cat. TR 210), total proteins (Cat. TP 245), ALP (Cat. AP 307), ALT (Cat. AL 1268), AST (Cat. AS 1267), GRed (Cat. GR 2368), GSHpx (Cat. RS 505), and SOD (Cat. SD 125). CAT was examined with the CAT Kit (Cat. 707002, Cayman, Ann Arbor, Michigan, USA). Insulin (Cat. EZRMI-13K), TNF-α (Cat. No. EZRTNFA), and IL-6 (Cat. EZRIL6) were evaluated with Millipore (Merck KGaA, Darmstadt, Alemania) kits.
The glutathione (GSH) concentration was analyzed with the 5,5-dithio-bis-(2-nitrobenzoic acid (DTNB) chromogenic reagent technique [31]. After weighing and homogenizing 50 ± 5 mg of liver tissue in 2.5 mL of metaphosphoric acid (3%), the concentration of GSH in each sample was interpolated in a standard curve for a standard GSH solution (0.5 g in 4 mL of distilled water). The preparations were made according to a previously reported technique [32].

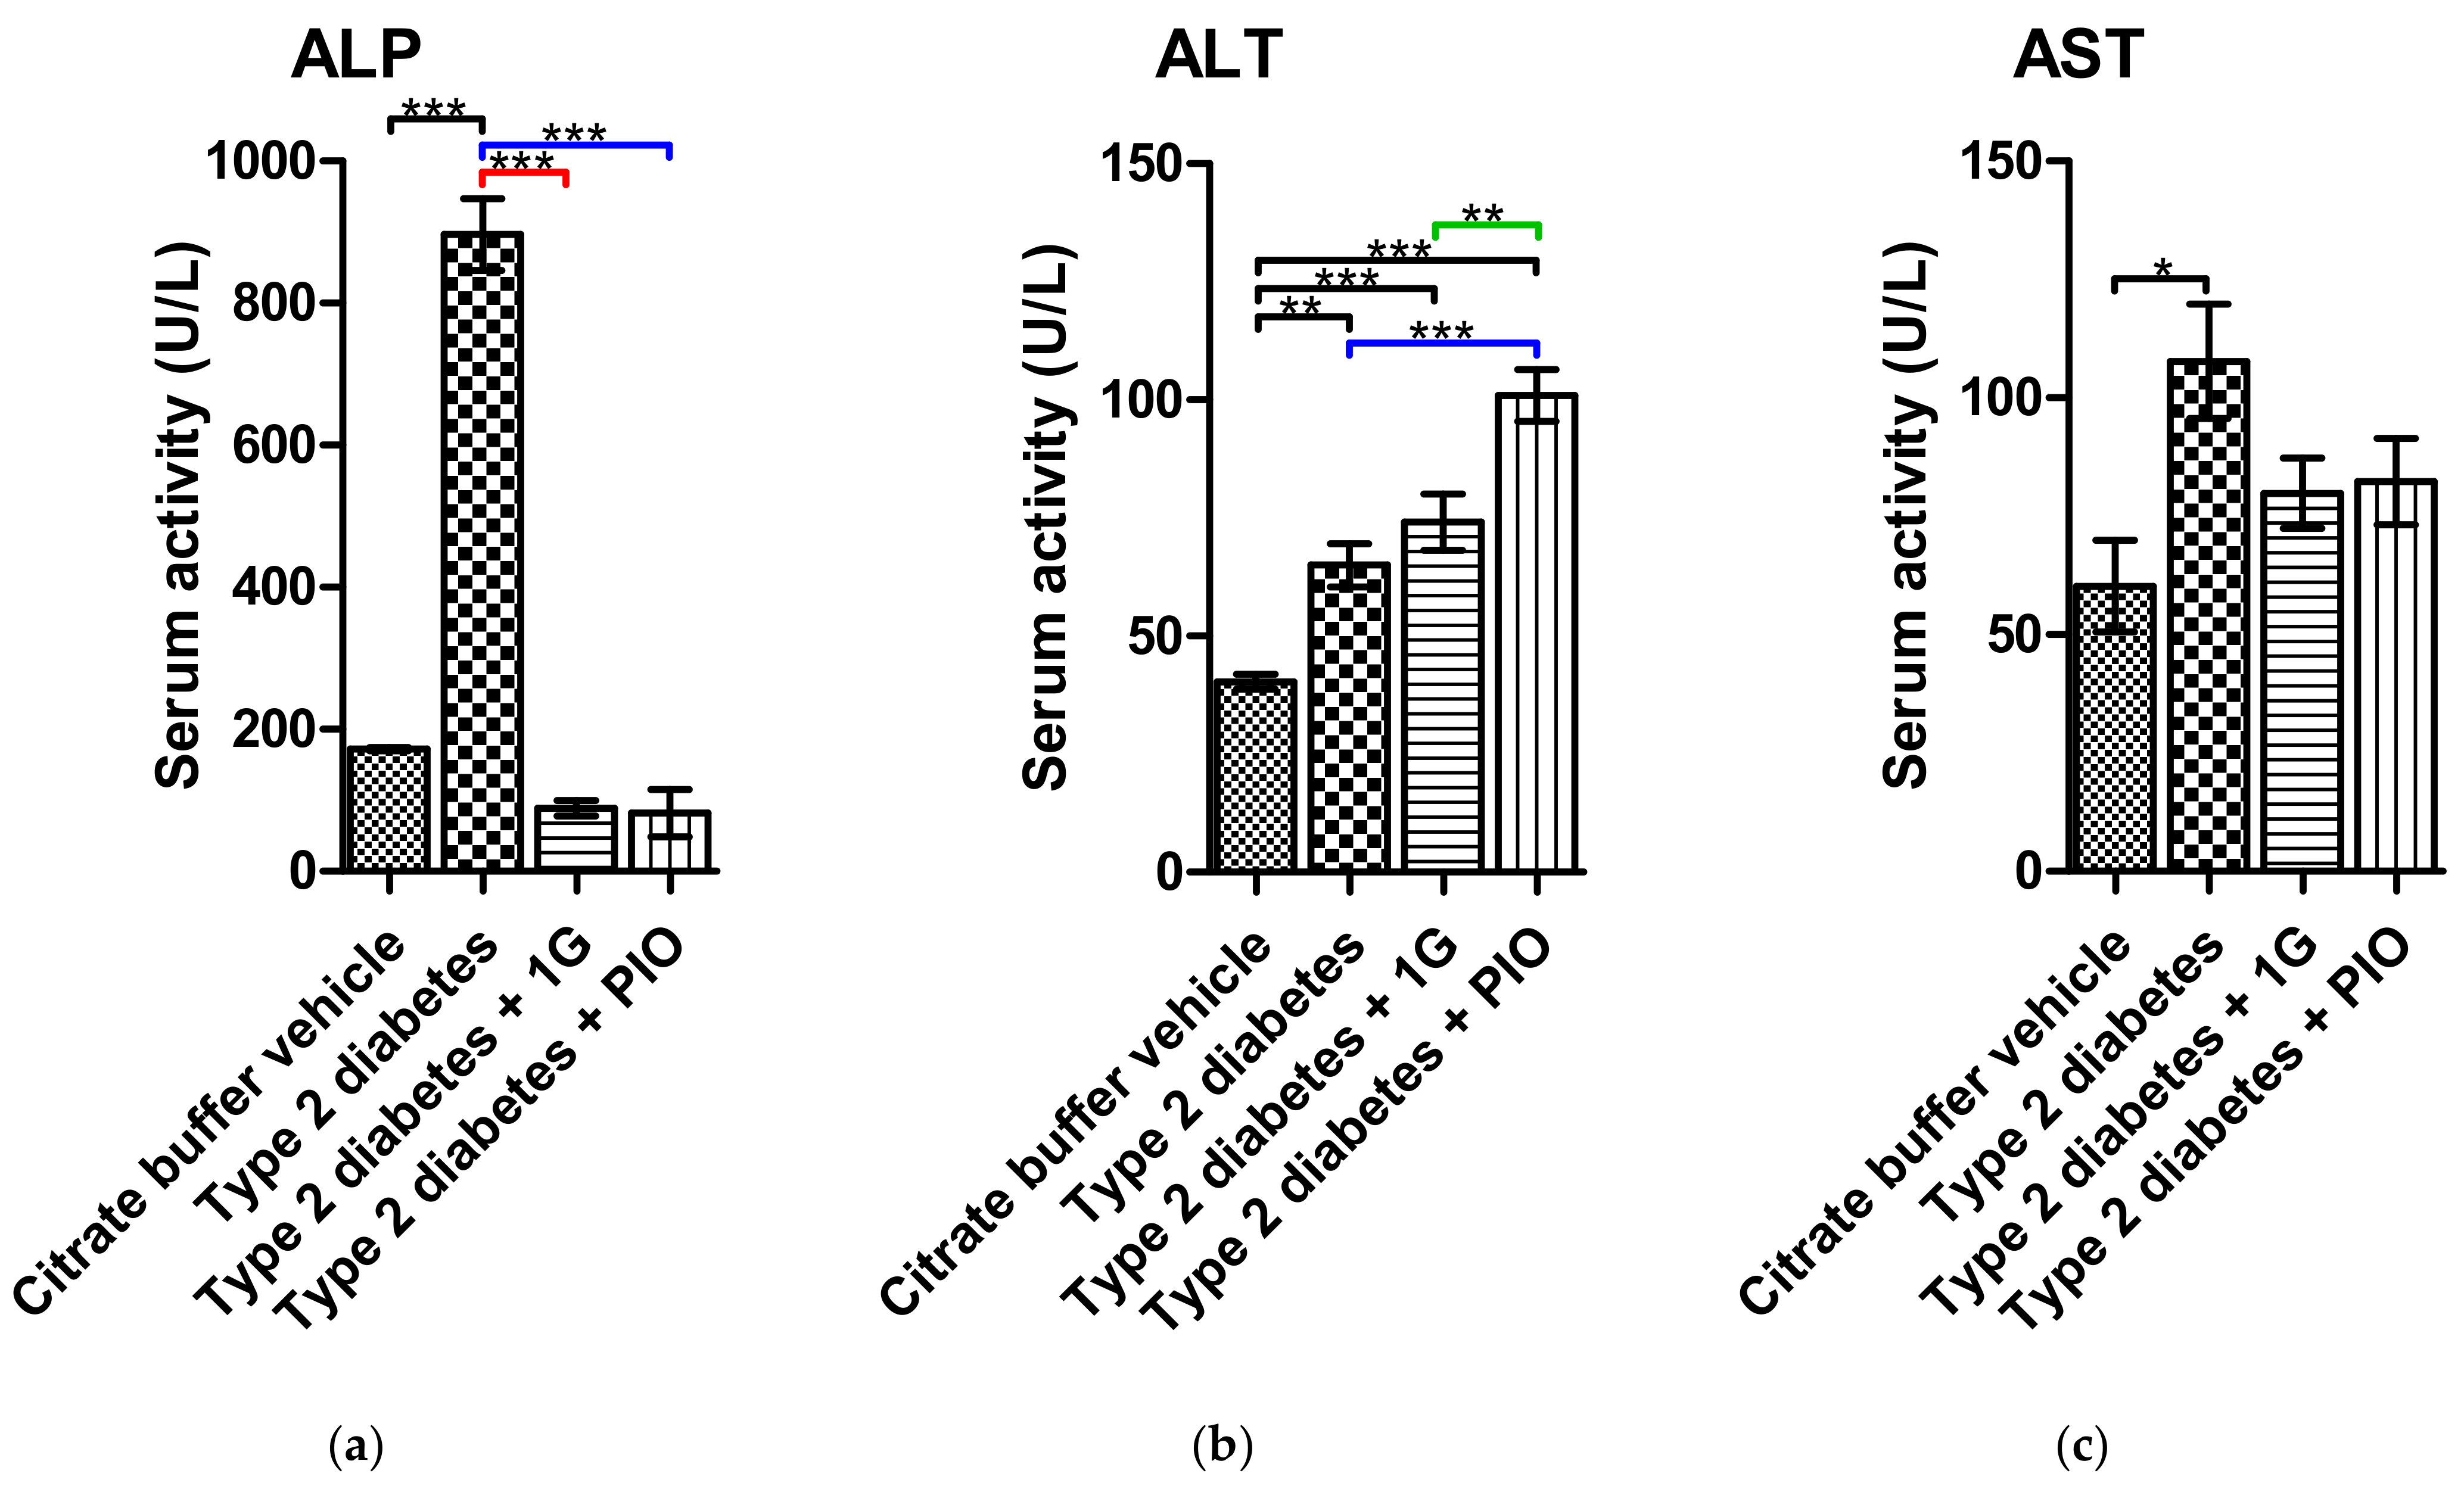
2.15. Determination of ALT and AST Activity

To quantify enzyme activity, 0.1 mL of serum was placed in the spectrophotometer cell, then mixed with 1 mL of the kit (see Section 2.14) reagent. The absorbance was measured on a PerkinElmer UV/Vis spectrophotometer (Lambda 25) at 340 nm after 1, 2 and 3 min to calculate the activity per minute. The assays were performed in triplicate.

2.16. Statistical Analysis

The data were expressed as the mean ± standard error of the mean (M ± SEM) [2,24] and analyzed by one-way analysis of variance (ANOVA), then compared with the Bonferroni post hoc test. Statistical significance was considered as 0.05 > p < 0.01 (*, significant), 0.01 > p < 0.001 (**, very significant), and p < 0.001 (***, extremely significant). The corresponding graphs were constructed on the GraphPad Prism 5.01 package [26].

3. Results and Discussion

The process of drug design and development is a long and costly process, especially when a wide range of possibilities exist for modifying the ligands of a given receptor. Such is the case for glitazones to activate PPAR-γ. The task would be extremely slow and difficult without the assistance of computational tools.

3.1. Docking

The 219 compounds (Table S1, Supplementary Material) herein designed were examined in silico to find the best candidate for further research. To assure that the current configuration of docking simulations was able to produce accurate results (before screening the test compounds), the settings were validated with three controls: PIO, rosiglitazone (the BRL-49653 co-crystallized ligand of the 2PRG PDB entry), and troglitazone. The control molecules reproduced the reported data (Table 2) in relation to binding mode and affinity. The reported ΔG of rosiglitazone [33] is very similar to that generated in this study (ΔG = −10.22 kcal/mol vs. −10.106 kcal/mol, respectively). Moreover, the documented bond lengths [7,24,34] are similar to those found presently with amino acids Ser289 (1.93 vs. 1.78 Å), His323 (1.86 vs. 2.01 Å), Tyr473 (1.81 vs. 2.30 Å), His449 (1.39 vs. 2.07 Å), and Gln286 (1.74 vs. 1.87 Å).
The binding mode of most test compounds (defined by H-bonds) was similar to that of PIO [8] (Figure 4), reaching the following main residues: His449, Tyr473, His323, Ser289 and Gln286. The ΔG of the compounds (Table 3) ranged from −13.44 to −5.07 kcal/mol. Only 24% of the compounds (e.g., 1D, 2Da, 3E and 4Ih) did not display the binding mode shown by PIO. According to the results, the binding mode does not depend on affinity, as illustrated by the wide gap in affinity between compounds 3E and 4Ih (ΔG = −5.07 vs. −12.59 kcal/mol, respectively), both with the same binding mode.
The nitrogen group (family 3) generally showed limited affinity and contained the compound with the highest ΔG (−5.07 kcal/mol). Contrarily, most compounds in the carbon group (families 5–7 and particularly 8) exhibited good affinity. Included in this group was the derivative with the lowest ΔG (−13.44 kcal/mol), indicating a greater affinity for the receptor. Since it had the most branched atom at position 13, the presence of hydrophobic regions in this position seems to increase affinity. The carbon group consists of very bulky, hydrophobic, and rigid compounds (either unsaturated or with aromatic rings). These results coincide with the reports by Parmenon et al. [9] and Cho et al. [10], and with the hydrophobic characteristics of physiological ligands [7].
From a theoretical point of view, ligands can interact with the ligand binding pocket (1200 Å) because their total volume is less than half that of the receptor cavity [4,7]. The bioavailability of a drug administered PO, defined as its capacity to reach the therapeutic target, is determined by molecular flexibility (governed by the number of rotatable bonds), polar surface area, and total number of H-bonds (the sum of donors and acceptors) [15]. The presence of several rotatable bonds makes a ligand more flexible and therefore more likely to be able to pass through lipid membranes to enter a cell. In the absence of molecular flexibility, however, some PPAR-γ ligands are translocated from the extracellular fluid to the cell nucleus by iLBPs [15]. In such a case, molecular rigidity could possibly increase the time of PPAR-γ ligands in the cell, which should enhance the effects of the ligands when given at a low dose. Consequently, a reduced number of rotatable bonds was established as a criterion for the selection of the compound to be synthesized. Compound 1G has four rotatable bonds, compared to five for rosiglitazone and seven for PIO and troglitazone.

3.2. Prediction of the Phisicochemical Properties of 1G

Among the test compounds, no violations were found in regard to the recommendations by Veber et al. [19] (Table 4), according to the data obtained from Molinspiration. There was a wide range of LogP values (0.9 to 4.9), a parameter related to the TPSA (68.3 to 122.2 Å), which in turn is linked to total volume (263 to 426 Å). On the other hand, narrower intervals were observed for MW (346 to 493 g/mol), the number of donors (5 to 7) and acceptors (1 to 3) of H-bonds, and the number of rotatable bonds (3 to 9).

3.3. Toxicityriskassessment

Based on the Osiris Property Explorer prediction, only the molecules of the nitrogen group (families 2–4) have a high risk of mutagenicity, tumorigenicity and reproductive effects (Table 5). The TPSA of all the compounds exceeds the recommended value of 140 Å [15]. The rest of the parameters (irritant effect, LogP, LogS and MW) are within the recommended range [15] and are similar to those found by Molinspiration. An elevated TPSA value has been linked to decreased intestinal absorption [15]. According to these predictions, compounds of the nitrogen group are apparently not viable as new therapeutic options, although this is by no means definitive proof.

3.4. Prediction of Bioavailability and Toxicity

Although three glitazones have been used clinically for the reduction of hyperglycemia, PIO is the only treatment currently available. Rosiglitazone has been associated with cardiovascular damage and troglitazone with hepatotoxicity [34]. This emphasizes the importance of attempting to predict the toxicity of newly developed euglycemic agents. Hence, consideration was herein given not only to the pharmacokinetic parameters governing the capacity of a molecule to reach the target site (ADME: absorption, distribution, metabolism, and excretion) but also to toxicity. All these properties taken together, known as ADMET, play a crucial role in the discovery and development of new drugs that have good bioavailability and safety [16].
According to the present theoretical ADMET results (Table 6), 1G appears to have good absorption characteristics, giving it a high probability of crossing the intestinal epithelium (99%) and the blood-brain barrier (90%) in humans. It has a medium likelihood (59%) of permeating human colon adenocarcinoma (Caco-2) cells, evidenced by the value of 1.0474 cm/s. Furthermore, there is a 64% probability that 1G is not a substrate of glycoprotein P and a high probability that it is not an inhibitor of this protein (96%) or of the renal transporter of organic cations (86%).
Compound 1G appears to have good intestinal absorption, according to the theoretical prediction, despite the TPSA value. Theoretical predictions are based on information from molecules with a similar structure in each database [13,14,16]. Hence, there may be differences between the predictions afforded by the various servers. Moreover, the unique structure of each molecule determines particular behaviors sometimes not fully described by the information contained in the prediction programs. Since bioavailability is governed by the equilibrium of the diffusion and transport of molecules, the predictions of absorption must be favorable. Parameters commonly utilized to portray this equilibrium are Caco-2 permeability, human intestinal absorption, and the LogP [16]. According to the results, 1G is likely to have good bioavailability.
The most relevant predictors of metabolism indicate low levels of toxicity for 1G against CYP450 proteins. For example, it presents a medium probability of being an inhibitor of the CYP1A2, CYP2C9, CYP2C19 and CYP3A4 isoforms (55–62%) as well as a good probability of not being an inhibitor of the CYP2D6 isoform (68%) and of not being a substrate of the CYP2C9, CYP2D6 and CYP3A4 isoforms (63–84%). It displays a high inhibitory promiscuity (88%). Among the multiple isoforms of CYP450, CYP3A4 and CYP2C9 are the most important because they are responsible for the metabolism of most drugs [35]. The data suggest that 1G can be metabolized by the CYP2C9, CYP2D6 and CYP3A4 isoforms, and has a moderate possibility (55–62%) of inhibiting the CYP450 complex and thus of interacting with the metabolism of other drugs. The latter prediction of drug interaction correlates with the use of glitazones in polytherapy to treat type 2 diabetes [1,36].
The predicted toxicity characteristics show a median possibility (56%) of 1G being classified with an acute oral toxicity category III (in accordance with the Globally Harmonized System (GHS) of Classification and Labeling of Chemicals). The acute toxicity value in rats was 2.3 mol/kg (992.6 g/kg). The toxicity predictions coincide for all the servers currently employed, and these results match the ACD/Tox Suite data (see next section).
The gravest possible types of toxicity of new molecules are the generation of mutagenesis (Ames-type toxicity) and carcinogenesis [20,37]. According to the theoretical predictions, 1G does not present Ames-type toxicity (74%) and is not carcinogenic (86%). Additionally, it is a weak blocker (98%) or non-blocker (89%) of hERG channels, which regulate heart rhythm. Since such channels allow potassium to be released from the cytoplasm, a blockage gives rise to unfavorable cardiac effects [38]. Hence, 1G is probably not cardiotoxic. Low toxicity is an advantage that facilitates the acceptance of a new drug.
Unfortunately, a very great likelihood (99%) exists that the compound produces toxic effects in the environment by damaging fish (mean lethal concentration, LC50 = 0.8 mg/L) and Tetrahymena pyriformis (a common protozoa in aquatic ecosystems; LC50 = 0.8 µg/L). There is an intermediate possibility (54%) of toxicity towards honeybees and an elevated probability (85%) of the compound not being readily biodegraded. The results suggest the need for special care to avoid disposing of the compound into the environment [16,39].

3.5. Toxicity Prediction

The ACD/Tox Suite program predicts (Table 7) a median likelihood (49%) of 1G being a hERG blocker (cardiotoxic) at clinically relevant concentrations (<10 µM). It has a low probability (27%) of behaving as an inhibitor of CYP450 2C9 (at 10 µM) and of causing drug-drug interactions (0–27% of inhibiting various CYP450 isoforms). These results coincide with the admetSAR data (Table 6).
Compound 1G appears to have moderate toxicity (harmful if swallowed), which would imply the classification as category III according to the OECD and GHS (having an LD50 > 50 and ≤2000 mg/kg). Likewise, the mouse LD50 values by the ip, PO, intravenous (IV) and subcutaneous (SC) routes (ip = 350 mg/kg, PO = 790 mg/kg, and IV = 59 mg/kg, and SC = 200 mg/kg) indicate a probable lack of toxicity at a dose of 59 mg/kg IV. The rat LD50 is 97 mg/kg ip. Thus, theoretical predictions of toxicity indicate the likelihood that 1G can be safely administered at a dose of 75 mg/kg for an acute oral toxicity study in rats.

3.6. Synthesis and Characterization

Since 1G has four rotatable bonds, it is a semi-rigid molecule. The synthetic procedure employed for 1G afforded a yellow solid after 3 h of reaction (3.5 g, 83% yield), with a melting point of 295 °C. In TLC, the Rf was 0.33 in a chloroform/methanol mobile phase (95:5). The compound was soluble in DMSO (18 mg/mL), ethanol (3.6 mg/mL) and dH2O (2.7 mg/mL). Purity determined by HPLC was 97% (Figure S1). The identity of the compound was confirmed with IR (Figure S2), NMR (Figures S3–S5) and MS (Figure S6). IR (cm−1): 3165.4 (N-H), 3045.0 (=C-H), 2781.7 (N-H), 1747.9 (C=O), 1702.2 (C=O), 1683.9 (C=C), 1155.1 (=C-O). 1H-NMR (DMSO-d6): δ/ppm 7.16 (d, 2H, H-9), 7.19 (d, 2H, H-9′), 7.60 (d, 2H, H-8′), 7.63 (d, 2H, H-8), 7.76 (d, 2H, H-6) y 12.00 (d, 2H, NH). 13C-NMR (75.4 MHz, DMSO-d6): δ/ppm 120.0 (C-9), 122.9 (C-5), 129.3 (C-7), 131.4 (C-6), 132.8 (C-8), 157.8 (C1-0), 167.9 (C-4) and 168.3 (C-2). ESI-MS (m/z): 425.0277 (M+) vs. calculated 425.0260 (M+).

3.7. Accute Oral Toxicity Assay

The administration of 1G did not cause toxic effects to female Wistar rats at any of the three doses (Table 8), in complete agreement with the theoretical predictions (admetSAR and ACD Tox Suite software). The acute oral toxicity of 1G is at a dose higher than 2000 mg/kg and therefore the administration of 35.7 mg/kg for the in vivo study is safe. At the latter dose, a greater quantity of intraperitoneal adipose tissue was induced (Figure 5), the color of the liver became darker, and the lumen of the large intestine showed increased volume. The values for ALT and AST activity were not elevated, considering that normal levels in female Wistar rats are 40 and 60 U/L, respectively [26].
The results suggest the absence of liver damage and no alteration in the enzymatic activities of ALT and AST, even when 1G was administered at 2000 mg/kg. The presence of a darker color of the liver at the highest dose could have been due to the greater biotransformation of the compound or an irritation event in the intestine. It is necessary to conduct a more in-depth study of this compound in relation to liver toxicity. Finally, a dose-dependent increase was observed in the amount of adipose tissue, indicating the likelihood of the activation of PPAR-γ by 1G, considering that the formation and maturation of adipocytes is linked to receptor activation [40]. Despite the dose-dependent increase in adipose tissue, the weight gain during the 2-week duration of the acute oral toxicity test was very similar between the three different doses. Compound 1G is analyzed under the hypothesis that it acts in a similar way as PIO due to the structural similarity, the docking results, and the generation of adipose tissue by both compounds.

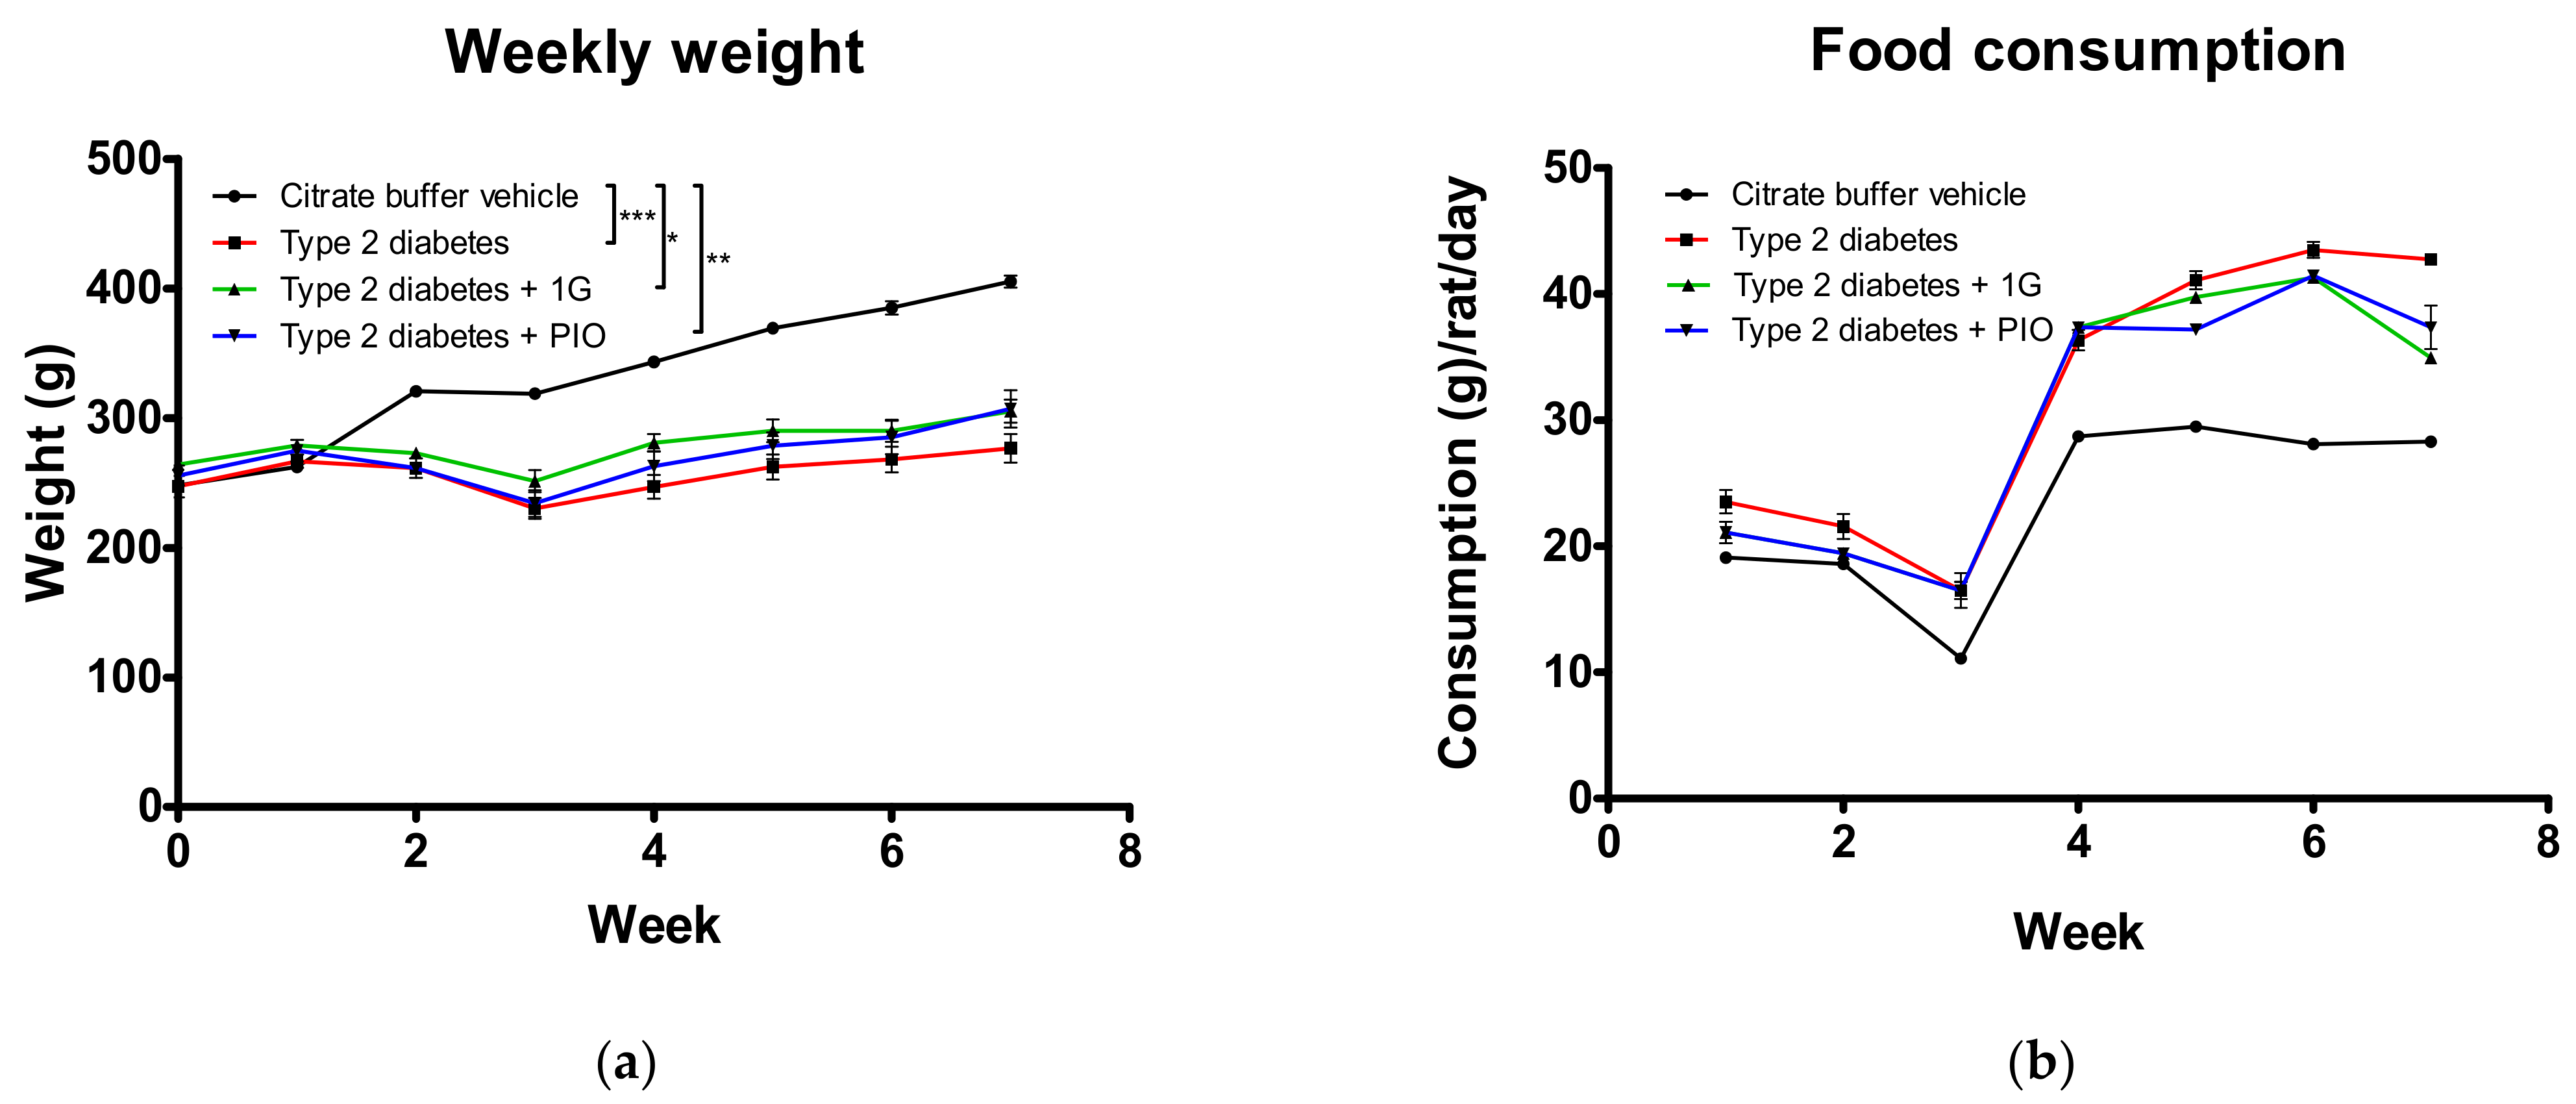
3.8. In Vivo Administration of 1G in a Rat Model of Diabetes

Diabetes is a complex metabolic disease characterized by insulin resistance in the liver and peripheral tissues, leading to chronic hyperglycemia [4] (defined as blood glucose levels over 126 mg/dL [36]). The model developed is classified as “other types of diabetes”, according to the International Diabetes Federation [36]. However, since the alterations are very close to those described in patients with type 2 diabetes, the results will be discussed in this regard.
The weight (Figure 6a) of the diabetic animals (without treatment or treated with 1G or PIO) decreased extremely significant (p < 0.001) in relation to the group given the citrate buffer (STZ vehicle). There was a tendency to greater body weight for the PIO- versus 1G-treated animals. PIO is able to trigger differentiation by PPAR-γ activation [24]. Animals with type 2 diabetes consumed more food (Figure 6b) and water (Figure 6c). Hence, the results are similar to the symptoms of patients with type 2 diabetes, which include weight loss despite polyphagia (higher food consumption), polydipsia (higher water consumption) and polyuria (greater generation of urinary volume) [36]. The only significant difference in water consumption was between the untreated rats with STZ-induced type 2 diabetes and the vehicle-treated animals (without diabetes), although compound 1G produced a tendency to a decrease during the second week of administration (week 6–7).
Fasting blood glucose levels and the GTC, tests used to diagnose type 2 diabetes [36], were statistically different between the animals with diabetes and those given the citrate buffer only (Figure 7). At the beginning of the administration of the treatments (week 5) and one week later (week 6), a lower AUC was found in the PIO- versus 1G-treated group (Table 9, Figure 7c; 118,846 vs. 124,415, respectively). The groups given 1G (35.7 mg/kg/day) or PIO (30 mg/kg/day) each displayed a non-significant decrease in glucose levels after 300 min. The blood glucose levels diminished more rapidly during weeks 5 and 6 for PIO-treated rats, and during week 7 for 1G-treated animals (Figure 7d). A lower AUC was obtained at the end of the 2-week treatment (week 7) in the 1G- versus PIO-treated animals (Table 9; 120,404 vs. 121,853, respectively), even though the level of this parameter was higher in the former group at the beginning of treatment (week 5). These results suggest that 1G has a better ability than PIO to reduce glucose levels after 2 weeks of treatment. A decrease in the AUC of glycemia levels could be linked to PPAR-γ activation and may indicate the efficacy of a treatment [6].
Animals received a commercial presentation of PIO (Agopar®, Laboratorios Grinn, CDMX, México, 30 mg), which has excipients that favor or at least do not negatively intervene in the absorption of the drug. For its part, compound 1G can be considered to have had good intestinal absorption, despite having been administered as a suspension in water. This is consistent with the predictions obtained in relation to the ADMET properties.

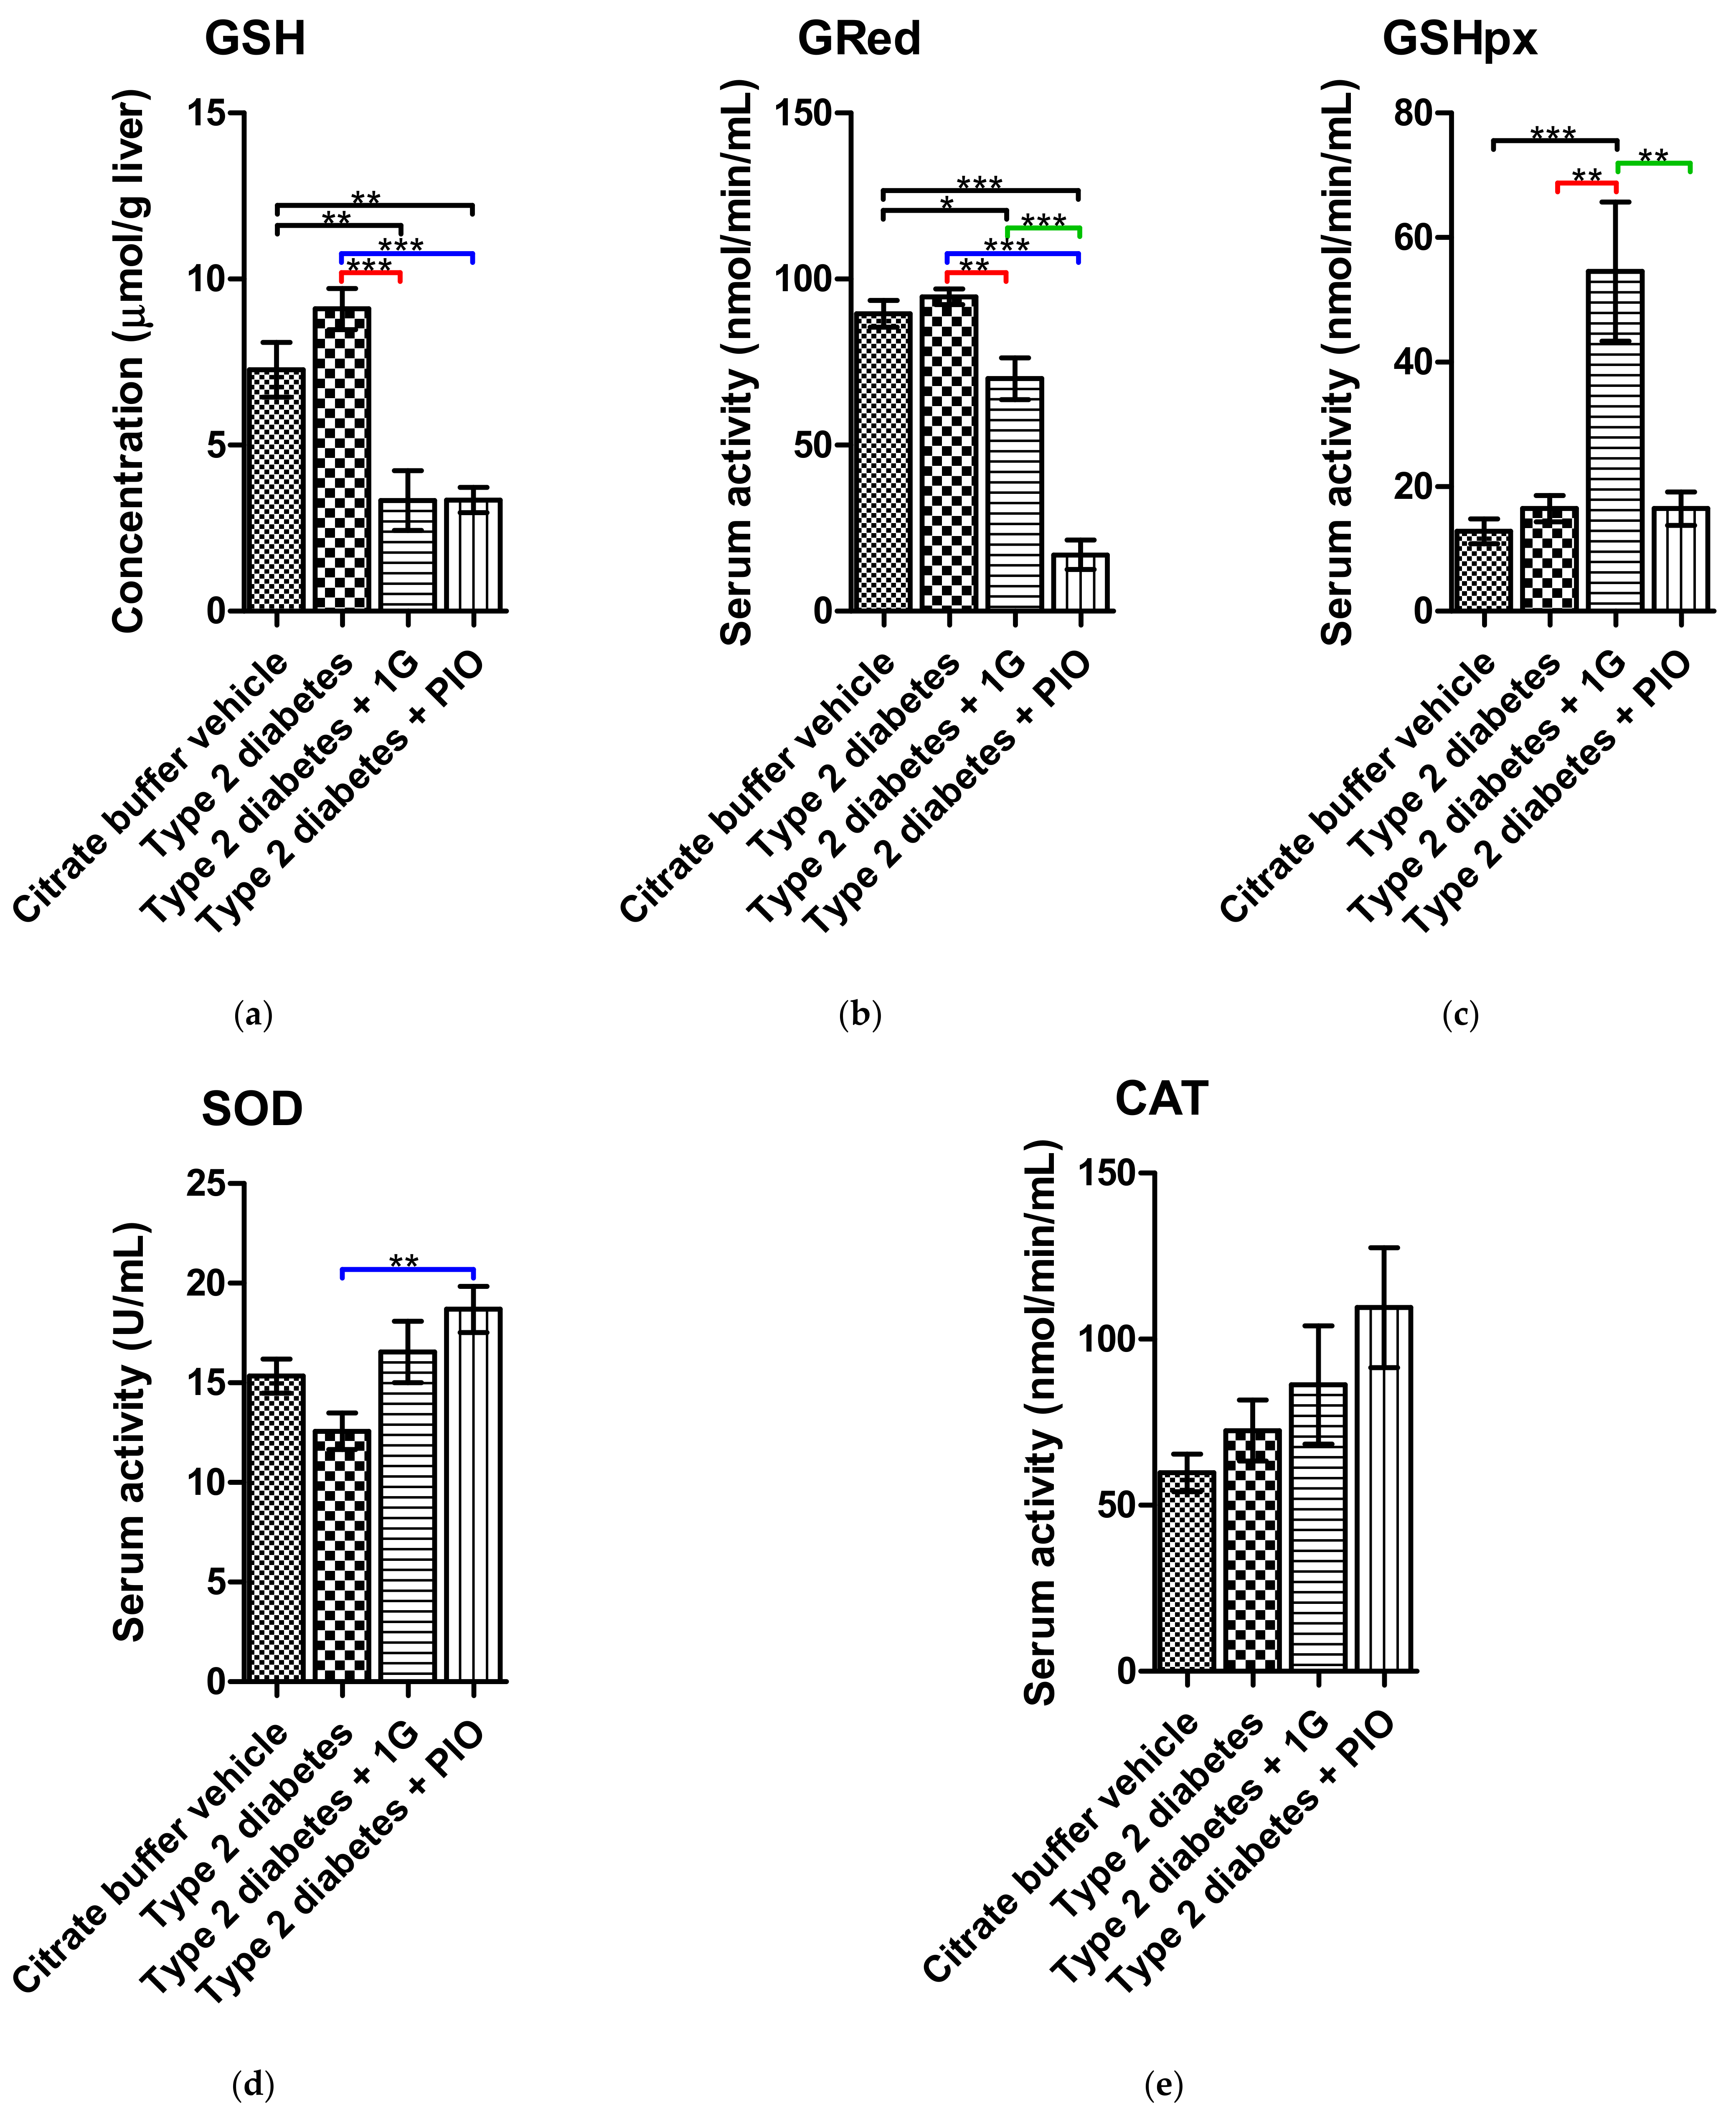
3.9. Ex Vivo Results of 1G Administration

The treatments (1G or PIO at equimolar doses) had similar effects at the metabolic level in the current rat model of type 2 diabetes. The administration of compound 1G at a dose of 30 mg/kg/day for 2 weeks produced a significant drop in blood glucose (Figure 8a) in the presence of low amounts of insulin (Figure 8b). Additionally, the administration of 1G or PIO caused a significant depletion of the blood levels of TAG (Figure 8c) compared to the diabetic animals without treatment. Compound 1G is unsaturated at carbon 5, as are other reported glitazone derivatives that have shown a significant decrease in blood glucose and TAG levels when tested with in vivo animal models [5,6,8]. This effect is a great advantage since hyperlipidemia occurs as a metabolic complication in diabetic patients and models [26]. On the other hand, neither treatment modified the serological levels of cholesterol (Figure 8d) or proteins (Figure 8e).
Elevated ALP enzyme activity is found in the serum of diabetic patients [41]. The present PIO and 1G treatments significantly decreased this parameter (Figure 9a). A high level of ALT and AST activity is linked to liver damage [42] and diabetes [41,43]. Excessive ALT activity in serum can provoke hepatic disturbances and may be related to insulin resistance in type 2 diabetes [24]. Whereas PIO treatment led to a significant increase in the enzymatic activity of ALT (Figure 9b), 1G did not. The PIO-induced effect could be caused by the diabetic condition only since PIO has not shown any indication of liver damage in other reports [24,42]. The only change in AST (Figure 9c) activity was a tendency to a decrease with the administration of PIO or 1G.
The body, in its constant tendency to achieve homeostasis, seeks alternative ways to reduce chronically high blood glucose levels. For example, there may be greater glucose influx into insulin-sensitive tissues (adipose, skeletal muscle, and liver tissue) to resolve the hyperglycemia of diabetes. This would cause the overactivation of other metabolic pathways connected with glycolysis. As a consequence, fatty acid synthesis could possibly increase, which would promote a higher level of TAG and its release into the bloodstream as well as a greater amount of respiratory chain activity. The latter activity boosts the production of reactive oxygen species (ROS), which in turn alters antioxidant mechanisms [1].
Furthermore, the liver maintains inter-organ GSH homeostasis by upregulating the synthesis of this antioxidant and exporting it to the bloodstream [44]. Thus, diabetic animals are expected to present high levels of this major antioxidant in the liver (Figure 10a) and blood. The activity of GSHpx and GRed is closely related, favoring the maintenance of the antioxidant balance [45]. In blood, increased ROS production [34,46,47] must have been responsible for the decrease in GSH, while an elevated level of GRed (Figure 10b) combined with a low level of GSHpx (Figure 10c) maintained ROS at a reduced level [45].
Compared to the diabetic animals without treatment, the administration of 1G or PIO brought about a significant decrease in the level of GSH (Figure 10a) and the enzymatic activity of GRed (Figure 10b). As a possible explanation for the diminished levels of GSH, 1G and PIO may undergo phase II liver metabolism as glutathione S-conjugates [44]. On the other hand, only 1G generated a significant increase in the enzymatic activity of GSHpx (Figure 10c), which oxidizes GSH and consequently could account for the decreased blood and liver levels of the latter [45]. The regeneration of GSH was probably not required, in accordance with the lower activity of GRed, a GSH-reducing enzyme. Plausibly, an exogenous agent with antioxidant capacity was present, raising the possibility of an antioxidant capacity of 1G capable of decreasing the demand for GSH. Some molecules [31] with antioxidant capability are known to foster higher GSH levels, but 1G could be acting by another route to diminish oxidative stress. More studies are needed to clarify the depletion of GSH.
ROS are eliminated by the activity of GSHpx, SOD and CAT [44]. 1G may have been eliminating ROS by an increase in the activity of GSHpx, though such an increase was not found for SOD or CAT (Figure 10c). With the administration of PIO, on the other hand, the significantly enhanced SOD activity and the tendency to an increment in CAT activity (Figure 10e) could be related to a rise in systemic oxidative stress or simply the oxidative damage that occurs in diabetic animals [2,28]. The activity of CAT and SOD was similar between the untreated diabetic animals and those given citrate buffer only. This does not necessarily indicate the absence of oxidative stress because antioxidant molecules respond rapidly to oxidative stress. However, these molecules can lose efficacy or activity, or their synthesis might be inhibited when the degree of damage is greater [2,48]. Since the administration of 1G avoided an increase in SOD or CAT activity, it could have some intrinsic antioxidant capacity (due to its structure) and/or an indirect capacity, eliciting the expression of proteins involved in the antioxidant balance.
In addition to oxidative stress, inflammation is present in diabetes and contributes to the development of the pathology [1,24,34]. Compared to the untreated diabetic animals, the 2-week administration of 1G or PIO significantly lowered levels of TNF-α (Figure 11a) and IL-6 (Figure 11b), cytokines known to play an important role in the mechanism of metabolic and oxidative damage, especially in adipocytes. The development of diabetes and obesity is associated with impaired adipose tissue function [1,49]. A higher ROS production causes high levels of TNF-α, which mediates liver injury [44] and increases insulin resistance [24], leading to greater inflammation. Contrarily, a decrease in pro-inflammatory cytokines (TNF-α and IL-6) reduces or eliminates inflammation, thus avoiding an exacerbation of metabolic and oxidative damage.
The activation of PPAR-γ by glitazones has been associated with an euglycemic effect, caused by a greater production and translocation of GLUT-4 [4]. The presence of a double bond could be advantageous since the racemization undergone by commercial glitazones is eliminated [50]. These effects are still being investigated by our workgroup.

3.10. Prediction of the Targets of 1G

While a medicinal compound triggers a therapeutic effect by binding to its desired target receptor, it can also bind to other receptors and generate additional effects, which may be therapeutic or non-therapeutic. For example, PIO decreases the blood level of glucose, low-density lipoprotein and TAG, and increases the blood concentration of high-density lipoprotein [4,51].
The predictions made by considering homology-based target mapping are widely used to translate the results from experimental models to humans [21]. The information gathered by SwissTargetPrediction software on protein-ligand interactions serves to accurately predict the protein targets of molecules based on 2D and 3D structures [21].
There appears to be a low probability that 1G will bind to aldose reductase (27.1%; Table S2, Supplementary Material) in Homo sapiens and in Rattus norvegicus (by homology), to MAP kinase ERK2 and protein-tyrosine phosphatase 1B (9.6%) in Homo sapiens and Mus musculus (by homology), or to serine/threonine-protein kinases: PIM1 (22.7%), PIM2 (22.7%), and PIM3 (10.4%). Likewise, the probability is also apparently low of 1G binding with other proteins, such as G-protein coupled receptor 35 (11.3%), transthyretin (10.4%), insulin-like growth factor I receptor (10.4%), 15-hydroxyprostaglandin dehydrogenase [NAD+] (9.6%), arylamine N-acetyltransferase 1 (9.6%), or a disintegrin and metalloproteinase containing thrombospondin motifs 5 [ADAMTS5] (9.6%). According to the results, 1G could participate to some degree in the development of brown adipose tissue, the browning of white adipose tissue, cell growth and differentiation, inflammation, insulin resistance, arthritis, osteoarthritis, transport and metabolism of xenobiotics, heart disease and cancer [52,53,54,55,56,57,58,59,60,61,62,63,64,65].
The in silico studies suggest that 1G has advantageous characteristics for the treatment of diabetes. Thus, further research is justified for this compound and its derivatives. Another advantage is its low toxicity predicted theoretically and validated by the in vivo study on rats and transaminase activity levels. It is a symmetrical compound and is unsaturated at carbon 5, two additional indications of its capacity to interact with PPAR-γ (being a ligand-inducible receptor). The degree of the response elicited by 1G probably depends mainly on the quantity of ligand-receptor interactions.

4. Conclusions

A molecule such as 1G with two pharmacophore nuclei (versus only one) has a greater possibility of activating PPAR-γ and/or other receptors. Compound 1G has similar to or better therapeutic characteristics than those of PIO and has the advantage of producing a tendency to a decrease in several pathogenic factors present in diabetes, including polydipsia, polyphagia, and the levels of inflammation and systemic oxidation. Apart from type 2 diabetes, the current results suggest that 1G might have beneficial effects for arthritis, inflammation, heart disease and cancer.

Supplementary Materials

The following are available online at https://www.mdpi.com/article/10.3390/pr9081294/s1, Figure S1. Determination of the purity of compound 1G. The graph displays four peaks corresponding to the DMSO signal (tR = 1.54 min), impurity 1 (tR = 2.96 min), impurity 2 (tR = 4.08) and compound 1G (tR = 5.23 min). The table indicates the percentage of area corresponding to each component of the analyzed mixture: 1.10% for impurity 1, 1.88% for impurity 2 and 97.02% for compound 1G. Equipment: Agilent 1260 HPLC with OpenLab EZChrom software. Figure S2. IR spectrum of 1G, in which the olefin (alkene) functional group appears as a signal at 1683.9 cm−1 (highlighted in red). IR (cm−1): 3165.4 (N-H), 3045.0 (=C-H), 2781.7 (N-H), 1747.9 (C=O), 1702.2 (C=O), 1683.9 (C=C), and 1155.1 (=C-O). Equipment: Perkin Elmer Frontier Spectrum with FT system spectrophotometer using an ATR device. Figure S3. 1H NMR spectrum of compound 1G in deuterated DMSO (DMSO-d6). Equipment: Varian Mercury NMR spectrometer operating at 300 MHz. Figure S4. 13C NMR spectrum of compound 1G in DMSO-d6. Equipment: Varian Mercury NMR spectrometer operating at 75.46 MHz. Figure S5. 2D NMR spectroscopy (COSY) spectrum of compound 1G. The signals obtained at 7.19, 7.63 and 7.76 ppm intersect with those at 119.98, 132.76 and 131.44 ppm, respectively. Equipment: Varian Mercury NMR spectrometer (1H, 300.08; 13C, 75.46 MHz) with deuterated dimethyl sulfoxide (DMSO-d6) as solvent. Figure S6. Mass spectrum of compound 1G. In the upper spectrum (panel A), there is a high relative proportion of the m/z ratio to the experimental signal at 447.0073, corresponding to the binding of an ionized molecule attached to the sodium ion ([M + Na]+), which is described in detail in the spectrum of panel B. In the spectrum of panel C, a theoretical signal appears at 425.0260 that corresponds to the m/z ratio of the compound alone (without coupling to any ion). Technique: ESI. Equipment: LC/MS was performed with an Agilent 6400 Series Triple Quadrupole instrument. Table S1. Theoretical punctuation of PIO, TRO, ROSI, and the designed ligands from sections 2.2 (Theoretical determination of the physicochemical and biological properties) and 2.5 (Docking studies). The results of the parameters generated in these two sections were used for screening. Two summations were carried out. The first, called Score (S, blue column), includes all the parameters contributing to the absolute numerical value of binding free energy (|ΔG|). Table S2. Probability of main targets of compound 1G in Homo sapiens, Mus musculus, and Rattus norvegicus according to SwissTargetPrediction server. Table S3. Complete table of possible targets of compound 1G in Homo sapiens provided by the SwissTargetPrediction server. Table S4. Complete table of possible targets of compound 1G in Mus musculus afforded by the SwissTargetPrediction server. Table S5. Complete table of possible targets of compound 1G in Rattus norvegicus according to the SwissTargetPrediction server.

Author Contributions

Conceptualization and methodology by S.Á.-A.; validation by S.Á.-A., F.T.-C. and J.E.M.-W.; formal analysis by S.Á.-A., G.N.-V., I.I.P.-M., F.T.-C. and J.E.M.-W.; investigation by S.Á.-A. and D.A.-G.-D.; data curation by G.N.-V., I.I.P.-M., F.T.-C. and J.E.M.-W.; writing—original draft preparation by S.Á.-A., and review & editing by G.N.-V., I.I.P.-M., J.C.-B., D.A.-G.-D., F.T.-C. and J.E.M.-W.; visualization by G.N.-V., I.I.P.-M., J.C.-B., D.A.-G.-D., F.T.-C. and J.E.M.-W.; supervision by G.N.-V., I.I.P.-M., F.T.-C. and J.E.M.-W.; project administration by F.T.-C. and J.E.M.-W.; funding acquisition by F.T.-C. and J.E.M.-W. All authors have read and agreed to the published version of the manuscript.

Funding

This research was funded by the Secretaría de Investigación y Posgrado, Instituto Politécnico Nacional, grant numbers SIPMULTI20210729 and SIPMULTI20210567.

Institutional Review Board Statement

The study was conducted based on the guidelines of the Declaration of Helsinki and approved by the Institutional Review Board: Internal Committee for the Care and Use of Lab Animals (CICUAL, according to the initials in Spanish, 10/21 June 2017) of the Escuela Superior de Medicina, Instituto Politécnico Nacional (Mexico). It complies with the Mexican norm for this matter (NOM-062-ZOO-1999, Technical Specifications for the Production, Care and Use of Laboratory Animals, SAGARPA), as well as the “Guide for the Care and Use of Laboratory Animals” of the National Research Council and National Institutes of Health (NIH Publications No. 8023, revised 1978).

Informed Consent Statement

Not applicable.

Data Availability Statement

The data supporting this study are present on Supplementary Materials.

Acknowledgments

We are grateful to Jessica Georgina Filisola-Villaseñor (CINVESTAV, México) and Edgar Rosales-Ortega (UAEM, México) and Hugo Álvarez-Almazán (México) for technical support.

Conflicts of Interest

The authors declare that they have no conflict of interest. The funders had no role in the design of the study, in the collection, analyses, or interpretation of data, in the writing of the manuscript, or in the decision to publish the results.

References

  1. Álvarez-Almazán, S.; Filisola-Villaseñor, J.G.; Alemán-González-Duhart, D.; Tamay-Cach, F.; Mendieta-Wejebe, J.E. Current molecular aspects in the development and treatment of diabetes. J. Physiol. Biochem. 2020, 76, 13–35. [Google Scholar] [CrossRef]
  2. Mahmoud, A.M.; Ashour, M.B.; Abdel-Moneim, A.; Ahmed, O.M. Hesperidin and naringin attenuate hyperglycemia-mediated oxidative stress and proinflammatory cytokine production in high fat fed/streptozotocin-induced type 2 diabetic rats. J. Diabetes Complicat. 2012, 26, 483–490. [Google Scholar] [CrossRef]
  3. De Jesús Sandoval-Muñiz, R.; Vargas-Guerrero, B.; Flores-Alvarado, L.J.; Gurrola-Díaz, C.M. Glucotransportadores (GLUT): Aspectos clínicos, moleculares y genéticos. Gac. Med. Mex. 2016, 152, 547–557. [Google Scholar]
  4. Mansour, M. The roles of peroxisome proliferator-activated receptors in the metabolic syndrome. In Progress in Molecular Biology and Translational Science; Elsevier Inc.: Amsterdam, The Netherlands, 2014; Volume 121, pp. 217–266. ISBN 9780128001011. [Google Scholar]
  5. Navarrete-Vázquez, G.; Torres-Gómez, H.; Hidalgo-Figueroa, S.; Ramírez-Espinosa, J.J.; Estrada-Soto, S.; Medina-Franco, J.L.; León-Rivera, I.; Alarcón-Aguilar, F.J.; Almanza-Pérez, J.C. Synthesis, in vitro and in silico studies of a PPARγ and GLUT-4 modulator with hypoglycemic effect. Bioorg. Med. Chem. Lett. 2014, 24, 4575–4579. [Google Scholar] [CrossRef] [PubMed]
  6. Gutierréz-Hernández, A.; Galván-Ciprés, Y.; Domínguez-Mendoza, E.A.; Aguirre-Vidal, Y.; Estrada-Soto, S.; Almanza-Pérez, J.C.; Navarrete-Vázquez, G. Design, Synthesis, Antihyperglycemic Studies, and Docking Simulations of Benzimidazole-Thiazolidinedione Hybrids. J. Chem. 2019, 2019, 1650145. [Google Scholar] [CrossRef]
  7. Álvarez-Almazán, S.; Bello, M.; Tamay-Cach, F.; Martínez-Archundia, M.; Alemán-González-Duhart, D.; Correa-Basurto, J.; Mendieta-Wejebe, J.E. Study of new interactions of glitazone’s stereoisomers and the endogenous ligand 15d-PGJ2 on six different PPAR gamma proteins. Biochem. Pharmacol. 2017, 142, 168–193. [Google Scholar] [CrossRef]
  8. Hidalgo-Figueroa, S.; Ramírez-Espinosa, J.J.; Estrada-Soto, S.; Almanza-Pérez, J.C.; Román-Ramos, R.; Alarcón-Aguilar, F.J.; Hernández-Rosado, J.V.; Moreno-Díaz, H.; Díaz-Coutiño, D.; Navarrete-Vázquez, G. Discovery of Thiazolidine-2,4-Dione/Biphenylcarbonitrile Hybrid as Dual PPAR α/γ Modulator with Antidiabetic Effect: In vitro, In Silico and In Vivo Approaches. Chem. Biol. Drug Des. 2013, 81, 474–483. [Google Scholar] [CrossRef]
  9. Parmenon, C.; Guillard, J.; Caignard, D.H.; Hennuyer, N.; Staels, B.; Audinot-Bouchez, V.; Boutin, J.A.; Dacquet, C.; Ktorza, A.; Viaud-Massuard, M.C. 4,4-Dimethyl-1,2,3,4-tetrahydroquinoline-based PPARα/γ agonists. Part I: Synthesis and pharmacological evaluation. Bioorg. Med. Chem. Lett. 2008, 18, 1617–1622. [Google Scholar] [CrossRef]
  10. Cho, M.C.; Lee, D.H.; Kim, E.J.; Lee, J.Y.; Kang, J.W.; Song, J.H.; Chong, Y.; Kim, Y.; Hong, J.T.; Yoon, D.Y. Novel PPARγ partial agonists with weak activity and no cytotoxicity; Identified by a simple PPARγ ligand screening system. Mol. Cell. Biochem. 2011, 358, 75–83. [Google Scholar] [CrossRef]
  11. Alemán-González-Duhart, D.; Tamay-Cach, F.; Correa-Basurto, J.; Padilla-Martínez, I.I.; Álvarez-Almazán, S.; Mendieta-Wejebe, J.E. In silico design, chemical synthesis and toxicological evaluation of 1,3-thiazolidine-2,4-dione derivatives as PPARγ agonists. Regul. Toxicol. Pharmacol. 2017, 86, 25–32. [Google Scholar] [CrossRef]
  12. Sethi, A.; Joshi, K.; Sasikala, K.; Alvala, M. Molecular Docking in Modern Drug Discovery: Principles and Recent Applications. In Drug Discovery and Development-New Advances; IntechOpen: London, UK, 2016; Volume i, p. 13. [Google Scholar]
  13. Molinspiration Cheminformatics Calculation of Molecular Properties and Bioactivity Score. Available online: https://www.molinspiration.com/cgi-bin/properties (accessed on 19 July 2020).
  14. Sander, T. Molecular Properties Prediction-Osiris Property Explorer. Available online: https://www.organic-chemistry.org/prog/peo/ (accessed on 19 July 2020).
  15. Veber, D.F.; Johnson, S.R.; Cheng, H.Y.; Smith, B.R.; Ward, K.W.; Kopple, K.D. Molecular properties that influence the oral bioavailability of drug candidates. J. Med. Chem. 2002, 45, 2615–2623. [Google Scholar] [CrossRef]
  16. Cheng, F.; Li, W.; Zhou, Y.; Shen, J.; Wu, Z.; Liu, G.; Lee, P.W.; Tang, Y. AdmetSAR: A comprehensive source and free tool for assessment of chemical ADMET properties. J. Chem. Inf. Model. 2012, 52, 3099–3105. [Google Scholar] [CrossRef] [PubMed]
  17. Nolte, R.T.; Wisely, G.B.; Westin, S.; Cobb, J.E.; Lambert, M.H.; Kurokawa, R.; Rosenfeld, M.G.; Willson, T.M.; Glass, C.K.; Milburn, M.V. Ligand binding and co-activator assembly of the peroxisome proliferator- activated receptor-γ. Nature 1998, 395, 137–143. [Google Scholar] [CrossRef] [PubMed]
  18. Humphrey, W.; Dalke, A.; Schulten, K. VMD: Visual Molecular Dynamics. J. Mol. Graph. 1996, 14, 33–38. [Google Scholar] [CrossRef]
  19. Gumbart, J.C.; Luo, D. HBonds Plugin, Version 1.2. Available online: http://www.ks.uiuc.edu/Research/vmd/plugins/hbonds/ (accessed on 20 August 2020).
  20. Bakhtyari, N.G.; Raitano, G.; Benfenati, E.; Martin, T.; Young, D. Comparison of in silico models for prediction of mutagenicity. J. Environ. Sci. Heal. Part C Environ. Carcinog. Ecotoxicol. Rev. 2013, 31, 45–66. [Google Scholar] [CrossRef] [PubMed]
  21. Gfeller, D.; Grosdidier, A.; Wirth, M.; Daina, A.; Michielin, O.; Zoete, V. SwissTargetPrediction: A web server for target prediction of bioactive small molecules. Nucleic Acids Res. 2014, 42, W32–W38. [Google Scholar] [CrossRef] [PubMed]
  22. Stümpel, E.; Hartmann, H. Acute actions of insulin-like growth factor II on glucose metabolism in adult rats. Diabetology 1992, 35, 932–938. [Google Scholar] [CrossRef] [PubMed] [Green Version]
  23. Derosa, G.; Cicero, A.F.G.; Gaddi, A.; Ragonesi, P.D.; Fogari, E.; Bertone, G.; Ciccarelli, L.; Piccinni, M.N. Metabolic effects of pioglitazone and rosiglitazone in patients with diabetes and metabolic syndrome treated with glimepiride: A twelve-month, multicenter, double-blind, randomized, controlled, parallel-group trial. Clin. Ther. 2004, 26, 744–754. [Google Scholar] [CrossRef]
  24. Elmazar, M.M.; El-abhar, H.S.; Schaalan, M.F.; Farag, N.A. Phytol/Phytanic Acid and Insulin Resistance: Potential Role of Phytanic Acid Proven by Docking Simulation and Modulation of Biochemical Alterations. PLoS ONE 2013, 8, e45638. [Google Scholar] [CrossRef] [Green Version]
  25. OECD. Acute Oral Toxicity-Up-and-Down-Procedure (UDP). In OECD Guidelines for the Testing of Chemicals; OECD: Paris, France, 2008; pp. 1–27. [Google Scholar]
  26. Al-Faris, N.A.; Al-sawadi, A.D.; Alokail, M.S. Effect of samh seeds supplementation (Mesembryanthemum forsskalei Hochst) on liver enzymes and lipid profiles of streptozotocin (STZ)-induced diabetic Wistar rats. Saudi J. Biol. Sci. 2010, 17, 23–28. [Google Scholar] [CrossRef] [Green Version]
  27. Zafar, M.; Naeem-ul-Hassan Naqvi, S.; Ahmed, M.; Kaimkhani, Z.A. Altered Kidney Morphology and Enzymes in Streptozotocin Induced Diabetic Rats. Int. J. Morphol. 2009, 27, 719–725. [Google Scholar] [CrossRef] [Green Version]
  28. Szkudelski, T.; Zywert, A.; Szkudelska, K. Metabolic disturbances and defects in insulin secretion in rats with streptozotocin-nicotinamide-induced diabetes. Physiol. Res. 2013, 62, 663–670. [Google Scholar] [CrossRef]
  29. Elrashidy, R.A.; Asker, M.E.; Mohamed, H.E. Beneficial effects of pioglitazone against cardiovascular injury are enhanced by combination with aliskiren in a rat model of diabetic nephropathy. J. Pharm. Pharmacol. 2012, 64, 862–871. [Google Scholar] [CrossRef]
  30. Ko, G.J.; Kang, Y.S.; Han, S.Y.; Lee, M.H.; Song, H.K.; Han, K.H.; Kim, H.K.; Han, J.Y.; Cha, D.R. Pioglitazone attenuates diabetic nephropathy through an anti-inflammatory mechanism in type 2 diabetic rats. Nephrol. Dial. Transplant. 2008, 23, 2750–2760. [Google Scholar] [CrossRef] [Green Version]
  31. Cabrera-Pérez, L.C.; Padilla-Martínez, I.I.; Cruz, A.; Mendieta-Wejebe, J.E.; Tamay-Cach, F.; Rosales-Hernández, M.C. Evaluation of a new benzothiazole derivative with antioxidant activity in the initial phase of acetaminophen toxicity. Arab. J. Chem. 2019, 12, 3871–3882. [Google Scholar] [CrossRef]
  32. Owens, C.W.; Belcher, R.V. A Colorimetric Micro-Method for the Determination of Glutathione. Biochem. J. 1965, 94, 705–711. [Google Scholar] [CrossRef]
  33. Da Costa Leite, L.F.C.; Veras Mourão, R.H.; de Lima, M.D.C.A.; Galdino, S.L.; Hernandes, M.Z.; de Assis Rocha Neves, F.; Vidal, S.; Barbe, J.; da Rocha Pitta, I. Synthesis, biological evaluation and molecular modeling studies of arylidene-thiazolidinediones with potential hypoglycemic and hypolipidemic activities. Eur. J. Med. Chem. 2007, 42, 1263–1271. [Google Scholar] [CrossRef]
  34. Alemán-González-Duhart, D.; Tamay-Cach, F.; Álvarez-Almazán, S.; Mendieta-Wejebe, J.E. Current Advances in the Biochemical and Physiological Aspects of the Treatment of Type 2 Diabetes Mellitus with Thiazolidinediones. PPAR Res. 2016, 2016, 7614270. [Google Scholar] [CrossRef] [Green Version]
  35. Yu, J.; Petrie, I.D.; Levy, R.H.; Ragueneau-Majlessi, I. Mechanisms and clinical significance of pharmacokinetic-based drug-drug interactions with drugs approved by the U.S. Food and drug administration in 2017 s. Drug Metab. Dispos. 2019, 47, 135–144. [Google Scholar] [CrossRef] [Green Version]
  36. International Diabetes Federation Atlas de la Diabetes de la FID. Available online: https://www.diabetesatlas.org/upload/resources/material/20200302_133352_2406-IDF-ATLAS-SPAN-BOOK.pdf (accessed on 12 June 2021).
  37. Stead, A.G.; Hasselblad, V.; Creason, J.P.; Claxton, L. Modeling the Ames test. Mutat. Res. Mutagen. Relat. Subj. 1981, 85, 13–27. [Google Scholar] [CrossRef]
  38. Butler, A.; Helliwell, M.V.; Zhang, Y.; Hancox, J.C.; Dempsey, C.E. An update on the structure of HERG. Front. Pharmacol. 2020, 10, 1572. [Google Scholar] [CrossRef] [PubMed]
  39. Rashid, M. Design, synthesis and ADMET prediction of bis-benzimidazole as anticancer agent. Bioorg. Chem. 2020, 96, 103576. [Google Scholar] [CrossRef]
  40. Wigren, J.; Surapureddi, S.; Olsson, A.G.; Glass, C.K.; Hammarström, S.; Söderström, M. Differential recruitment of the coactivator proteins CREB-binding protein and steroid receptor coactivator-1 to peroxisome proliferator-activated receptor gamma/9-cis-retinoic acid receptor heterodimers by ligands present in oxidized low-density lipoprote. J. Endocrinol. 2003, 177, 207–214. [Google Scholar] [CrossRef] [Green Version]
  41. Chen, S.C.C.; Tsai, S.P.; Jhao, J.Y.; Jiang, W.K.; Tsao, C.K.; Chang, L.Y. Liver Fat, Hepatic Enzymes, Alkaline Phosphatase and the Risk of Incident Type 2 Diabetes: A Prospective Study of 132,377 Adults. Sci. Rep. 2017, 7, 4649. [Google Scholar] [CrossRef]
  42. Nazreen, S.; Alam, M.S.; Hamid, H.; Yar, M.S.; Dhulap, A.; Alam, P.; Pasha, M.A.Q.; Bano, S.; Alam, M.M.; Haider, S.; et al. Thiazolidine-2,4-diones derivatives as PPAR-γ agonists: Synthesis, molecular docking, in vitro and in vivo antidiabetic activity with hepatotoxicity risk evaluation and effect on PPAR-γ gene expression. Bioorg. Med. Chem. Lett. 2014, 24, 3034–3042. [Google Scholar] [CrossRef]
  43. Maxwell, D.B.; Fisher, E.A.; Ross-Clunis, H.A.; Estep, H.L. Serum Alkaline Phosphatase in Diabetes Mellitus. J. Am. Coll. Nutr. 1986, 5, 55–59. [Google Scholar] [CrossRef]
  44. Yuan, L.; Kaplowitz, N. Glutathione in liver diseases and hepatotoxicity. Mol. Aspects Med. 2008, 30, 29–41. [Google Scholar] [CrossRef]
  45. Forman, H.J.; Zhang, H.; Rinna, A. Glutathione: Overview of its protective roles, measurement, and biosynthesis. Mol. Aspects Med. 2009, 30, 1–12. [Google Scholar] [CrossRef] [Green Version]
  46. Gao, J.; Liu, C.; Zhang, H.; Sun, Z.; Wang, R. Myricitrin exhibits anti-atherosclerotic and anti-hyperlipidemic effects in diet-induced hypercholesterolemic rats. AMB Express 2019, 9, 204. [Google Scholar] [CrossRef]
  47. Kojima-Yuas, A.; Deguchi, Y.; Konishi, Y.; Matsui-Yuasa, I. Effect of 1,5-Anhydro-D-fructose on the inhibition of adipogenesis in 3T3-L1 adipocytes. Nat. Prod. Commun. 2012, 7, 1501–1506. [Google Scholar] [CrossRef] [Green Version]
  48. Shittu, M.; Ayo, J.O.; Ambali, S.F.; Fatihu, M.Y.; Onyeanusi, B.I.; Kawu, M.U. Chronic chlorpyrifos-induced oxidative changes in the testes and pituitary gland of Wistar rats: Ameliorative effects of vitamin C. Pestic. Biochem. Physiol. 2012, 102, 79–85. [Google Scholar] [CrossRef]
  49. Hansson, B.; Rippe, C.; Kotowska, D.; Wasserstrom, S.; Säll, J.; Göransson, O.; Swärd, K.; Stenkula, K.G. Rosiglitazone drives cavin-2/SDPR expression in adipocytes in a CEBP α -dependent manner. PLoS ONE 2017, 12, e173412. [Google Scholar] [CrossRef]
  50. Jamali, B.; Bjørnsdottir, I.; Nordfang, O.; Hansen, S.H. Investigation of racemisation of the enantiomers of glitazone drug compounds at different pH using chiral HPLC and chiral CE. J. Pharm. Biomed. Anal. 2008, 46, 82–87. [Google Scholar] [CrossRef] [PubMed]
  51. Sheu, S.H.; Kaya, T.; Waxman, D.J.; Vajda, S. Exploring the binding site structure of the PPARγ ligand-binding domain by computational solvent mapping. Biochemistry 2005, 44, 1193–1209. [Google Scholar] [CrossRef]
  52. Bauters, D.; Cobbaut, M.; Geys, L.; Van Lint, J.; Hemmeryckx, B.; Lijnen, H.R. Loss of ADAMTS5 enhances brown adipose tissue mass and promotes browning of white adipose tissue via CREB signaling. Mol. Metab. 2017, 6, 715–724. [Google Scholar] [CrossRef]
  53. Ukkola, O.; Rankinen, T.; Lakka, T.; Leon, A.S.; Skinner, J.S.; Wilmore, J.H.; Rao, D.C.; Kesäniemi, Y.A.; Bouchard, C. Protein tyrosine phosphatase 1B variant associated with fat distribution and insulin metabolism. Obes. Res. 2005, 13, 829–834. [Google Scholar] [CrossRef] [PubMed] [Green Version]
  54. Schneditz, G.; Elias, J.E.; Pagano, E.; Zaeem Cader, M.; Saveljeva, S.; Long, K.; Mukhopadhyay, S.; Arasteh, M.; Lawley, T.D.; Dougan, G.; et al. GPR35 promotes glycolysis, proliferation, and oncogenic signaling by engaging with the sodium potassium pump. Sci. Signal. 2019, 12, eaau9048. [Google Scholar] [CrossRef] [PubMed]
  55. Sivenius, K.; Niskanen, L.; Voutilainen-Kaunisto, R.; Laakso, M.; Uusitupa, M. Aldose reductase gene polymorphisms and susceptibility to microvascular complications in Type 2 diabetes. Diabet. Med. 2004, 21, 1325–1333. [Google Scholar] [CrossRef]
  56. Watarai, A.; Nakashima, E.; Hamada, Y.; Watanabe, G.; Naruse, K.; Miwa, K.; Kobayashi, Y.; Kamiya, H.; Nakae, M.; Hamajima, N.; et al. Aldose reductase gene is associated with diabetic macroangiopathy in Japanese Type 2 diabetic patients. Diabet. Med. 2006, 23, 894–899. [Google Scholar] [CrossRef] [PubMed] [Green Version]
  57. Crosas, B.; Hyndman, D.J.; Gallego, O.; Martras, S.; Parés, X.; Flynn, T.G.; Farrés, J. Human aldose reductase and human small intestine aldose reductase are efficient retinal reductases: Consequences for retinoid metabolism. Biochem. J. 2003, 373, 973–979. [Google Scholar] [CrossRef] [Green Version]
  58. Cheyssac, C.; Lecoeur, C.; Dechaume, A.; Bibi, A.; Charpentier, G.; Balkau, B.; Marre, M.; Froguel, P.; Gibson, F.; Vaxillaire, M. Analysis of common PTPN1 gene variants in type 2 diabetes, obesity and associated phenotypes in the French population. BMC Med. Genet. 2006, 7, 44. [Google Scholar] [CrossRef] [Green Version]
  59. Vomastek, T.; Iwanicki, M.P.; Burack, W.R.; Tiwari, D.; Kumar, D.; Parsons, J.T.; Weber, M.J.; Nandicoori, V.K. Extracellular Signal-Regulated Kinase 2 (ERK2) Phosphorylation Sites and Docking Domain on the Nuclear Pore Complex Protein Tpr Cooperatively Regulate ERK2-Tpr Interaction. Mol. Cell. Biol. 2008, 28, 6954–6966. [Google Scholar] [CrossRef] [Green Version]
  60. Roemer, H.C.; Weistenhofer, W.; Lohlein, D.; Geller, F.; Blomeke, B.; Golka, K. N-acetyltransferase 1 in colon and rectal cancer cases from an industrialized area. J. Toxicol. Environ. Health. A 2008, 71, 902–905. [Google Scholar] [CrossRef]
  61. Uppal, S.; Diggle, C.P.; Carr, I.M.; Fishwick, C.W.G.; Ahmed, M.; Ibrahim, G.H.; Helliwell, P.S.; Latos-Bieleńska, A.; Phillips, S.E.V.; Markham, A.F.; et al. Mutations in 15-hydroxyprostaglandin dehydrogenase cause primary hypertrophic osteoarthropathy. Nat. Genet. 2008, 40, 789–793. [Google Scholar] [CrossRef]
  62. Qian, Y.; Zhou, X.; Zhang, Y.; Gao, P.; Zhang, W.; Zhu, D. Study on insulin resistance and genetic polymorphisms in essential hypertension patients of two different kinds of TCM constitution. Chin. J. Integr. Med. 2007, 13, 175–179. [Google Scholar] [CrossRef]
  63. Slaaby, R.; Schäffer, L.; Lautrup-Larsen, I.; Andersen, A.S.; Shaw, A.C.; Mathiasen, I.S.; Brandt, J. Hybrid receptors formed by insulin receptor (IR) and insulin-like growth factor I receptor (IGF-IR) have low insulin and high IGF-1 affinity irrespective of the IR splice variant. J. Biol. Chem. 2006, 281, 25869–25874. [Google Scholar] [CrossRef] [PubMed] [Green Version]
  64. Saraiva, M.J.; Almeida, M.D.R.; Sherman, W.; Gawinowicz, M.; Costa, P.; Costa, P.P.; Goodman, D.S. A new transthyretin mutation associated with amyloid cardiomyopathy. Am. J. Hum. Genet. 1992, 50, 1027–1030. [Google Scholar]
  65. Morishita, D.; Katayama, R.; Sekimizu, K.; Tsuruo, T.; Fujita, N. Pim kinases promote cell cycle progression by phosphorylating and down-regulating p27Kip1 at the transcriptional and posttranscriptional levels. Cancer Res. 2008, 68, 5076–5085. [Google Scholar] [CrossRef] [Green Version]
Figure 1. Structural characteristics of two PPAR-γ agonists, pioglitazone (PIO) and compound 1G, and a scheme of the general design of glitazones. The structure is composed of an acid region (red), an aromatic center with an oxygen atom linker (black), and a cyclic polar/nonpolar region or hydrophobic side chain (green).
Processes 09 01294 g001
Figure 2. Design of the compounds, constituted by three elements: (a) the pharmacophore structure (in blue, which defines each of the eight families), (b) the tail region (in red), and (c) the double bonds (in green), indicating the presence of an unsaturated aliphatic tail. The number “1” was added at the end of name of families 1 and 4 in the event that atom A cannot form a double bond.
Processes 09 01294 g002aProcesses 09 01294 g002b
Figure 3. Route of synthesis for compound 1G. The bis-aldehyde was attached to the 2,4-thiazolidinedione ring by a Knoevenagel condensation in toluene at reflux, with piperidine and benzoic acid as additives.
Processes 09 01294 g003
Figure 4. Binding mode of compound 1G (blue structure) on the PPAR-γ crystal (2PRG PDB entry). H-bond interactions occurred with amino acids Leu228 (1.984 Å), Gln286 (1.756 Å), Ser289 (1.678 Å), His323 (1.750 Å), and His449 (2.200 Å) (Image created on AutoDock Tools 1.5.6 Software).
Processes 09 01294 g004
Figure 5. Images of acute oral toxicity after the administration of 1G at 175, 550 and 2000 mg/kg.
Processes 09 01294 g005
Figure 6. Animal weight (a) and the consumption of food (b) and water (c) per week in the distinct groups: rat administered the citrate buffer vehicle (black line) and three groups with the model of type 2 diabetes, either untreated (red line), treated with 35.7 mg/kg/day of 1G (green line), or treated with 30 mg/kg/day of PIO (blue line). STZ was administered during week 1 to induce diabetes and the 2-week treatments (in an equimolar dose) began at week 5. Data, expressed as the mean ± SEM, were analyzed by one-way ANOVA and compared with the Bonferroni test. Significant differences were considered as 0.05 > p < 0.01 (*, significant), 0.01 > p < 0.001 (**, very significant), and p < 0.001 (***, extremely significant).
Processes 09 01294 g006aProcesses 09 01294 g006b
Figure 7. The weekly fasting glucose level (a) and glucose tolerance curve (GTC) of weeks 5 (b), 6 (c) and 7 (d) in the distinct groups: rats administered the citrate buffer vehicle (black line) and three groups with the model of type 2 diabetes, either untreated (red line), treated with 35.7 mg/kg/day of 1G (green line), or treated with 30 mg/kg/day of PIO (blue line). Treatments lasted 2 weeks and started at week 5. Data, expressed as the mean ± SEM, were analyzed by one-way ANOVA and compared with the Bonferroni test. Significant differences were considered as 0.05 > p < 0.01 (*, significant), 0.01 > p < 0.001 (**, very significant), and p < 0.001 (***, extremely significant).
Processes 09 01294 g007aProcesses 09 01294 g007b
Figure 8. Serum levels of glucose (a), insulin (b), TAG (c), cholesterol (d), and total protein (e) in the distinct groups: rats administered the citrate buffer vehicle and three groups with the model of type 2 diabetes, either untreated, treated with 1G (35.7 mg/kg/day), or treated with PIO (30 mg/kg/day). Treatments lasted 2 weeks. Data, expressed as the mean ± SEM, were analyzed by one-way ANOVA and compared with the Bonferroni test. Significant differences were considered as 0.05 > p < 0.01 (*, significant), 0.01 > p < 0.001 (**, very significant), and p < 0.001 (***, extremely significant).
Processes 09 01294 g008
Figure 9. Serum levels of ALP (a), ALT (b), and AST (c) in the distinct groups: rats administered the citrate buffer vehicle and three groups with the model of type 2 diabetes, either untreated, treated with 1G (35.7 mg/kg/day), or treated with PIO (30 mg/kg/day). Treatments lasted 2 weeks Data, expressed as the mean ± SEM, were analyzed by one-way ANOVA and compared with the Bonferroni test. Significant differences were considered as 0.05 > p < 0.01 (*, significant), 0.01 > p < 0.001 (**, very significant), and p < 0.001 (***, extremely significant).
Processes 09 01294 g009
Figure 10. Serum levels of GSH (a), GRed (b), GSHpx (c), SOD (d), and CAT (e) in the distinct groups: rats administered the citrate buffer vehicle and three groups with the model of type 2 diabetes, either untreated, treated with 1G (35.7 mg/kg/day) or treated with PIO (30 mg/kg/day). Treatments lasted 2 weeks. Data, expressed as the mean ± SEM, were analyzed by one-way ANOVA and compared with the Bonferroni test. Significant differences were considered as 0.05 > p < 0.01 (*, significant), 0.01 > p < 0.001 (**, very significant), and p < 0.001 (***, extremely significant).
Processes 09 01294 g010
Figure 11. Serum levels of TNF-α (a) and IL-6 (b) in the distinct groups: rats administered the citrate buffer vehicle and three groups with the model of type 2 diabetes, either untreated, treated with 1G (35.7 mg/kg/day), or treated with PIO (30 mg/kg/day). Treatments lasted 2 weeks Data, expressed as the mean ± SEM, were analyzed by one-way ANOVA and compared with the Bonferroni test. Significant differences were considered as p < 0.001 (***, extremely significant).
Processes 09 01294 g011
Table 1. Parameters considered (based on physicochemical and biological properties as well as binding orientation in the docking study) in the assignment of a score to each compound.
ParameterValuePunctuationReference
LogP2–42[13,15]
0–2 and 4–51
<0 and >50
TPSA [Å]<1401[15]
>1400
MW [g/mol]<4001
>4000
Binding mode similar to pioglitazoneYes1[7,8]
No0
Sum of the total number of H-bonds<121[15]
>120
Number of rotatable bonds8–102
1–71
MutagenesisAbsence1[14]
Tumorigenesis
IrritabilityPresence0
Reproductive effects
LogS−4 to −22[14,15]
−6 to −4 and
−2 to 0
1
<−60
Abbreviations: LogP, octanol-water partition coefficient; TPSA, topological polar surface area; MW, molecular weight; LogS, water solubility.
Table 2. Comparison of the present docking results for the control compounds to previously reported values.
CompoundΔG (kcal/mol)H-Bond Length (Å)
Ser289His323Tyr473His449Gln286
Pioglitazone (the current study)−10.1642.351.762.672.152.13
Pioglitazone (reported)−9.92 3,*1.20 10.70 11.80 12.76 12.18 3,*
Rosiglitazone (the current study)−10.1061.782.012.302.071.87
Rosiglitazone (BRL-49653) (reported)−10.22 21.93 21.86 21.81 11.39 11.74 3,#
Troglitazone (the current study)−13.0982.132.462.031.882.04
Troglitazone # (reported)−12.61 31.78 31.83 32.22 32.12 31.89 3
Abbreviations: ΔG, binding free energy; * data from the R enantiomer on carbon 5; # data from the S enantiomer on carbon 5. References: 1 [24], 2 [33], and 3 [7].
Table 3. Range of values of the binding free energy and inhibition constant for the compounds in each family, calculated from docking data.
Compound(-)ΔG (Kcal/mol)KI (nM)
Pioglitazone10.16436.09
Rosiglitazone10.10641.5
Troglitazone13.0980.243
Family 110.04 to 12.261.0 to 43.9
Family 29.82 to 12.490.6 to 63.8
Family 35.07 to 12.410.8 to 193.5
Family 410.12 to 12.590.6 to 38.2
Family 58.65 to 12.380.8 to 459.2
Family 69.45 to 12.940.3 to 118.8
Family 710.73 to 13.140.2 to 13.7
Family 810.92 to 13.44 0.1 to 9.9
Abbreviations: ΔG, binding free energy; KI, inhibition constant; nM, nanomolar.
Table 4. Prediction of physicochemical data by the Molinspiration server.
CompoundLogPTPSA (Å)MW (g/mol)nONnOHNHn-rotbVolume (Å)Violation of Lipinski’s Five Rules
Pioglitazone3.168.3356.4517318.50
Rosiglitazone2.371.5357.4617314.50
Troglitazone4.784.9441.5625395.00
Families 1–80.9–4.968.3–112.2346–4935–71–33–9263–4260
Abbreviations: LogP, octanol-water partition coefficient; TPSA, topological polar surface area; MW, molecular weight; nON, number of acceptors of H-bonds; nOHNH, number of donors of H-bonds; n-rotb, number of rotatable bonds.
Table 5. Prediction of physicochemical data and biological effects by the Osiris Property Explorer server.
CompoundMTIReLogPlogSMWTPSA (Å)DlDs
PIO 3.08−3.8435693.595.020.76
ROSI 2.16−3.6735796.839.140.8
TRO 4.36−5.31441110.14.020.49
Family 1 0.8 to 3.1−7.0 to −4.4348 to 452152.1−5.3 to 4.10.3 to 0.7
Family 2 0.5 to 2.9−6.8 to −4.4347 to 451154.9 to 155.3−3.3 to 3.10.1 to 0.4
Family 3 0.7 to 3.0−6.7 to −4.4361 to 465146.1−1.2 to 5.00.1 to 0.3
Family 4 1.2 to 3.5−7.0 to −4.7375 to 479146.1−4.9 to 1.20.1 to 0.2
Family 5 1.6 to 4.0−6.8 to −4.6346 to 450142.9−4.5 to 3.30.2 to 0.7
Family 6 2.1 to 4.4−7.1 to −4.7360 to 464142.9−2.0 to 4.80.2 to 0.7
Family 7 2.5 to 4.9−7.4 to −5.0374 to 478142.0 to 142.9−1.4 to 4.90.2 v 0.6
Family 8 2.7 to 5.0−7.5 to −5.2388 to 492142.9−4.3 to 3.60.2 to 0.6
Abbreviations: PIO, pioglitazone; ROSI, rosiglitazone; TRO, troglitazone; M, mutagenicity; T, tumorigenicity; I, irritant effect; Re, reproductive effects; LogP, octanol-water partition coefficient; LogS, water solubility; MW, molecular weight; TPSA, topological polar surface area; Dl, drug likeness; Ds, drug score. The color indicates the probability of no risk (green), low risk (yellow or orange), and high risk (red).
Table 6. Prediction of the absorption, distribution, metabolism, elimination, and toxicity of compound 1G by the admetSAR server.
ConceptResultValue
Absorption
Blood-brain barrier absorptionBBB+90.49%
Human intestinal absorptionHIA+98.65%
Caco-2 permeabilityCaco2-58.90%
P-glycoprotein substrateNon-substrate64.43%
P-glycoprotein inhibitorNon-inhibitor74.50%
Non-inhibitor95.59%
Renal organic cation transporterNon-inhibitor85.55%
Metabolism
CYP450 2C9 substrateNon-substrate84.33%
CYP450 2D6 substrateNon-substrate80.86%
CYP450 3A4 substrateNon-substrate63.45%
CYP450 1A2 inhibitorInhibitor58.04%
CYP450 2C9 inhibitorInhibitor62.32%
CYP450 2D6 inhibitorNon-inhibitor67.90%
CYP450 2C19 inhibitorInhibitor55.12%
CYP450 3A4 inhibitorInhibitor58.98%
CYP inhibitory promiscuityHigh CYP inhibitory promiscuity87.62%
Toxicity
Human ether-a-go-go-related gene inhibitionWeak inhibitor97.80%
Non-inhibitor89.45%
Ames toxicityNo AMES toxicity74.27%
CarcinogenNon-carcinogen85.65%
Fish toxicityhigh FHMT 99.08%
Tetrahymena pyriformis toxicityhigh TPT 99.39%
Honey bee toxicityhigh HBT 54.44%
BiodegradationNot readily biodegraded85.42%
Acute oral toxicityIII56.36%
Carcinogenicity (three classes)Not required46.12%
Absorption
Aqueous solubilityLogS−3.703
Caco-2 permeabilityLogPapp, cm/s1.0474
Toxicity
Rat acute toxicityLD50, mol/kg2.3386
Fish toxicitypLC50, mg/L0.7877
Tetrahymena pyriformis toxicitypIGC50, ug/L0.8072
Abbreviations: BBB, blood-brain barrier; HIA, human intestinal absorption; Caco-2, human colon adenocarcinoma; CYP450, cytochrome P450; hERG, human gene related to ether-à-go-go; LogS, water solubility; LogP, octanol-water partition coefficient, LogPapp, logarithm of the apparent permeability coefficient; LD50, mean lethal dose; pLC50, log mean lethal concentration; pIGC50, mean inhibitory growth concentration.
Table 7. Prediction of the toxicity of 1G by the ACD/Tox Suite program.
Toxicity OECD/GHShERG BlockerProbability of CYP450 Isoform Inhibition (%)LD50 for Rats (mg/kg)LD50 for Mice (mg/kg)
LD50 (mg/kg)Category%3A42D62C92C191A2ipPOipPOIVSC
50<
≤2000
III4950272129711035079059200
Abbreviations: OECD, Organization for Economic Cooperation and Development; GHS, globally harmonized system; hERG, human gene related to ether-à-go-go; CYP450, cytochrome P450; LD50, mean lethal dose. Means of administration: ip, intraperitoneal; PO, oral; IV, intravenous; SC, subcutaneous.
Table 8. Results of the acute oral toxicity study carried out on 1G, in accordance with guideline #425 of the OECD.
Dose (mg/kg)Weight Gain for 2-Weeks (g)ALT (U/L)AST (U/L)Toxic Effects
200031.514.350.8None
55025.021.455.1
17530.534.464.0
Abbreviations: ALT, alanine amino transferase; AST, aspartate amino transferase.
Table 9. Comparison of the area under the curve (AUC) for the glucose tolerance curve (GTC). The curve was constructed in the GraphPad Prism program based on the levels of glycemia at weeks 5–7.
Total AreaCitrate Buffer VehicleType 2 Diabetes without TreatmentType 2 Diabetes
Treated with 1G
Type 2 Diabetes
Treated with PIO
GTC week 534,141135,504124,415118,846
GTC week 629,598137,939126,309116,448
GTC week 729,931138,256120,404121,853
Abbreviations: AUC, area under the curve.
Publisher’s Note: MDPI stays neutral with regard to jurisdictional claims in published maps and institutional affiliations.

