Article

Mulberry Leaf and Radix Astragali Regulates Differentially Expressed Genes and Proteins in the Streptozotocin-Induced Diabetic Mice Liver

1
School of Food and Biological Engineering, Jiangsu University, Zhenjiang 212000, China
2
School of Life Sciences, Jiangsu University, Zhenjiang 212000, China
3
School of Environment and Safety Engineering, Jiangsu University, Zhenjiang 212000, China
*
Author to whom correspondence should be addressed.
Those authors contributed equally.
Processes 2021, 9(11), 1898; https://doi.org/10.3390/pr9111898
Submission received: 8 September 2021 / Revised: 11 October 2021 / Accepted: 19 October 2021 / Published: 24 October 2021
(This article belongs to the Special Issue Animal Models for Diabetes)

Abstract

:
As a chronic non-infectious disease, severely affecting human quality and health of life, diabetes mellitus (DM) and its complications have gradually developed into a major global public health problem. Mulberry Leaf and Radix Astragali have been used as a traditional medicinal formulation in diabetic patients for a long time, whose combination is usually found in traditional Chinese medicine prescriptions. However, due to the unclear synergistic mechanism of them for DM, the changes of differential genes and proteins in the liver tissue of streptozotocin-induced diabetic mice were analyzed, and then the potential synergistic mechanism of them in anti-diabetes was investigated in our research. Compared with the diabetic model group, there were 699 differentially expressed genes and 169 differentially expressed proteins in the Mulberry Leaf and Radix Astragali treated group, and there were 35 common specific genes both in the transcriptome and the proteome. These common genes participated mainly in the pathways, such as retinol metabolism, steroid hormone biosynthesis, and arachidonic acid metabolism. Quantitative real-time PCR() and Western blot results speculated that the synergistic effect on anti-diabetes was mainly through regulating the expression of Tap1, Ncoa4, and Alas2, by down-regulating Fabp2 and Hmox1 and up-regulating Hmgcr, Cyp7a1. All these genes would affect bile acid secretion, alleviate the occurrence of iron death, promote the metabolism and synthesis of glycolipid substances, and ultimately maintain the body’s glucose homeostasis.

1. Introduction

Diabetes mellitus (DM) is a type of chronic and metabolic disease with complex pathogenesis, due to the inability to produce or make full use of insulin. DM is affected by many factors, such as heredity, environment, age, and gender. According to the academic study of the International Diabetes Federation in 2019 (IDF diabetes atlas, 9th), the number of adults aged 20–79 suffering from diabetes in the world was 463 million, and this number is estimated to steadily rise to 578 million by 2030, and 700 million by 2045, with the growth rate reaching 51%. According to the recent epidemiological survey and analysis of diabetes in China, the prevalence of diabetes also showed a steady and rapidly rising trend from 2007 to 2017 to reach 12.8% in 2017, and nearly half of the Chinese people had abnormal blood glucose [1]. Although the number of diabetes patients in the world was increasing, the understanding of its pathogeny and optimal treatment was still hysteretic. At present, the conventional therapies for diabetes, such as insulin and some oral drugs (mainly western medicine), have more or less serious side effects, including the weight increase and more risk of hypoglycemia caused by insulin and sulfonylurea hypoglycemic drugs as well as the gastrointestinal and other adverse reactions led by α-glucosidase inhibitors and metformin, facilitating traditional Chinese herbal medicine with high safety, stable efficacy, and low cost to become one of the hot spots in the treatment of diabetes in recent years [2,3].
Mulberry Leaf has a long history of medicinal usage with many pharmacological effects of anti-tumor, hypoglycemic, antiviral, antihypertensive, improving immunity, etc., and the 1-Deoxynojirimycin (DNJ), a polyhydroxy alkaloid in mulberry leaves can significantly inhibit the phosphorylation of ERK1/2 in porcine intramuscular adipocytes to affect adipogenesis [4,5,6], while polyphenols from mulberry leaves have good activity in reducing adipogenesis and lipogenesis [7]. Furthermore, the Mulberry Leaf extract has also been shown to play a key role in antioxidation and hypoglycemic effects [8]. Another important traditional Chinese medicine in China is Radix Astragali, which is the root of the leguminous plant Astragalus membranaceus or Astragalus mongholicus, and a large number of reports have been made about Radix Astraguli. The main chemical components of Radix Astragali are polysaccharides, flavonoids, saponins, volatile components, amino acids, vitamins, riboflavin, starch, and other substances [9], so Radix Astragali has been widely used to invigorate Qi in Southeast Asia and China, the injection of which can be used to treat diabetes (mainly astragaloside IV) [10,11,12]. Modern pharmacological studies of Radix Astragali have shown that it has the effects of anti-tumor, hypoglycemic, immune regulation, cardiovascular regulation, and protection [13,14], and the protective effect of Astragali polysaccharide on the liver may be related to its antioxidant activity [15].
Radix Astragali and Mulberry Leaf have a history of use as a traditional medicinal formulation for diabetic patients, but the synergistic mechanism of the combination of the two is unclear. To determine the potential molecular mechanism of Astragali and Mulberry Leaf in the intervention of diabetes, we used transcriptional and proteomic techniques to analyze the synergistic mechanism of the two in the treatment of DM.

2. Materials and Methods

2.1. Intragastric Administration of Mulberry Leaf and Radix Astragali in Diabetic Mice

Fifty male SPF Institute of Cancer Research (ICR) mice, weighing 25–30 g and aged 4–6 weeks, were randomly divided into two groups; the control group (control, n = 10) and the diabetic model group (diabetic model, n = 40). After fasting for 12h, the mice of the diabetic model group were given an injection of streptozotocin solution (STZ) of 150 mg/kg, while mice of the control group were given an intraperitoneal injection of the citric acid buffer of the same dose. During this period, the feeding quantity, drinking quantity, together with the activities and the survivals of mice in each group were observed. After 72 h, the fasting blood glucose value of tail vein blood of mice was measured. If the blood glucose value was more than 11.1 mol/L, the diabetic model mice were judged to be successful. All the SPF ICR mice were provided and raised by the animal experimental center of Jiangsu University. They were reared in a fully enclosed clean animal room. The illumination mode of light and dark for 12 h each was adopted, under 40–65% relative humidity range, and 25 °C ± 1 °C feeding temperature.
Twenty diabetic mice (model mice) were separated into diabetic control group (diabetic control, group DC, 10 mice) and Mulberry Leaf and Radix Astragali treatment group at random (drug treatment, group DD, 10 mice). Each 20 g Mulberry Leaf and Radix Astragali powder were weighed and dissolved in 1 L sterilized double distilled water, and the 40 mg/mL solution were obtained, which would be given by gavage every morning for the diabetic mice with 80 mg, with the same dose of double distilled water given to group C and DC, and the body weight, feeding and drinking quantity, blood glucose, and serum insulin of mice in each group were measured at the specific point in time (0 h, 72 h, 10 w).

2.2. Transcriptome Sequencing of Mice Liver

Mice of the three groups were dislocated to death and the liver tissues were removed quickly and ground in a mortar filled with liquid nitrogen, and about 0.1 g of liver tissue powder was used to isolate total RNA according to the Trizol reagent kit. The total RNA concentration was estimated at the absorbance at 260 nm by OD-1000. The RNA integrity of 28 S and 18 S was detected on 1% agarose gel. cDNA was purified by the kit to be repaired at the end, added with a tail, and connected to the sequencing connector, and then, the fragment size was selected. Finally, the sequencing library was constructed by PCR amplification; after the constructed library passed the quality inspection by Agilent 2100 Bioanalyzer, it was sequenced by Illumina hiseqtm 2500 or another sequencer. After being obtained by the Illumina hiseqtm 2500 platform, the low-quality fragments were filtered and removed from raw data by the software NGS QC TOOLKIT v2.3.3 to achieve clean data for gene expression analysis. The criteria were: (1) filter low-quality reads with a quality threshold of 20 and length threshold of 70%; (2) remove low-quality reads from the 3′ end with quality threshold 20; (3) excision of N-part sequence in reads, length threshold 35bp. The clean reads gained after filtering and removing low-quality sequences from raw data were mapped to the reference genome via TopHat 2 v2.0. A method per Fragments Per Kilobase of transcript per Million fragments (FPKM) was used to calculate the gene expression. The differentially expressed genes (DEGs) were identified using the edgeR package (http://www.r-project.org/, accessed on 15 June 2020). After processing and analyzing the original data, the differentially expressed genes were obtained.

2.3. Proteomic Analysis of Mice Liver

The liver tissues of each group of mice were ground into powder at a low temperature. Then, the homogenate was centrifuged under 13,500 rpm at 4 °C for 30 min to achieve the supernatant collected and filtered through a 0.22 µm filter for use in the next step. The concentration of proteins in each group were measured according to the methods and procedures of PriceTM BCA Protein Assay Kit (Thermo, Rockford, IL, USA), and the final concentration was 20 mg/mL. Then, the DTT solution was added to each group of protein samples, rotated, placed in a 56 °C water bath for 1 h. Next, the iodoacetamide was added and rotated briefly, and the reaction took place in darkness at room temperature (21 °C) for 45 min. Then, the ammonium bicarbonate was put in to achieve the final volume of 400 μL and the final urea concentration of 2 M. The trypsin solution was 0.4 µg/µL in 0.1% acetic acid. The protein was digested at a ratio of 1:200 w/w trypsin to substrate overnight at 37 °C for 12 h. A total of 5 µL of formic acid was put into the sample of the enzymatic digested protein so as to terminate the reaction. After passing the C18 column, the freeze dryer (Labconco, KS, USA) was used to dry the collected samples. The lyophilized peptides were dissolved in 0.1% formic acid solution. Finally, the high-resolution liquid chromatography-mass spectrometry (Q Extractive plus, Thermofisher, Germany) was used to analyze the proteomics of differentially expressed proteins.

2.4. Gene Ontology (GO) and KEGG Enrichment Analysis of Targets

The Database for Annotation, Visualization, and Integrated Discovery (DAVID, https://david.ncifcrf.gov/, accessed on 28 March 2021) v6.8 was used to analyze the GO function and KEGG pathway enrichment of DEGs.

2.5. Protein–Protein Interaction Network Construction

The STRING (http://string-db.org, accessed on 28 March 2021) online website was used to obtain the information of the protein–protein interaction (PPI) of DEGs. We selected confidence data >0.7 to ensure the reliability of the analysis.

2.6. Test and Verification DEGs by qRT-PCR

To verify the results of the transcriptome and proteome analysis, 28 differential expressed genes (DEGs) related to DM were selected for qRT-PCR analysis with the same RNA samples. A 25 µL PCR reaction mixture with 20 ng cDNA was prepared as a template by SYBR Green PCR kit (Qiagen, Hilden, Germany). After mixing the system, a PCR reaction was performed in the ABI 7300 instrument. β-actin was the reference gene, used to normalize the expression level of the tested gene, and the relative expression level of the tested gene was analyzed by 2ΔΔCT. All primers were synthesized by the Shanghai Yingjun biology company. All samples were loaded three times, and the primer sequence is referred to in Supplementary Materials Table S8.

2.7. Antibody Preparation and Western Blot Analysis

The liver tissues of each group of mice were dissolved in Ripa lysis buffer for 30 min. The protein was separated by centrifugation (4 °C, 12,000 rpm, 15 min) and determined by Bio-Rad dye-binding assay, which was separated by 10%SDS-PAGE gel 40–50 µg protein with electrophoresis condition 100 V for 90 min. After that, the protein was transferred into PVDF by electroporation, and the condition of electroporation was 250 V for 2 h. After the transfer, the PVDF membrane was laid out in the blocking solution (5% skim milk powder prepared with TBST, pH 4) for 2 h. Then, the antibody incubated protein was diluted according to the antibody ratio and incubated overnight at 4 °C. After incubation, the PVDF membrane was laid out in TBST solution and then washed 3 times for 5 min. The second fluorescent antibody (1:5000 dilution) was used to incubate at room temperature for 2 h. Then, it was washed with TBST 3 times/5 min. Odyssey family of imaging systems was used to image and analyze the data. The expression of different genes was detected at the level of protein.

3. Results

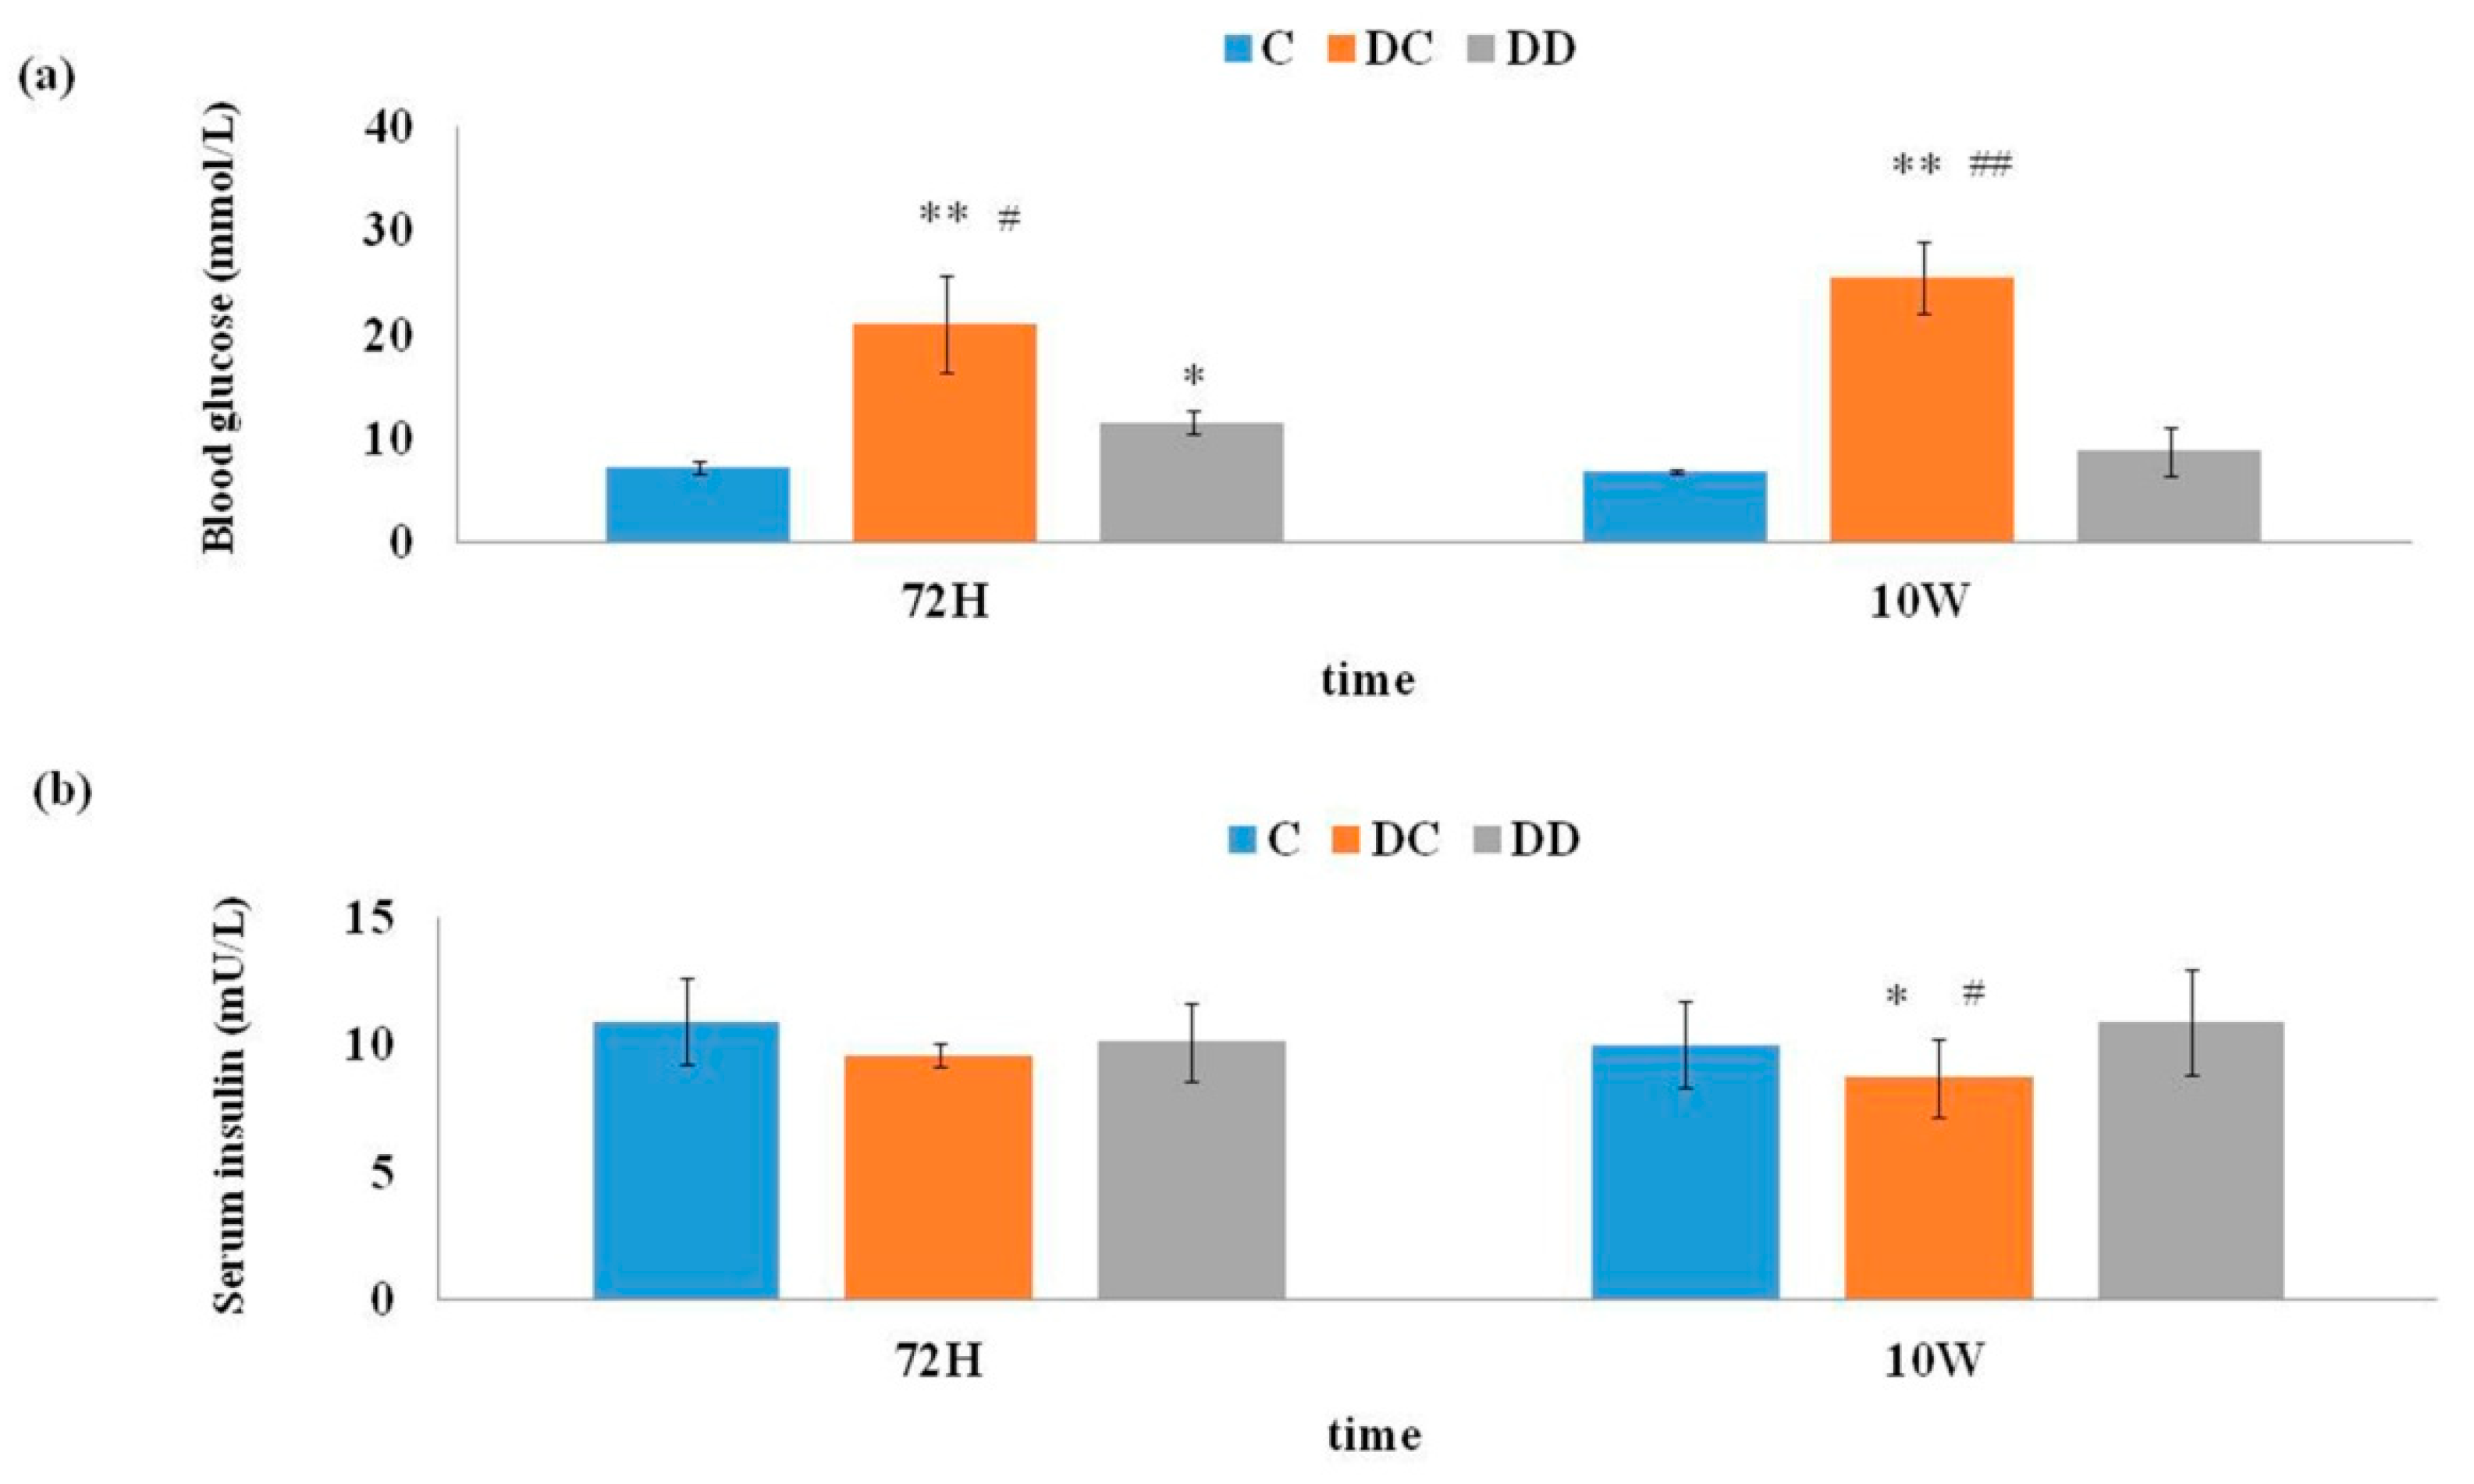
3.1. Hypoglycemic Effect of Mulberry Leaf Combined with Astragali on Diabetic Mice

After STZ injection, compared with the control group (C), the mice in the diabetic model control group (DC) were depressed with decreased activities and increased food intake, water consumption, and excretion of the mice. In the diabetic model group, the fasting blood glucose of 33 mice among 40 mice was more than 11.1 mmol/L with the success modeling rate of 82.5%. It was shown that the weight of mice in the DC and DD group decreased after 72 h of STZ injection, but there was no significant difference among the three groups. After 10 weeks, the body weight of mice in all three groups increased to varying degrees, including the diabetic control group (DC), because the mice were in the growth stage. However, the weight of the mice (44.73 ± 1.04 g, no significant difference) in the gavage group (DD) gradually returned to the normal group (C), while the diabetic model group (32.90 ± 1.87 g, p < 0.01) was significantly lower than group C (45.27 ± 2.13 g). The body weight difference of mice in each group is shown in Supplementary Figure S1. The results of monitoring the daily diet and drinking water of mice revealed that the feeding quantity of mice in the DC group increased after 72 h, and compared with the C group, the daily feed intake of mice in the DC and DD group was a bit higher. After continuous administration for 10 weeks, the feeding quantity of the DC group (18.37 ± 1.03 g, p < 0.01) was remarkably higher than that of the C group, while the DD group (14.75 ± 1.52 g) gradually returned to the level equivalent to that of the C group (13.22 ± 0.65 g). After continuous intragastric administration for 10 weeks, the drinking quantity in the DD group (13.45 ± 1.20 mL) gradually tended to the C group (11.35 ± 1.91 mL), while the amount of drinking water in the DC group (16.42 ± 2.34 mL, p < 0.01) was observably higher than that in the group C (Figure S2).
Then, the fasting blood glucose and serum insulin of mice in the three groups after treatment of Mulberry Leaf and Radix Astragali for 10 weeks were measured to find that the blood glucose of mice in the DD group (8.90 ± 1.44 mmol/L) was still higher than that of the C group (6.72 ± 0.37 mmol/L), but it was at a reasonably low level compared with that of the DC group (25.73 ± 4.73 mmol/L, p < 0.01). The serum insulin level of the DC group (8.71 ± 1.03 mU/L) still showed a downward trend, which has a certain difference compared with the C group (10.09 ± 1.21 mU/L), while the level of the DD group (10.93 ± 1.59 mU/L) was close to that of the C group (Figure 1). Data of body weight, feeding quantity, drinking quantity, blood glucose, and serum insulin of mice in each group are shown in the Supplementary Materials Tables S1–S5.

3.2. Analysis of Differential Genes and Protein Expression in Three Mouse Liver Tissues

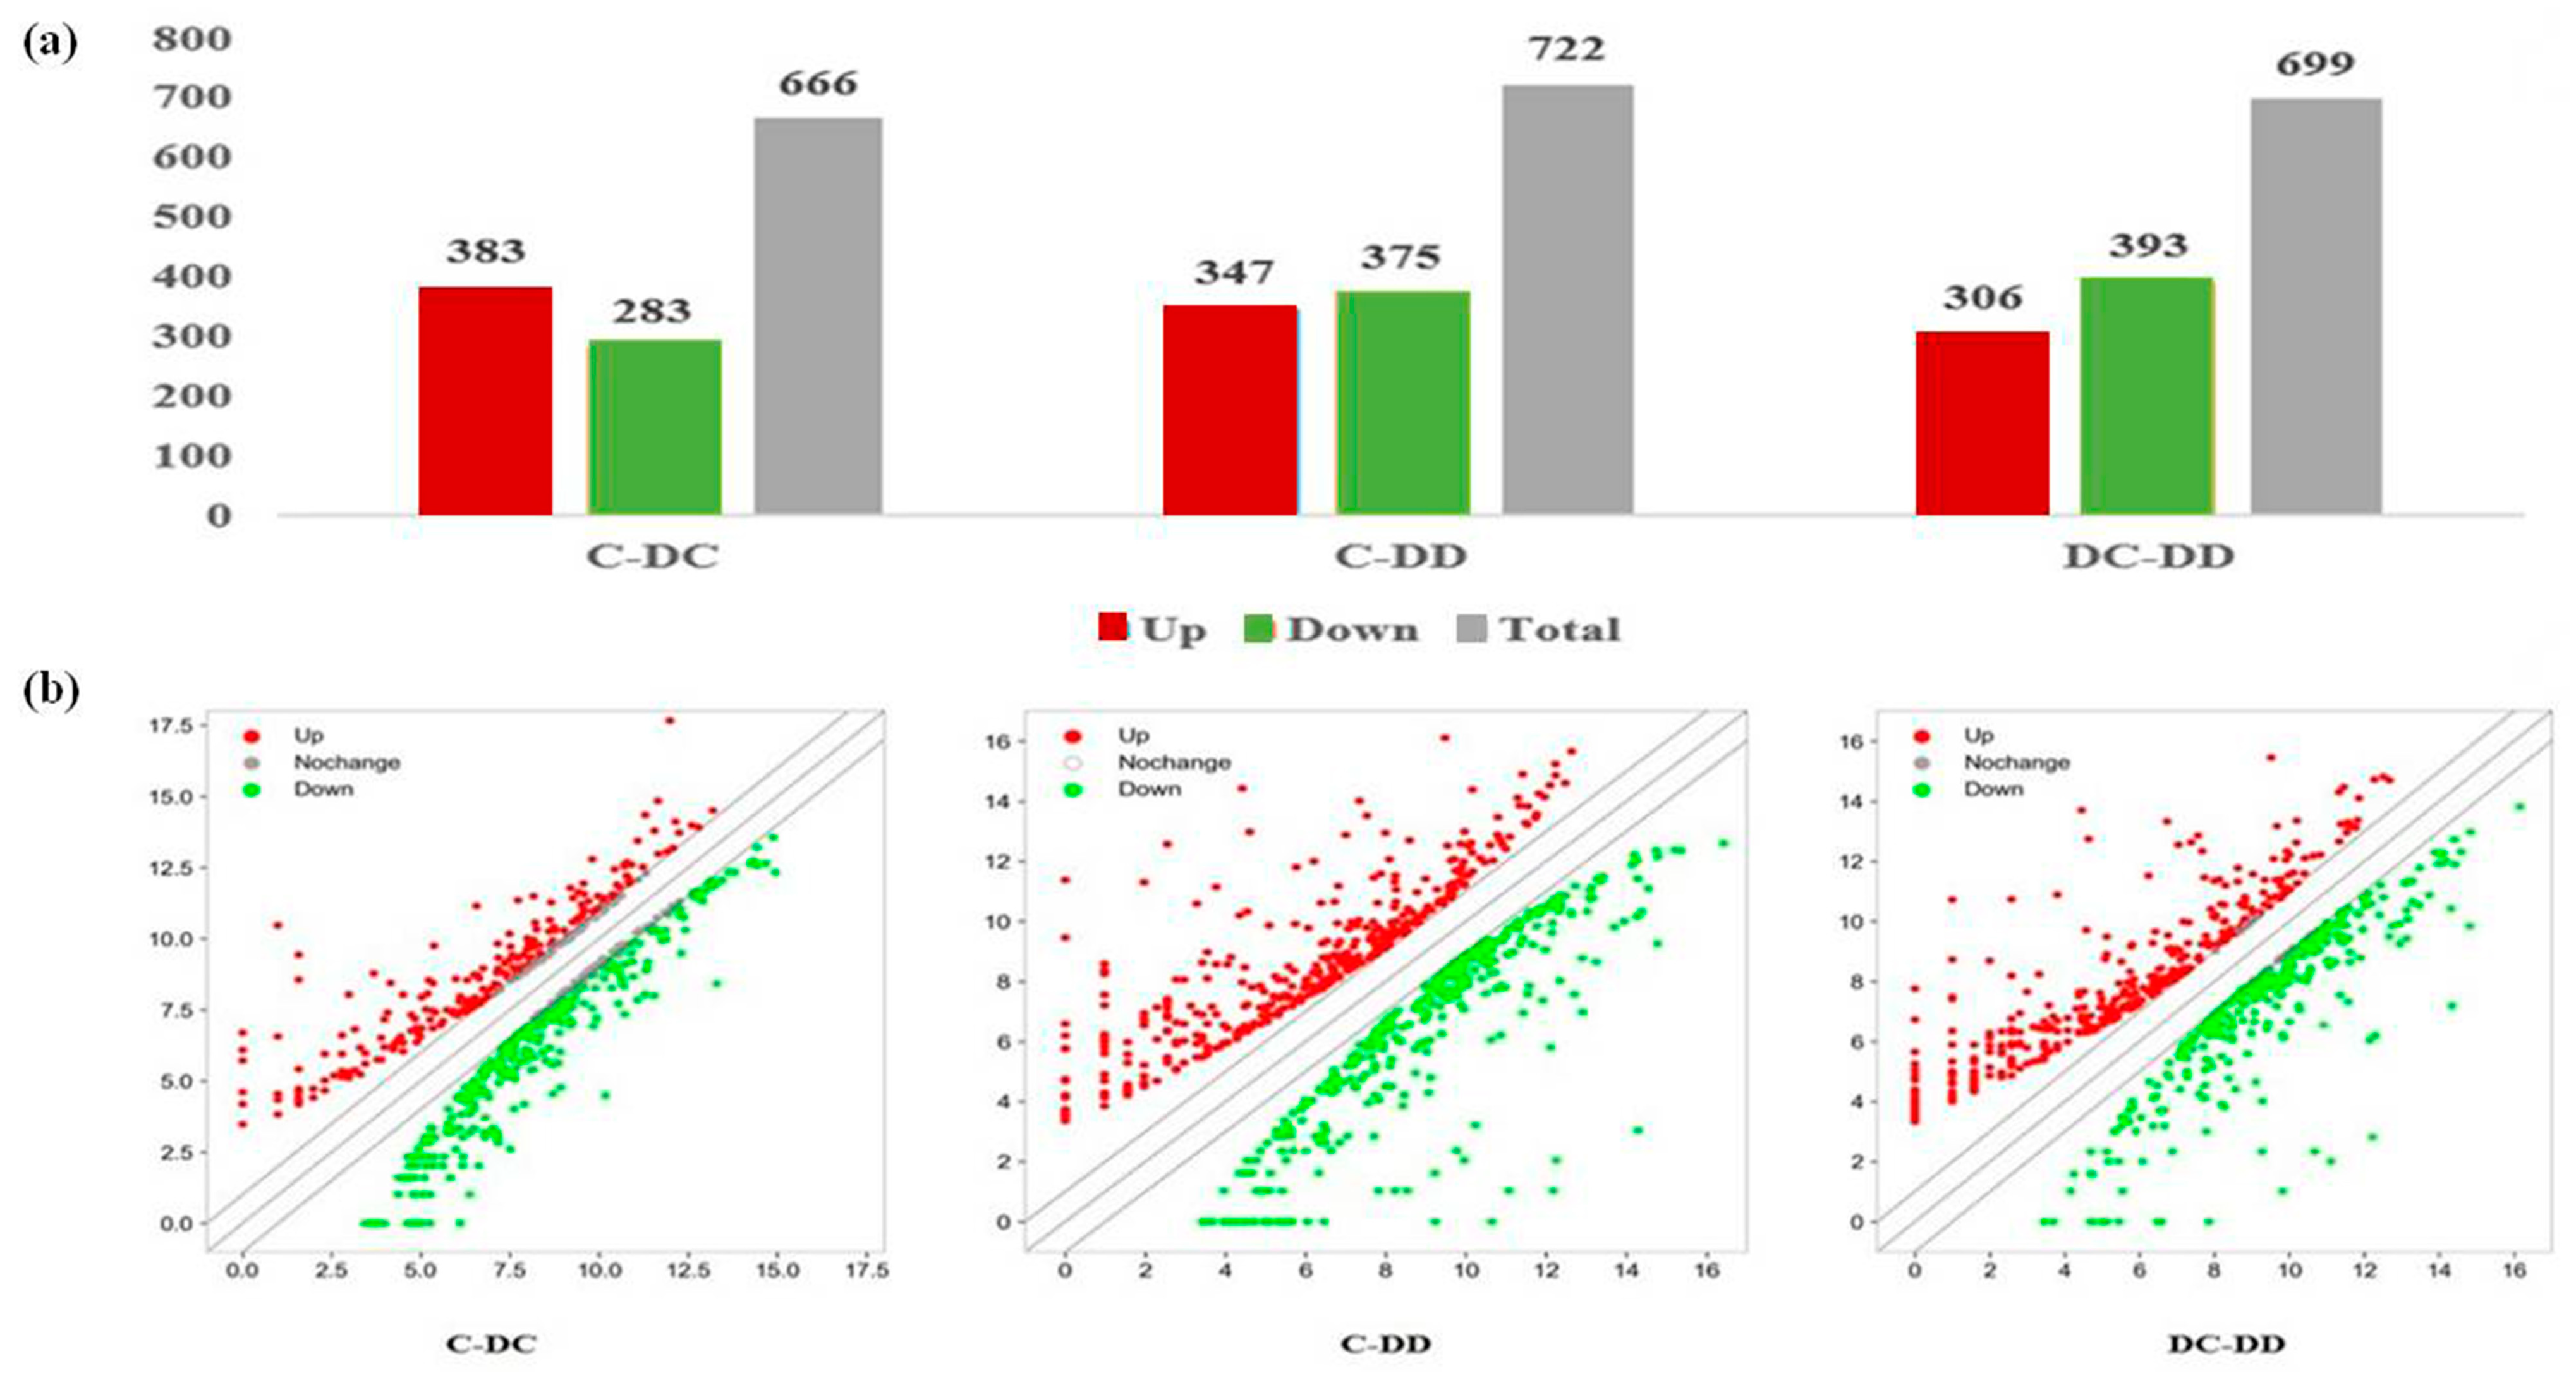
3.2.1. Differential Gene Expression Changes

After the data obtained from sequencing were filtered and analyzed, the differential expression genes (DEGs) among different groups were screened. The differential expression genes of 666 were screened in group C and DC, where 383 genes were up-regulated and 283 genes were down-regulated. There were 722 DEGs in the C group compared with the DD, of which 347 were up-regulated and 375 were down-regulated. Compared with the DD group, there were 699 well-annotated DEGs in the DC group, of which 306 genes were up-regulated and 393 genes were down-regulated. The DEGs among different sample groups were also displayed by volcano map, and the statistical map of the different genes and volcano map are shown in Figure 2.

3.2.2. Differential Protein Expression Changes

The analysis of differentially expressed proteins in the liver of mice between the three sample groups showed that a total of 1016 differentially expressed proteins were screened in the DC group compared with group C, of which 652 were up-regulated and 364 were down-regulated, while there were 1028 differentially expressed proteins between DD and the C group, of which 499 were up-regulated and 529 were down-regulated. Furthermore, compared with the DC group, 1041 well-annotated differentially expressed proteins were screened in the DD group, of which 463 were up-regulated and 578 were down-regulated. The three groups of differentially expressed proteins were mapped into a cluster diagram (Figure S3).

3.2.3. Differential Gene and Protein Expression by Venn Analysis

The intersection analysis of DEGs among C-DC, C-DD, and DC-DD groups was carried out to achieve the results displayed in Supplementary Figure S4, which revealed that there were 91 DEGs among C-DC, C-DD, and DC-DD groups, and there were 250 genes specifically expressed in C-DC with 176 genes expressed in C-DD, and 202 genes expressed in DC-DD. According to the intersection of the C-DC group and C-DD group, 278 DEGs were common, while 388 specifically expressed genes in the C-DC group and 444 specifically expressed genes in the C-DD group were found. According to the intersection of the C-DC group and DC-DD group, there were 229 common DEGs with 437 genes specifically expressed in C-DC group and 470 genes specifically expressed in DC-DD group. For the C-DD group and DC-DD group, there were 359 overlapping DEGs between the two groups with 363 genes specifically expressed in C-DD group and 340 genes differentially expressed in DC-DD group.
The results displayed that there were 16 common expressed proteins among C-DC, C-DD, and DC-DD groups, and there were 26 common proteins in C-DC with 8 proteins commonly expressed in the DD and C group and 19 proteins expressed in DC-DD. According to the intersection between the C-DC group and C-DD group, 44 proteins were expressed both in the two groups, 68 were specifically expressed in the C-DC group, and 100 were specifically expressed by C-DD. For the C-DC group and DC-DD group, 58 differentially expressed proteins were found commonly, including 54 proteins specifically expressed in the C-DC group and 111 specifically in DC-DD group. For the intersection of the C-DD group and DC-DD group, 108 common proteins were found with 36 proteins specifically expressed in the C-DD group and 61 proteins differentially expressed in the DC-DD group. Differential protein expression by Venn diagram analysis is illustrated in Supplementary Figure S5.
In the C-DC group, there were 13 common specific genes between 666 DEGs in transcriptome and 112 differential proteins in the proteome, while in the C-DD group, there were 35 common specific genes between 722 differential genes in transcriptome and 145 differential proteins in the proteome. In DC-DD group, 699 differentially expressed genes in transcriptome and 169 differentially expressed proteins in the proteome shared 35 common specific genes. The intersection and union of the common differential genes among the sample groups are shown in Supplementary Figure S6.

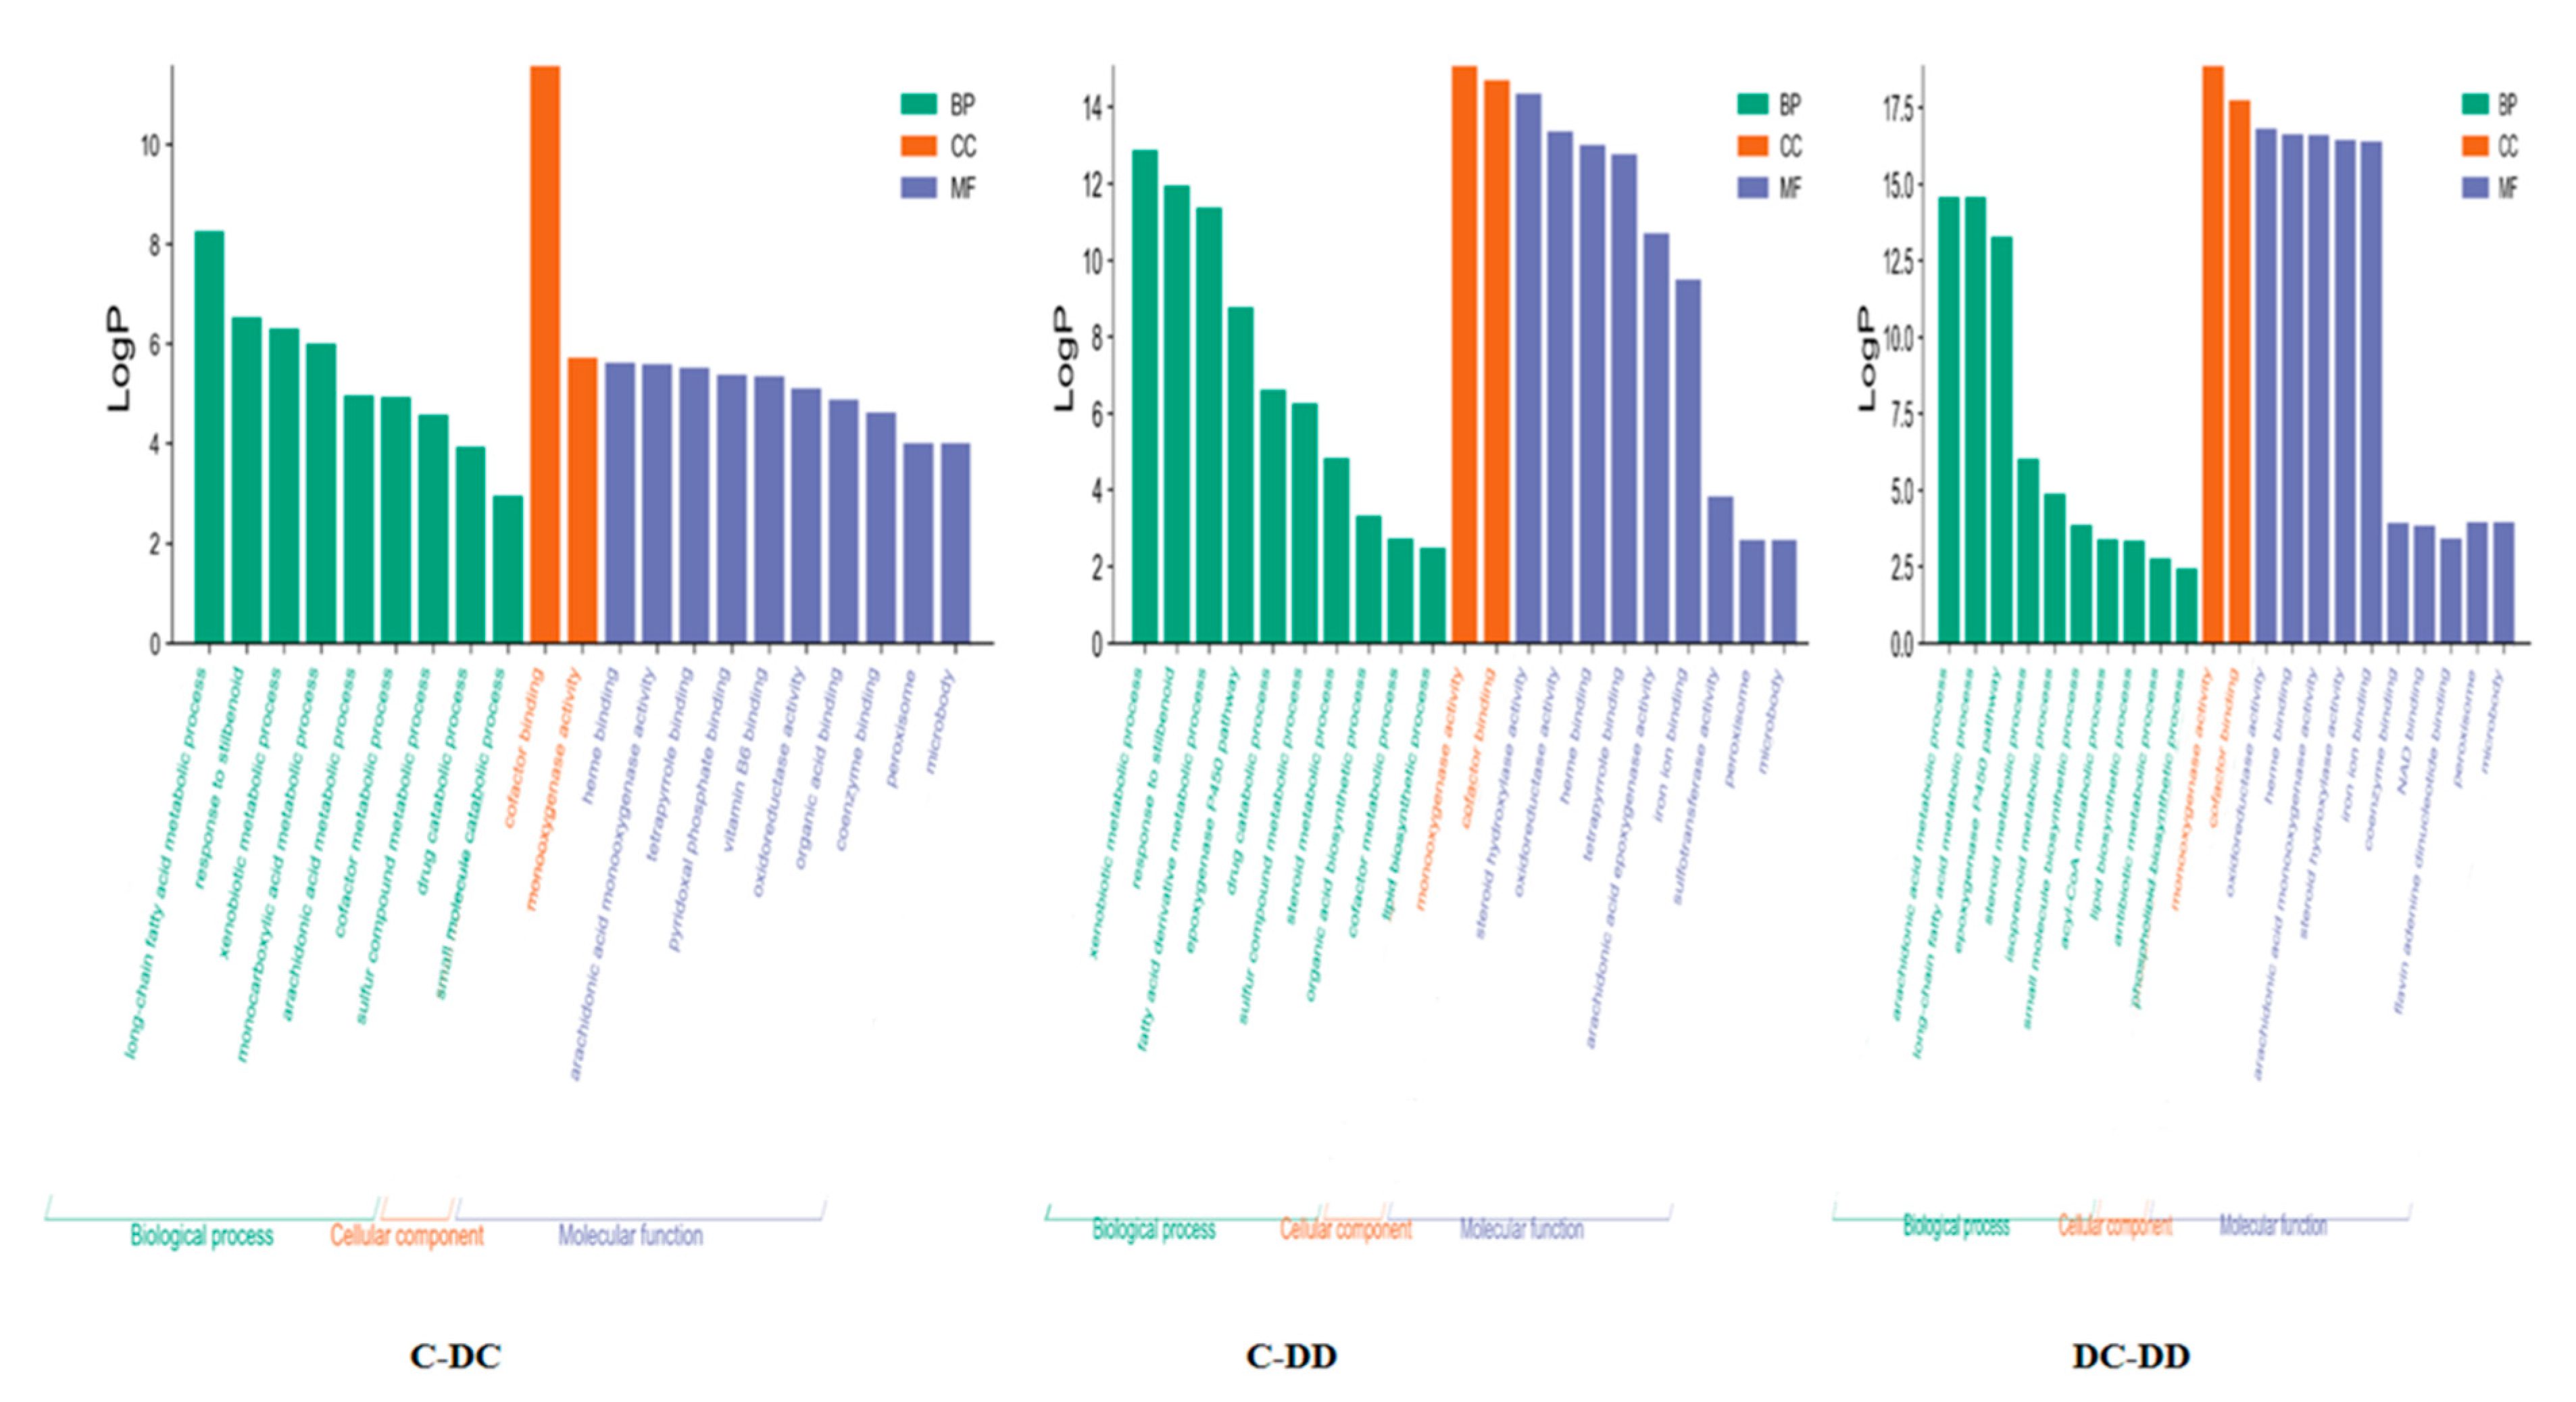
3.3. Go Enrichment Analysis of Common Differential Genes in Transcriptome and Proteome of Three Sample Groups

In the C-DC group, there were 13 common expressed genes in the transcriptome and proteome, which were mainly involved in the metabolism of long-chain fatty acids, response to stilbenoid, the monocarboxylic acid metabolic process, and other biological processes. In terms of molecular function, cofactor binding and monooxygenase activity were the most abundant. In the C-DD group, 35 genes in the transcriptome and proteome were enriched and analyzed, with the results showing that the arachidonic acid metabolic process, long-chain fatty acid metabolic process, epoxygenase P450 pathway, steroid metabolic process, and other categories ranked in the top. In terms of molecular function, the genes were mainly concentrated in monooxygenase activity, cofactor binding, oxidoreductase activity, and heme-binding. In the DC-DD group, 35 genes were commonly expressed in both the transcriptome and proteome. These differentially expressed genes were annotated and enriched by the Metascape online database. In the biological process, they were classified as xenobiotic metabolic process, response to stilbene and fatty acid derivatives from the perspective of molecular function, and most of the differential genes were mainly concentrated in monooxygenase activity and cofactor binding. In addition, there were more differential genes in cell components, such as binding, steroid hydroxylase activity, oxidoreductase activity, heme binding and so on. The go enrichment analysis of common differential genes of the three sample groups is shown in Figure 3. The information of common DEGs/DEPs is in Supplementary Material Table S9.

3.4. KEGG Annotation and Enrichment Analysis of Common Differential Genes in Transcriptome and Proteome of Three Sample Groups

KEGG pathway enrichment analysis was carried out, and the results showed that 13 common genes were mainly enriched in the retinol metabolism pathway in the C-DC group. While, in the C-DD group, 35 genes were mainly enriched in steroid biosynthesis, retinol metabolism, chemical carcinogenesis, and linoleic acid metabolism. Pathways such as retinol metabolism, steroid biosynthesis, arachidonic acid metabolism, and biosynthesis of C5 isoprene in the DC-DD group were at the top. The retinol metabolism pathway was common in the C-DC group, C-DD group, and DC-DD group, while arachidonic acid metabolism, linoleic acid metabolism, and steroid hormone biosynthesis were common in the C-DD group and DC-DD group. Bubble diagrams of these metabolic pathways are drawn in Figure 4.

3.5. Analysis of Protein–Protein Interaction

The protein–protein interaction analysis of the three sample groups is shown in Supplementary Figure S7 to represent that there were 13 nodes and 8 edges in the C-DC group, with an average degree of 1.23. A total of 35 nodes and 43 edges were in the C-DD group, with an average degree of 2.46. Meanwhile, 35 co-expressed genes were associated with each other through 35 nodes and 82 edges, and the average degree of nodes was 4.69 in the DC-DD group.

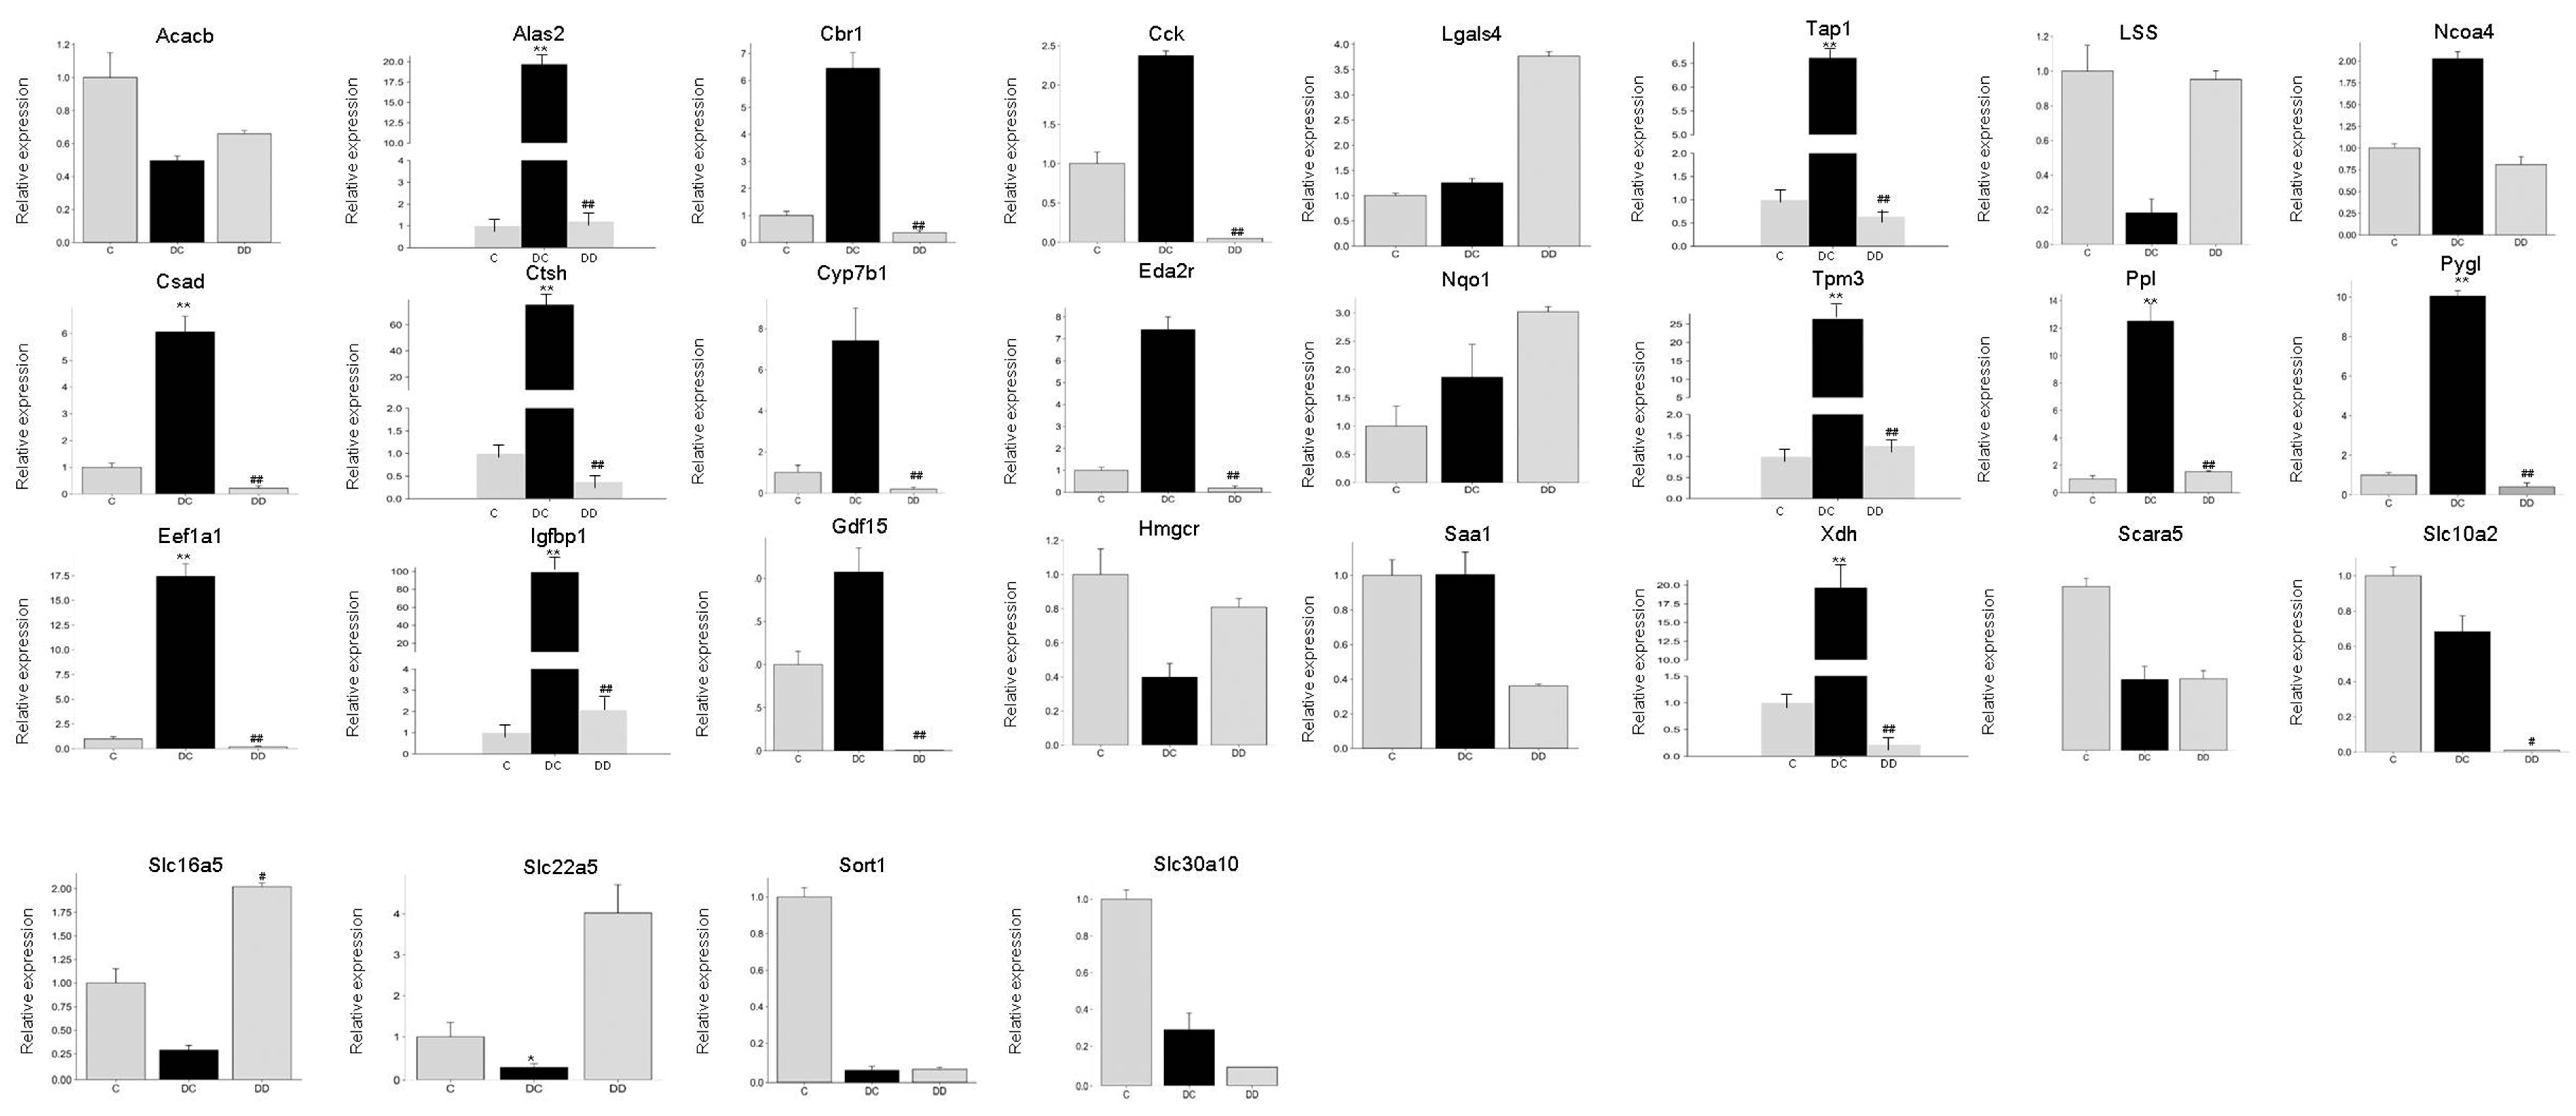
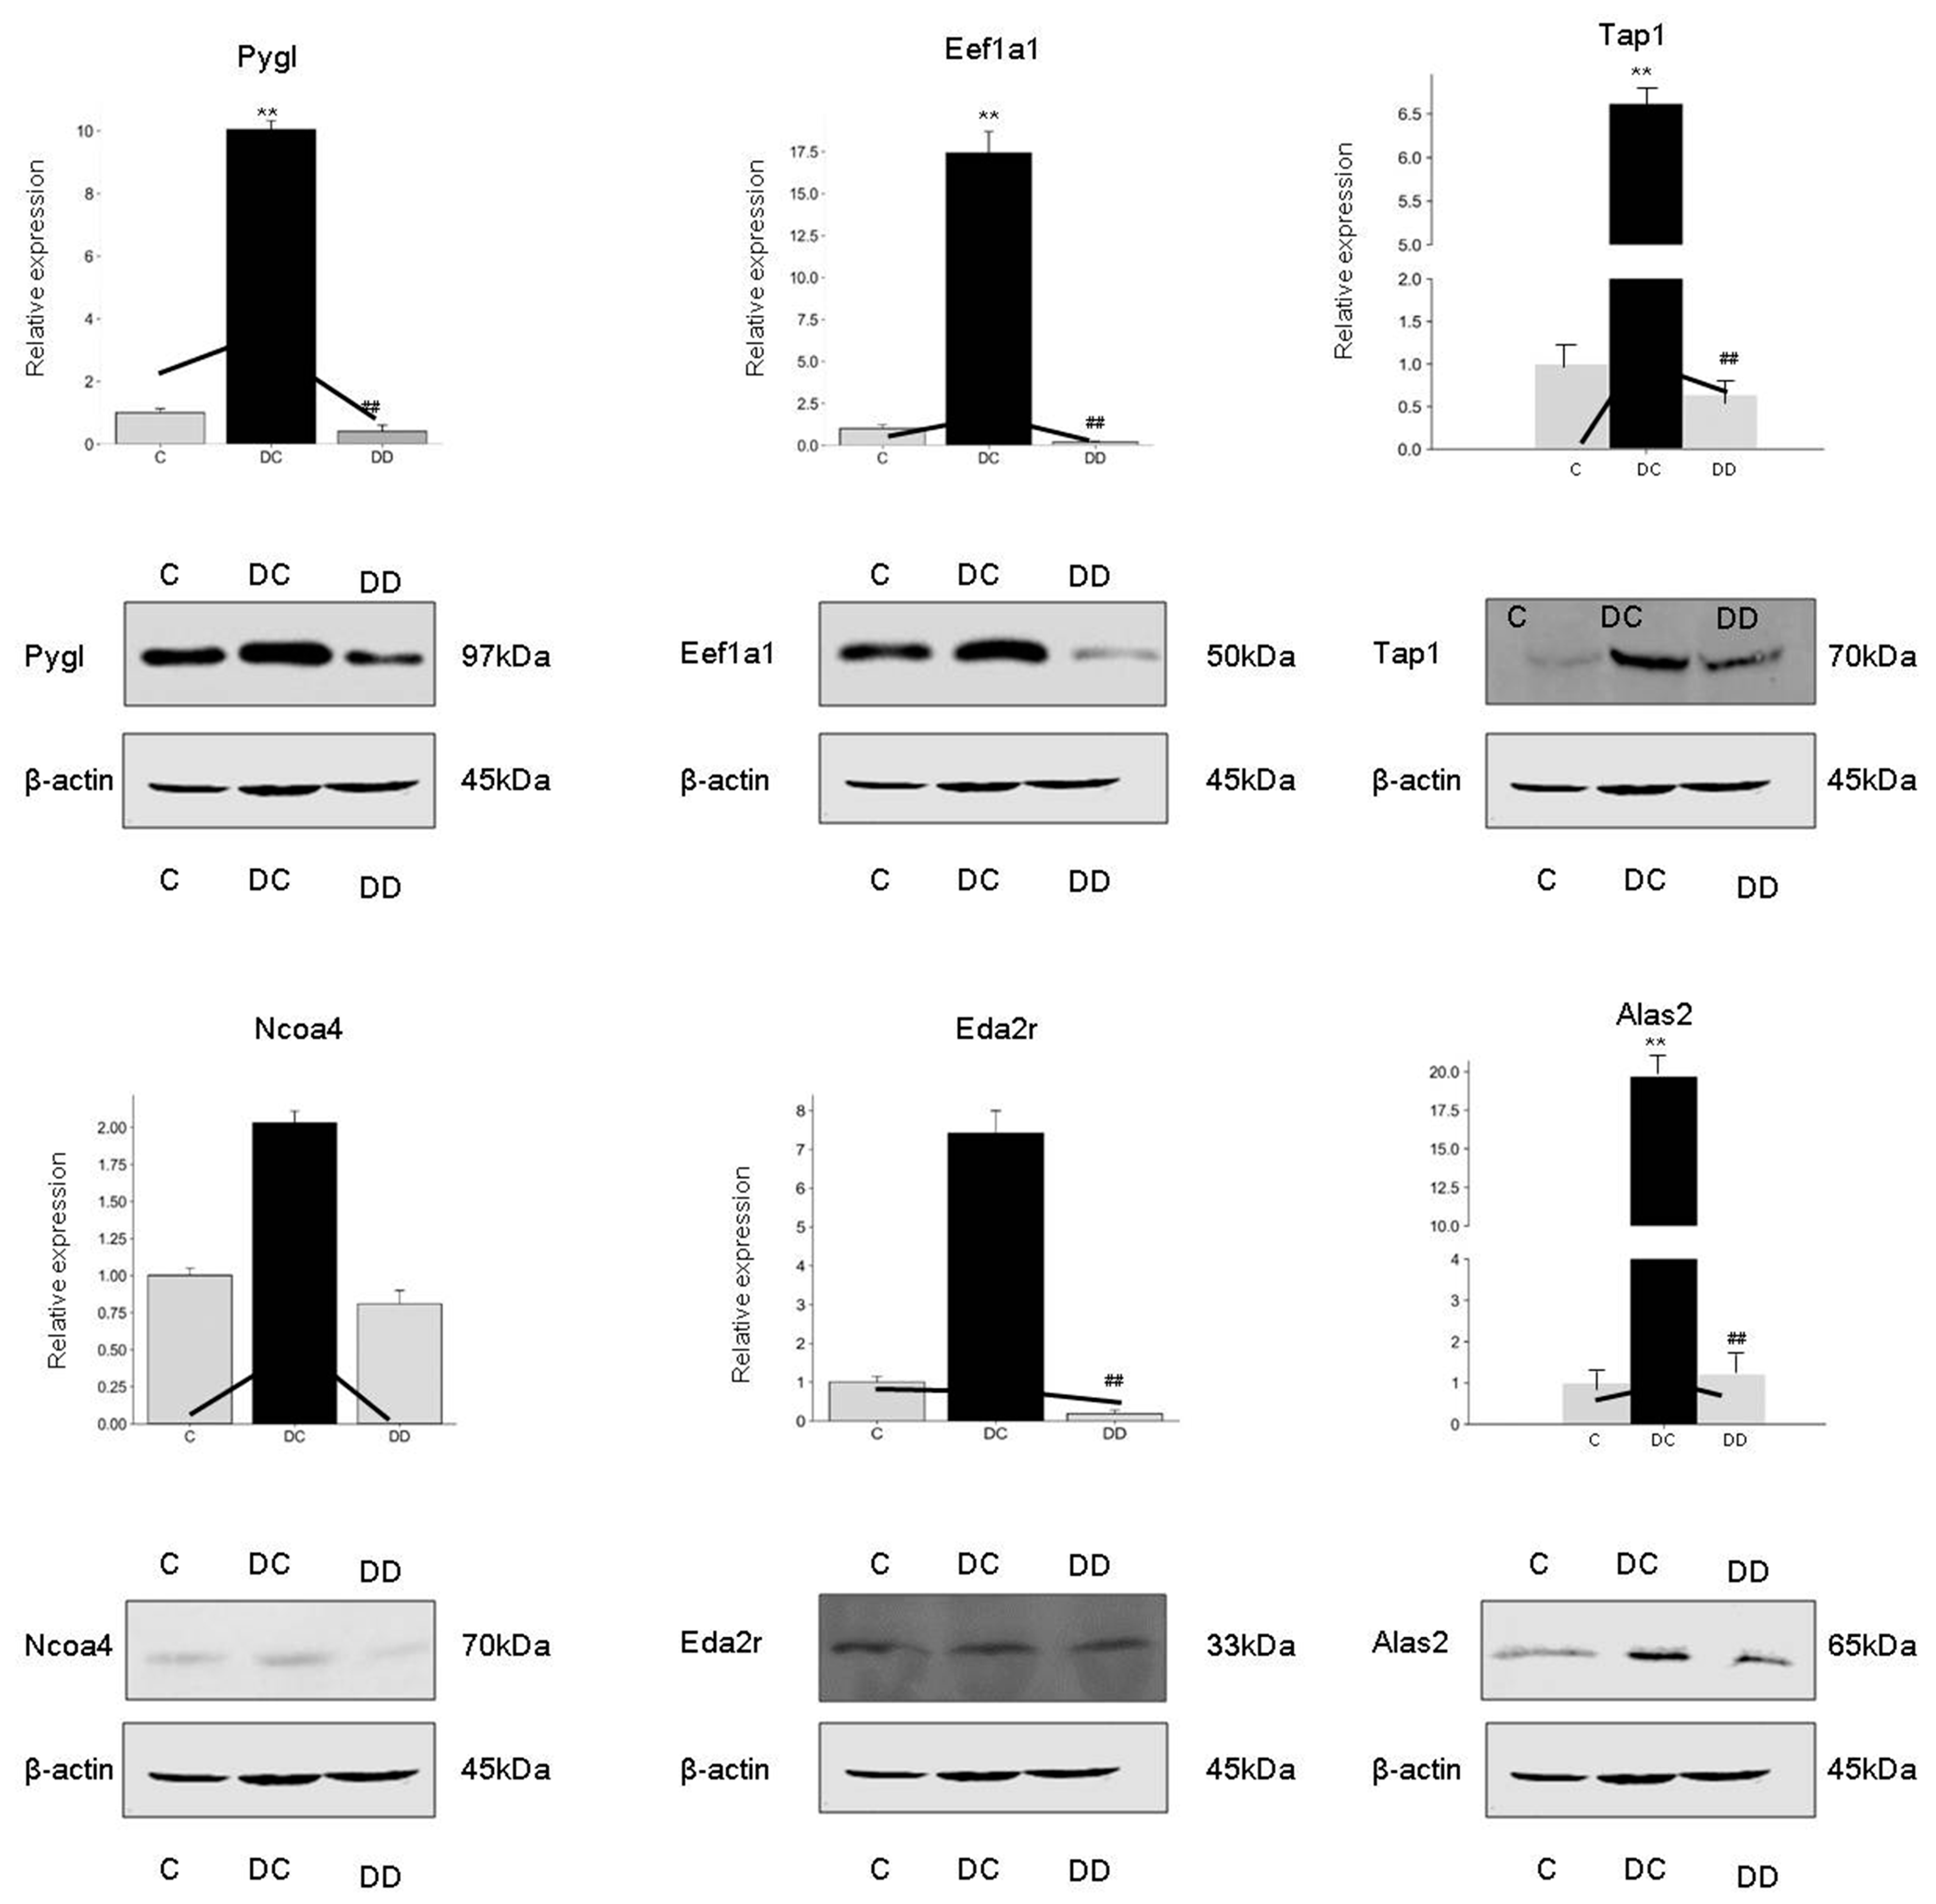
3.6. Identification of DEGs by qRT-PCR

To verify the accuracy of the transcriptome and proteome, the common DEGs of 13–35 with targets for diabetes using RS (relevancescore >28) as specific criteria were screened with the Drugbank Database and 28 DEGs (Pygl, Eef1a1, Csad, Cyp7b1, Xdh, Ctsh, Nqo1, Slc22a5, Igfbp1, Hmgcr, Scara5, Slc10a2, Alas2, Slc30a10, Tpm3, Cck, Lss, Eda2r, Tap1, Gdf15, Ppl, Acacb, Slc16a5, Cbr1, Lgals4, Ncoa4, Sort1, Saa1) were chosen for validation by qRT-PCR. The results indicated that the selected DEGs verified by qRT-PCR maintained similar trends with the results of transcriptome and proteome (Figure 5). Only 8 DEGs were inconsistent with the results of omics and the 20 DEGs (Pygl, Eef1a1, Cyp7b1, Xdh, Ctsh, Nqo1, Igfbp1, Hmgcr, Scara5, Slc10a2, Alas2, Slc30a10, Eda2r, Tap1, Gdf15, Ppl, Acacb, Lgals4, Ncoa4, Sort1) were consistent with the results of omics. The specific data are provided in Supplementary Materials Tables S6 and S7.

3.7. Western Blot Validates Differentially Expressed Proteins

Tap1, Ncoa4, Alas2, Eda2r, pygl, and Eef1a1 were selected to further verify the protein expression in liver tissues by Western blot to achieve the validation results consistent with the results of omics sequencing and qRT-PCR (Figure 6). From the verification results, the protein expression changes of Tap1, pygl and Alas2 were similar to the results of omics sequencing and qRT-PCR. After treated with astragali and Mulberry Leaf, these genes were down-regulated compared with the DC group. Although the results of Ncoa4 were consistent with the results of omics and qRT-PCR, the expression was not obvious among the sample groups. The verification of Eef1a1 was consistent with the results of qRT-PCR, but the expression level of Eef1a1 in the DC group was slightly lower than that in group C with an insignificant difference. Surprisingly, Eda2r has not maintained the same level with the results of omics sequencing and qRT-PCR.

4. Discussion

Aroused by the research hotspot on the prevention and treatment of DM and the daily management of the disease, we analyzed the different genes and proteins among the three groups of liver tissues of mice after gavage with astragali and mulberry leaves by the transcriptome and proteome and predicted the possible molecular synergistic mechanism of the two in reducing blood glucose in our research. Compared with the DD group, 699 differential genes and 1041 significantly different proteins were screened in the DC group, including 306 up-regulated genes, 463 up-regulated proteins, 393 down-regulated genes, and 578 down-regulated proteins. These differentially expressed genes and proteins are involved in glucose and lipid metabolism through retinol metabolism, steroid hormone biosynthesis, long-chain fatty acid metabolism, and lipid biosynthesis.
Many studies have shown that besides the common disorders of glucose metabolism, type 2 diabetes was often accompanied by lipid metabolism disorders, which would further aggravate insulin resistance in patients, and further induce islet β cell dysfunction and even apoptosis [16]. Cholesterol synthesis and metabolism play an important role in the metabolism of carbohydrates and lipids. Cyp7a1 and Hmgcr were reported to be the key factors in cholesterol biosynthesis and metabolism [17,18,19]. In our study, the expression of Cyp7a1 and Hmgcr in the DD group were up-regulated compared with the DC group, indicating that Mulberry Leaf and Radix Astragali may maintain glucose homeostasis because Cyp7a1, as a key rate-limiting enzyme in bile acid production, could promote the conversion of cholesterol to bile acid. Meanwhile, bile acid could be excreted from the body or regulate the activity of a fructose-6-phosphate kinase [20,21,22]. Fmo3 in the liver had been reported as an important node in the synthesis of trivalent amine oxide (TMAO). The increase in its content could lead to the increase in TMAO synthesis, which was believed to play a key role in cardiovascular disease. In addition, TMAO would also induce nuclear factors and eventually lead to atherosclerosis [23]. In our study, we found that the Fmo3 in the liver of the DC group had overexpression compared with group C, but the expression level of Fmo3 protein in liver tissue of mice after administration of astragali and mulberry leaves was significantly lower than that of diabetic mice.
Fabp2 was also a gene that had attracted more attention in recent years, which can participate in the catabolism and synthesis of lipids, and also be responsible for regulating the metabolic process of long-chain fatty acids with the report that the affinity of Fabp2 for long-chain fatty acids would increase after the mutation of site 54, which marked non-esterified fatty acids increase, and these increased fatty acids could make the body appear insulin resistant. In addition, Fabp2 had a positive correlation with diabetic nephropathy, and 54t-fabp2 was expected to become a biomarker for screening diabetic nephropathy. In addition, Fabps could interact with peroxisome proliferator-activated receptor (PPAR) transcription factors (PPAR-α, PPAR-δ, PPAR-γ) to mediate the PPAR signaling pathway [24,25,26,27,28]. Antigen processing associated transporter 1 (Tap1) could be used as an important marker of tumor immunity, as a key factor of the MHC-I antigen presentation pathway. Overexpression of Tap1 would cause the expression of MHC-I molecules on the cell surface to be interrupted, and the HLA gene in MHC-I was involved in the regulation of insulin type diabetes mellitus (IDDM) [29,30,31]. Heme oxygenase (HMOX1) is an important rate-limiting enzyme in the process of heme catabolism, which can catalyze heme to produce a large number of free iron ions. The accumulation of iron ions may cause iron death and the increase in reactive oxygen species and eventually bring about cell apoptosis or oxidative stress response [32,33,34,35].
Furthermore, we also found that in addition to glucose metabolism disorder, the occurrence of diabetes was often accompanied by abnormal fat metabolism, and the liver would be secondary to the fatty liver due to long-term glucose and lipid metabolism disorder and oxidative stress. Many studies had shown that fatty liver was mainly due to the weakening of the body’s ability to resist oxidative stress, and it was unable to effectively eliminate a large number of Reactive Oxygen Species (ROS) produced by antioxidation, and the accumulation of active oxygen would cause the damage of mitochondria and stress of oxidative stress. Previous studies had shown that the occurrence of iron death was closely related to free iron ions, peroxides, glutathione, and lipid peroxides. Trivalent iron ions would enter cells through transporters to form a large number of free divalent iron ions to undergo a Fenton reaction and eventually form many reactive oxygen species. Therefore, it is concluded that the ability of antioxidative stress can be improved by inhibiting the occurrence of iron death [36,37,38]. Ncoa4 played a positive regulatory role in the occurrence of iron death, which could mediate the autophagy of intracellular ferritin and produce a large number of free iron ions, and the inhibition of Ncoa4 was one of the better methods to inhibit iron death [39,40,41,42,43]. Based on the above analysis, we speculated and mapped the potential model of astragali and Mulberry Leaf in maintaining glucose homeostasis (Figure 7).
Finally, it was found that the combination of Mulberry Leaf and Radix Astragali could lower the level of the blood glucose in the streptozotocin-induced diabetic mice. It was speculated that it could regulate the expression of Tap1, Ncoa4, Alas2, in addition to down-regulating the expression of Fabp2 and Hmox1, and up-regulating Hmgcr and Cyp7a1 expression. These genes and proteins could be involved in the retinol metabolism pathway or the cytochrome P450 metabolism pathway. Simultaneously, they may participate in bile acid secretion and inhibit the occurrence of iron death and other comprehensive adjustments of the body’s glucose and lipid metabolism levels.

Supplementary Materials

The following are available online at https://www.mdpi.com/article/10.3390/pr9111898/s1, Figure S1:The weight of the mice in different groups, Figure S2: The feeding and drinking quantity of the mice in the different groups, Figure S3: Heat map of differential proteins of three samples, Figure S4: Venn diagram analysis of differential gene expression, Figure S5: Venn diagram analysis of differential protein expression, Figure S6: The venn of common DEGs of transcriptomics and proteomics, Figure S7: PPI of common DEGs of transcriptomics and proteomics in different groups, Table S1: The body weight of mice in each group, Table S2: The feeding quantity of mice in each group, Table S3: The drinking quantity of mice in each group, Table S4: The blood glucose level of mice in each group, Table S5: The serum insulin level of mice in each group, Table S6: The data of differentially expressed genes were analyzed by qRT-PCR and proteomics, Table S7: The data of differentially expressed genes were analyzed by qRT-PCR and transcriptomics, Table S8: Primer sequence of DEGs, Table S9: The information of the common DEGs/DEPs of the three groups.

Author Contributions

S.Z. wrote the paper, S.Z. and Q.G. had contributed equally to this work, S.Z., L.C. and Q.G. analyzed the data, K.C. designed the research. All authors have read and agreed to the published version of the manuscript.

Funding

This work was supported by the National Natural Science Foundation of China (grant numbers 31861143051, 31872425).

Institutional Review Board Statement

The study was conducted according to the guideline of the Declaration of Helsinki, and approved by the Institutional Review Board (or Ethics Committee) of Jiangsu University (protocol code UJS-IACUC-201903306, 11 September 2019). All experimental procedures were performed in accordance with the recommendations found in the Guide for Care and Use of Laboratory Animals published by the US National Institutes of Health (NIH publication no. 85-23 revised 1996).

Informed Consent Statement

There are no human subjects in this article, and informed consent is not applicable.

Data Availability Statement

Not applicable.

Conflicts of Interest

The authors declare that they have no known competing financial interest or personal relationship that cold have appeared to influence the work reported in this paper.

References

  1. Li, Y.; Teng, D.; Shi, X.; Qin, G.; Qin, Y.; Quan, H.; Shi, B.; Sun, H.; Ba, J.; Chen, B.; et al. Prevalence of diabetes recorded in mainland China using 2018 diagnostic criteria from the American Diabetes Association: National cross sectional study. BMJ 2020, 369, m997. [Google Scholar] [CrossRef]
  2. Zhou, L.; Liao, Y.; Yin, P.; Zeng, Z.; Li, J.; Lu, X.; Zheng, L.; Xu, G. Metabolic profiling study of early and late recurrence of hepatocellular carcinoma based on liquid chromatography-mass spectrometry. J. Chromatogr. B 2014, 966, 163–170. [Google Scholar] [CrossRef]
  3. Shen, X.; Vaidya, A.; Wu, S.; Gao, X. The diabetes epidemic in china: An integrated review of national surveys. Endocr. Pract. 2016, 22, 1119. [Google Scholar] [CrossRef] [PubMed] [Green Version]
  4. Liu, Y.; Li, X.; Xie, C.; Luo, X.; Bao, Y.; Wu, B.; Hu, Y.; Zhong, Z.; Liu, C.; Li, M.J. Prevention effects and possible molecular mechanism of Mulberry Leaf extract and its formulation on rats with Insulin-Insensitivity. PLoS ONE 2016, 11, e152728. [Google Scholar] [CrossRef] [PubMed] [Green Version]
  5. Ty, C.; Preston, T.R.; Ly, J. The use of ensiled cassava leaves in diets for growing pigs. 2. The influence of type of palm oil and cassava leaf maturity on digestibility and N balance for growing pigs. Livest. Res. Rural Dev. 2003, 15, 25–37. [Google Scholar]
  6. Wang, G.Q.; Zhu, L.; Ma, M.L.; Chen, X.C.; Gao, Y.; Yu, T.Y.; Yang, G.S.; Pang, W.J. Mulberry 1-Deoxynojirimycin inhibits adipogenesis by repression of the ERK/PPARγ signaling pathway in porcine intramuscular adipocytes. J. Agric. Food Chem. 2015, 63, 6212. [Google Scholar] [CrossRef]
  7. Li, Q.; Dai, Y.; Zou, Y.; Liao, S.; Shen, W.; Hu, T.; Liu, F. Mulberry (Morus atropurpurea Roxb.) leaf polyphenols inhibits adipogenesis and lipogenesis-related gene expression in 3T3-L1 adipocytes. J. Food Biochem. 2018, 42, e12599. [Google Scholar] [CrossRef]
  8. Wei, F.M.; Chen, C.; Chao, L.I.; Xiong, F.U. Antioxidant and hypoglycemic activities of mulberry leaves extract, tea polyphenols and their compounds. Sci. Technol. Food Ind. 2018, 39, 299–305. [Google Scholar]
  9. Hong, H.D.; Wen, J.M.; Chen, Z.J. The Research Progress on Pharmacological Effects of Astragalus Membranaceus. World Latest Med. Inf. 2016, 14, 49–50, 69. [Google Scholar]
  10. Ma, X.Q.; Shi, Q.; Duan, J.A.; Dong, T.T.X.; Tsim, K.W.K. Chemical analysis of Radix Astragali (Huangqi) in China: A comparison with its adulterants and seasonal variations. J. Agric. Food Chem. 2002, 50, 4861–4866. [Google Scholar] [CrossRef] [PubMed]
  11. Huang, X.; Liu, Y.; Song, F.; Liu, Z.; Liu, S. Studies on principal components and antioxidant activity of different Radix Astragali samples using high-performance liquid chromatography/electrospray ionization multiple-stage tandem mass spectrometry. Talanta 2009, 78, 1090–1101. [Google Scholar] [CrossRef]
  12. Qi, L.W.; Cao, J.; Ping, L.; Yu, Q.T.; Wen, X.D.; Wang, Y.X.; Li, C.Y.; Bao, K.D.; Ge, X.X.; Cheng, X.L. Qualitative and quantitative analysis of Radix Astragali products by fast high-performance liquid chromatography-diode array detection coupled with time-of-flight mass spectrometry through dynamic adjustment of fragmentor voltage. J. Chromatogr. A 2008, 1203, 27–35. [Google Scholar] [CrossRef]
  13. Lin, Y.W.; Chiang, B.H. Anti-tumor activity of the fermentation broth of Cordyceps militaris cultured in the medium of Radix Astragali. Process. Biochem. 2008, 43, 244–250. [Google Scholar] [CrossRef]
  14. Hoo, R.L.; Wong, J.Y.; Qiao, C.F.; Xu, A.; Xu, H.X.; Lam, K.S. The effective fraction isolated from Radix Astragali alleviates glucose intolerance, insulin resistance and hypertriglyceridemia in db/db diabetic mice through its anti-inflammatory activity. Nutr. Metab. 2010, 7, 67. [Google Scholar] [CrossRef] [Green Version]
  15. Jia, R.; Cao, L.; Xu, P.; Jeney, G.; Yin, G. In vitro and in vivo hepatoprotective and antioxidant effects of Astragalus polysaccharides against carbon tetrachloride-induced hepatocyte damage in common carp (Cyprinus carpio). Fish Physiol. Biochem. 2012, 38, 871–881. [Google Scholar] [CrossRef] [PubMed]
  16. Bellamy, L.; Casas, J.P.; Hingorani, A.D.; Williams, D. Type 2 diabetes mellitus after gestational diabetes: A systematic review and meta-analysis. Lancet 2009, 373, 1773–1779. [Google Scholar] [CrossRef]
  17. Ference, B.A.; Robinson, J.G.; Brook, R.D.; Catapano, A.L.; Sabatine, M.S. Variation in PCSK9 and HMGCR and risk of cardiovascular disease and diabetes. N. Engl. J. Med. 2016, 375, 2144. [Google Scholar] [CrossRef] [PubMed] [Green Version]
  18. Kathiresan, S. Developing medicines that mimic the natural successes of the human genome: Lessons from NPC1L1, HMGCR, PCSK9, APOC3, and CETP. J. Am. Coll. Cardiol. 2015, 65, 1562–1566. [Google Scholar] [CrossRef] [Green Version]
  19. Chang, X.L.; Lan, T.; Tan, M.S.; Wang, H.F.; Yu, J.T. Association of HMGCR polymorphism with late-onset Alzheimer’s disease in Han Chinese. Oncotarget 2016, 7, 22746–22751. [Google Scholar] [CrossRef] [Green Version]
  20. Agellon, L.B.; Drover, V.; Cheema, S.K.; Gbaguidi, G.F.; Walsh, A. Dietary cholesterol fails to stimulate the human cholesterol 7α-Hydroxylase gene (CYP7A1) in transgenic mice. J. Biol. Chem. 2002, 277, 20131–20134. [Google Scholar] [CrossRef] [PubMed] [Green Version]
  21. Shin, D.J.; Campos, J.A.; Gil, G.; Osborne, T.F. PGC-1α activates CYP7A1 and bile acid biosynthesis. J. Biol. Chem. 2003, 278, 50047. [Google Scholar] [CrossRef] [Green Version]
  22. Pullinger, C.R.; Eng, C.; Salen, G.; Shefer, S.; Batta, A.K.; Erickson, S.K.; Verhagen, A.; Rivera, C.R.; Mulvihill, S.J.; Malloy, M.J. Human cholesterol 7α-hydroxylase (CYP7A1) deficiency has a hypercholesterolemic phenotype. J. Clin. Investig. 2002, 110, 109–117. [Google Scholar] [CrossRef]
  23. Koukouritaki, S.B.; Simpson, P.; Yeung, C.K.; Rettie, A.E.; Hines, R.N. Human hepatic flavin-containing monooxygenases 1 (FMO1) and 3 (FMO3) developmental expression. Pediatr. Res. 2002, 51, 236–243. [Google Scholar] [CrossRef] [Green Version]
  24. Klapper, M.; Böhme, M.; Nitz, I.; Döring, F. The human intestinal fatty acid binding protein (hFABP2) gene is regulated by HNF-4α. Biochem. Biophys. Res. Commun. 2007, 356, 147–152. [Google Scholar] [CrossRef] [PubMed]
  25. Takakura, Y.; Yoshioka, K.; Umekawa, T.; Kogure, A.; Toda, H.; Yoshikawa, T.; Yoshida, T. Thr54 allele of the FABP2 gene affects resting metabolic rate and visceral obesity. Diabetes Res. Clin. Pract. 2005, 67, 36–42. [Google Scholar] [CrossRef] [PubMed]
  26. Formanack, M.L.; Baier, L.J. Variation in the FABP2 promoter affects gene expression: Implications for prior association studies. Diabetologia 2004, 47, 349–351. [Google Scholar]
  27. Venkatachalam, A.B.; Sawler, D.L.; Wright, J.M. Tissue-specific transcriptional modulation of fatty acid-binding protein genes, fabp2, fabp3 and fabp6, by fatty acids and the peroxisome proliferator, clofibrate, in zebrafish (Danio rerio). Gene 2013, 520, 14–21. [Google Scholar] [CrossRef]
  28. Weiss, E.P.; Brandauer, J.; Kulaputana, O.; Ghiu, I.A.; Wohn, C.R.; Phares, D.A.; Shuldiner, A.R.; Hagberg, J.M. FABP2 Ala54Thr genotype is associated with glucoregulatory function and lipid oxidation after a high-fat meal in sedentary nondiabetic men and women. Am. J. Clin. Nutr. 2007, 85, 102–108. [Google Scholar] [CrossRef] [Green Version]
  29. Gaudet, R.; Wiley, D.C. Structure of the ABC ATPase domain of human TAP1, the transporter associated with antigen processing. EMBO J. 2014, 20, 4964–4972. [Google Scholar] [CrossRef] [PubMed] [Green Version]
  30. Kallfelz, M.; Jung, D.; Hilmes, C.; Knuth, A.; Seliger, B. Induction of immunogenicity of a human renal-cell carcinoma cell line by TAP1-gene transfer. Int. J. Cancer 2015, 81, 125–133. [Google Scholar] [CrossRef]
  31. Shen, L.; Chiang, A.; Liu, W.; Li, G.; Liang, R.; Srivastava, G. Expression of HLA class I, beta(2)-microglobulin, TAP1 and IL-10 in Epstein-Barr virus-associated nasal NK/T-cell lymphoma: Implications for tumor immune escape mechanism. Int. J. Cancer 2015, 92, 692–696. [Google Scholar] [CrossRef]
  32. Wagener, F.; Toonen, E.; Wigman, L.; Fransen, J.; Russel, F. HMOX1 promoter polymorphism modulates the relationship between disease activity and joint damage in rheumatoid arthritis. Arthritis Rheum. 2010, 58, 3388–3393. [Google Scholar] [CrossRef]
  33. Walther, M.; Caul, A.D.; Aka, P.; Njie, M.; Amambua-Ngwa, A.; Walther, B.; Predazzi, I.M.; Cunnington, A.; Deininger, S.; Takem, E.N.; et al. HMOX1 gene promoter alleles and high HO-1 levels are associated with severe malaria in gambian children. PLoS Pathog. 2012, 8, e1002579. [Google Scholar] [CrossRef] [PubMed] [Green Version]
  34. Keenan, B.T.; Chibnik, L.B.; Cui, J.; Ding, B.; Padyukov, L.; Kallberg, H.; Bengtsson, C.; Klareskog, L.; Alfredsson, L.; Karlson, E.W. Effect of interactions of glutathione S-transferase T1, M1, and P1 and HMOX1 gene promoter polymorphisms with heavy smoking on the risk of rheumatoid arthritis. Arthritis Rheum. 2010, 62, 3196–3210. [Google Scholar] [CrossRef]
  35. Curjuric, I.; Imboden, M.; Schindler, C.; Downs, S.H.; Probst-Hensch, N.M. HMOX1 and GST variants modify attenuation of FEF25-75% decline due to PM10 reduction. Eur. Respir. J. 2010, 35, 505–514. [Google Scholar] [CrossRef]
  36. Leaf, D.E.; Rajapurkar, M.; Lele, S.S.; Mukhopadhyay, B.; Boerger, E.A.; Mc Causland, F.R.; Eisenga, M.F.; Singh, K.; Babitt, J.L.; Kellum, J.A.; et al. Iron, hepcidin, and death in human AKI. J. Am. Soc. Nephrol. 2019, 30, 493–504. [Google Scholar] [CrossRef] [PubMed] [Green Version]
  37. Moore, A.; Worwood, M. Iron and sudden infant death syndrome. BMJ 2019, 298, 1248, (Clinical research ed.). [Google Scholar] [CrossRef] [Green Version]
  38. Nakmura, T.; Naguro, I.; Ichijo, H. Iron homeostasis and iron-regulated ROS in cell death, senescence and human diseases. Biochim. Biophys. Acta (BBA) Gen. Subj. 2019, 1863, 1398–1409. [Google Scholar] [CrossRef] [PubMed]
  39. Martin, V.; Distefano, A.; Dixon, S.; Bellido, A.; Soto, D.; Cordoba, J.P.; D’Ippolito, S.; Colman, S.; Bartoli, C.; Fiol, D. An iron dependent death pathway involved in the response of plants to biotic and abiotic stresses. Biocell 2014, 38, 80. [Google Scholar]
  40. Tang, H.M.; Cheung, P. Gallic acid triggers Iron-Dependent cell death with apoptotic, ferroptotic, and necroptotic features. Toxins 2019, 11, 492. [Google Scholar] [CrossRef] [Green Version]
  41. Perring, J.; Crawshay-Williams, F.; Huang, C.; Townley, H.E. Bio-inspired melanin nanoparticles induce cancer cell death by iron adsorption. J. Mater. Sci. Mater. Med. 2018, 29, 181. [Google Scholar] [CrossRef] [PubMed] [Green Version]
  42. Robb, S.J.; Robb-Gaspers, L.D.; Scaduto, J.; Thomas, A.P.; Connor, J.R. Influence of calcium and iron on cell death and mitochondrial function in oxidatively stressed astrocytes. J. Neurosci. Res. 2015, 55, 674–686. [Google Scholar] [CrossRef]
  43. Gil, L.D.; Kyoung, K.M.; Min, K.K.; Seop, K.H.; Oh-Shin, K.; Hyun-Shik, L.; Dong-Seok, L. Peroxiredoxin 5 prevents iron overload-induced neuronal death by inhibiting mitochondrial fragmentation and endoplasmic reticulum stress in mouse hippocampal HT-22 cells. Int. J. Biochem. Cell Biol. 2018, 102, 10–19. [Google Scholar]
Figure 1. The blood glucose and the serum insulin of the mice in the different groups. (a) represents the blood glucose while (b) means the serum insulin of the mice with normal group (C), diabetic model group (DC), combination of Mulberry Leaf and Radix Astragali treatment group (DD). * p < 0.05, compared with C, ** p < 0.01, compared with C, # p < 0.05, compared with DD, ## p < 0.01, compared with DD.
Processes 09 01898 g001
Figure 2. The statistical map and volcano map of the different genes in the three sample groups. (a) represents the statistical data of DEGs, while (b) is the volcano map. The red represents the genes up-regulated, with the down-regulated as green, and the grey means the total number in the statistical map. The red points were used to show the genes with up-regulated expression, and the genes with reduced expression are represented by green points, while the gray points indicate no significant difference in the volcano map.
Processes 09 01898 g002
Figure 3. GO annotation and enrichment of common DEGs of transcriptomics and proteomics in the three sample groups (C-DC, C-DD, DC-DD).
Processes 09 01898 g003
Figure 4. KEGG pathway of common DEGs of transcriptomics and proteomics in different groups.
Processes 09 01898 g004
Figure 5. Validation by qRT-PCR of DGEs (C means the normal group, DC is the diabetic group; DD means the group treated with Mulberry Leaf and Radix Astragali. * indicates compared with C, p < 0.05, ** p < 0.01, # indicates compared with DC, p < 0.05, ## p < 0.01. All data are shown as the mean ± standard error, n = 3).
Processes 09 01898 g005
Figure 6. The expression patterns of DEGs, determined by qRT-PCR and Western Blot. The normal group means C, and DC is the diabetic control group, while DD is the group treated with Mulberry Leaf and Radix Astragali. ** p < 0.01, ## p < 0.01. All data are shown as the mean ± standard error, n = 3.
Processes 09 01898 g006
Figure 7. Transcriptome and proteome analysis of the potential molecular mechanism of Radix Astragali and mulberry leaves in lowering blood glucose. The orange means the key genes related to the hypoglycemic effect of Radix Astragali and Mulberry Leaf. The blue means the main genes related to the metabolic pathways involved in the key genes.
Processes 09 01898 g007
Publisher’s Note: MDPI stays neutral with regard to jurisdictional claims in published maps and institutional affiliations.

