Article

Multi-Residue Analysis of Thyreostats in Animal Muscle Tissues by Hydrophilic Interaction Liquid Chromatography Tandem Mass Spectrometry: A Thorough Chromatographic Study

by
Anastasia S. Kritikou
1,
Marilena E. Dasenaki
2,
Niki C. Maragou
1,
Marios G. Kostakis
1 and
Nikolaos S. Thomaidis
1,*
1
Laboratory of Analytical Chemistry, Department of Chemistry, National and Kapodistrian University of Athens, Panepistimioupolis Zographou, 15771 Athens, Greece
2
Laboratory of Food Chemistry, Department of Chemistry, National and Kapodistrian University of Athens, Panepistimioupolis Zographou, 15771 Athens, Greece
*
Author to whom correspondence should be addressed.
Separations 2024, 11(9), 269; https://doi.org/10.3390/separations11090269
Submission received: 21 July 2024 / Revised: 7 September 2024 / Accepted: 9 September 2024 / Published: 14 September 2024

Abstract

:
Τhyreostats (TSs) are veterinary drugs used in livestock farming for fattening. Their administration is banned in the European Union since 1981, and their monitoring for food quality and safety control requires sensitive and confirmatory methods. The present study describes the development and validation of a hydrophilic interaction liquid chromatography tandem mass spectrometry (HILIC-MS/MS) method for the simultaneous determination of 2-thiouracil (TU), 6-methyl-2-thiouracil (MTU), 6-propyl-2-thiouracil (PTU), 6-phenyl-2-thiouracil (PhTU), tapazole (TAP), and 2-mercaptobenzimidazole (MBI) in bovine muscle tissues. Investigation of the retention mechanism of the six analytes on the selected amide-based stationary phase showed that hydrophilic partition was the dominant interaction. The sample preparation included extraction with ACN/H2O (80/20), followed by dispersive solid-phase extraction (d-SPE) with C18 sorbent and hexane partitioning. The method was validated according to European guidelines using internal standards, including isotopically labelled ones. The method’s LODs ranged between 2.8 ng g−1 (6-phenyl-2-thiouracil) and 4.1 ng g−1 (2-thiouracil). Application of the proposed method to 48 bovine tissue samples showed non-detectable results.

1. Introduction

In today’s era of consumerism, where meat is a main constituent in Western diet [1] and the demand for meat production in the food market is increased, veterinary drugs are commonly administered in livestock farming for therapeutic and preventive purposes, as well as for growth promotion for intensive animal production. Thyreostats (TSs) are a group of polar, low molecular weight compounds, known as thioamides, that inhibit the thyroid function by decreasing the synthesis of the thyroid hormones triiodothyronine (T3) and thyroxine (T4). They can be categorised into naturally occurring sulphur compounds and xenobiotic TSs. Among the xenobiotic thyreostats, 2-thiouracil, 6-methyl-2-thiouracil, 6-propyl-2-thiouracil, 6-phenyl-2-thiouracil, tapazole and 2-mercaptobenzimidazole (Figure 1) are of increased interest because of their high effect as thyrostatic agents [2,3,4]. Their administration aims at animal weight gain due to water retention in edible tissues and increased filling of the gastrointestinal tract [5]. This process leads to the production of downgraded quality meat since it contains more water. In addition to that, there is a safety risk since some thyreostats, such as methylthiouracil, propylthiouracil and thiouracil are classified as possibly carcinogenic to humans (Group 2B), according to the International Agency for Research on Cancer Monograph [6]. It is noted that the European Union banned the administration of TSs in 1981 [7]. Although no maximum residue limits (MRLs) are established by the European authorities for thyreostats, the European Union Reference Laboratories (EURLs) sets Minimum Method Performance Requirements (MMPRs) at 10 ng mL−1 in urine and the thyroid gland for thiouracil, methyl-thiouracil, propyl-thiouracil, and tapazole [8]. The analytical methods applied for the enforcement of the regulatory specifications for these substances should meet the performance criteria defined in Regulation (EU) 2021/808 [9] replacing recently the Commission Decision 2002/657/EC, which is still partially in force until 2026 [10].
Based on the aforementioned, it becomes obvious that sensitive and confirmatory analytical methods are required in order to detect low concentrations of TSs reliably in food of animal origin. In the last decade, a wide range of analytical methodologies have been reported in the literature for the determination of TSs in various food matrices, such as milk [11,12,13], baby foods and infant formula [14], animal feed [15], and animal muscle tissues [16,17,18,19,20] applying different analytical techniques and sample preparation procedures. A thorough literature review of the analytical methodologies reported for the determination of TSs in food matrices during the last decade is presented in Table S1 in Supplementary Material. Most of these studies use liquid chromatography tandem mass spectrometry (LC-MS/MS) due to its unambiguous accuracy, selectivity and sensitivity [21]. However, most of these methodologies include a derivatization step of TSs in order to be detectable using reversed phase liquid chromatography. During the last years, hydrophilic interaction liquid chromatography (HILIC) has demonstrated its high potential for the chromatographic separation of polar compounds [22], such as nucleotides [23] and artificial sweeteners [24]; however, this separation technique has been applied only once for the chromatographic separation of three polar thyreostats, thiouracil, methylthiouracil and propylthiouracil, in animal tissues followed by UV detection at 270 nm [18]. The deficiency of this method is that the detection with UV absorbance does not have a sufficient degree of certainty for the identification of the analytes, especially in the presence of such complex matrices, in contrast to tandem mass spectrometry, where the points of identification are increased since apart from the retention time, at least one parent ion and two characteristic product ions are used for the identification of the analyte.
The aim of the present study was the development of a confirmatory HILIC-electrospray (ESI) triple quadrupole MS/MS method after a stepwise optimisation of the chromatographic and mass spectrometric parameters, for the simultaneous determination of six thyrostatic compounds in animal muscle tissues for the first time. In addition, the retention mechanism of the analytes was investigated based on the effect of temperature, organic content and buffer concentration of mobile phase on the analytes’ retention. Different sample preparation protocols were tested and the one with the highest recoveries was selected. The method was validated based on the criteria set in European Regulation and guidance documents, and finally applied to bovine market samples. Taking full advantage of HILIC chromatography for the separation of polar compounds as TSs, along with the high selectivity and sensitivity provided by triple quadrupole mass spectrometry instrumentation, the method allows multi-residue short-time analysis, avoiding a time-consuming derivatization step.

2. Materials and Methods

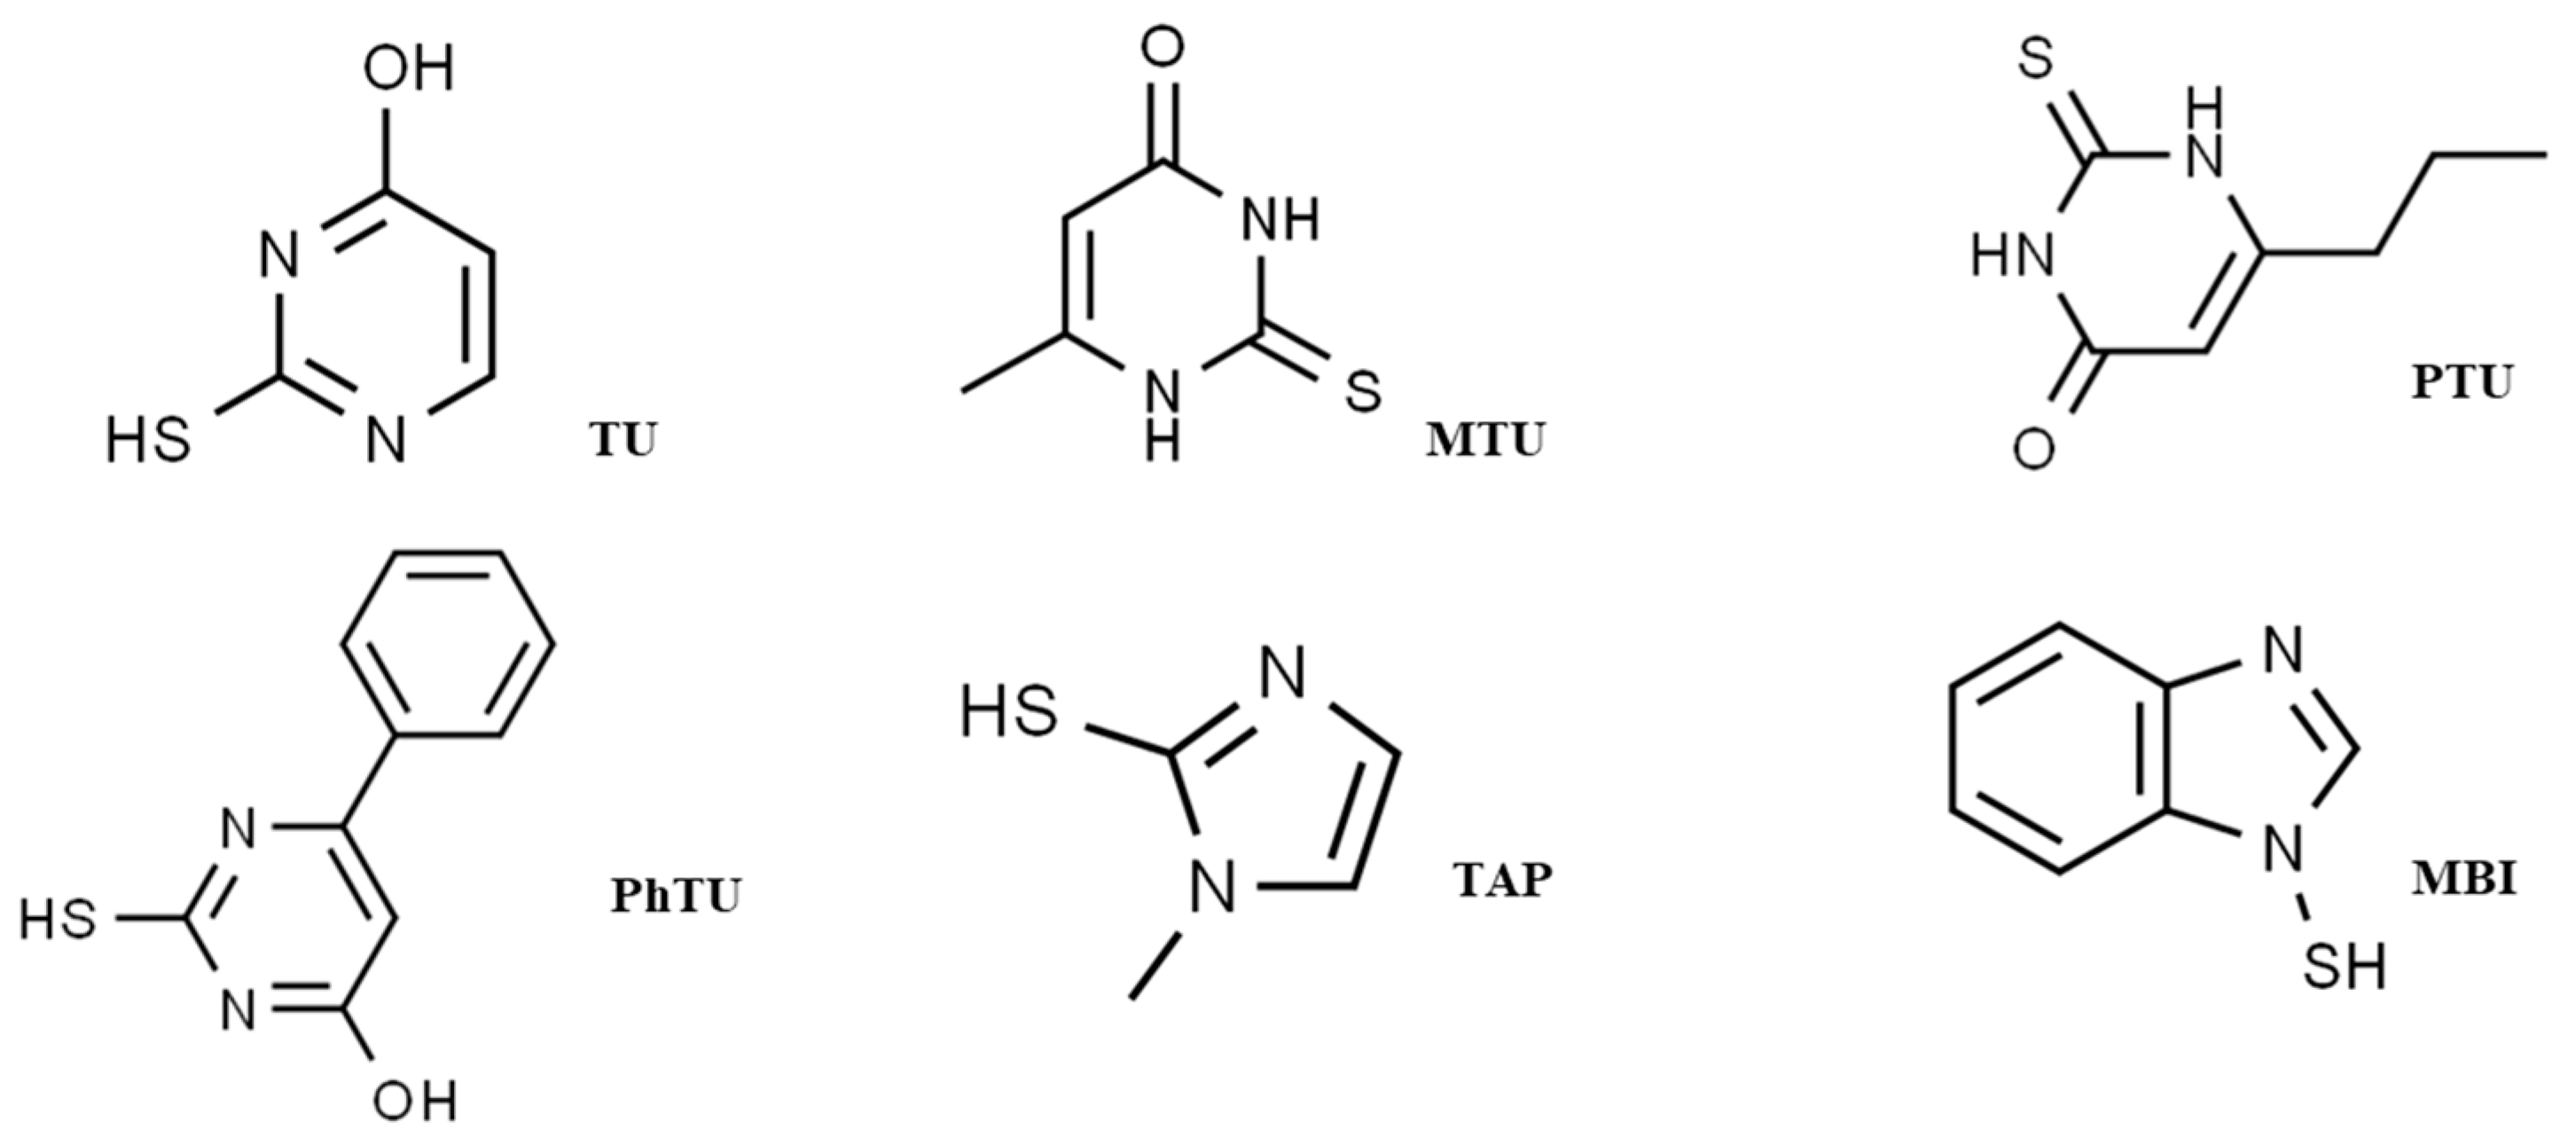
2.1. Chemicals and Reagents

The thyreostat analytical standards 1-methyl-2-mercaptoimidazole (or methimazole, TAP), 2-thiouracil (TU), 6-methyl-2-thiouracil (MTU), 6-propyl-2-thiouracil (PTU), 6-phenyl-2-thiouracil (PhTU) and MBI (mercaptobenzimidazole) (Figure 1), the isotopically labelled internal standards 6-propyl-2-thiouracil-d5 (PTU-d5) and methimazole-d3 (TAP-d3), as well as the internal standard 5,6-dimethyl-2-thiouracil (DMTU) were of high purity grade (>95%) and obtained from Sigma-Aldrich (Steinheim, Germany). The chemical formula, the exact mass, their synonyms and the Log Kow of the target analytes are presented in Table S2.
Acetonitrile (ACN) and methanol (MeOH), both LC-MS grade, were purchased from Merck (Darmstadt, Germany), while formic acid (99% purity) and ammonium formate were purchased from Fluka (Buchs, Switzerland). N-hexane (pesticide analysis grade, 95%) was purchased from Carlo Erba (Milan, Italy). Distilled water was provided by a MilliQ purification apparatus (Millipore Direct-Q UV, Bedford, MA, USA). Regenerated Cellulose (RC) syringe filters (15 mm diameter, 0.2 μm pore size) were obtained from Phenomenex (Torrance, CA, USA).
Standard stock solutions of each analyte and internal standards were prepared in ACN at a concentration level of 1 mg mL−1 and were stored at −20 °C in dark glass bottles to prevent potential photodegradation. Intermediate standard solutions of 10 μg mL−1 were prepared by further dilution of stock solutions with ACN. For fortification purposes, a mixed standard solution containing all target analytes was prepared at a concentration of 1 μg mL−1 in ACN. A mix solution of the three internal standards was also prepared at 1 μg mL−1 in ACN. Working standard solutions were stored at 8 °C, for no longer than six months.

2.2. Samples

A total of 48 bovine muscle tissue samples were obtained from Greek meat producers. Homogenization of samples was performed with a 400 W electric food chopper with blades. The samples were kept at −20 °C until analysis.

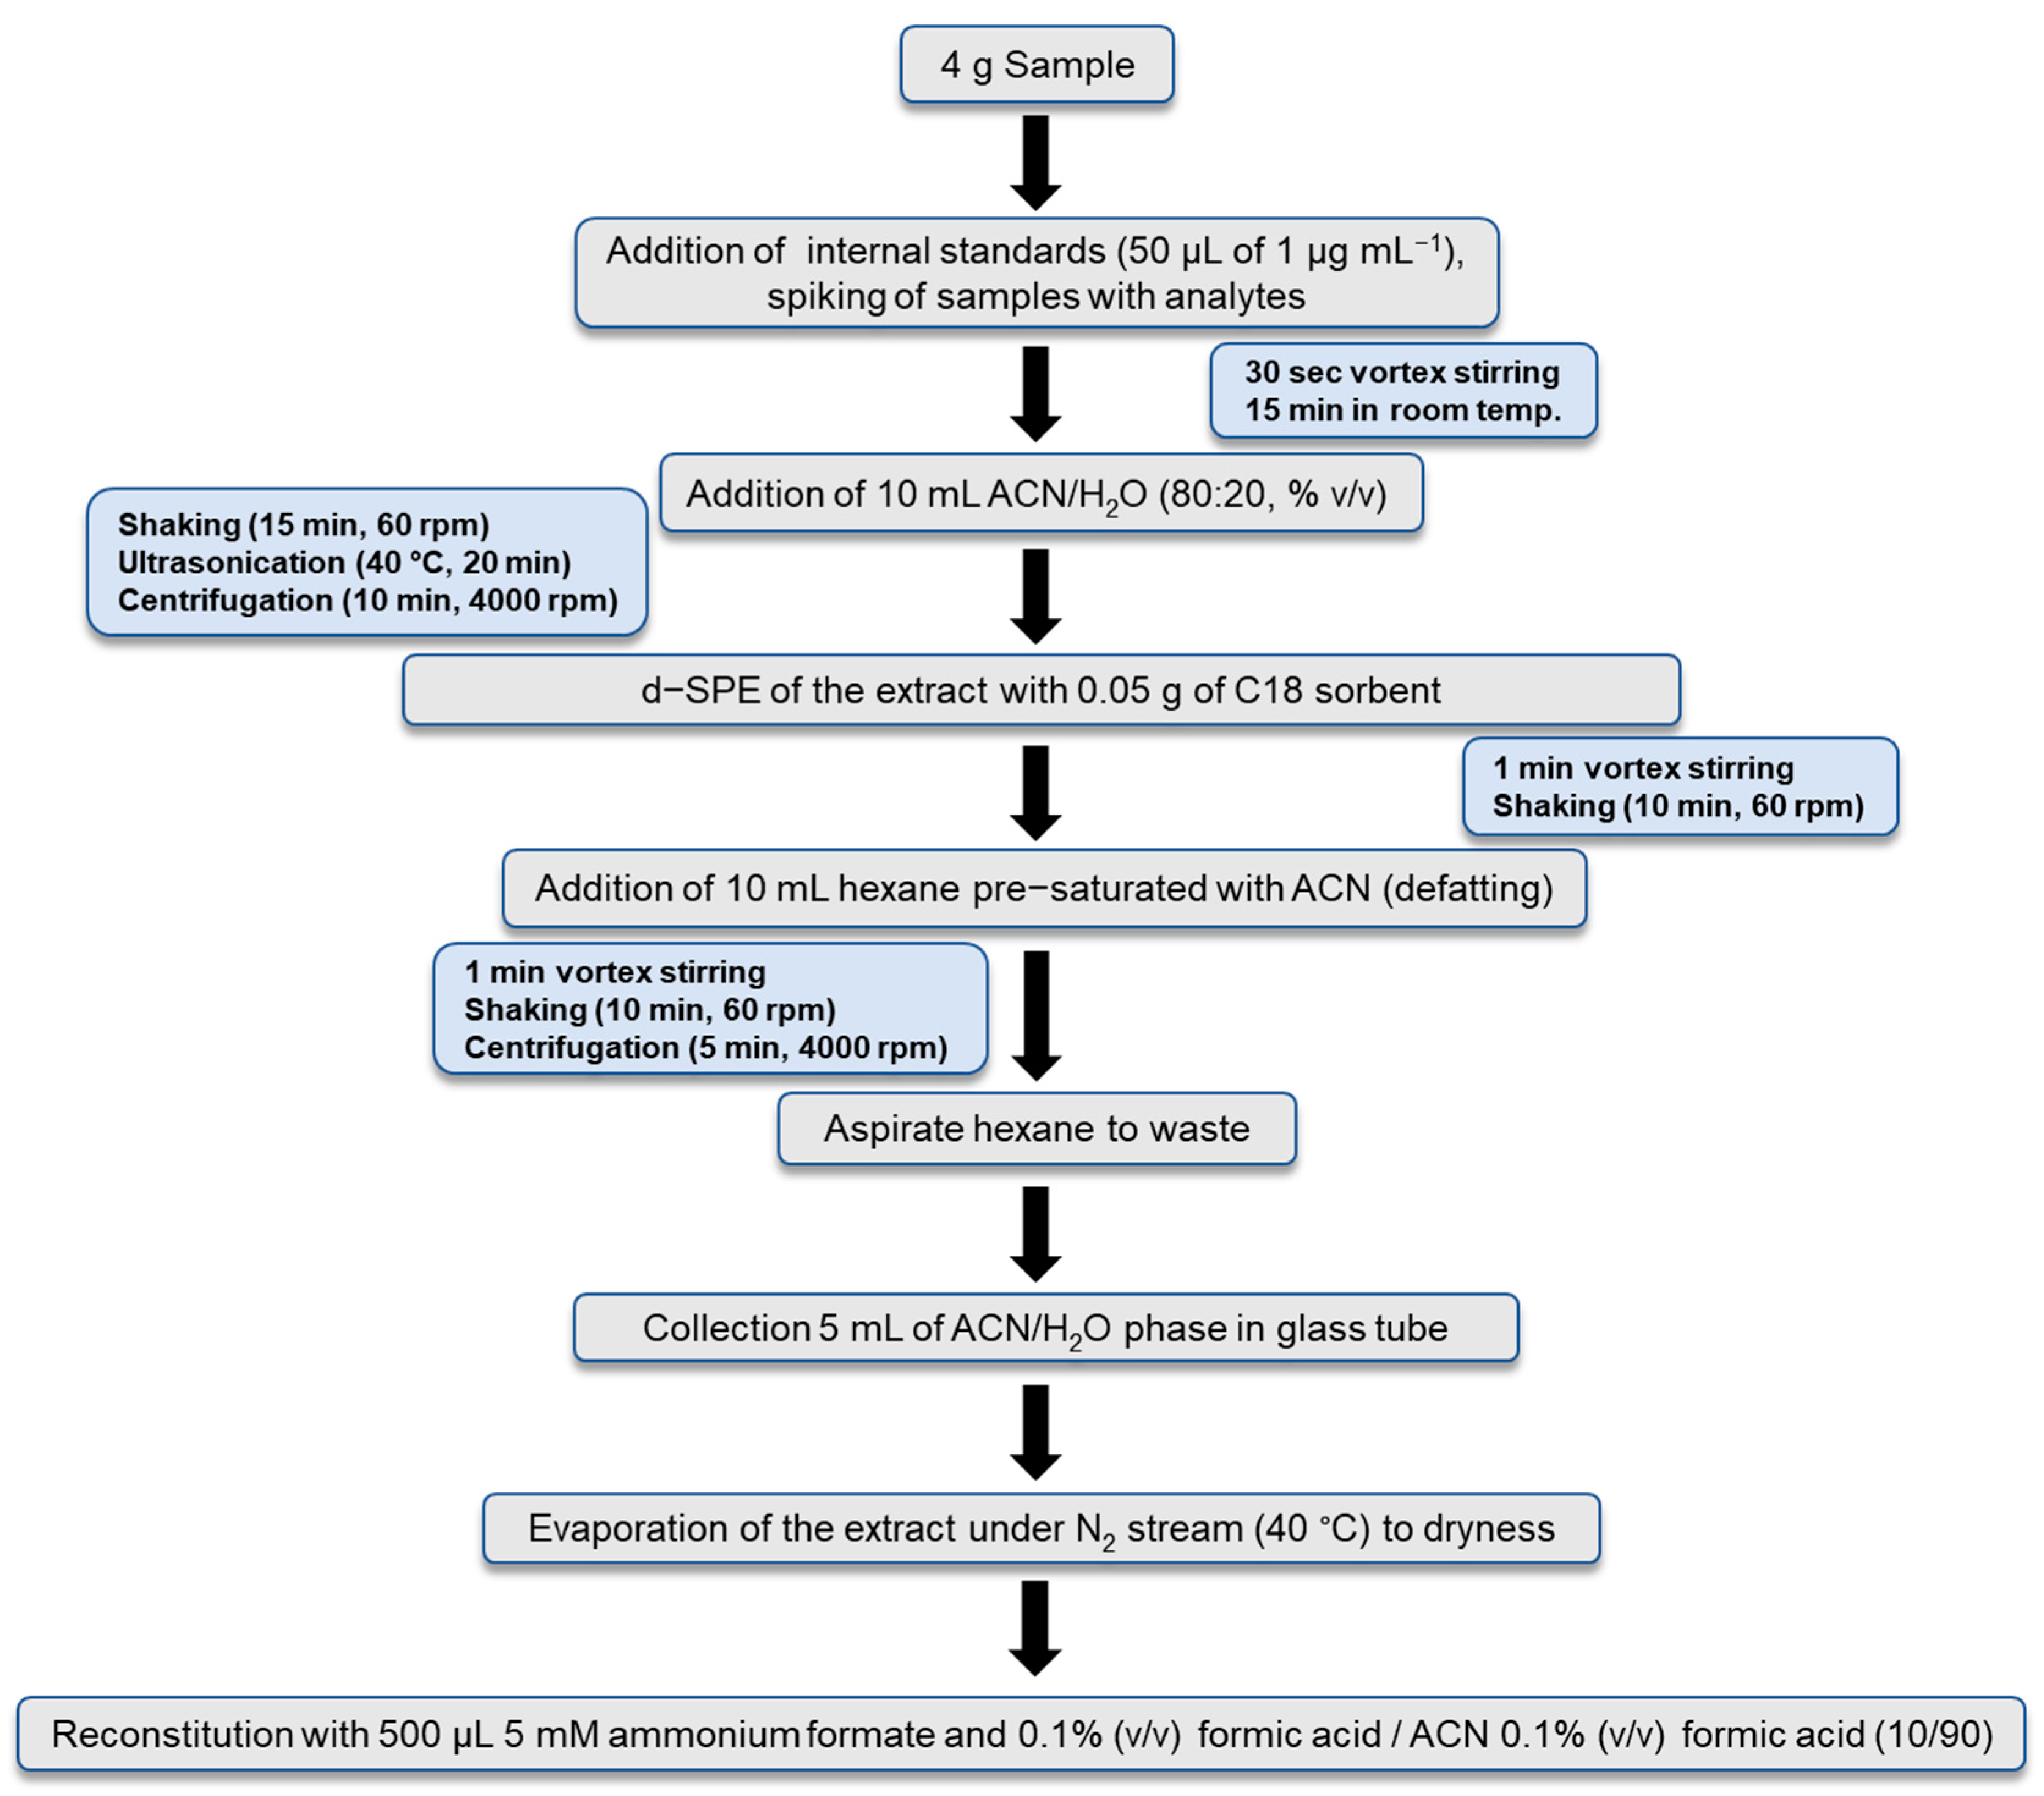
2.3. Sample Preparation Protocol

Preliminary experiments were conducted according to 6 different sample preparation protocols, based on literature references [16,25,26,27,28,29], and evaluated based on the obtained recovery of the targeted compounds and the matrix effect. The studied protocols are described in the Electronic Supplementary Material (SM-2.1 Selection of extraction procedure) and the corresponding recovery and matrix effect results are presented in Tables S6 and S7 of the Supplementary Material.
The final sample preparation protocol is presented in Figure 2, and it was based on the sample preparation procedure reported by Geis-Asteggiantea et al. (2012) for the analysis of more than 100 veterinary drug residues in bovine muscle tissues [25]. In brief, 4 g of the homogenized sample, weighed into a 50 mL polypropylene centrifuge tube, were spiked with 50 μL of 1 μg mL−1 internal standard mix solution, the sample was vortexed for 30 s and subsequently allowed to stand at room temperature for 15 min. To extract the polar analytes, 10 mL of ACN/H2O (80:20, % v/v) were added, followed by a 15 min shaking using an overhead shaker at 60 rpm. Afterwards, ultrasonic-assisted extraction (UAE) was carried out at 40 °C for 20 min. The samples were then subjected to centrifugation (4000 rpm) for 10 min at room temperature. The supernatants were transferred into 50 mL propylene centrifuge tubes containing 0.05 g of C18 sorbent for clean-up. The extracts were vortexed for 1 min and shaken for 10 min at 60 rpm. The C18 sorbent was removed and a defatting step was performed by adding 10 mL of n-hexane pre-saturated with ACN. The mixtures were subjected to centrifugation (5 min, 4000 rpm) and the hexane layer was discarded. 5 mL of the ACN/H2O phase was collected into a 10 mL glass tube and evaporated to dryness under nitrogen stream at 40 °C. Reconstitution took place with 500 μL of a mixture consisting of (A) ACN with 0.1% v/v formic acid and (B) aqueous ammonium formate solution (5 mM) with 0.1% v/v formic acid (90:10, % v/v), and for the filtration before the analysis, a 0.22 μm RC filter was used.

2.4. HILIC-ESI-MS/MS Measurements

2.4.1. HILIC-ESI-MS/MS Optimisation

HILIC-ESI-MS/MS measurements were carried out using a Thermo Scientific TSQ Quantum Access Triple Quadrupole coupled to a Thermo UHPLC Accela system (Thermo, San Jose, CA, USA). The optimisation of the liquid chromatographic and mass spectrometric conditions was based on the strategy plan proposed in previous work [30]. Figure 3 illustrates the discrete steps and loops followed for the optimisation of the electrospray ionisation parameters, the single reaction monitoring transitions and the chromatographic separation.
As a first step in the method development, positive and negative polarity experiments were carried out in order to investigate which polarity better ionises the analytes. Flow injection analysis (FIA) of individual standards of each compound at 5 μg mL−1 in 1 mM ammonium formate with formic acid 0.1%, ACN (20:80, v/v), was performed. It was shown that the analytes were better ionised in positive polarity and the protonated [M+H]+ molecular ions were selected as the precursor ions for all the compounds.
After the selection of the polarity ionisation, the effect of the mobile phase on the ionisation of the analytes was examined. Standard solutions were prepared in eight different solvents to simulate HILIC conditions. Specifically, the organic phase consisted of ACN (80%), and the aqueous phase (20%) consisted of H2O with different mobile phase additives, such as formic acid (1%), acetic acid (1%), ammonium acetate, and ammonium formate at concentrations ranging between 1 and 10 mM, as presented in Table S3. The full scan mass spectra for all the TSs parent compounds were obtained and the abundance of protonated ions was compared across the eight different mobile phases. The highest abundances were obtained with the mobile phase of 5 mM ammonium formate with 0.1% formic acid/ACN with 0.1% formic acid. Different ratios of the aqueous to organic solvent (40/60, 30/70, 10/90) of the selected mobile phase were tested. The ratio 10/90 was the most efficient one.
Following the mobile phase optimisation for the ionisation of the analytes, preliminary experiments were conducted to determine the settings of the Single Reaction Monitoring transitions (SRMs) of the parent ions by direct infusion into the ion source. These SRMs were used as the monitored signal for the testing of nine different analytical columns for the sufficient separation of thyreostats. The sorbent of the columns and their dimensions are described in Table S4 in Supplementary Material. Therefore SRM chromatograms of ten minutes were recorded in triplicate using standard solutions of 300 ng mL−1, prepared in 5 mM aqueous ammonium formate with 0.1% formic acid/ACN with 0.1% formic acid (10/90, v/v), in three different mobile phases: (i) 1 mM aqueous ammonium formate with 0.1% formic acid/ACN with 0.1% formic acid (2/98, v/v), (ii) 1 mM aqueous ammonium formate with 0.1% formic acid/ACN with 0.1% formic acid (10/90, v/v), and (iii) 5 mM aqueous ammonium formate with 0.1% formic acid/ACN with 0.1% formic acid (10/90, v/v). Firstly, equilibration of the HILIC columns was conducted with each mobile phase for one hour at a flow rate of 200 μL min−1, and one hour at a flow rate of 100 μL min−1 [31].
Further optimisation of the mobile phase was conducted as regards the gradient elution program. A mobile phase consisting of acetonitrile with formic acid 0.1% and water with 0.1% formic acid and ammonium formate at 5 mM, and another with ammonium formate at 10 mM, were tested at the same ratio 10/90 v/v under isocratic conditions. In addition, gradient elution was tested with two compositions illustrated in Table S5. The first gradient program started with 5% aqueous phase to elute the analytes in a reasonably short time, while the other one started with 2% aqueous phase. The monitored parameters were the peak areas and the signal-to-noise ratio of the analytes.
In the framework of the chromatographic separation optimisation, additional experiments were conducted in order to investigate in more detail the retention mechanism of TSs on the selected column (BEH Amide HILIC column) according to Section 2.4.2. Having defined the composition of the mobile phase entering the ion source, the parameters of sheath gas pressure, auxiliary gas pressure, spray voltage and capillary temperature of the electrospray (ESI) were optimised with flow injections of the selected mobile phase, and the signals of the protonated ions were monitored in SIM mode. Subsequently, the potential between the ion transfer tube and the mass analyser, namely the tube lens voltage, was optimised. Following maximisation of the protonated ions’ intensities, the SRM transitions were further tuned with the selection of two product ions of each analyte with high intensities and optimisation of the collision pressure of Ar and the collision energy of each transition.

2.4.2. Investigation of Retention Mechanism

HILIC is a complex system that involves partition, polar, and ion-exchange interactions [32] or dual retention mechanisms [33]. Therefore, in order to investigate the retention mechanism of TSs in the BEH Amide HILIC column, the effect of column temperature, acetonitrile content in the mobile phase, and the buffer concentration on the retention of the analytes on the polar amide stationary phase were studied.
Effect of temperature: Column temperature plays an important role on the retention of polar compounds in HILIC, and this effect can be described using the van’t Hoff plot, which represents the function between the capacity factor, expressed as lnk′, and the temperature, expressed as 1/T (K), according to Equation (1), as follows:
l n k = Δ H ° R T + Δ S ° R + l n φ
where ΔH° is the standard enthalpy change during analyte transfer from mobile phase to stationary phase, ΔS° is the respective standard entropy change, R is the gas constant, 8314 J/(K mol), and φ = VS/VM is the phase ratio in the column. By finding the linear equation that describes this function, ΔH° can be calculated from the slope of the curve, and the mechanism of analyte retention from the column can be deduced [23,34]. In this study, column temperatures between 20 and 60 °C were tested, and the van’t Hoff plots were constructed for the six analytes for the BEH Amide column.
Effect of acetonitrile percentage in mobile phase: In HILIC separation, as in reserved-phase separation, water and acetonitrile are the constituents of the mobile phase; however, in HILIC, substantially greater organic content is required to guarantee considerable hydrophilic interaction [34], and the percentage of acetonitrile is likely to have the greatest impact on the retention [35]. In this study, the effect of acetonitrile content on retention was investigated by testing five different percentages: 75, 80, 85, 90 and 95% v/v.
Effect of salt concentration: Ammonium acetate and ammonium formate are usually added in the mobile phase for setting the pH and the ion strength, while their presence can also decrease electrostatic interactions through disruption. In HILIC separation, these buffers could potentially affect the retention mechanism of the analytes [34]. In the present study, different concentrations of ammonium formate, ranging between 1 and 10 mM in the mobile phase of acetonitrile/water (90/10, v/v), were tested to study the effect of salt concentration on the retention of the analytes. Due to solubility limitations, no further salt concentration increase was achievable.

2.4.3. HILIC-ESI-MS/MS Final Conditions

The chromatographic separation was performed on an ACQUITY BEH Amide (100 mm × 2.1 mm, 1.7 μm, Waters, Milford, MA, USA) analytical column with a mobile phase consisting of ACN with 0.1% formic acid (solvent A) and aqueous ammonium formate (5 mM) with 0.1% formic acid (solvent B). The isocratic elution program was set at 90% of solvent A and 10% of solvent B at a constant flow rate of 100 μL min−1, while the injection volume was set at 10 μL. The electrospray ionisation was operated in the positive mode and spray voltage was set at 3500 V. Sheath gas and auxiliary gas settings were 25 psi and 10 arbitrary units, respectively, and capillary temperature was 300 °C. Data were acquired in Selected Reaction Monitoring mode (SRM) with two transitions per analyte and internal standard and a scan time of 20 ms. Table 1 presents the SRMs of the target compounds and the internal standards (ISs) along with the retention times, the tube lens voltage and the collision energy of each transition. For each TS, the SRM transition with the greatest intensity served for the quantification (Q), and the other transition was used for confirmation (C).

2.5. Validation

For the method validation experiments, a control bovine tissue sample was used for the preparation of fortified samples. The same control sample was used for the preparation of matrix-matched calibration standards in order to evaluate the matrix effect during HILIC-MS/MS analysis. Specifically, fortified samples were prepared by adding the proper amount of the working mix solution, containing all the analytes at the appropriate concentration levels in the very beginning of the sample preparation, at the same step, with the addition of the internal standard mix. During validation, blank samples were also extracted and analysed in each batch. On the other hand, the matrix-matched standards were prepared by adding appropriate volumes of mix working solution to blank aliquots at the final reconstitution step.
As prohibited compounds, validation level (VL) was set at 10 ng g−1 for all TSs, while validation was performed in bovine muscle tissue at three concentration levels, namely 0.5 × VL, 1 × VL and 1.5 × VL, corresponding to 5–10–15 ng g−1.
The selectivity of the method for the particular matrix was evaluated by the analysis of 20 control blank samples and investigating the presence of background peaks at the retention time of the analytes.
The linearity of the method was assessed by using a six-point calibration curve of standards in pure solvent at concentration levels between 2.5 and 40 ng ml−1. Standard addition calibration curves were constructed by fortifying blank muscle tissue samples with the target compounds at concentrations ranging between 1 and 400 ng g−1. Linear regression analysis was performed by plotting the peak area ratio of the analytes and ISs versus the analyte concentrations. The regression line y = bx + a, the standard deviation of the intercept Sa, the standard deviation of the slope Sb and the squared correlation coefficients R2 were determined.
Recovery studies were carried out to evaluate the method’s accuracy. At each validation level, three batches of six blank bovine tissue samples (n = 18) were treated with TSs. These samples were tested on three different laboratory days, and recoveries at each concentration were calculated by comparing samples spiked before and after the extraction. It is noted that the recoveries of the analytes were adjusted using ISs. In particular, PTU-d5 was used for PTU, TAP-d3 was used for TAP, and DMTU was used for MTU and TU.
The method’s precision was assessed as intra-day precision (repeatability) and inter-day precision (within-laboratory reproducibility), expressed as relative standard deviation (%RSD). The repeatability of the samples was evaluated using six spiked samples per validation level (n = 6) on the same day and under the same conditions, whereas the reproducibility was assessed by evaluating six spiked samples per validation level (n = 6) on three consecutive days.
The method’s limits of detection (LODs) and quantification (LOQs) for the different analytes were defined as the concentration of the analyte in bovine tissue samples that was equal to three times the average noise level (S/N = 3), and equal to ten times the average noise level (S/N = 10), respectively.
Finally, the decision limit for confirmation (CCα) and the detection capability for screening (CCβ) were calculated for all the analytes. For illegal compounds, CCα refers to the lowest concentration level at which the presence of the analyte can be determined with statistical certainty (1 − α). For unauthorised or prohibited pharmacologically active substances, the α error should be 1% or lower. In the present study, the calibration curve approach was followed and CCα was calculated as the concentration at the y-intercept plus 2.33 times the standard deviation of the reproducibility at the lowest validated concentration level.
Regarding the CCβ, in the case of prohibited or unauthorised pharmacologically active substances, this is the lowest concentration at which a method is able to detect or quantify, with a statistical certainty of 1 − β, samples containing residues of these substances. For unauthorized or prohibited pharmacologically active substances, a maximum β error of 5% should be ensured. CCβ was also determined according to the calibration curve procedure and it was calculated as the decision limit plus 1.64 times the standard deviation of the reproducibility at the corresponding concentrations.
Analyses of such complex matrices, like animal muscle tissue, are usually susceptible to matrix effects (MEs) affecting the ionisation of the target compounds and suppressing or enhancing their signal. The evaluation of the matrix effect was performed by comparison of the slopes of the matrix-matched calibration curves with the slopes of the solvent standards curves. Matrix Effects (MEs%) were calculated according to Equation (2) as follows:
MEs (%) = ((B/C) − 1) × 100
where B stands for the slope of the calibration curve in matrix extracts, and C stands for the slope of the calibration curve in pure solvent.
When this value is positive, a signal enhancement is observed, while when negative, signal suppression occurred. A signal enhancement or suppression effect is considered acceptable if the matrix effect values range from −20% to +20%.

2.6. Application of the Method to Real Samples

A total of 48 bovine muscle tissue samples were analysed according to the new developed HILIC-ESI-MS/MS method. The criteria for the identification of the targeted analytes were as follows: (1) the ratio of the relative retention time of the analyte to that of the same analyte in standard solution should be within ± 2.5% tolerance, (2) chromatographic peaks should be present in both SRMs of the analyte, and (3) the peak area ratio of the two SRMs (Q/C) of the analyte to be confirmed in the sample should correspond to those of the fortified blank samples at comparable concentrations, measured under the same conditions, within ±40% relative deviation [9,10].

3. Results and Discussion

3.1. HILIC-ESI-MS/MS Method Development

3.1.1. Comparison of Ionisation Polarities with Different Mobile Phases

Electrospray positive ionisation generated higher abundances of the target analyte precursors, identified as the monoprotonated ions [M+H]+, than the parent ions generated in the negative ionisation mode. Therefore, positive ionisation was selected. Among the tested analytes, thiouracil gave the lower relative sensitivity, therefore, further optimisation of the ionisation efficiency of thiouracil was held by direct infusion of TU standard prepared in various solvents, and the obtained results are illustrated in Figure S1 in Supplementary Material. The optimum mobile phase was 5 mM ammonium formate with 0.1% formic acid/ACN with 0.1% formic acid.

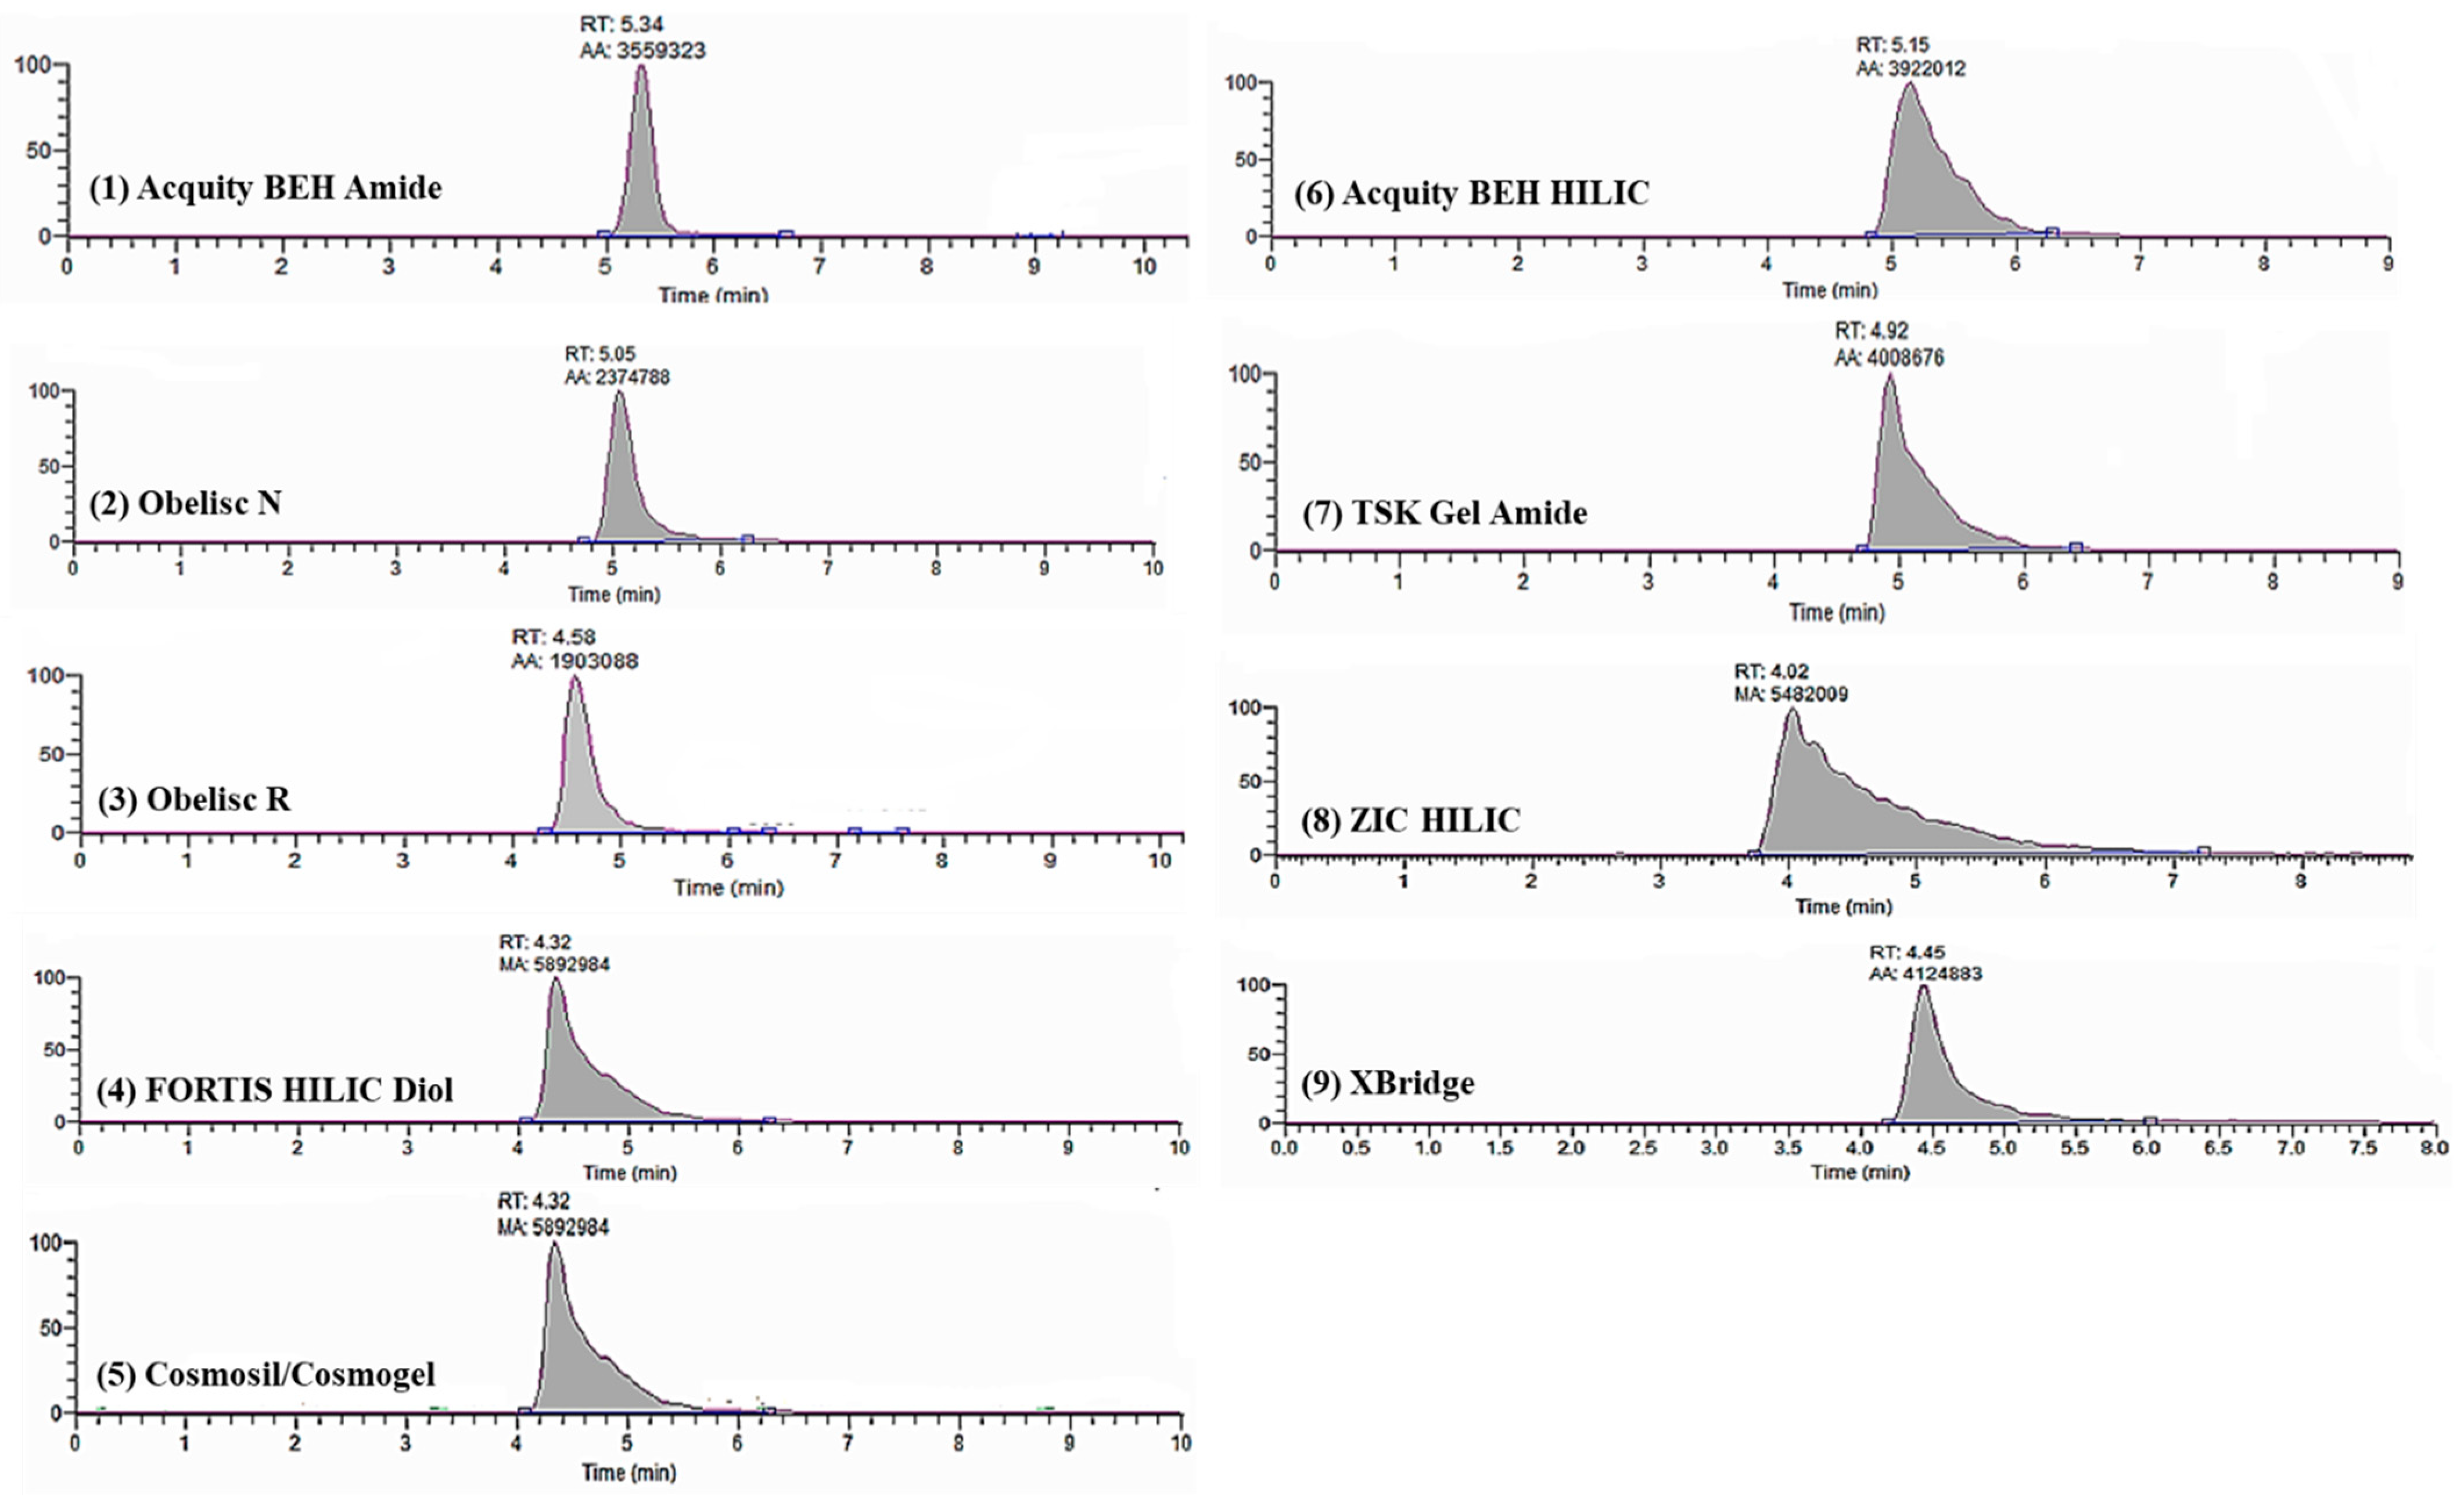
3.1.2. Hydrophilic Interaction Liquid Chromatography

TSs chromatographic behaviour in different stationary phases was evaluated in terms of retention time, peak shape and peak area of the quantification SRMs. Figure 4 illustrates indicative SRM chromatograms of MBI (151 > 93.3) generated by the nine different HILIC analytical columns with mobile phase of 1 mM ammonium formate/0.1% formic acid (2/98, v/v). In addition, the peak areas of the six thyreostats obtained from the nine analytical columns with the three different mobile phases are presented in Figure S2. Based on the data acquired for all the studied HILIC columns, the BEH Amide column presented the best chromatographic behaviour for most analytes in terms of peak shape. It is worth noticing that TSs presented the worst response in the ZIC HILIC column, as great “tailing” was observed in most of the chromatographic peaks.
No significant difference was observed between the isocratic and the gradient tested conditions concerning the recorded retention times. Due to the large re-equilibration time required in HILIC-based methodologies, isocratic elution was selected using a final mobile phase of 5 mM ammonium formate with 0.1% formic acid/ACN with 0.1% formic acid. All analytes were separated and eluted from 4.5 min (PhTU) to 5.6 min (TU) at the final conditions (chromatograms are presented in Figure S3).

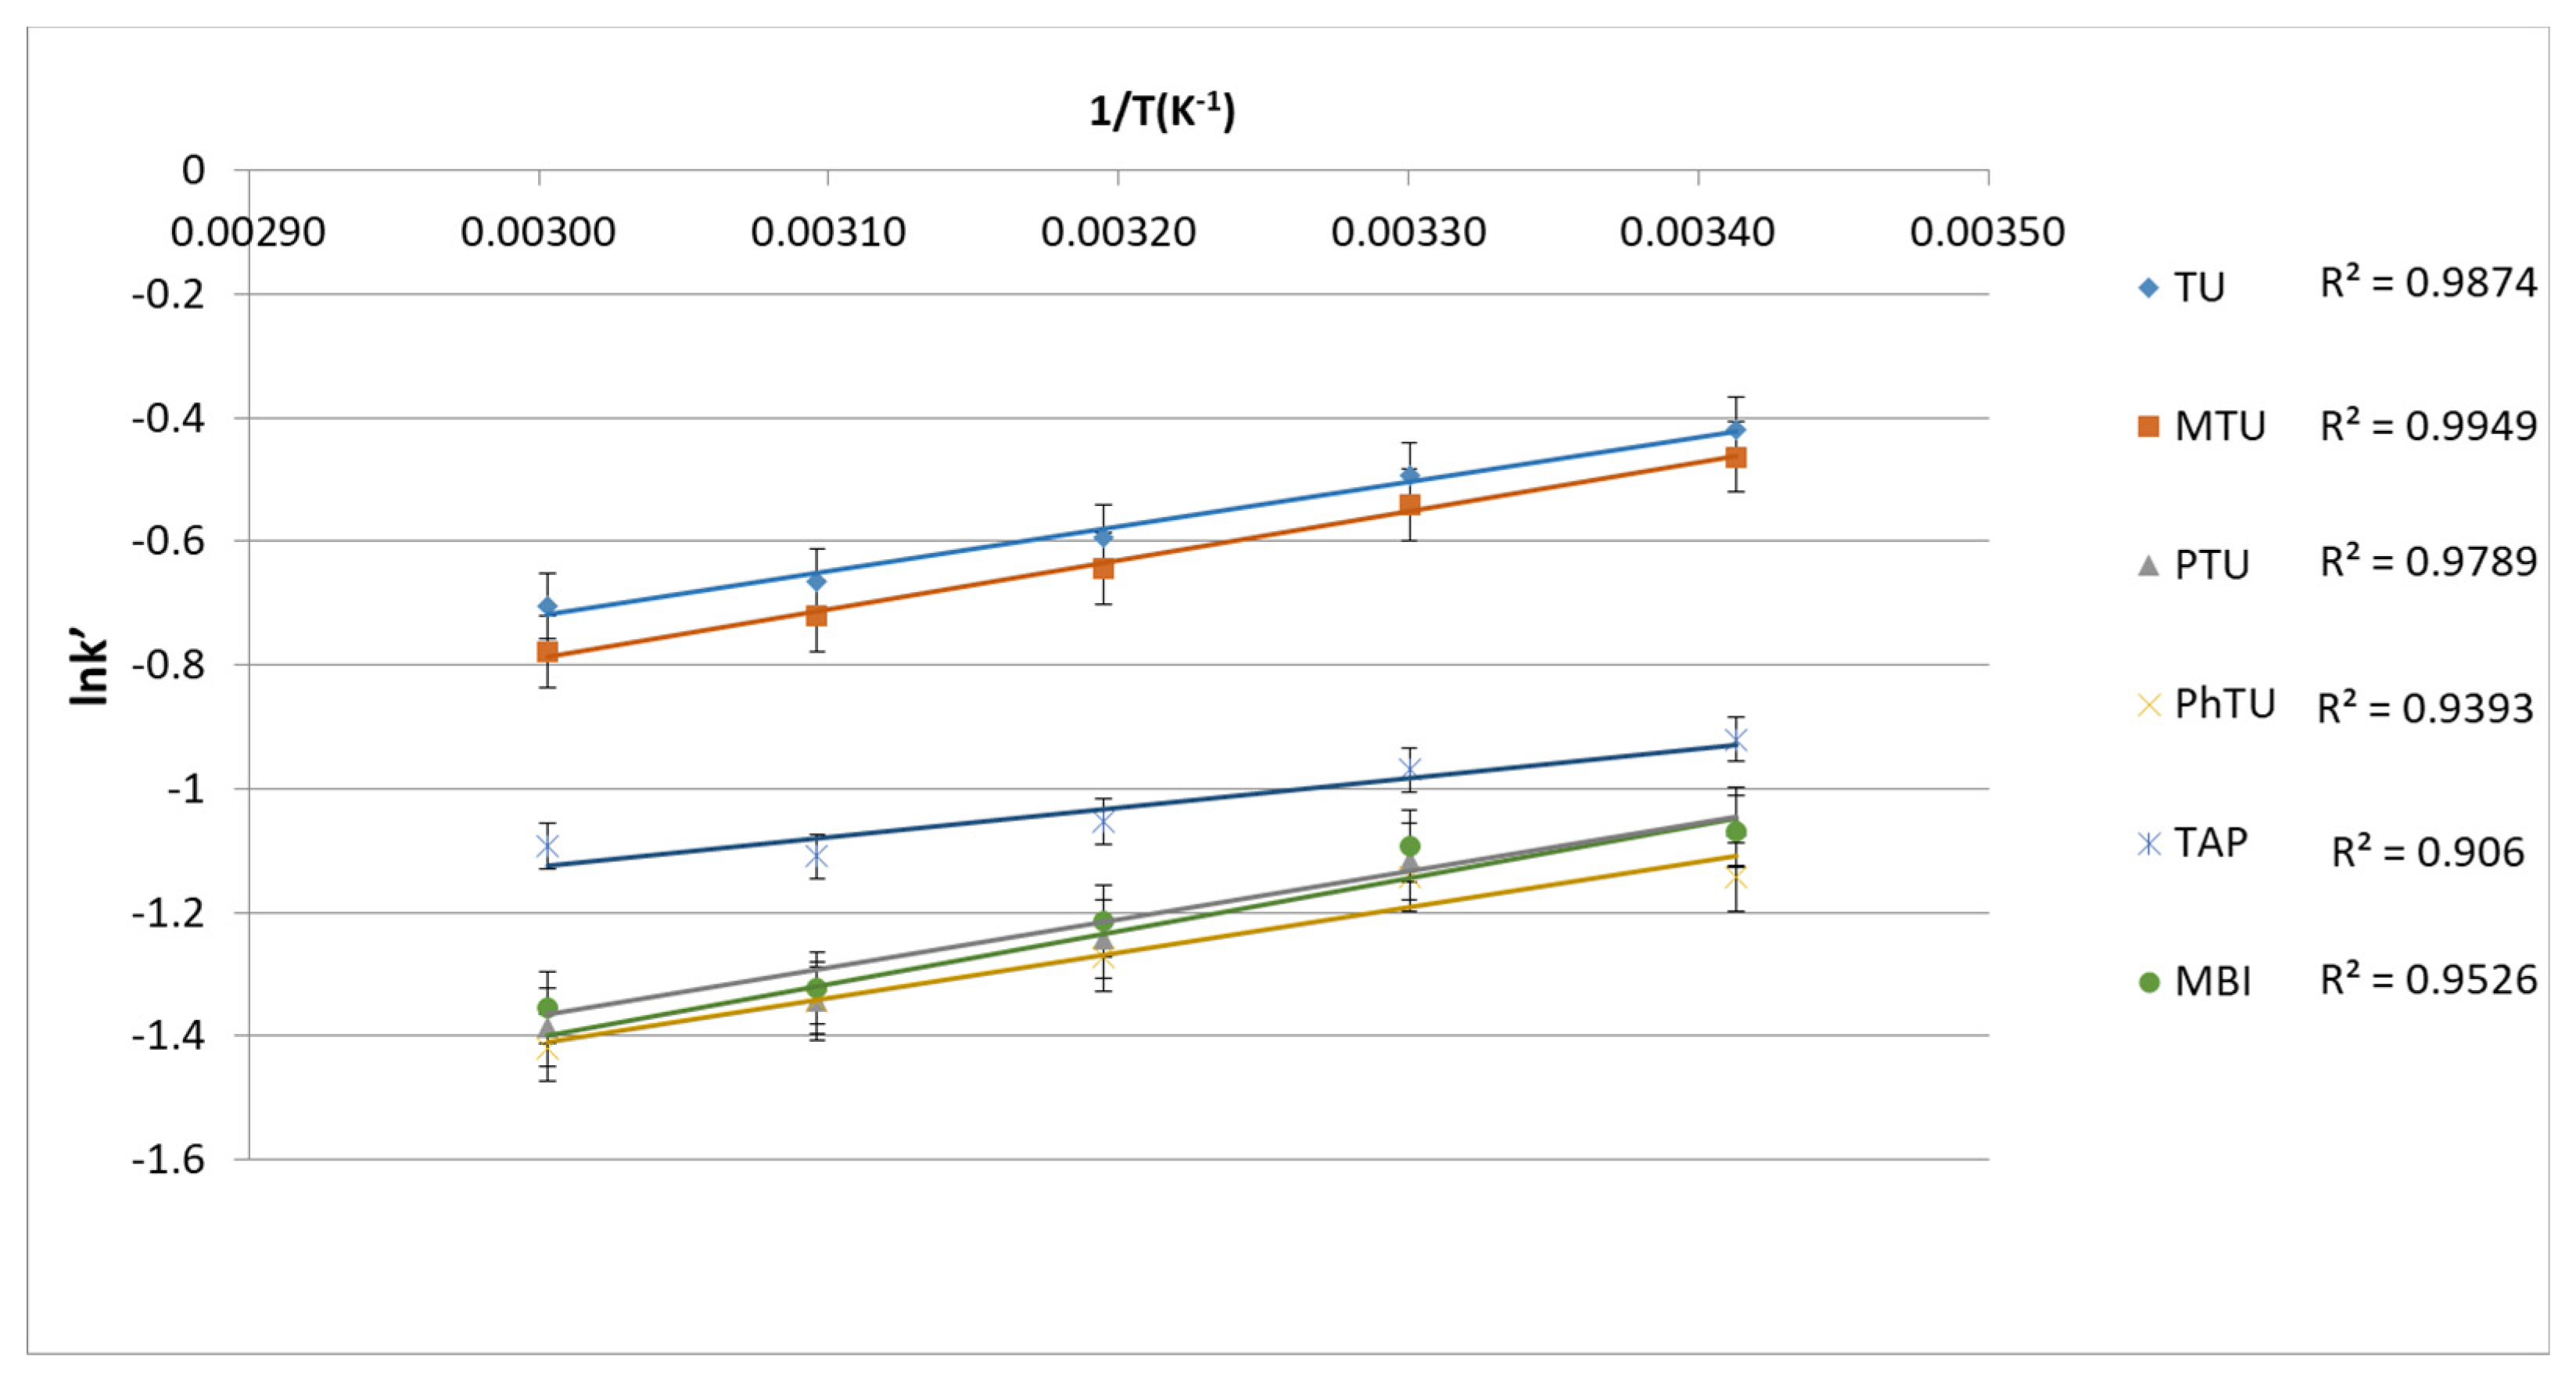
3.1.3. Retention Mechanism of TSs in BEH Amide

Effect of temperature: Figure 5 illustrates the van’t Hoff plots for the six analytes on the BEH Amide column. According to the data retrieved, while temperature is increasing, almost all the studied compounds behave similarly, and specifically, their retention is decreasing. Furthermore, a linear relationship between 1/T and lnk′ was observed for most of the compounds, reaching an R2 of up to 0.9949 (MTU). TAP presented the worst linearity (R2 = 0.906), indicating an unclear relationship between the two studied parameters. Furthermore, based on the slope of the van’t Hoff plots, the retention enthalpy values were calculated for six compounds on the BEH Amide column. As presented in Table S8, it was demonstrated that negative retention enthalpy was recorded for all TSs, with PTU presenting the largest negative value. A negative enthalpy change means that hydrophilic partition is the dominant mechanism, since the analyte transfer from the mobile phase to the water-enriched layer is an exothermic procedure and is favoured at low temperatures [23].
Effect of acetonitrile/water content: To evaluate the impact of acetonitrile content on the retention of thyreostats in the amide stationary phase, the logarithmic capacity factors of all six compounds were plotted against the percentage of acetonitrile content in the mobile phase, as shown in Figure 6. It can be observed that MBI, PTU and PhTU have a clear similarity on their behaviour when acetonitrile content is increasing, which could be attributed to partitioning [36]. Respectively, TU and MTU present a coincident trend, which was expected due to the high similarity of their structure. TAP displays an unusual relationship, implying a change in retention mechanism or multiple forces, contributing to retention.
Effect of salt concentration: The retention times of the targeted thyreostats were not affected significantly when the buffer concentration was increased from 1 mM to 10 mM, an indication that partitioning is the main retention mechanism of TSs on the BEH Amide column [24]. Thus, taking into consideration that the concentration of 5 mM gave the highest peak areas for all the analytes (Figure S4), this was the final selection for the buffer concentration, which was in agreement with the experiments conducted during the optimisation of the ionisation of the parent compounds.

3.2. Method Validation

The linear regression lines of the standard calibration curves and of the standard addition curves are presented in Table S9 and Table S10. The R2 were > 0.99 for all analytes and ranged from 0.989 (PhTU) to 0.9996 (TU) for standard calibration curves, and between 0.995 (MTU) and 0.9994 (TU) for matrix curves. It is noted that the estimated matrix effect ranged from −6.3% for methimazole to +16.1% for thiouracil, indicating that the standard addition calibration, along with the use of internal standards, is essential for the accurate measurement of thyreostats in muscle samples.
Table 2 summarises the average recoveries and the corresponding %RSDs of each analyte at the three validation levels performed under repeatability terms. It can be observed that recovery values range between 76.6% and 102%, and the %RSDs range between 5.5% and 14%. Accordingly, the reproducibility results are presented in Table S11, where it is shown that the %RSDs reach up to 19%. It can be observed that the relative standard deviations were below 20% for all thyreostats. Moreover, the obtained %RSD values of the within-laboratory reproducibility were in compliance with the performance criteria for precision of EU Regulation 2021/808, which describes that the acceptable coefficient of variation for a mass fraction of <10 μg/kg is 30%, and for a mass fraction of 10–120 μg/kg is 25%.
Table 3 presents the method limit of detection (LOD) and quantification (LOQ), and the CCα and CCβ values for the thyreostats, expressed as ng g−1. Decision limits ranged from 3.7 ng g−1 (TU) to 9.7 ng g−1 (MBI), and detection capability ranged from 4.8 ng g−1 to 11 ng g−1. It is noted that these values are below the reference value of 10 ng g−1, except for the CCβ value of 2-mercaptobenzimidazole, rendering the new HILIC method a potential alternative for monitoring and enforcement use in the future. The present HILIC-MS/MS method is comparable with existing LC methods applied for the determination of these thyreostats in meat, in terms of analytical parameters. In particular, the sensitivity of the present method, expressed as LOQ ranges between 7.1 and 9.6 ng g−1, and the corresponding LOQ values for a reversed-phase LC-MS/MS method applied in meat of bison, deer, elk and rabbit ranged between 1.7 and 4.3 ng g−1 for the determination of only three thyreostats (PTU, PhTU, MBI) [20]. Accordingly, the LOQs of a HILIC-UV method ranged between 1.7 and 7.4 ng g−1 for the determination of only three thyreostats (TU, MTU, PTU) in pork liver [18]. In addition, the latter method exhibits low degree of identification of the analytes because of the UV detector. Other reversed-phase LC-MS/MS methods applied in muscle have CCa values ranging between 1.6 and 6.1 ng g−1 [19] and between 1.5 and 3.8 ng g−1 [29], which are slightly lower than the CCa values of the present HILIC-MS/MS method, which are between 3.7 and 9.7 ng g−1. Instrumental LODs and LOQs are presented in Table S12. LODs range between 1.5 ng mL−1 (2-thiouracil) and 3.3 ng mL−1 (6-methyl-2-thiouracil), and LOQs range between 4.6 ng mL−1 (2-thiouracil) and 9.9 (6-methyl-2-thiouracil).

3.3. Application to Real Samples

None of the tested samples of bovine muscle met the identification criteria, therefore, no positive findings were recorded. Taking into consideration that the method’s LODs range between 2.8 ng g−1 (6-phenyl-2-thiouracil) and 4.1 ng g−1 (2-Thiouracil), it can be concluded that the tested thyreostats are below these concentrations. These findings are in agreement with the literature, according to which no recent positive results in bovine muscle have been reported.

4. Conclusions

A comprehensive, sensitive, and efficient HILIC-MS/MS methodology was developed for the quantitative confirmatory analysis of thyreostatic residues in animal muscle tissues. The proposed analytical method allows the simultaneous determination of six TSs, for which analyses using multi-residue methods are often challenging. The major challenges in thyreostats determination involve their low molecular weight, their polarity, and the existence of tautomer forms. In combination with the significant low concentration levels, the complexity of the matrix renders their ionization, simultaneous chromatographic detection, and matrix extraction quite challenging. HILIC was chosen for thyreostats determination as it appears to be the most appealing analytical tool for the determination of polar compounds as thyreostats. The use of HILIC led to a significant increase in method’s sensitivity and reduction of the analysis time. The developed method was thoroughly optimized and validated, and thus indicating its value in veterinary drug and pharmaceutical analysis field. Bovine muscle tissue was chosen for the validation process as a matrix due to the significant administration of thyreostats are in cattle. The method yielded LODs between 2.8 ng g−1 (6-phenyl-2-thiouracil) and 4.1 ng g−1 (2-thiouracil), providing a reliable, robust, and simple-to-use method. The application of the standard addition method and the use of internal standards for the quantification of the samples gave exceptionally reliable quantitative results. The developed methodology was used for the analysis of real samples and was proven extremely useful for high-throughput routine analysis. The results obtained from this study were the first data obtained for thyreostats analysis exploiting the potential of HILIC-MS/MS without any time-consuming derivatization process of the analytes. The proposed method meets the requirements of the European guidelines and can be applied in routine analysis for the screening of polar veterinary drugs as thyreostats in food of animal origin. The application field of the proposed method could be extended to other veterinary drugs of similar chemical structure and to metabolites of these drugs that could be used as indicators of their potential administration.

Supplementary Materials

The following supporting information can be downloaded at: https://www.mdpi.com/article/10.3390/separations11090269/s1, Table S1: Quantitative applications in multi-residue analysis of Thyreostats (TS) in different matrices; Table S2: Detailed information about the studied TS; Table S3: Tested mobile phases for the investigation of TS ionization in a ratio of 20:80 v/v; Table S4: Functional characteristics of studied HILIC columns; Table S5: Tested gradient programs; Table S6: Calculated recoveries and matrix effect for the tested sample preparation procedures; Table S7: Recoveries and matrix effect for TS, calculated for the three pre-concentration levels; Table S8: Calculated parameters of Van’t Hoff equation; Table S9: Regression lines for standard solutions of examined TS; Table S10: Regression lines for examined TS in spiked muscle tissues; Table S11: Method reproducibility expressed as %RSD (n = 6); Table S12: Instrumental LOD and LOQ values of the target thyreostats; Figure S1: Recoveries (%) of the analytes for the different extraction methods tested; Figure S2: Matrix effect (%) of the analytes for the different extraction methods tested; Figure S3: Ionization efficiency of TU precursor ion in various mobile phases with ratio 20:80 v/v, in positive ionization mode; Figure S4: Peak areas distribution between 9 different HILIC columns for the targeted TS in the same mobile phase. Retention behaviour of TS in the nine different stationary phases. MBI was selected to be shown for the comparison of the columns; Figure S5: (A) SRM Chromatograms of MBI, PhTU and DMTU (IS), (B) SRMChromatograms of MTU, PTU, PTU-d5 (IS), (C) SRM Chromatograms of TU, TAP, TAP-d3 (IS) in the final chromatographic conditions in the selected BEH Amide HILIC columns; Figure S6: Effect of salt concentration in the mobile phase for the studied TS.

Author Contributions

A.S.K.: Conceptualization, Investigation, Formal analysis, Data curation, Visualization, Validation, Writing—original draft. M.E.D.: Conceptualization, Investigation, Validation, Writing—Review and editing. N.C.M.: Methodology, Validation, Visualization, Writing—Review and editing. M.G.K.: Validation. N.S.T.: Conceptualization, Methodology, Supervision, Project administration, Resources, Funding acquisition, Writing—Review and editing. All authors have read and agreed to the published version of the manuscript.

Funding

This research received no external funding.

Data Availability Statement

The authors state that all the data related to the findings of this study are available in the article. Additional data can be provided on request.

Conflicts of Interest

The authors declare no conflicts of interest.

References

  1. Clemente-Suárez, V.J.; Beltrán-Velasco, A.I.; Redondo-Flórez, L.; Martín-Rodríguez, A.; Tornero-Aguilera, J.F. Global Impacts of Western Diet and Its Effects on Metabolism and Health: A Narrative Review. Nutrients 2023, 15, 2749. [Google Scholar] [CrossRef] [PubMed]
  2. Schmidt, K.S. In-house validation and factorial effect analysis of a liquid chromatography–tandem mass spectrometry method for the determination of thyreostats in bovine blood plasma. Anal. Bioanal. Chem. 2014, 406, 735–743. [Google Scholar] [CrossRef] [PubMed]
  3. Kusmierek, K.; Bald, E. Determination of methimazole in urine by liquid chromatography. Talanta 2007, 71, 2121–2125. [Google Scholar] [CrossRef]
  4. Vanden Bussche, J.; Vanhaecke, L.; Deceuninck, Y.; Verheyden, K.; Wille, K.; Bekaert, K.; Le Bizec, B.; De Brabander, H.F. Development and validation of an ultra-high performance liquid chromatography tandem mass spectrometry method for quantifying thyreostats in urine without derivatisation. J. Chromatogr. A 2010, 1217, 4285–4293. [Google Scholar] [CrossRef]
  5. Blokland, M.H.; van Tricht, F.E.; Groot, M.J.; Van Ginkel, L.A.; Sterk, S.S. Discrimination between the exogenous and endogenous origin of thiouracil in farm animals, the final chapter? Food Addit. Contam. Part A 2021, 38, 2077–2090. [Google Scholar] [CrossRef]
  6. World Health Organization International Agency for Research on Cancer. IARC Monographs on the Evaluation of Carcinogenic Risks to Humans—Some Thyrotropic Agents; IARC Press: Lyon, France, 2001; Volume 79. [Google Scholar]
  7. Council Directive 81/602/EEC of 31 July 1981 concerning the prohibition of certain substances having a hormonal action and of any substances having a thyrostatic action. Off. J. EC 1981, L222, 32–33.
  8. European Union Reference Laboratories. Eurl Guidance on Minimum Method Performance Requirements (Mmprs) for Specific Pharmacologically Active Substances in Specific Animal Matrices, Version 2.0 June 2022. Available online: https://eurl-residues.eu/wp-content/uploads/2020/12/EURL_MMPR_guidance-paper_final.pdf (accessed on 12 May 2024).
  9. Commission Implementing Regulation (EU). 2021/808 of 22 March 2021 on the performance of analytical methods for residues of pharmacologically active substances used in food-producing animals and on the interpretation of results as well as on the methods to be used for sampling and repealing Decisions 2002/657/EC and 98/179/EC. Off. J. EC 2021, L180, 84–109. [Google Scholar]
  10. COMMISSION DECISION 2002/657/EC of 12 August 2002 implementing Council Directive 96/23/EC concerning the performance of analytical methods and the interpretation of results. Off. J. EC 2002, L221, 8–36.
  11. Církva, A.; Šťastný, K. Method for the determination of thyreostats in milk samples using LC-MS/MS. Food Addit. Contam. Part A 2013, 30, 983–986. [Google Scholar] [CrossRef] [PubMed]
  12. Bertuzzi, T.; Rastelli, S.; Mulazzi, A.; Pietri, A. Trace Monitoring of Goitrin and Thiouracil in Milk and Cheese. Food Anal. Methods 2016, 9, 2952–2959. [Google Scholar] [CrossRef]
  13. Ji, Z.; Yu, Y.; Jin, Q.; Li, G.; Hu, N.; Zhou, W.; Suo, Y.; Sun, Z.; You, J. Determination of naturally occurring thyreostats in bovine milk by high performance liquid chromatography combined with fluorescence detection. Microchem. J. 2019, 145, 892–898. [Google Scholar] [CrossRef]
  14. Gentili, A.; De Pratti, V.; Caretti, F.; Pérez-Fernández, V.; Tomai, P.; Curini, R.; Mainero Rocca, L. Residue analysis of thyreostats in baby foods via matrix solid phase dispersion and liquid chromatography—Dual-polarity electrospray—Tandem mass spectrometry. Food Addit. Contam. Part A 2016, 33, 1793–1802. [Google Scholar] [CrossRef] [PubMed]
  15. Kiebooms, J.A.L.; Wauters, J.; Vanden Bussche, J.; Vanhaecke, L. Validation of a quantitative method using liquid chromatography coupled to multiple mass spectrometry for thiouracil in feedstuffs used in animal husbandry. Anal. Bioanal. Chem. 2015, 407, 4373–4384. [Google Scholar] [CrossRef] [PubMed]
  16. Wozniak, B.; Zuchowska, I.M.; Zmudzki, J.; Jedziniak, P.; Korycinska, B.; Sielska, K.; Witek, S.; Klopot, A. Liquid chromatography tandem mass spectrometry with ion trap and triple quadrupole analyzers for determination of thyreostatic drugs in urine and muscle tissue. Anal. Chim. Acta. 2011, 700, 155–166. [Google Scholar] [CrossRef] [PubMed]
  17. Purves, R.W.; Souster, K.; West, M.; Huda, A.M.; Fisher, C.M.E.; Belford, M.W.; Shurmer, B.O. Improved Thyreostatic Drug Detection in Animal Tissues Using Liquid Chromatography–High-Field Asymmetric Waveform Ion Mobility Spectrometry–Mass Spectrometry. J. Agric. Food Chem. 2022, 70, 4785–4791. [Google Scholar] [CrossRef] [PubMed]
  18. Wang, T. Polyethyleneimine-modified hybrid silica sorbent for hydrophilic solid-phase extraction of thyreostats in animal tissues. J. Chromatogr. A 2018, 1581–1582, 16–24. [Google Scholar] [CrossRef]
  19. Rocchi, S.; Caretti, F.; Mainero Rocca, L.; Pérez-Fernández, V.; Tomai, P.; Dal Bosco, C.; Curini, R.; Gentili, A. Subcritical water extraction of thyreostats from bovine muscle followed by liquid chromatography-tandem mass spectrometry. Food Addit. Contam. Part A 2018, 35, 1472–1483. [Google Scholar] [CrossRef]
  20. Casey, C.R.; Andersen, W.C.; Williams, N.T.; Nickel, T.J.; Ayres, P.R. Multiclass, Multiresidue Method for the Quantification and Confirmation of 112 Veterinary Drugs in Game Meat (Bison, Deer, Elk, and Rabbit) by Rapid Polarity Switching Liquid Chromatography-Tandem Mass Spectrometry. J. Agric. Food Chem. 2021, 69, 1175–1186. [Google Scholar] [CrossRef]
  21. Nuñez, A.; Lehotay, S.J.; Lightfield, A.R. Structural characterization of product ions of regulated veterinary drugs by electrospray ionization and quadrupole time-of-flight mass spectrometry. Part 3, Anthelmintics and thyreostats. Rapid Commun. Mass Spectrom. 2016, 30, 813–822. [Google Scholar] [CrossRef]
  22. Guarducci, M.A.; Fochetti, A.; Ciogli, A.; Mazzoccanti, G.A. Compendium of the Principal Stationary Phases Used in Hydrophilic Interaction Chromatography: Where Have We Arrived? Separations 2023, 10, 22. [Google Scholar] [CrossRef]
  23. Logotheti, M.; Theochari, K.; Kostakis, M.; Pasias, I.N.; Thomaidis, N.S. Development and validation of a HILIC-UV method for the determination of nucleotides in fish samples. Food Chem. 2018, 248, 70–77. [Google Scholar] [CrossRef] [PubMed]
  24. Kokotou, M.G.; Thomaidis, N.S. Characterization of the Retention of Artificial Sweeteners by Hydrophilic Interaction Liquid Chromatography. Anal. Lett. 2018, 51, 49–72. [Google Scholar] [CrossRef]
  25. Geis-Asteggiante, L.; Lehotay, S.J.; Lightfield, A.R.; Dutko, T.; Ng, C.; Bluhm, L. Ruggedness testing and validation of a practical analytical method for >100 veterinary drug residues in bovine muscle by ultrahigh performance liquid chromatography–tandem mass spectrometry. J. Chromatogr. A 2012, 1258, 43–54. [Google Scholar] [CrossRef] [PubMed]
  26. Dasenaki, M.E.; Thomaidis, N.S. Multi-residue methodology for the determination of 16 coccidiostats in animal tissues and eggs by hydrophilic interaction liquid chromatography – Tandem mass spectrometry. Food Chem. 2019, 275, 668–680. [Google Scholar] [CrossRef]
  27. Dasenaki, M.E.; Thomaidis, N.S. Multi-residue determination of 115 veterinary drugs and pharmaceutical residues in milk powder, butter, fish tissue and eggs using liquid chromatography–tandem mass spectrometry. Anal. Chim. Acta. 2015, 880, 103–121. [Google Scholar] [CrossRef]
  28. Dasenaki, M.E.; Michali, C.S.; Thomaidis, N.S. Analysis of 76 veterinary pharmaceuticals from 13 classes including aminoglycosides in bovine muscle by hydrophilic interaction liquid chromatography–tandem mass spectrometry. J. Chromatogr. A 2016, 1452, 67–80. [Google Scholar] [CrossRef]
  29. Lega, F.; Contiero, L.; Biancotto, G.; Angeletti, R. Determination of thyreostats in muscle and thyroid tissues by QuEChERS extraction and ultra-performance liquid chromatography tandem mass spectrometry. Food Addit. Contam. Part A 2013, 30, 949–957. [Google Scholar] [CrossRef] [PubMed]
  30. Maragou, N.C.; Thomaidis, N.S.; Koupparis, M.A. Optimization and comparison of ESI and APCI LC-MS/MS methods: A case study of Irgarol 1051, Diuron, and their degradation products in environmental samples. J. Am. Soc. Mass Spectrom. 2011, 22, 1826–1838. [Google Scholar] [CrossRef]
  31. McCalley, D.V. A study of column equilibration time in hydrophilic interaction chromatography. J. Chromatogr. A 2018, 1554, 61–70. [Google Scholar] [CrossRef]
  32. Shamshir, A.; Dinh, N.P.; Jonsson, T.; Sparrman, T.; Irgum, K. Probing the retention mechanism of small hydrophilic molecules in hydrophilic interaction chromatography using saturation transfer difference nuclear magnetic resonance spectroscopy. J. Chromatogr. A 2020, 1623, 461130. [Google Scholar] [CrossRef]
  33. Wang, F.; Yang, F.; Liu, J.; Bai, Q. Studies on the retention mechanism of solutes in hydrophilic interaction chromatography using stoichiometric displacement theory II. HILIC/RPLC dual-retention mechanism of solutes in hydrophilic interaction chromatography over the entire range of water concentration in mobile phase. Talanta 2023, 256, 124858. [Google Scholar] [CrossRef]
  34. Guo, Y.; Gaiki, S. Retention behavior of small polar compounds on polar stationary phases in hydrophilic interaction chromatography. J. Chromatogr. A 2005, 1074, 71–80. [Google Scholar] [CrossRef] [PubMed]
  35. Guo, Y.; Baran, D. Hydrophilic Partitioning or Surface Adsorption? A Quantitative Assessment of Retention Mechanisms for Hydrophilic Interaction Chromatography (HILIC). Molecules 2023, 28, 6459. [Google Scholar] [CrossRef] [PubMed]
  36. Buszewski, B.; Noga, S. Hydrophilic interaction liquid chromatography (HILIC)—A powerful separation technique. Anal. Bioanal. Chem. 2012, 402, 231–247. [Google Scholar] [CrossRef]
Figure 1. Chemical structures of thyreostats TU (2-thiouracil), MTU (6-methyl-2-thiouracil), PTU (6-propyl-2-thiouracil), PhTU (6-phenyl-2-thiouracil), TAP (1-methyl-2-mercapto-imidazole), tapazole, methimazole), and MBI (mercaptobenzimidazole).
Separations 11 00269 g001
Figure 2. Final sample preparation procedure for TSs extraction from bovine muscle.
Separations 11 00269 g002
Figure 3. Optimisation strategy plan.
Separations 11 00269 g003
Figure 4. SRM chromatograms of MBI (151 > 93.3) generated by the nine different HILIC analytical columns with mobile phase of 1mM ammonium formate/0.1% formic acid (2/98, v/v).
Separations 11 00269 g004
Figure 5. Effect of temperature in retention behaviour. Van’t Hoff plot for TU, MTU, PTU, PhTU, TAP and MBI.
Separations 11 00269 g005
Figure 6. Effect of acetonitrile content in retention times of TU, MTU, PTU, PhTU, MBI and TAP. Column temperature was 25 °C and the mobile phase contained 5 mM ammonium formate.
Separations 11 00269 g006
Table 1. Selected reaction monitoring (SRM) transitions of the target compounds and the internal standards (ISs) ordered by retention time (RT). Tube lens voltage and collision energy (CE) for the quantification SRM1 (Q) and the confirmation SRM2 (C).
AnalytesRT
(min)
Tube Lens (V)SRM1 (Q)
SRM2 (C)
CE
(eV)
6-phenyl-2-thiouracil (PhTU)4.5378205.0 > 103.226
205.0 > 146.119
2-mercaptobenzimidazole (MBI)4.5575151.0 > 93.320
151.0 > 118.225
6-propyl-2-thiouracil (PTU)4.5675171.1 > 154.116
171.1 > 112.219
6-propyl-2-thiouracil-d5 (PTU-d5) (IS)4.5679176.0 > 117.219
176.0 > 159.118
Methimazole (TAP)4.7063115.0 > 88.218
115.0 > 57.416
Methimazole-d3 (TAP-d3) (IS)4.7163118.0 > 91.217
118.0 > 60.420
5,6-dimethyl-2-thiouracil (DMTU) (IS)5.1274157.0 > 140.116
157.0 > 98.218
6-methyl-2-thiouracil (MTU)5.4768143.1 > 126.116
143.1 > 84.317
2-thiouracil (TU)5.5767129.0 > 112.215
129.0 > 84.328
Table 2. % Average recoveries and %RSDs (n = 6) of the thyreostats at three concentration levels.
Thyreostats5 ng g−110 ng g−115 ng g−1
Average
%Rec.
%RSDAverage
%Rec.
%RSDAverage
%Rec.
%RSD
2-thiouracil84.59.582.88.688.75.5
6-methyl-2-thiouracil89.21093.61491.78.5
6-propyl-2-thiouracil98.96.71037.398.511
6-phenyl-2-thiouracil80.710.379.51476.88.8
Methimazole96.26.910061025.7
2-mercaptobenzimidazole80.21284.71376.69.7
Table 3. LOD, LOQ, CCα and CCβ values for the thyreostats, expressed as ng g−1.
ThyreostatsLODLOQCCαCCβ
2-thiouracil4.19.63.74.8
6-methyl-2-thiouracil2.99.45.28.1
6-propyl-2-thiouracil3.37.189.3
6-phenyl-2-thiouracil2.88.37.59.0
Methimazole2.98.76.18.4
2-mercaptobenzimidazole3.89.29.711
Disclaimer/Publisher’s Note: The statements, opinions and data contained in all publications are solely those of the individual author(s) and contributor(s) and not of MDPI and/or the editor(s). MDPI and/or the editor(s) disclaim responsibility for any injury to people or property resulting from any ideas, methods, instructions or products referred to in the content.

