Article

High-Efficiency Selective Adsorption of Rubidium and Cesium from Simulated Brine Using a Magnesium Ammonium Phosphate Adsorbent

1
Key Laboratory of Green and High-End Utilization of Salt Lake Resources, Key Laboratory of Salt Lake Resources Chemistry of Qinghai Province, Qinghai Institute of Salt Lakes, Chinese Academy of Sciences, Xining 810008, China
2
University of Chinese Academy of Sciences, Beijing 100049, China
*
Author to whom correspondence should be addressed.
Separations 2024, 11(9), 277; https://doi.org/10.3390/separations11090277
Submission received: 27 August 2024 / Revised: 18 September 2024 / Accepted: 19 September 2024 / Published: 23 September 2024
(This article belongs to the Special Issue Green and Efficient Separation and Extraction of Salt Lake Resources)

Abstract

:
Rubidium and cesium are critical strategic elements, and their development and utilization are of great significance. In this study, a magnesium ammonium phosphate (MAP) adsorbent was prepared and characterized using scanning electron microscopy (SEM), X-ray diffraction (XRD), Brunauer–Emmett–Teller (BET) surface area analysis, and Fourier transform infrared spectroscopy (FTIR). The adsorption performance of the adsorbent for Rb+ and Cs+ in solution was investigated. The results showed that the adsorbent exhibited high adsorption capacities of 2.83 mol/g for Rb+ and 4.37 mol/g for Cs+. In simulated brine, the adsorbent demonstrated excellent selectivity for Cs+. Kinetic and thermodynamic studies indicated that the adsorption process followed a pseudo-second order kinetic model and Langmuir isotherm model. The primary adsorption mechanism was an ion exchange. The development of this adsorbent holds significant promise for the extraction of rubidium and cesium from liquid resources.

1. Introduction

Rubidium (Rb) and cesium (Cs) are increasingly recognized as critical strategic elements due to their unique chemical and physical properties, which make them invaluable in various high-tech applications [1,2]. These alkali metals are essential in fields ranging from electronics to energy storage. Rubidium, for example, is used in atomic clocks, which are crucial for global positioning systems (GPS) and telecommunications networks, where high precision timing is imperative [3]. Cesium, on the other hand, has applications in the oil industry for drilling fluids, in medical devices for radiation therapy, and in the development of advanced materials for various industrial processes [4].
Despite the significant benefits associated with rubidium and cesium, their extraction and utilization present considerable challenges. Natural sources of these two elements include solid and liquid minerals. Solid minerals, such as lepidolite and pollucite, have relatively complex extraction processes and pose certain environmental pollution risks [5]. On the other hand, liquid minerals like brine from salt lakes have enormous reserves of rubidium and cesium and high extraction value [6]. However, they often contain these elements in low concentrations and in the presence of other competing ions, such as sodium, potassium, and magnesium [7]. These ions are not only present in very high concentrations but also have properties similar to rubidium and cesium, making their separation quite difficult and further complicating the extraction process.
Traditional extraction techniques for Rb+ and Cs+ mainly include solvent extraction [7], adsorption [8], and precipitation [9]. Solvent extraction and precipitation methods are generally better suited for the separation and extraction of Rb+ and Cs+ from systems with high ion concentrations. In contrast, the adsorption method offers a significant advantage in separating Rb+ and Cs+ from low-concentration solutions. Current research on Rb+ and Cs+ adsorbents focus on organic resins and inorganic adsorbents. Organic adsorbents typically exhibit high adsorption capacities but lack selectivity, while inorganic adsorbents offer better selectivity but often have moderate adsorption capacities [10]. Therefore, there is a pressing need to develop adsorbents that not only have high adsorption capacities but also demonstrate excellent selectivity for Rb+ and Cs+ in multi-ion systems. Additionally, it is essential to enhance the efficiency and selectivity of rubidium and cesium recovery.
Magnesium ammonium phosphate (MAP) is a crystalline material, characterized by its structural stability and simple preparation process [11]. The precipitation reaction is shown in Reaction.
M g 2 + + N H 4 + + H n P O 4 n 3 M g N H 4 P O 4 + n H + ,   n = 0 ,   1   o r   2
This material can release NH4+, which can then undergo ion exchange with other ions. Both the preparation and ion exchange processes are pollution-free. MAP also serves as an excellent adsorbent for Rb+ and Cs+ [12]. Through ion exchange, the NH4+ in the material can exchange with Rb+ and Cs+ in solution, thus generating an adsorption effect. Calculations indicate that the theoretical exchange capacity of MAP for Rb+ and Cs+ can reach 7.28 mmol/g, which is higher than that of most similar adsorbents [1,2,6,10]. Previous research has found that although some inorganic adsorbents for Rb+ and Cs+ have high theoretical adsorption capacities, their actual adsorption amounts are often low, mainly due to the small pore sizes of the materials that prevent Rb+ and Cs+ from entering the material’s interior [13]. However, the larger pore radius within the structure of MAP is more conducive to the adsorption of Rb+ and Cs+. Therefore, MAP shows great potential as an efficient adsorbent for the separation of Rb+ and Cs+ in liquid systems. Given the current lack of research on the separation of Rb+ and Cs+ in multi-ion coexistence systems using MAP, this study aims to provide data support for the application of MAP in liquid rubidium and cesium resource utilization.
This study focuses on the preparation and characterization of a MAP adsorbent and its application in the adsorption of Rb+ and Cs+ from aqueous solutions and simulated brine. The MAP adsorbent was synthesized, and its morphology and structure were characterized using scanning electron microscopy (SEM), X-ray diffraction (XRD), Brunauer–Emmett–Teller (BET) surface area analysis, and Fourier transform infrared spectroscopy (FTIR). The adsorption performance of the MAP adsorbent was evaluated in terms of adsorption capacities, selectivity, kinetics, and isotherms.

2. Materials and Methods

2.1. Materials

The reagents rubidium chloride (RbCl) and cesium chloride (CsCl) were purchased from the Chemical Reagent Factory of the Xinjiang Nonferrous Metals Research Institute. Magnesium hydroxide (Mg(OH)2), triammonium phosphate trihydrate ((NH4)3PO4·3H2O), hydrochloric acid (HCl), sodium hydroxide (NaOH), lithium chloride (LiCl), sodium chloride (NaCl), potassium chloride (KCl), and magnesium chloride (MgCl2) were obtained from Sinopharm Chemical Reagent Co., Ltd, Beijing, China. All the reagents were used without further purification.

2.2. Preparation of Adsorbents

To obtain the adsorbent magnesium ammonium phosphate (MAP), 5.83 g of Mg(OH)2 and 20.31 g of (NH4)3PO4·3H2O should be weighed and dispersed into 50 mL of deionized water. The mixture should be stirred until (NH4)3PO4·3H2O is completely dissolved. Then, the solution should be transferred to a 100 mL polytetrafluoro reactor and placed in an oven at 150 °C for 24 h. It should be naturally cooled to room temperature. Next, the solid obtained should be removed, washed three times with ethanol and deionized water, and the resulting white powder should be centrifuged. Finally, the powder should be dried at 60 °C for 24 h and stored for later use.

2.3. Adsorption Experiments

The adsorption experiment was carried out by introducing a desired amount of dried adsorbent into freshly prepared 50 mL Rb+ and Cs+ aqueous solution. The mixture was placed in a constant temperature shaker (Shanghai BOXUN Medical Biological Instrument Corp., Shanghai, China) and shaken at 25 °C. The sample was then filtered under reduced pressure, and a clear liquid was obtained. The concentration of Rb+ and Cs+ was determined using an atomic absorption spectrophotometer (TAS-990 Supper, Beijing PUXI General Instrument Co., Ltd., Beijing, China). All experiments were repeated three times. The adsorption capacity at different time points qt (mmol/g) was calculated according to Equation (1). The equilibrium adsorption capacity qe (mmol/g) was obtained by Equation (2), and the adsorption efficiency (Ae%) was calculated by Equation (3):
q t = ( C 0 C t ) V m
q e = ( C 0 C e ) V m
A e % = C 0 C e C 0 × 100 %
where C0, Ct, and Ce are the concentrations (mmol/L) at the initial state, the time (t), and equilibrium, respectively. V is the volume of aqueous solution used (L), and m is the weight of the dried adsorbents (g).

2.3.1. Experiments on the Effect of pH and Coexisting Ions

At a temperature of 25 °C, the adsorption of Rb+ and Cs+ was investigated by varying the pH of the adsorption solution from 2 to 12 to determine the optimal pH. The adsorbent dosage was maintained at 1.0 g/L, with an initial concentration of 4.0 mmol/L. pH adjustment was performed using 0.1 mol/L solutions of HCl and NaOH.
To evaluate the effects of different ions on the adsorbent’s capacity to adsorb Rb+ and Cs+, a simulated brine containing 0.05 mol/L Li+, 0.5 mol/L Na+, 0.1 mol/L K+, 0.3 mol/L Mg2+, 0.005 mol/L Rb+, and 0.005 mol/L Cs+ was prepared as the adsorption solution. The dosage of the adsorbent was fixed at 1.0 g/L, the adsorption was performed at ambient temperature, and the pH of the solution was maintained at approximately 6.

2.3.2. Adsorption Kinetics Experiments

In the adsorption kinetics experiments, the adsorption amounts of Rb+ and Cs+ from the solution were measured at different time intervals under three different temperatures (25 °C, 35 °C, and 45 °C). The experimental conditions included an adsorption liquid volume of 50 mL, a pH of 6, and an adsorbent dosage of 0.05 g. The initial concentrations of Rb+ and Cs+ were 1.0, 2.0, and 4.0 mmol/L, respectively.

2.3.3. Adsorption Isotherms Experiments

To investigate the adsorption isotherms, Rb+ and Cs+ solutions with initial concentrations ranging from 1.0 to 16.0 mmol/L were utilized as adsorbate solutions. The adsorbent dosage was maintained at 1.0 g/L, while the pH of the solution was approximately 6. Adsorption temperatures of 25, 35, and 45 °C were employed.

3. Results and Discussion

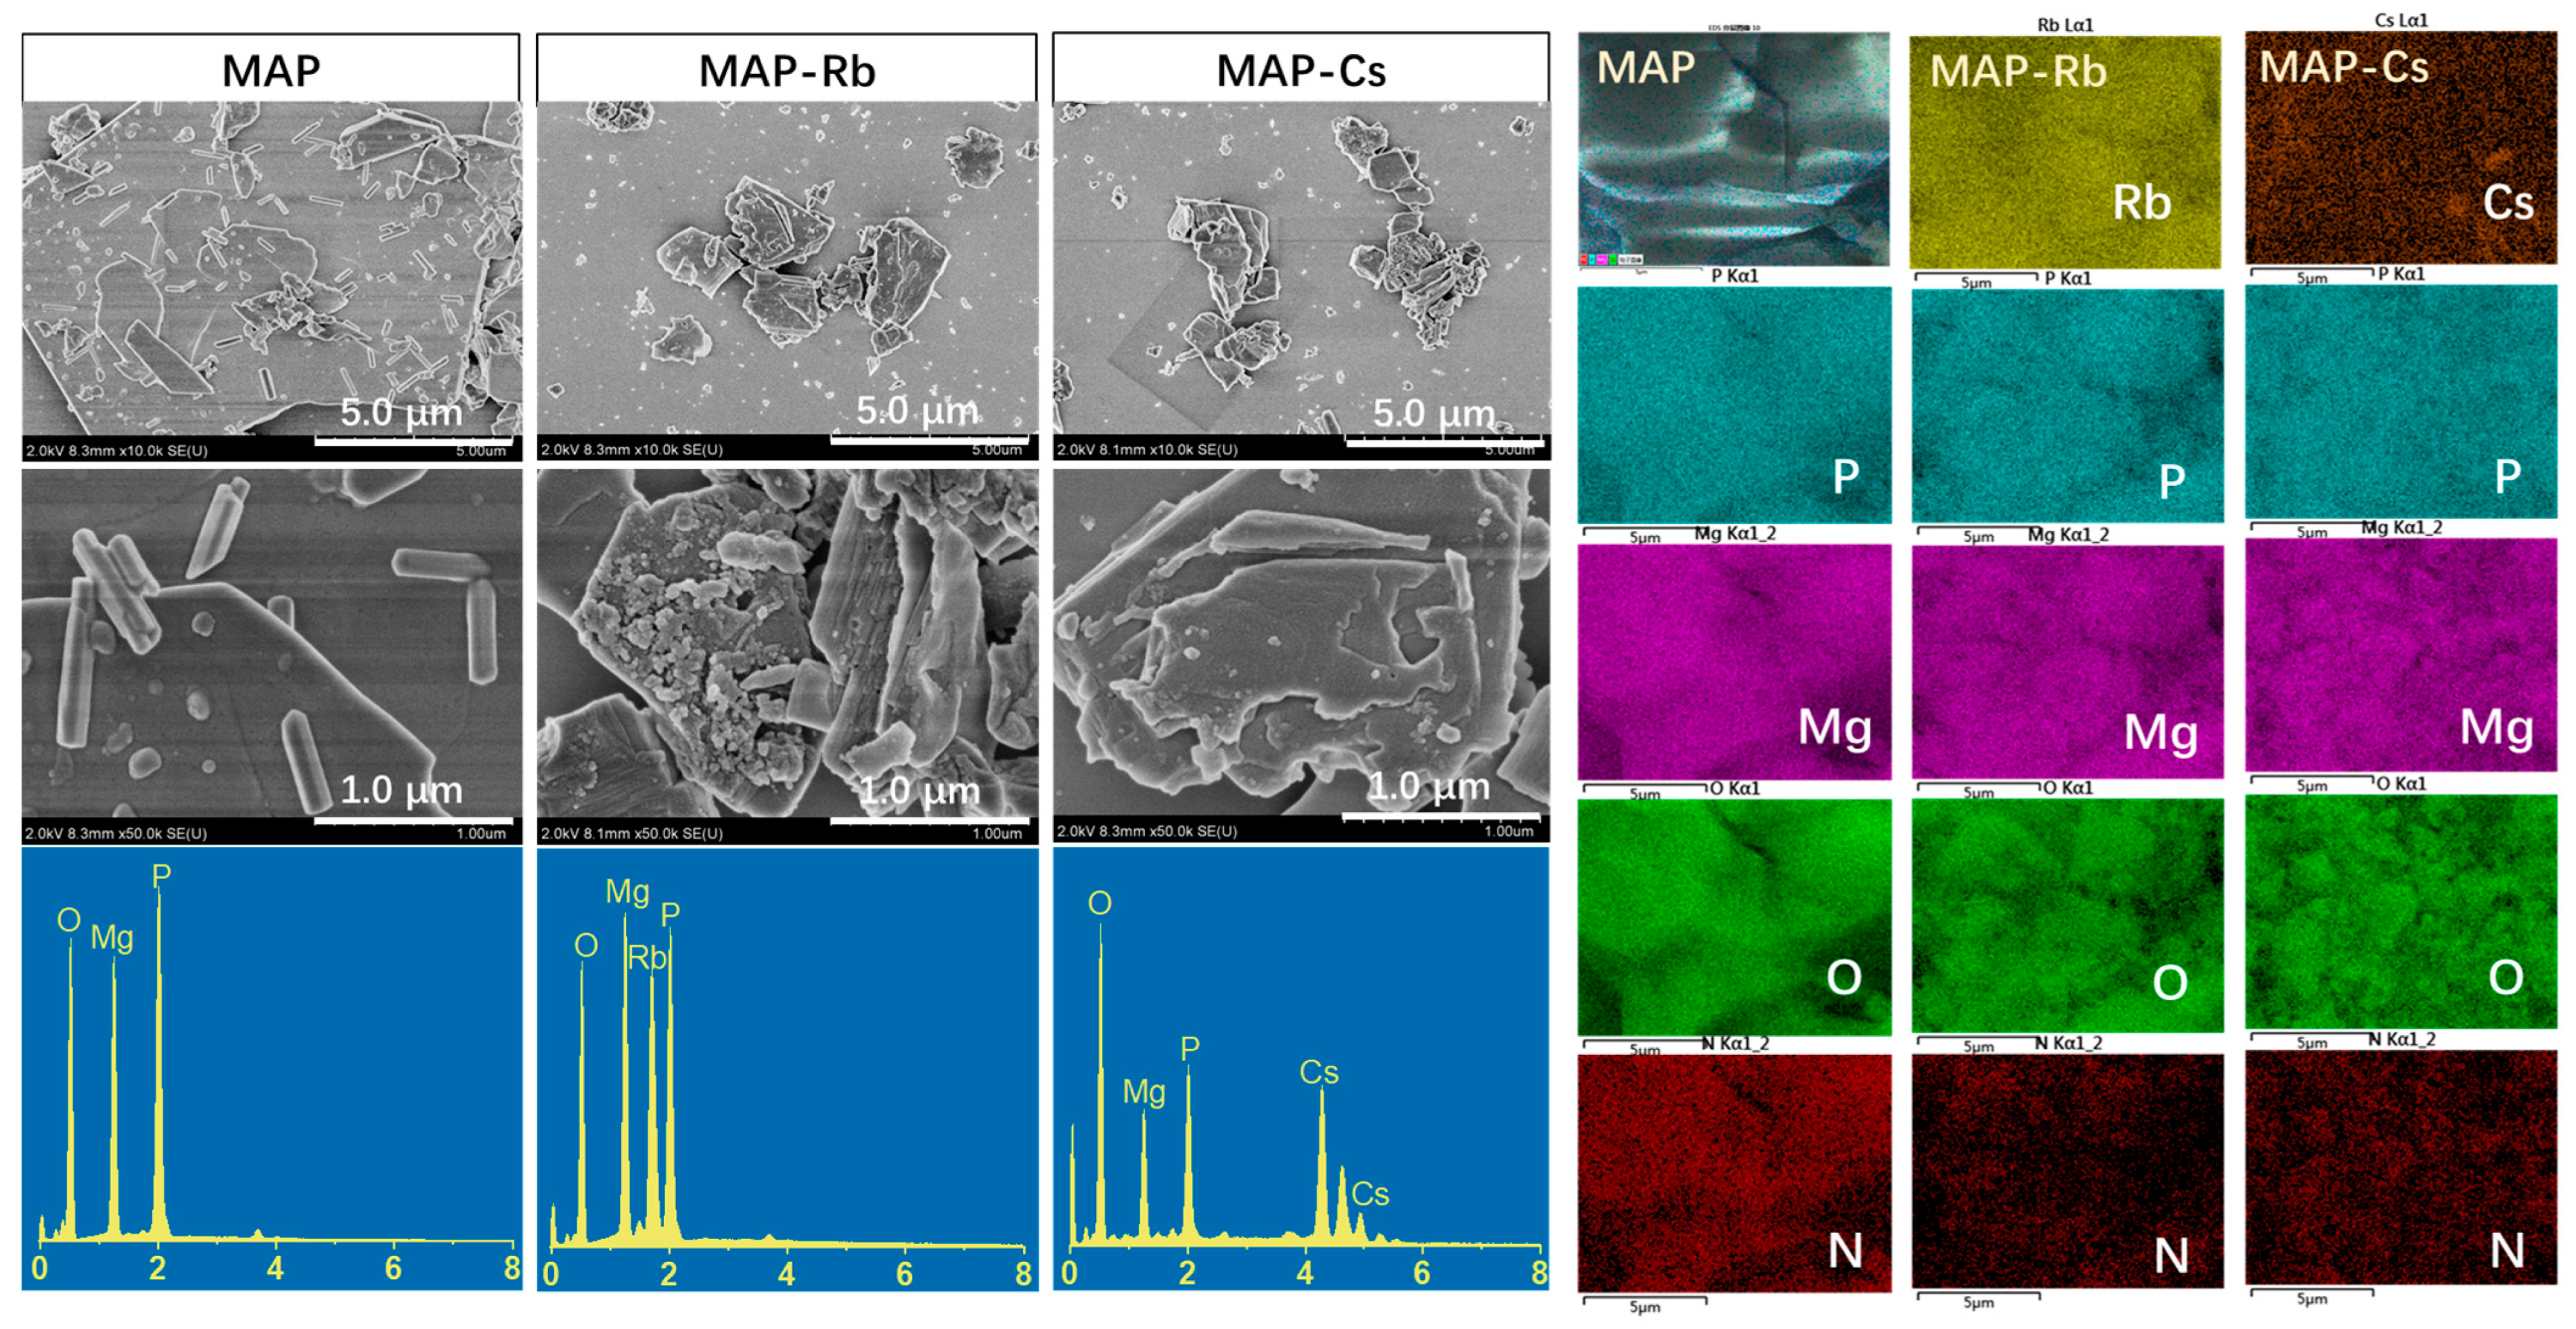
3.1. Characterization of the Adsorbents

The SEM and EDS characterization results of the adsorbent MAP before and after adsorption are presented in Figure 1. As observed from the SEM images, the adsorbent exhibits an irregular granular structure, with a noticeable reduction in the particle size after adsorption. The EDS results reveal prominent peaks corresponding to rubidium and cesium after adsorption, indicating a significant adsorption effect of the adsorbent on rubidium and cesium.
The N2 adsorption–desorption isotherms are employed to investigate the structural characteristics and pore size distribution curves of the adsorbent MAP. As depicted in Figure 2a, the adsorption isotherm of the adsorbent belongs to Type III, indicating a non-porous structure with a relatively smaller surface area, consistent with the particle structure observed in the SEM image [14].
The XRD characterization of the MAP adsorbent before and after adsorption is shown in Figure 2b. It can be observed from the figure that the diffraction peaks of the sample before adsorption match those of the standard card for NH4MgPO4·H2O (PDF#36-1491). The diffraction peaks at 10.1°, 18.7°, 21.1°, 30.6°, and 31.9° correspond to the (010), (110), (011), (030), and (121) planes, indicating the successful preparation of well-crystallized NH4MgPO4·H2O. On the other hand, the positions of most diffraction peaks of the sample after adsorbing Rb+ correspond to those of the standard card for RbMgPO4·6H2O (PDF#29-1091), with major diffraction peaks at 15.7°, 16.3°, 20.8°, 21.4°, 27.0°, and 33.1° corresponding to the (020), (011), (111), (121), (130), and (040) planes, indicating that after adsorption, the NH4MgPO4·H2O adsorbent transformed into RbMgPO4·6H2O. Similarly, the positions of most of the diffraction peaks of the sample after adsorbing Cs+ correspond to those of the standard card for CsMgPO4·6H2O (PDF#29-0412), with major diffraction peaks at 14.8°, 16.6°, 21.0°, 25.8°, 26.9°, 29.9°, 30.8°, 27.0°, and 33.1° corresponding to the (002), (101), (102), (110), (103), (200), (201), and (202) planes of CsMgPO4·6H2O. Moreover, it can also be observed from the figure that there are still some diffraction peaks of NH4MgPO4·H2O in the samples after adsorbing Rb+ and Cs+, indicating that the adsorbent did not completely transform during the adsorption process.
The infrared spectroscopic analysis of the adsorbent, both before and after adsorption, reveals no substantial alterations in the peak positions as shown in Figure 3a. The spectral bands observed at approximately 3440 and 1640 cm−1 are attributed to the O-H stretching and bending vibrations, respectively, and are indicative of the presence of water molecules on the sample surfaces [15]. Additionally, the absorption peaks detected at 3200 cm−1, 2920 cm−1, and 1400 cm−1 are assignable to the N-H stretching, scissoring, and bending vibrations of the ammonium ion (NH4+) [16]. Upon comparison of the infrared spectra before and after adsorption, a notable reduction in the intensity of the NH4+ absorption peak is observed before adsorption. This attenuation suggests a diminution in the concentration of NH4+ within the adsorbed sample, potentially as a result of their replacement by Rb+ and Cs+ during the adsorption process. The predominant spectral features, prominently evident at 1051 and 984 cm−1, are associated with the asymmetric stretching vibrations of the phosphate group. The bands observed near 580 cm−1 are ascribed to the asymmetric bending vibrations of the PO43− groups. Moreover, the band centered at 420 cm−1 is interpreted as the bending mode of the (PO4)3− group [17]. All the aforementioned peaks in the infrared spectra are in concordance with the presence of phosphate-containing crystals.
The TG-DSC curve reveals that the weight loss process of the MAP adsorbent can be divided into three distinct stages as the temperature increases (Figure 3b). The initial stage occurs below 100 °C, which corresponds to the evaporation of surface moisture from the adsorbent, accounting for a weight loss of 5.61%. The second stage involves the loss of crystalline water and the decomposition of the intermolecular ammonium ions, resulting in the formation of MgHPO4, with a weight loss of 21.22%. The third stage is characterized by the further decomposition of MgHPO4 into Mg2P2O7 [18], with a weight loss of 5.78%. From the weight loss data of the adsorbent, it can be deduced that the surface contains a small amount of moisture, and there is one molecule of crystalline water within the structure. Calculations indicate a total water content of 1.5 molecules. Consequently, the theoretical total weight loss is calculated to be 32.32%, while the actual weight loss is found to be 31.61% (with a residue of 68.39%), showing a close agreement between the two [19].
After the adsorbent adsorbs Rb+ and Cs+, a significant portion of the adsorbent is correspondingly converted into MgRbPO4·6H2O and MgCsPO4·6H2O, respectively. Characterization by X-ray diffraction (XRD) indicates that MgNH4PO4·H2O is still present in the adsorbent after adsorption. Thus, the TG and DSC curves of both after adsorption samples reveal a two-stage weight loss process. The first stage is attributed to the dehydration phase, with weight loss percentages of 33.24% and 26.01%, respectively. The second stage is likely due to the decomposition of the MgNH4PO4·H2O present in the adsorbent, which, given its lower content, results in a comparatively minor weight loss of 5.74% and 5.20%, respectively.

3.2. Adsorption Performance of the Adsorbents for Rb+ and Cs+

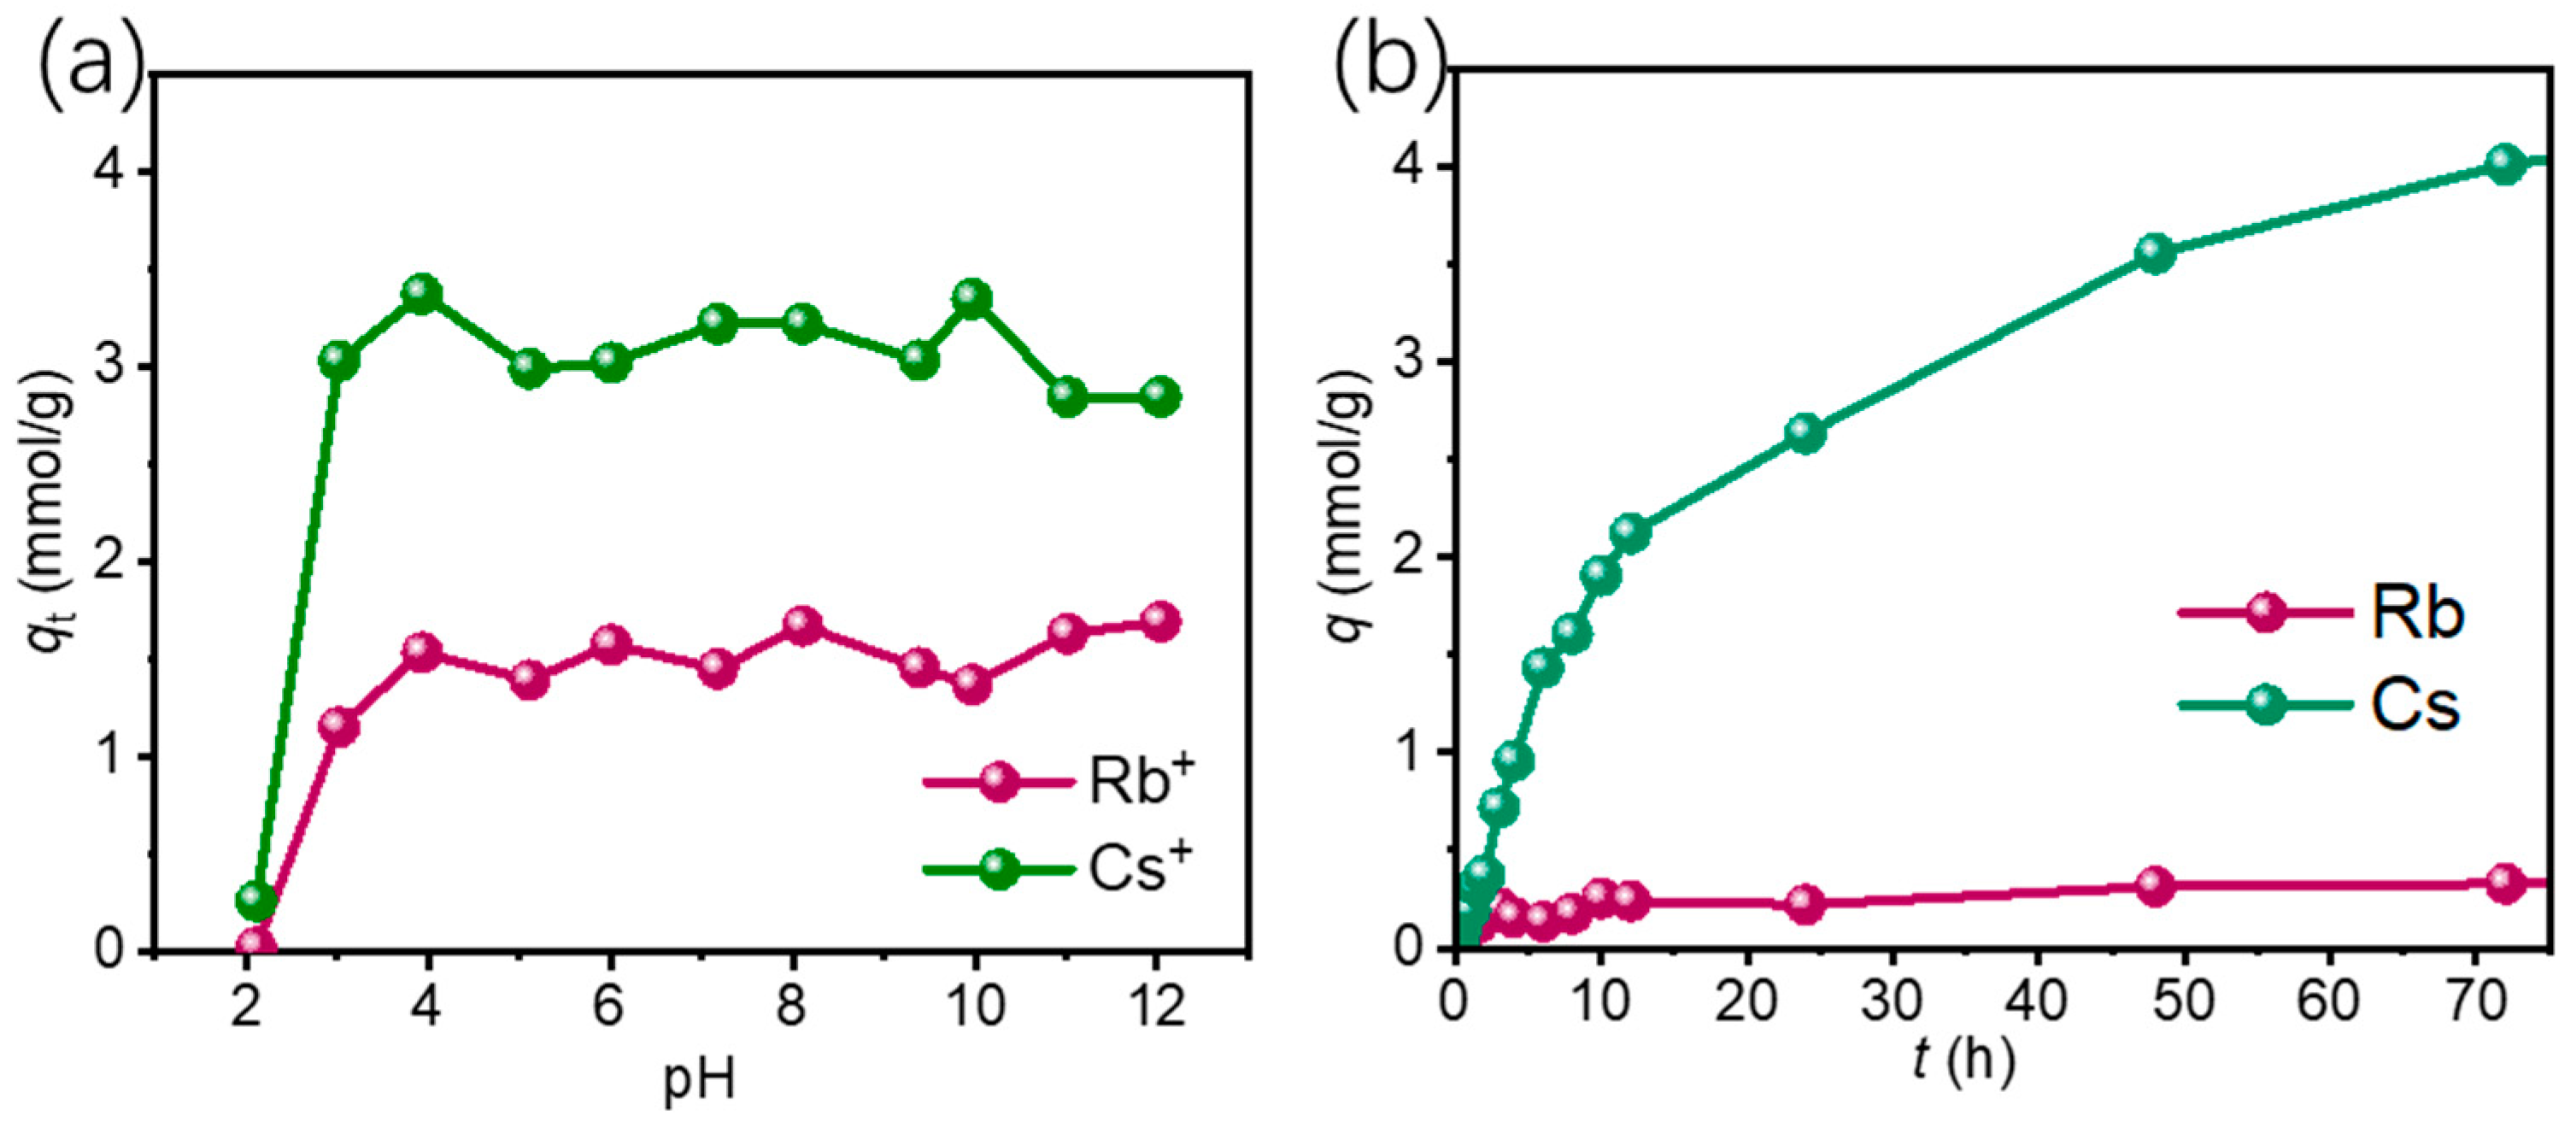
3.2.1. Effect of pH and Coexisting Ions

The effect of solution pH and coexisting ions on the adsorption of Rb+ and Cs+ are presented in Figure 4. As depicted in Figure 4a, the adsorbent exhibited relatively low adsorption amounts at a pH of 2, due to the abundance of hydrogen ions in the solution, which compete with Rb+ and Cs+ for adsorption sites. With an increase in pH value, the adsorption amounts rapidly increased. Within the pH range of 4 to 12, the adsorbent’s adsorption amounts for Rb+ and Cs+ remained relatively stable, with minimal variation, indicating that the adsorbent is suitable for a broad range of solution pH levels. For the sake of laboratory operation simplicity, the pH of the adsorption solution was not adjusted in subsequent adsorption processes, and it remained around 6.
To investigate the adsorbent’s performance in adsorbing Rb+ and Cs+ from a multi-ion mixture, a simulated brine containing Li+, Na+, K+, Mg2+, Rb+ and Cs+ was used as the adsorption liquid. Figure 4b shows that the adsorbent exhibited a high adsorption amount for Cs+ in the simulated brine, while the adsorption amount for Rb+ was lower, indicating a preferential adsorption of Cs+ by the adsorbent. Additionally, a comparison of the adsorption efficiency of various ions (Table 1) reveals that the adsorbent possesses excellent selectivity for Cs+. The presence of NH4+ in the solution after adsorption suggests that the adsorption process involves an ion-exchange reaction between the adsorbed ions and the NH4+.

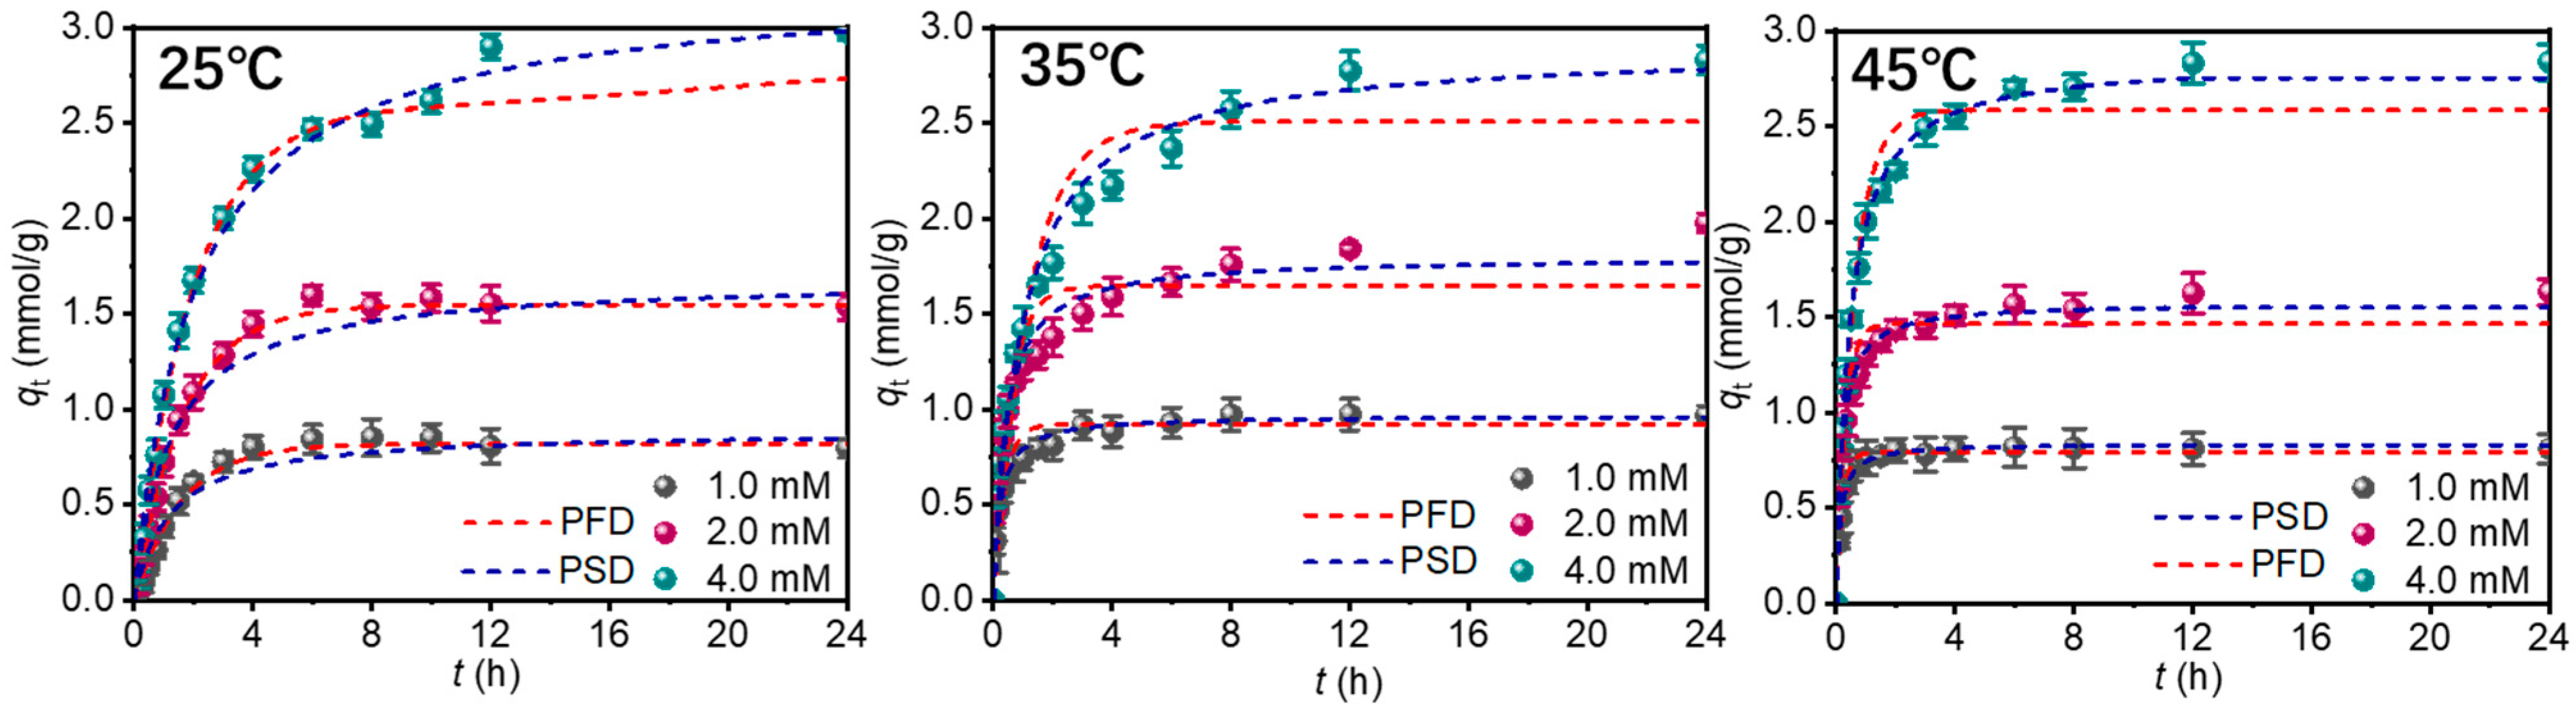
3.2.2. Adsorption Kinetics

The variation in the adsorption amounts of Rb+ and Cs+ in three different concentration solutions over time and temperature is shown in Figure 5 and Figure 6. From Figure 5, it can be seen that the equilibrium time for Rb+ adsorption by the MAP is minimally affected by temperature, but the adsorption amount significantly decreases with increasing temperature, indicating an exothermic adsorption process. Conversely, Figure 6 shows that the adsorbent has a better adsorption effect on Cs+. As the temperature rises, the change in adsorption amount is small, but the equilibrium time shortens.
Adsorption kinetics is a fundamental theory for assessing the adsorption process, governing the rate at which adsorption occurs. It is crucial when developing an adsorption system. The kinetics of batch adsorption experiments are explained using kinetic equations, which help clarify the physicochemical characteristics of the process, such as the rate-limiting step and the adsorption rate. The pseudo-first order and pseudo-second order models (Equations (4) and (5)) are the most commonly used equations for describing adsorption kinetics [20].
Pseudo-first order model
q t = q e 1 e k 1 t
Pseudo-second order model
q t = q e 2 k 2 t 1 + q e k 2 t
Here, qe refers to the adsorption amounts at equilibrium, and k1 and k2 are the pseudo-first order and pseudo-second order rate constants, respectively.
The dashed lines in Figure 5 and Figure 6 and the data in Table 2 and Table 3 represent the fitted curves and the related parameter fitting results for Rb+ and Cs+ adsorption by the adsorbent. The results indicate that the adsorption of both ions by the adsorbent conforms well to the pseudo-second order kinetic model, suggesting that the adsorption process is chemisorption.

3.2.3. Adsorption Isotherms

Adsorption isotherms are essential for assessing the adsorption mechanism and adsorption capacity of an adsorbent during adsorption and can be used to determine the correlation between the equilibrium adsorption capacity and the equilibrium concentration at a given temperature. To fit adsorption experiment data, the Langmuir and Freundlich two-parameter models are the most commonly chosen equations because of their popularity and the relevant information they provide [21].
The Langmuir model (Equation (6)) is a two-parameter model that assumes monolayer adsorption on a homogeneous surface of well-defined sites with no interaction between the adsorbed molecules. The Freundlich model (Equation (7)) is a two-parameter model that assumes multilayer adsorption on heterogeneous surfaces.
Langmuir model
q e = q m K L C e 1 + K L C e
Freundlich model
q e = K F C e 1 / n
Here, qm represents the maximum adsorption amount (mmol/g), KL is the Langmuir constant, KF is the Freundlich constant, and n is the heterogeneity factor.
The adsorption isotherms of Rb+ and Cs+ on the adsorbent MAP at different temperatures, along with the fitting curves of the two isotherm models, are shown in Figure 7. The corresponding fitting parameter results are listed in Table 4 and Table 5. The results indicate that the adsorption amounts of Rb+ by the adsorbent is significantly affected by temperature, decreasing markedly with increasing temperature, whereas the adsorption capacity for Cs+ is less affected by temperature. Comparatively, the adsorbent exhibits higher adsorption amounts for Cs+, with a maximum adsorption capacity of 4.37 mmol/g. By comparing the fitting results of the two models, it can be observed that the adsorption process of both ions by the adsorbent conforms more closely to the Langmuir adsorption isotherm model, indicating monolayer adsorption [22].
To compare the adsorption capacity of this adsorbent with other adsorbents for rubidium and cesium, Table 6 lists the adsorption capacities of adsorbents reported in several references. The comparison shows that the adsorbent in this study exhibits a higher adsorption capacity.

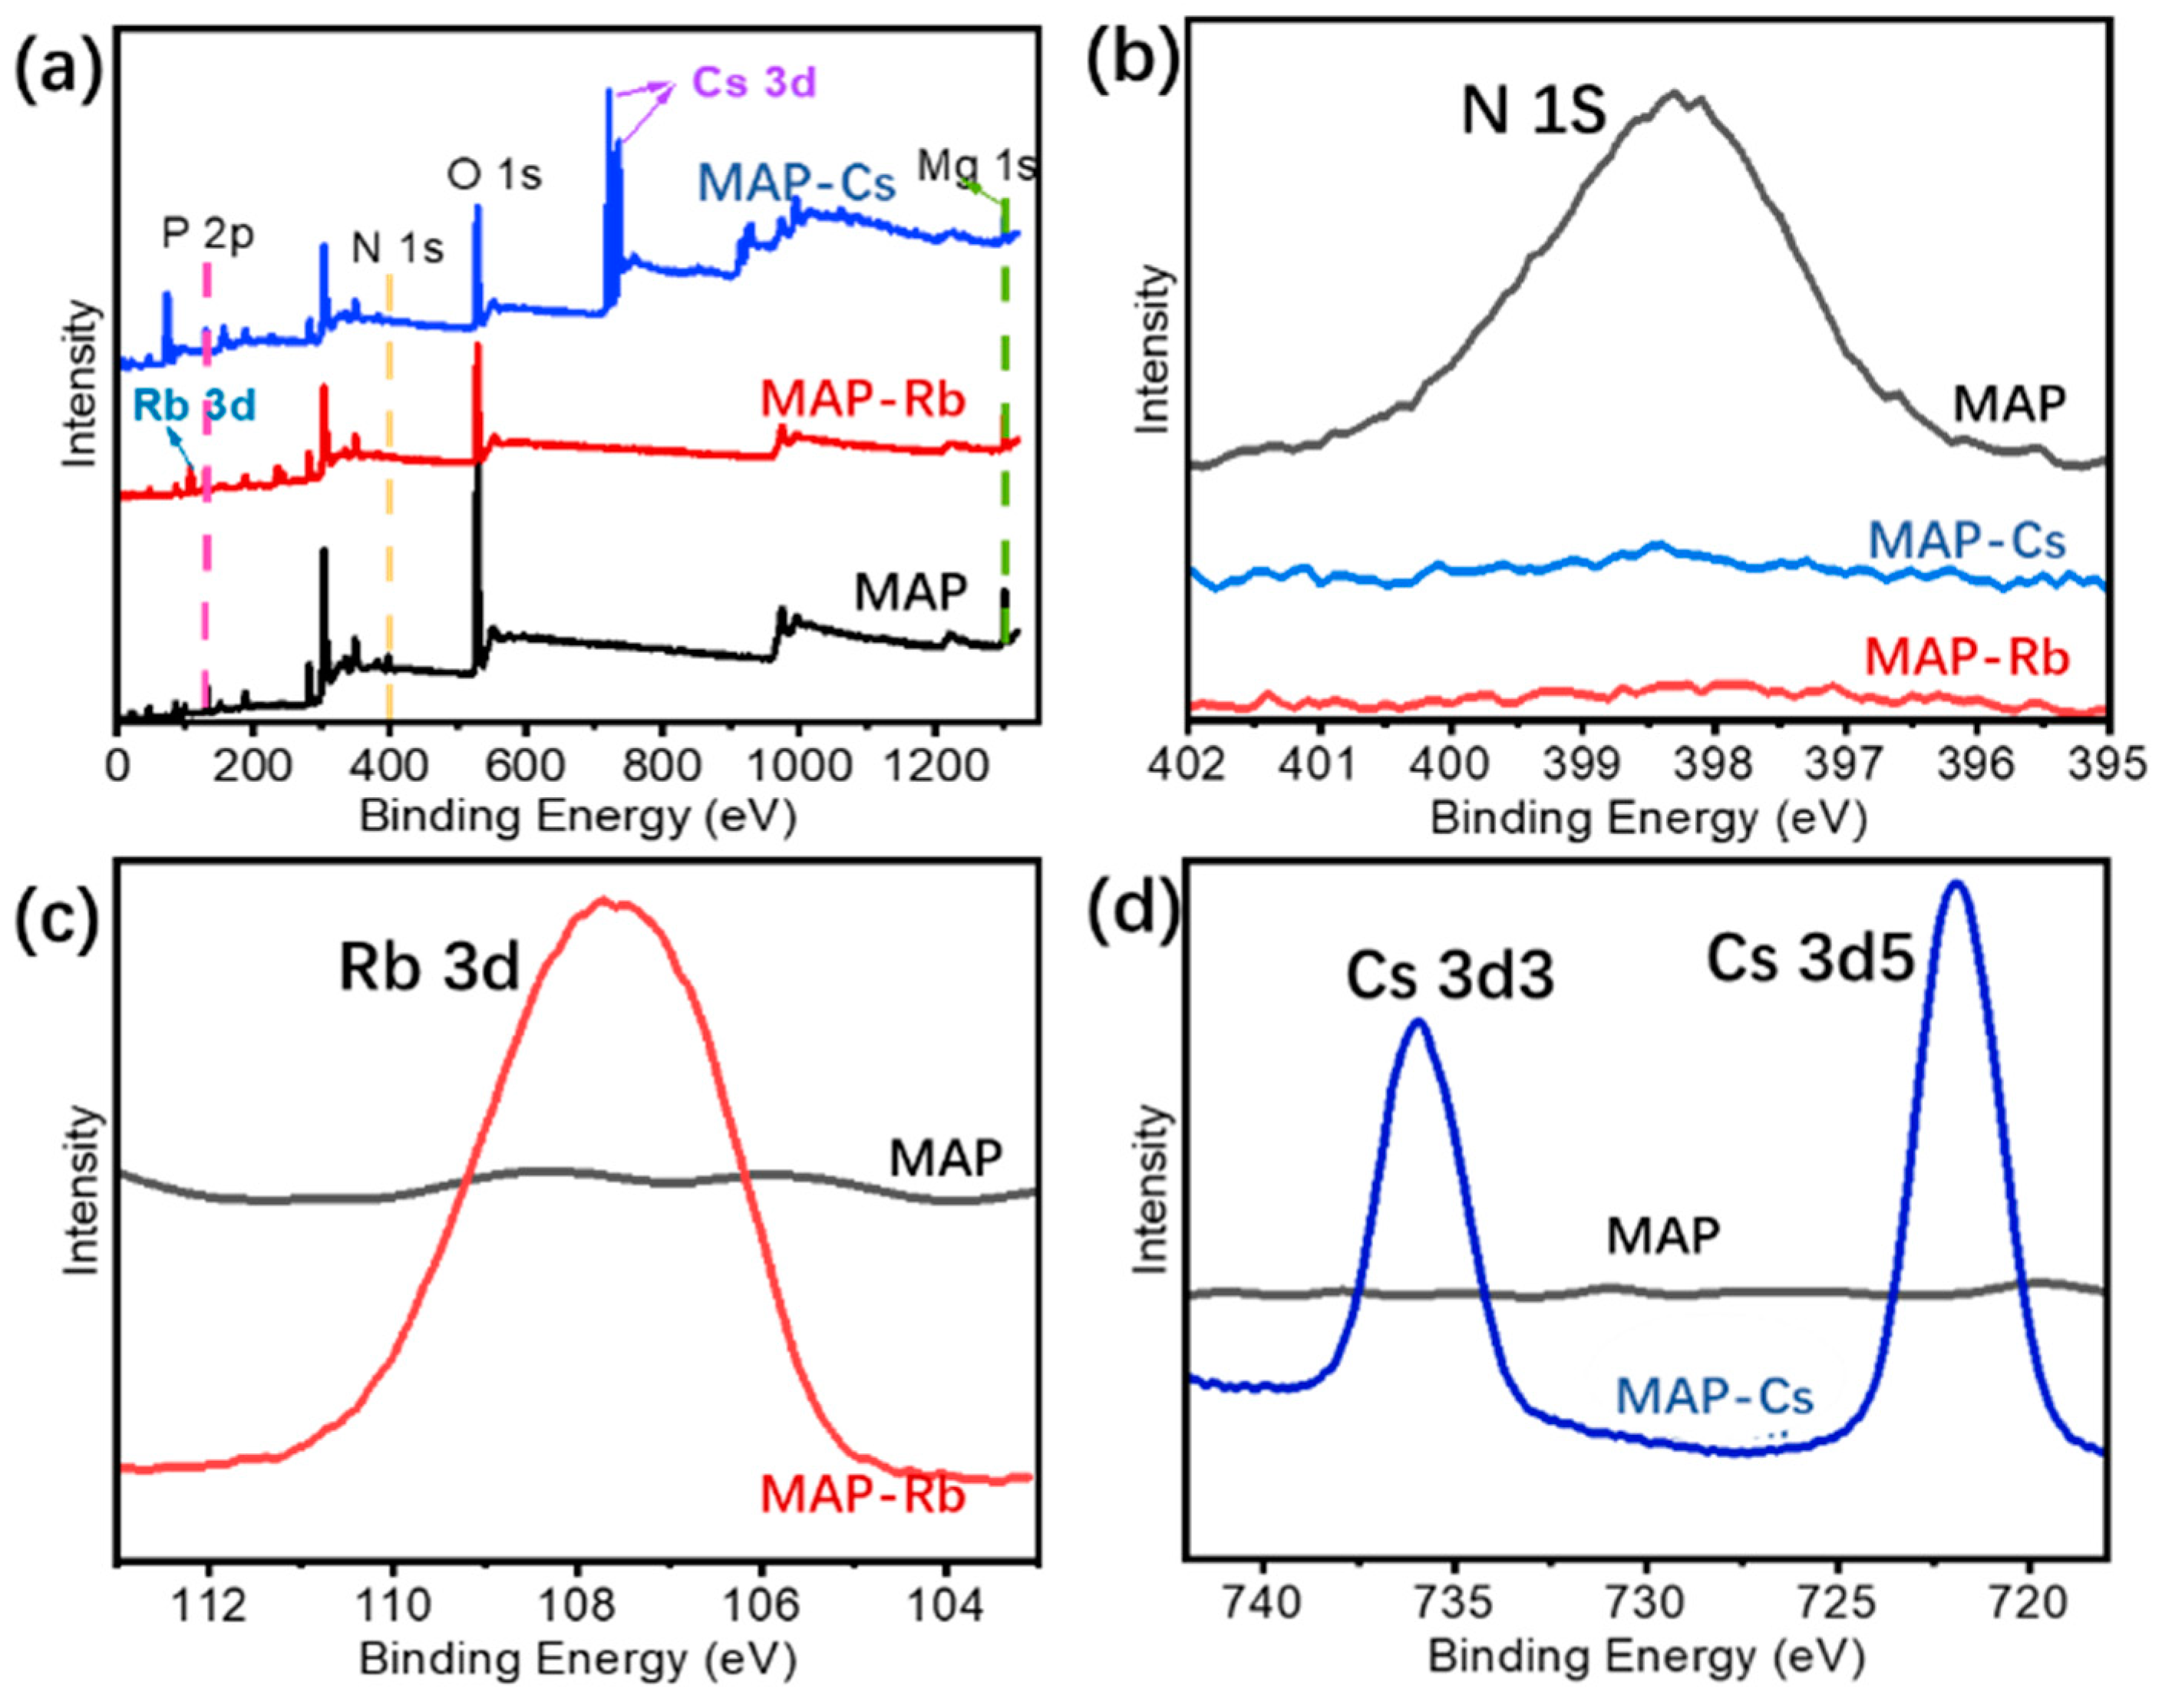
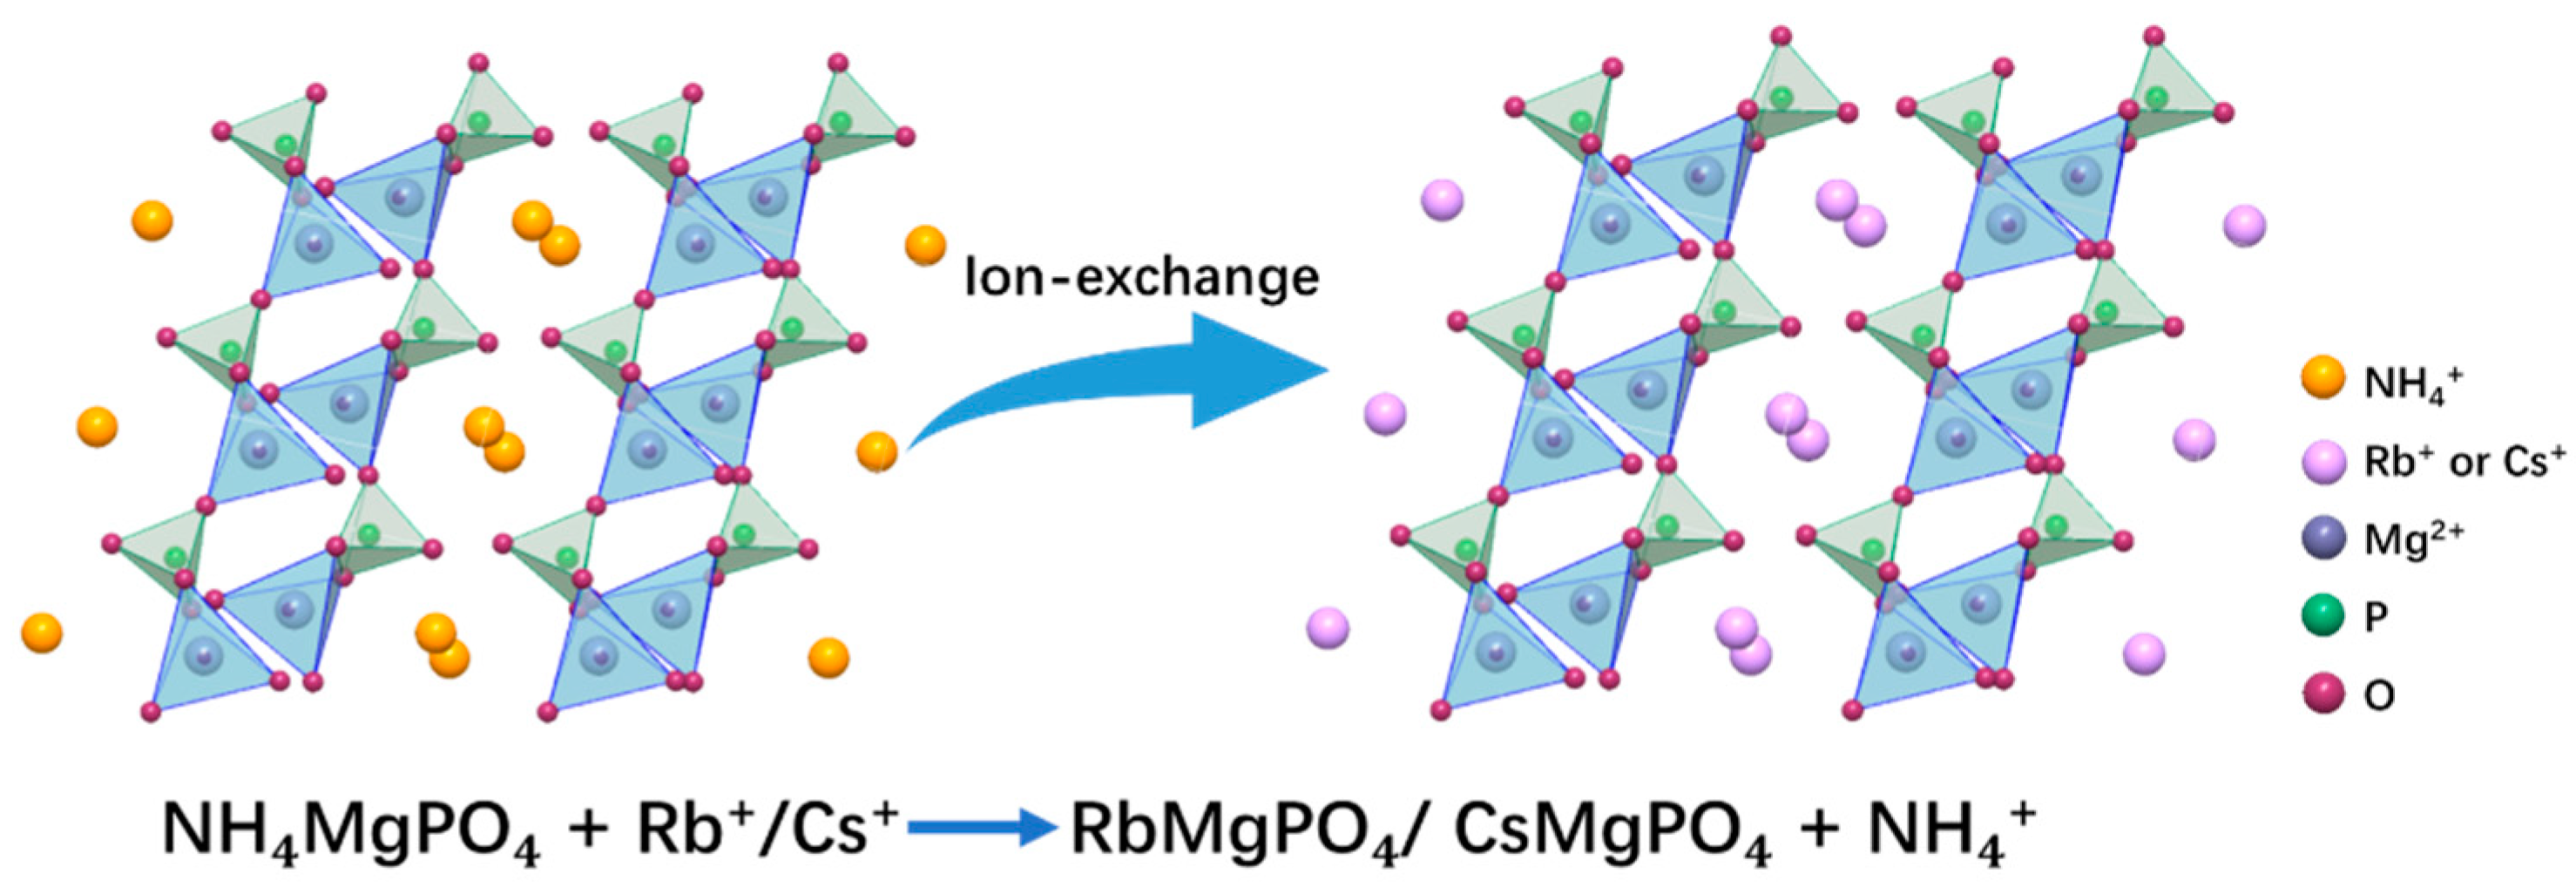
3.3. Adsorption Mechanism

To investigate the adsorption mechanism of the adsorbent, XPS characterization was performed on the adsorbent before and after adsorption, as shown in Figure 8. The surface chemical composition of the adsorbent before and after adsorption was evaluated by X-ray photoelectron spectroscopy (XPS) analysis, with the spectra presented in Figure 8a. It can be seen that peaks corresponding to P 2p, N 1s, O 1s, and Mg 1s are observed at 126, 398, 530, and 1299 eV, respectively, indicating the presence of these elements on the material surface. Additionally, peaks for Rb 3d and Cs 3d are detected in the samples after the adsorption of Rb+ and Cs+, respectively, suggesting the adsorption capability of the material for these ions. Furthermore, a comparison between the N 1s peaks before and after adsorption reveals a significant decrease in peak intensity after the adsorption of Rb+ and Cs+, indicating an ion exchange process between NH4+ and Rb+ and Cs+ during adsorption.
Figure 9 shows that the determination of ions in the solution after adsorption revealed that the ratio of adsorbed Rb+ and Cs+ to the exchanged NH4+ was 1.04:1, which is close to 1:1. This indicates that Rb+ and Cs+ underwent ion exchange with NH4+ in the adsorbent, following an approximately 1:1 ion exchange mechanism (Figure 10).

4. Conclusions

This study investigated the adsorption properties and mechanisms of a novel adsorbent, MAP, for Rb+ and Cs+. The adsorbent demonstrated significant adsorption properties, with maximum values of 2.83 mmol/g for Rb+ and 4.37 mmol/g for Cs+ at 25 °C. Adsorption for Rb+ was exothermic, decreasing with temperature, while Cs+ adsorption was less temperature-dependent. The adsorption data fit well with the Langmuir isotherm model, indicating monolayer adsorption. Kinetics followed a pseudo-second order model, suggesting chemisorption. XPS analysis confirmed an ion exchange mechanism between NH4+ ions in the adsorbent and Rb+ and Cs+ ions, with a 1:1 exchange ratio. The adsorbent also showed high selectivity for Cs+ in mixed solutions, making it a promising candidate for the selective removal and recovery of Rb and Cs from aqueous solutions.

Author Contributions

H.L.: investigation, data curation, writing—original draft, conceptualization. Y.W.: writing—review and editing. Q.Z.: writing—review. W.H.: validation. H.Z.: supervision and editing. X.Y.: supervision, writing—review and editing, funding acquisition. All authors have read and agreed to the published version of the manuscript.

Funding

This research was funded by [the Natural Science Foundation of Qinghai Province] grant number [2023-ZJ-940J], [the CAS Project for Young Scientists in Basic Research] grant number [YSBR-039], And the Kunlun Talent Program of Qinghai Province.

Data Availability Statement

Data will be made available on request.

Conflicts of Interest

The authors declare that they have no known competing financial interests or personal relationships that could influence the work reported in this paper.

References

  1. Lv, Y.; Ma, B.; Liu, Y.; Wang, C.; Chen, Y. A novel adsorbent potassium magnesium ferrocyanide for selective separation and extraction of rubidium and cesium from ultra-high salt solutions. J. Water Process Eng. 2023, 55, 104225. [Google Scholar] [CrossRef]
  2. Yan, J.; Zhang, B.; Li, J.; Yang, Y.; Wang, Y.-N.; Zhang, Y.-D.; Liu, X.-Z. Rapid and Selective Uptake of Radioactive Cesium from Water by a Microporous Zeolitic-like Sulfide. Inorg. Chem. 2023, 62, 12843–12850. [Google Scholar] [CrossRef] [PubMed]
  3. Han, Z.; Ran, W.; Li, J.; Khan, A.; Zhong, H.; He, Z. Efficient Leaching of Rubidium from Biotite by Ion Exchange without Destroying the Lamellar Crystal Structure. ACS Sustain. Chem. Eng. 2023, 11, 8822–8835. [Google Scholar] [CrossRef]
  4. Xu, Z.; Rong, M.; Ni, S.; Meng, Q.; Wu, X.; Liu, H.; Yang, L. Self-Polycondensing Hypercross-Linked Polymers from Hydroxybenzyl Alcohols for Efficient Cesium Adsorption. ACS Appl. Polym. Mater. 2023, 5, 8315–8325. [Google Scholar] [CrossRef]
  5. Xing, P.; Wang, C.; Ma, B.; Wang, L.; Zhang, W.; Chen, Y. Rubidium and Potassium Extraction from Granitic Rubidium Ore: Process Optimization and Mechanism Study. ACS Sustain. Chem. Eng. 2018, 6, 4922–4930. [Google Scholar] [CrossRef]
  6. Chu, W.-F.; Yuan, Z.; Lin, P.; Jin, G.-P. Recovery of Rubidium Using Hydrogel Beads Encapsulating Potassium Copper Hexacyanoferrate from Saline Lake Brines. Ind. Eng. Chem. Res. 2024, 63, 1988–1999. [Google Scholar] [CrossRef]
  7. Li, Z.; Pranolo, Y.; Zhu, Z.; Cheng, C.Y. Solvent extraction of cesium and rubidium from brine solutions using 4-tert-butyl-2-(α-methylbenzyl)-phenol. Hydrometallurgy 2017, 171, 1–7. [Google Scholar] [CrossRef]
  8. Wang, G.; Zhang, H.; Qian, W.; Tang, A.; Cao, H.; Feng, W.; Zheng, G. Synthesis and assessment of spherogranular composite tin pyrophosphate antimonate adsorbent for selective extraction of rubidium and cesium from salt lakes. Desalination 2024, 581, 117540. [Google Scholar] [CrossRef]
  9. Lei, Z.; Li, X.; Huang, P.; Hu, H.; Li, Z.; Zhang, Q. Mechanochemical activation of antigorite to provide active magnesium for precipitating cesium from the existences of potassium and sodium. Appl. Clay Sci. 2019, 168, 223–229. [Google Scholar] [CrossRef]
  10. Yuan, T.; Chen, Q.; Shen, X. Adsorption of cesium using mesoporous silica gel evenly doped by Prussian blue nanoparticles. Chin. Chem. Lett. 2020, 31, 2835–2838. [Google Scholar] [CrossRef]
  11. Ge, K.; Ji, Y.; Tang, S. Crystallization Kinetics and Mechanism of Magnesium Ammonium Phosphate Hexahydrate: Experimental Investigation and Chemical Potential Gradient Model Analysis and Prediction. Ind. Eng. Chem. Res. 2020, 59, 13799–13809. [Google Scholar] [CrossRef]
  12. Li, Z.; Yang, C.; Cho, K. Dittmarite-type magnesium phosphates for highly efficient capture of Cs+. J. Hazard. Mater. 2023, 453, 131385. [Google Scholar] [CrossRef] [PubMed]
  13. Wang, Y.; Zhang, Q.; Li, K.; Wang, C.; Fang, D.; Han, W.; Lu, M.; Ye, X.; Zhang, H.; Liu, H.; et al. Efficient Selective Adsorption of Rubidium and Cesium from Practical Brine Using a Metal–Organic Framework-Based Magnetic Adsorbent. Langmuir 2024, 40, 9688–9701. [Google Scholar] [CrossRef]
  14. Cerofolini, G.F.; Meda, L. A theory of multilayer adsorption on rough surfaces in terms of clustering and melting BET piles. Surf. Sci. 1998, 416, 403–422. [Google Scholar] [CrossRef]
  15. Bekiaris, G.; Peltre, C.; Jensen, L.S.; Bruun, S. Using FTIR-photoacoustic spectroscopy for phosphorus speciation analysis of biochars. Spectrochim. Acta Part A Mol. Biomol. Spectrosc. 2016, 168, 29–36. [Google Scholar] [CrossRef] [PubMed]
  16. Dong, B.; Li, G.; Yang, X.; Chen, L.; Chen, G.Z. Controllable synthesis of (NH4)Fe2(PO4)2(OH)·2H2O using two-step route: Ultrasonic-intensified impinging stream pre-treatment followed by hydrothermal treatment. Ultrason. Sonochem. 2018, 42, 452–463. [Google Scholar] [CrossRef]
  17. Gezović, A.; Milović, M.; Bajuk-Bogdanović, D.; Grudić, V.; Dominko, R.; Mentus, S.; Vujković, M.J. An effective approach to reaching the theoretical capacity of a low-cost and environmentally friendly Na4Fe3(PO4)2(P2O7) cathode for Na-ion batteries. Electrochim. Acta 2024, 476, 143718. [Google Scholar] [CrossRef]
  18. Sugiyama, S.; Yokoyama, M.; Ishizuka, H.; Sotowa, K.-I.; Tomida, T.; Shigemoto, N. Removal of aqueous ammonium with magnesium phosphates obtained from the ammonium-elimination of magnesium ammonium phosphate. J. Colloid Interface Sci. 2005, 292, 133–138. [Google Scholar] [CrossRef] [PubMed]
  19. Yang, Y.Q.; Zhang, G.H.; Guo, J.B.; Qi, D.W.; Liu, R.Q. An insight into the thermal properties of struvite-k by Rietveld refinement method. J. Mater. Res. Technol. 2023, 24, 3683–3690. [Google Scholar] [CrossRef]
  20. Ahmad, M.; Yang, K.; Li, L.; Fan, Y.; Shah, T.; Zhang, Q.; Zhang, B. Modified Tubular Carbon Nanofibers for Adsorption of Uranium (VI) from Water. ACS Appl. Nano Mater. 2020, 3, 6394–6405. [Google Scholar] [CrossRef]
  21. Zheng, X.; Wang, Y.; Qiu, F.; Li, Z.; Yan, Y. Dual-Functional Mesoporous Films Templated by Cellulose Nanocrystals for the Selective Adsorption of Lithium and Rubidium. J. Chem. Eng. Data 2019, 64, 926–933. [Google Scholar] [CrossRef]
  22. Nxumalo, N.L.; Mahlambi, P.N. Molecularly Imprinted Polymer-Based Adsorbents for the Selective Removal of Pharmaceuticals from Wastewater: Adsorption Kinetics, Isotherms, and Thermodynamics Studies. Ind. Eng. Chem. Res. 2023, 62, 16525–16544. [Google Scholar] [CrossRef]
  23. Ishfaq, M.M.; Karim, H.M.A.; Khan, M.A. A radiochemical study on the thermodynamics of cesium adsorption on potassium copper nickel hexacyanoferrate (II) from aqueous solutions. J. Radioanal. Nucl. Chem. 1997, 222, 177–181. [Google Scholar] [CrossRef]
  24. Dan, H.; Xian, Q.; Chen, L.; Xiong, T.H.; Jiang, Z.D.; Yi, F.C.; Ding, Y. One-step direct synthesis of mesoporous AMP/SBA-15 using PMA as acid media and its use in cesium ion removal. J. Nucl. Mater. 2019, 527, 151809. [Google Scholar] [CrossRef]
  25. Aguila, B.; Banerjee, D.; Nie, Z.; Shin, Y.; Ma, S.Q.; Thallapally, P. Selective removal of cesium and strontium using porous frameworks from high level nuclear waste. Chem. Commun. 2016, 52, 5940–5943. [Google Scholar] [CrossRef]
  26. Ai, J.; Chen, F.Y.; Gao, C.Y.; Tian, H.R.; Pan, Q.J.; Sun, Z.M. Porous Anionic Uranyl-Organic Networks for Highly Efficient Cs+ Adsorption and Investigation of the Mechanism. Inorg. Chem. 2018, 57, 4419–4426. [Google Scholar] [CrossRef]
  27. Fang, Y.; Zhao, G.; Dai, W.; Ma, L.; Ma, N. Enhanced adsorption of rubidium ion by a phenol@MIL-101(Cr) composite material. Microporous Mesoporous Mater. 2017, 251, 51–57. [Google Scholar] [CrossRef]
Figure 1. Representative SEM images and EDS of the adsorbent MAP after adsorption of Rb (MAP-Rb) and Cs (MAP-Cs).
Separations 11 00277 g001
Figure 2. (a) BET analysis results of MAP; (b) XRD patterns of MAP, MAP-Rb, and MAP-Cs.
Separations 11 00277 g002
Figure 3. (a) FTIR patterns and (b) TG/DSC patterns of MAP, MAP-Rb, and MAP-Cs.
Separations 11 00277 g003
Figure 4. (a) Influence of solution pH on the adsorption of rubidium and cesium; (b) adsorption of rubidium and cesium by the adsorbent in the simulated brine.
Separations 11 00277 g004
Figure 5. Kinetic curves of the adsorption of Rb+ and the fitting curves of the pseudo-first order (PFO) model and the pseudo-second order (PSO) kinetic model.
Separations 11 00277 g005
Figure 6. Kinetic curves of the adsorption of Cs+ and the fitting curves of the pseudo-first order (PFO) model and the pseudo-second order (PSO) kinetic model.
Separations 11 00277 g006
Figure 7. Isotherm curves and their nonlinear curves on the basis of Langmuir and Freundlich models.
Separations 11 00277 g007
Figure 8. XPS spectra of (a) survey scan, (b) N 1s, (c) Rb 3d, and (d) Cs 3d for MAP before and after the adsorption of Rb+ and Cs+.
Separations 11 00277 g008
Figure 9. The concentration of the ions in the solution before and after adsorption.
Separations 11 00277 g009
Figure 10. Ion exchange schematic for adsorption of Rb+ and Cs+ by MAP.
Separations 11 00277 g010
Table 1. Comparison of concentration changes before and after adsorption of each ion in simulated brine.
Concentration (mg/L)Adsorption Efficiency (%)
IonsBefore AdsorptionAfter Adsorption
Li+355.3349.71.58
Na+11,893.211,819.60.62
K+4082.34011.61.73
Mg2+8061.67936.21.56
Rb+440.4405.18.02
Cs+744.5147.280.3
NH4+ 84.9
Table 2. Kinetic parameters of the adsorption for Rb+.
PFOPSO
T
(°C)
C
(mmol/L)
qe,exp
(mmol/g)
qe,cal
(mmol/g)
k1R2qe,cal
(mmol/g)
k2R2
251.000.9170.8890.0850.9961.0460.0900.997
2.001.3741.3320.1130.9901.5150.0910.998
4.001.8351.8000.1270.9972.0380.0740.996
351.000.4830.4810.0590.9820.6430.0800.987
2.000.9340.8700.0680.9511.0990.0620.967
4.001.4431.3900.0970.9941.7310.0550.997
451.000.2420.2430.0580.9810.3290.1500.986
2.000.3780.3740.0640.9880.5120.1030.992
4.000.7790.7660.0940.9950.9850.0880.996
Table 3. Kinetic parameters of the adsorption for Cs+.
PFOPSO
T
(°C)
C
(mmol/L)
qe,exp
(mmol/g)
qe,cal
(mmol/g)
k1R2qe,cal
(mmol/g)
k2R2
251.000.8510.8830.5440.9920.8870.9570.994
2.001.5961.5470.6020.9951.6830.4830.995
4.003.0172.990.3060.9593.2320.1530.992
351.000.9690.8863.1780.9230.9515.0030.985
2.001.9761.6461.7910.8831.7991.4050.959
4.002.8302.5080.8420.9212.8030.3990.971
451.000.8080.794.8820.9890.8379.3890.994
2.001.6251.4643.4920.9401.5733.3910.990
4.002.8312.5841.6610.9642.8520.8030.994
Table 4. Adsorption isotherm parameters for Rb+.
Langmuir model
T25 °C35 °C45 °C
qm,exp (mmol/g)2.8282.4781.473
qm,cal (mmol/g)3.0372.7762.186
KL0.9670.5860.177
R20.9820.9660.992
Freundlich model
KF1.4401.0300.429
n3.1252.5381.932
R20.9760.9480.994
Table 5. Adsorption isotherm parameters for Cs+.
Langmuir model
T25 °C35 °C45 °C
qm,exp (mmol/g)4.3724.2534.048
qm,cal (mmol/g)4.3794.3324.227
KL2.7293.9294.531
R20.9680.9960.983
Freundlich model
KF2.8633.0613.128
n5.0416.0137.095
R20.8860.8270.680
Table 6. The comparison of saturation adsorption and selectivity for Rb+/Cs+ by various sorbents in this work and references.
Adsorbentqe (mmol g−1)Ref.
Rb+Cs+
KCuCNF/2.03[23]
AMP/SBA-15/0.217[24]
MIL-101-SO3H/0.16[25]
UOFS-2/0.78[26]
PH-@MIL-1010.86/[27]
MAP2.834.37This work
Disclaimer/Publisher’s Note: The statements, opinions and data contained in all publications are solely those of the individual author(s) and contributor(s) and not of MDPI and/or the editor(s). MDPI and/or the editor(s) disclaim responsibility for any injury to people or property resulting from any ideas, methods, instructions or products referred to in the content.

