Abstract
The present study was aimed to validate the phenolic, flavonoids, alkaloids and tannins profile of Asplenium aethiopicum (Burm. f.) Becherer methanolic extracts using HPTLC (High-performance thin-layer chromatography). The chromatographic separation was performed using the standard method. The separation methodology was optimized and phytoconstituents of A. aethiopicum methanolic extracts were separated. The methanolic extract of A. aethiopicum showed several bands identified as known phenolic compounds. The obtained flavonoids profiles were identified. HPTLC alkaloids profile of A. aethiopicum revealed 11 types of alkaloids. The tannin profile of methanolic extracts of A. aethiopicum demonstrated 11 different types of tannins. The observed profiles will be used as phytomarker to identify the chemical constituents of A. aethiopicum methanolic extracts. These profiles will act as a fingerprint of A. aethiopicum and help us to distinguish from its adulterants. The observed profile will help us to identify the crude drugs and improve the therapeutic potentials of A. aethiopicum.
1. Introduction
Upgradation and advancement in the separation techniques plays a vital role in the quality control of plant derived crude drugs. Previous studies confirmed that chemical profiles attained through chromatographic separations are accepted for the purpose of quality control of herbal medicines. The chromatographic profiles are employed for the authentication and identification of herbal medicine. Due to the advancement in the chromatography and spectroscopy fascinated the notice of pteridologist to undertake the phytochemical studies on pteridophytes. The application chromatographic techniques in the chemosystemaitcs of plants, provides a clear solution for the taxonomical disputes. It will provide a solid evidence for the drug quality control in the pharmaceutical industries [1].
Previous studies on the chemical or metabolites profile of medicinal using HPTLC analysis confirmed its efficiency, accuracy, cost effectiveness and reproduciability [2,3,4,5]. In addition to that, the HPTLC studies provide an idea on the chemical composition and metabolites profiles of the studied plants and help us to identify the medicianl properties of the plants [6,7,8].
Asplenium aethiopicum (Burm. f.) Becherer is a fern (Pteridophytes) belongs to the family Aspleniaceae. A. aethiopicum (Burm. f.) Becherer antioxidant, larvicidal, and cytotoxic potential are documented by Johnson et al. [9]. With this knowledge, the present study was intended to reveal the phenolics, flavonoids, alkaloids and tannins profile of A. aethiopicum (Burm. f.) Becherer using HPTLC. The HPTLC profiles will construct a platform for the bioefficacy studies on A. aethiopicum (Burm. f.) Becherer.
2. Experimental
2.1. Collection of Plant Material
The A. aethiopicum (Burm. f.) Becherer was collected from the Western Ghats of Tamil Nadu, India. The collected Asplenium aethiopicum was processed and prepared the powder from the shade dried materials of A. aethiopicum as described in Johnson et al. [9].
2.2. Preparation of Extracts
The dried and powered plant materials (30 g) were extracted with methanol by the procedure described by Johnson et al. [9]. The crude extracts were prepared for HPTLC analysis as described by Johnson et al. [9].
2.3. HPTLC Analysis
HPTLC separations was performed by the standard method [10,11]. 3 µL of methanolic extracts of A. aethiopicum were loaded for the separations.The separation of phenolics, flavonoids and tannins was achieved by adopting the mobile phase and spraying reagents of Janakiraman and Johnson methods [12].The toluene-acetone-formic acid (4.5:4.5:1) and Folin-Ciocalteu reagent was employed as mobile phase and spraying reagents for phenolics. The mobile phase toluene-acetone-formic acid (4.5:4.5:1) and spraying reagent 1% ethanolic aluminium chloride was used for the separations of flavonoids. The toluene-ethyl acetate-formic acid-methanol (3:3:0.8:0.2) and 5% ferric chloride reagents was served as mobile phase and spraying reagents for tannins.
The separations were documented and profile images were captured at visible light, UV 253 nm and 366 nm. All solvents were of analytical grade and the standards were purchased from Sigma Aldrich (Mumbai, India). HPTLC was performed on silica gel 60f 254, 20 × 10 cm HPTLC plates (Merck, Darmstadt, Germany).
3. Results and Discussion
Janakiraman and Johnson [12] employed mobile phase and spraying reagents provided the good separation and high resolution (Figure 1, Figure 2, Figure 3 and Figure 4). The HPTLC phenolic profile of A. aethiopicum methanolic extract displayed the existence of eleven varied phenolics with 11 different Rf values (Table 1; Figure 1). Of which, the phenol with Rf value 0.11, 0.16, 0.21, 0.29, 0.63 and 0.65 were identified as known phenolic compounds (37.94%). The flavonoids profile of A. aethiopicum methanolic extracts determined the presence of 10 different types of flavonoids (Table 2; Figure 2). Of which, the flavonoids with Rf values 0.16, 0.23, 0.36, 0.52, 0.65, 0.75, 0.83 and 0.96 were recognized as known flavonoids (98.85%). HPTLC alkaloids profile of A. aethiopicum methanolic extracts confirmed eleven types of alkaloids presence with varied Rf values (Table 3; Figure 3). The alkaloids with Rf values 0.14, 0.20, 0.27, 0.32, 0.35, 0.53 and 0.65 were classified as known alkaloids (33.90%) in the TLC system. The tannin profile of A. aethiopicum methanolic extracts validated the existence of eleven types of tannins (Table 4; Figure 4). Among the observed tannins, the tannins with Rf value 0.01, 0.04 and 0.11 were considered as known tannins (10.40%) in the TLC system.
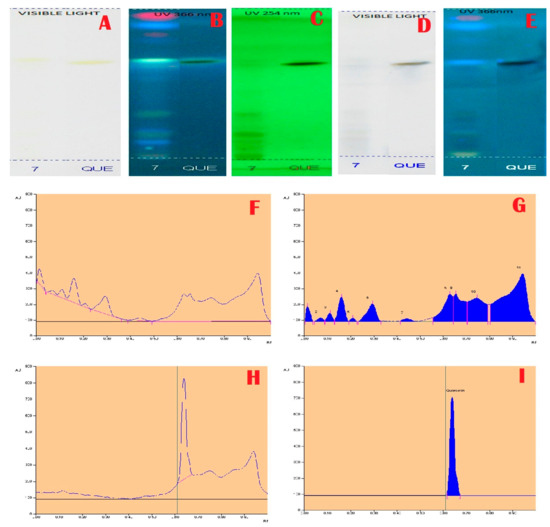
Figure 1.
Total Phenolic Profile and Chromatogram of A. aethiopicum. (A): HPTLC profile of A.aethiopicum under visible light; (B): HPTLC profile of A. aethiopicum under UV light at 366nm before derivatization; (C): HPTLC profile of A. aethiopicum under UV light at 234 nm before derivatization; (D): HPTLC profile of A. aethiopicum under visible light after derivatization; (E): HPTLC profile of A. aethiopicum under UV light at 366 nm after derivatization; (F): HPTLC chromatogram of methanolic extracts of A. aethiopicum—base line display scanned at 254 nm; (G): HPTLC chromatogram of methanolic extracts of A. aethiopicum—peak densitogram display scanned at 254 nm; (H): HPTLC profile of standard—peak baseline display scanned at 254 nm; (I): HPTLC chromatogram of standard Quercetin—peak densitogram display scanned at 254 nm.
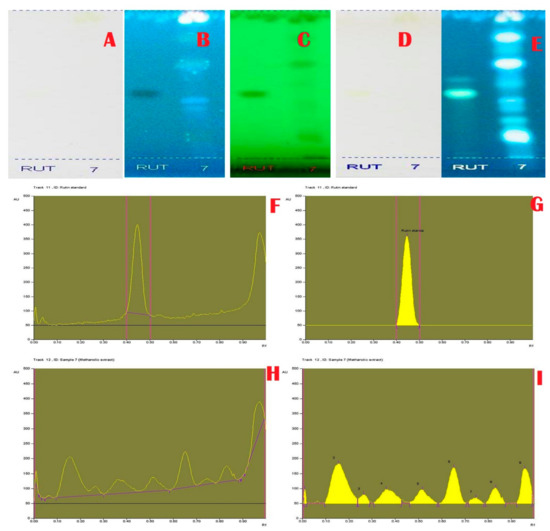
Figure 2.
Flavonoid Specific Profile and Chromatogram of A. aethiopicum. (A): HPTLC profile of A.aethiopicum under visible light; (B): HPTLC profile of A. aethiopicum under UV light at 366 nm before derivatization; (C): HPTLC profile of A. aethiopicum under UV light at 234 nm before derivatization; (D): HPTLC profile of A. aethiopicum under visible light after derivatization; (E): HPTLC profile of A. aethiopicum under UV light at 366 nm after derivatization; (F): HPTLC profile of standard Rutin—peak base line display scanned at 254 nm; (G): HPTLC chromatogram of standard Rutin—peak densitogram display scanned at 254 nm; (H): HPTLC chromatogram of methanolic extracts of A. aethiopicum—base line display scanned at 254 nm; (I): HPTLC chromatogram of methanolic extracts of A. aethiopicum—peak densitogram display scanned at 254 nm.
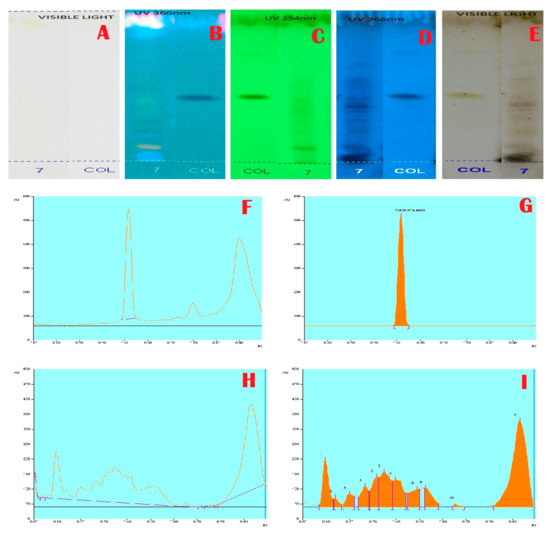
Figure 3.
Alkaloids Profile and Chromatogram of A. aethiopicum.(A): HPTLC profile of A. aethiopicum under visible light; (B): HPTLC profile of A. aethiopicum under UV light at 366 nm before derivatization; (C): HPTLC profile of A. aethiopicum under UV light at 234 nm before derivatization; (D): HPTLC profile of A. aethiopicum under visible light after derivatization; (E): HPTLC profile of A. aethiopicum under UV light at 366 nm after derivatization; (F): HPTLC profile of standard Colchichine—peak base line display scanned at 254 nm; (G): HPTLC chromatogram of standard Colchichine—peak densitogram display scanned at 254 nm; (H): HPTLC chromatogram of methanolic extracts of A. aethiopicum—base line display scanned at 254 nm; (I): HPTLC chromatogram of methanolic extracts of A. aethiopicum—peak densitogram display scanned at 254 nm.
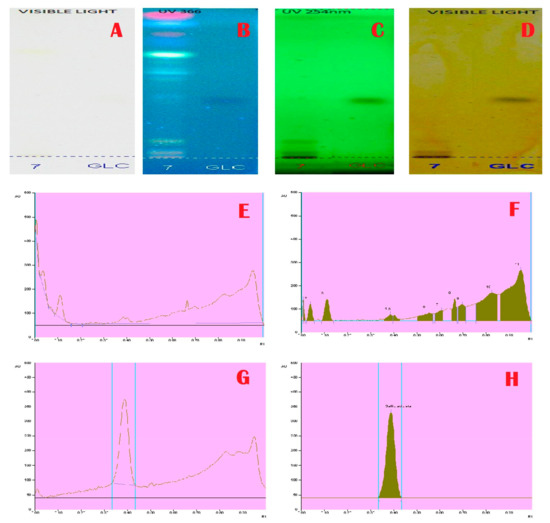
Figure 4.
Tannins Profile and Chromatogram of A. aethiopicum. (A): HPTLC profile of A. aethiopicum under visible light; (B): HPTLC profile of A. aethiopicum under UV light at 366 nm before derivatization; (C): HPTLC profile of A. aethiopicum under UV light at 234 nm before derivatization; (D): HPTLC profile of A. aethiopicum under visible light after derivatization; (E): HPTLC chromatogram of methanolic extracts of A. aethiopicum—base line display scanned at 254 nm; (F): HPTLC chromatogram of methanolic extracts of A. aethiopicum—peak densitogram display scanned at 254 nm; (G): HPTLC profile of standard Gallic acid—peak baseline display scanned at 254 nm; (H): HPTLC chromatogram of standard Gallic acid—peak densitogram display scanned at 254 nm.

Table 1.
HPTLC Total Phenolic profile of A. aethiopicum methanolic extract.
Table 2.
HPTLC flavonoid-specific profile of A. aethiopicum methanolic extract.
Table 3.
HPTLC alkaloid profile of A. aethiopicum methanolic extract.
Table 4.
HPTLC Tannin profile of A. aethiopicum methanolic extract.
In pharmacognosy, identification of crude drugs from its adulterants is a very tough task using the conventional methods [13,14]. Newton et al. [15] and Mukhopadhyay [16] explained the demerits of substandard drugs. The chromatographic methods are provided as an alternative method of identification and authentication of crude drugs from its adulterants [17]. HPTLC separations and profiles are employed to solve many qualitative and quantitative analytical problems in a wider range [18,19]. Due to the efficiency, accuracy, cost effectiveness, HPTLC profiles are evolved as valuable quality assessment tool in the pharmaceutical industries and act as phytomarker/metabolites marker or chemical fingerprint to identify, authenticate the herbal drugs. In the present study also the chemical constituents’ profile were revealed using HPTLC for the medicinally important plant A. aethiopicum. Previous studies’ reports are validated the utility of HPTLC profiles as authentication and characterization marker of the medicinally important plant [18,19]. In addition to that, chromatographic profiles pave the pathway to isolate, purify and characterize the active principles or metabolites or compounds from the medicinal plants. The results of the present study also provided the valuable chemical information and pave for chemical compound isolation for the medicinally important fern A. aethiopicum.
4. Conclusions
The observed HPTLC phenolics, tannins, alkaloids and flavonoids profiles may be used effectively as apharmacognostical marker or phytomarker for the identification of Aspleniumaethiopicum and its derived products. The existence of the metabolites validated the biopotency (antioxidant and cytotoxicity) of A. aethiopicum.
Author Contributions
Conceptualization, M.a.A.J. and H.D.M.C.; Formal analysis, J.G. and N.J.; Project administration, H.D.M.C.; Resources, T.R.J.J.M. and J.E.R.; Supervision, M.a.A.J. and H.D.M.C.; Writing—original draft, M.a.A.J. and H.D.M.C.; Writing—review & editing, J.G., N.J., T.R.J.J.M. and J.E.R. All authors have read and agreed to the published version of the manuscript.
Funding
This research received no external funding.
Conflicts of Interest
The authors declare no conflict of interest.
References
- Uma, B.; Prabhakar, K.; Rajendran, S. In Vitro Antimicrobial Activity and Phytochemical Analysis of Ficus religiosa L. and Ficus bengalensis L. against Diarrhoeal Enterotoxigenic E. coli. Ethnobot. Leafl. 2009, 13, 472–474. [Google Scholar]
- Aktar, M.W.; Poi, R.; Bhattacharyya, A. Status of sennosides content in various Indian herbal formulations: Method standardization by HPTLC. Bangladesh. J. Pharmacol. 2008, 3, 64–68. [Google Scholar] [CrossRef]
- Pawar, R.K.; Shivani, S.; Singh, K.C.; Rajeev, K.V.S. Physico-chemical standardization and development HPTLC method for the determination of Andrographonin in KalmghNavyasLoha. An Ayurvedic formulation. Int. J. Res. Ayurveda Pharm. 2011, 2, 295–301. [Google Scholar]
- Ram, M.; Abdin, M.Z.; Khan, M.A.; Jha, P. High-Performance Thin-Layer Chromatography (HPTLC); Springer: Berlin, Germany, 2011; p. 105. [Google Scholar]
- Mostafa, H.A.M.; el Bakry, A.A.; Alam, E.A. Evaluation of antibacterial and antioxidant activities of different plant parts of Rumex vesicarius L. (Polygonaceae). Int. J. Pharmcy Pharm. Sci. 2011, 2, 109–118. [Google Scholar]
- Kumar, R.A.; Sridevi, K.; Kumar, N.V.; Nanduri, S.; Rajagopal, S. Anticancer and immunostimulatory compounds from Andrographis paniculata. J. Ethnopharm. 2004, 92, 291–295. [Google Scholar] [CrossRef] [PubMed]
- Sheeja, K.; Kuttan, G. Activation of cytotoxic T lymphocyte responses and attenuation of tumor growth in vivo by Andrographis paniculata extract and andrographolide. Immunopharmacol Immunotoxicol. 2007, 29, 81–93. [Google Scholar] [CrossRef] [PubMed]
- Mukherjee, P.K.; Kumar, V.; Houghton, P.J. Screening of Indian medicinal plants for acetylcholinesterase inhibitory activity. Phytother. Res. 2007, 21, 1142–1145. [Google Scholar] [CrossRef] [PubMed]
- Johnson, M.A.; Gowtham, J.; Sivaraman, A.; Janakiraman, N.; Narayani, M. Antioxidant, Larvicidal, and Cytotoxic Studies on Asplenium aethiopicum (Burm. f.) Becherer. Int. Sch. Res. Not. 2014, 2014, 6. [Google Scholar] [CrossRef]
- Harborne, J.B. Phytochemical Methods; Chapman and Hall: London, UK, 1998. [Google Scholar]
- Wagner, H.; Baldt, S.; Zgainski, E.M. Plant Drug Analysis; Springer: Berlin, Germany, 1996. [Google Scholar]
- Janakiraman, N.; Johnson, M.A. HPTLC Fingerprint Profile (Phenolics) of Selected Cyathea Species from Western Ghats, South India. Chin. J. Biol. 2016, 2016, 7. [Google Scholar] [CrossRef]
- Reportofthe U.S. Food and Drug Administration, Combating Counterfeit Drugs; FDA: Washingto DC, USA. Available online: http://www.fda.gov/oc/initiatives/counterfeit/report02_04.html (accessed on 25 July 2004).
- Deisingh, A.K. Pharmaceutical counterfeiting. Analyst 2005, 130, 271. [Google Scholar] [CrossRef] [PubMed]
- Newton, P.N.; Green, M.D.; Fernandez, F.M.; Day, N.P.; White, N.J. Counterfeit anti-infective drugs. Lancet Infect. Dis. 2006, 6, 602. [Google Scholar] [CrossRef]
- Mukhopadhyay, R. The Hunt for Counterfeit Medicine. Anal. Chem. 2007, 79, 2623. [Google Scholar] [CrossRef] [PubMed][Green Version]
- Sherma, J. Review of advances in the thin layer chromatography of pesticides: 2004–2006. J. Environ. Sci. Health B 2007, 42, 429–440. [Google Scholar] [CrossRef] [PubMed]
- Jain, A.; Lodhi, S.; Singhai, A.K. Simultaneous estimation of quercetin and rutin in Tephrosia purpurea Pers by high performance thin-layer chromatography. Asian J. Tradit. Med. 2009, 4, 104–109. [Google Scholar]
- Sushma, G.S.; Devi, B.A.; Madhulatha, C.H.; Kumar, K.U.; Harathi, P.; Subramanian, N.S.; Ramadevi, M. Preliminary phytochemical screening and HPTLC fingerprinting of leaf extracts of Ficus nervosa Heyne ex Roth. J. Chem. Pharm. Res. 2013, 5, 98–104. [Google Scholar]


© 2020 by the authors. Licensee MDPI, Basel, Switzerland. This article is an open access article distributed under the terms and conditions of the Creative Commons Attribution (CC BY) license (http://creativecommons.org/licenses/by/4.0/).