On the Origin of the Photoplethysmography Signal: Modeling of Volumetric and Aggregation Effects


Abstract
1. Introduction
- Variations in the blood fraction (volume) inside the skin (volumetric model);
- The orientation, aggregation, and deformation of red blood cells (RBCs);
- The mechanical movements of capillaries in the superficial layers of the dermis and the compression of surrounding cellular tissues.
2. Materials and Methods
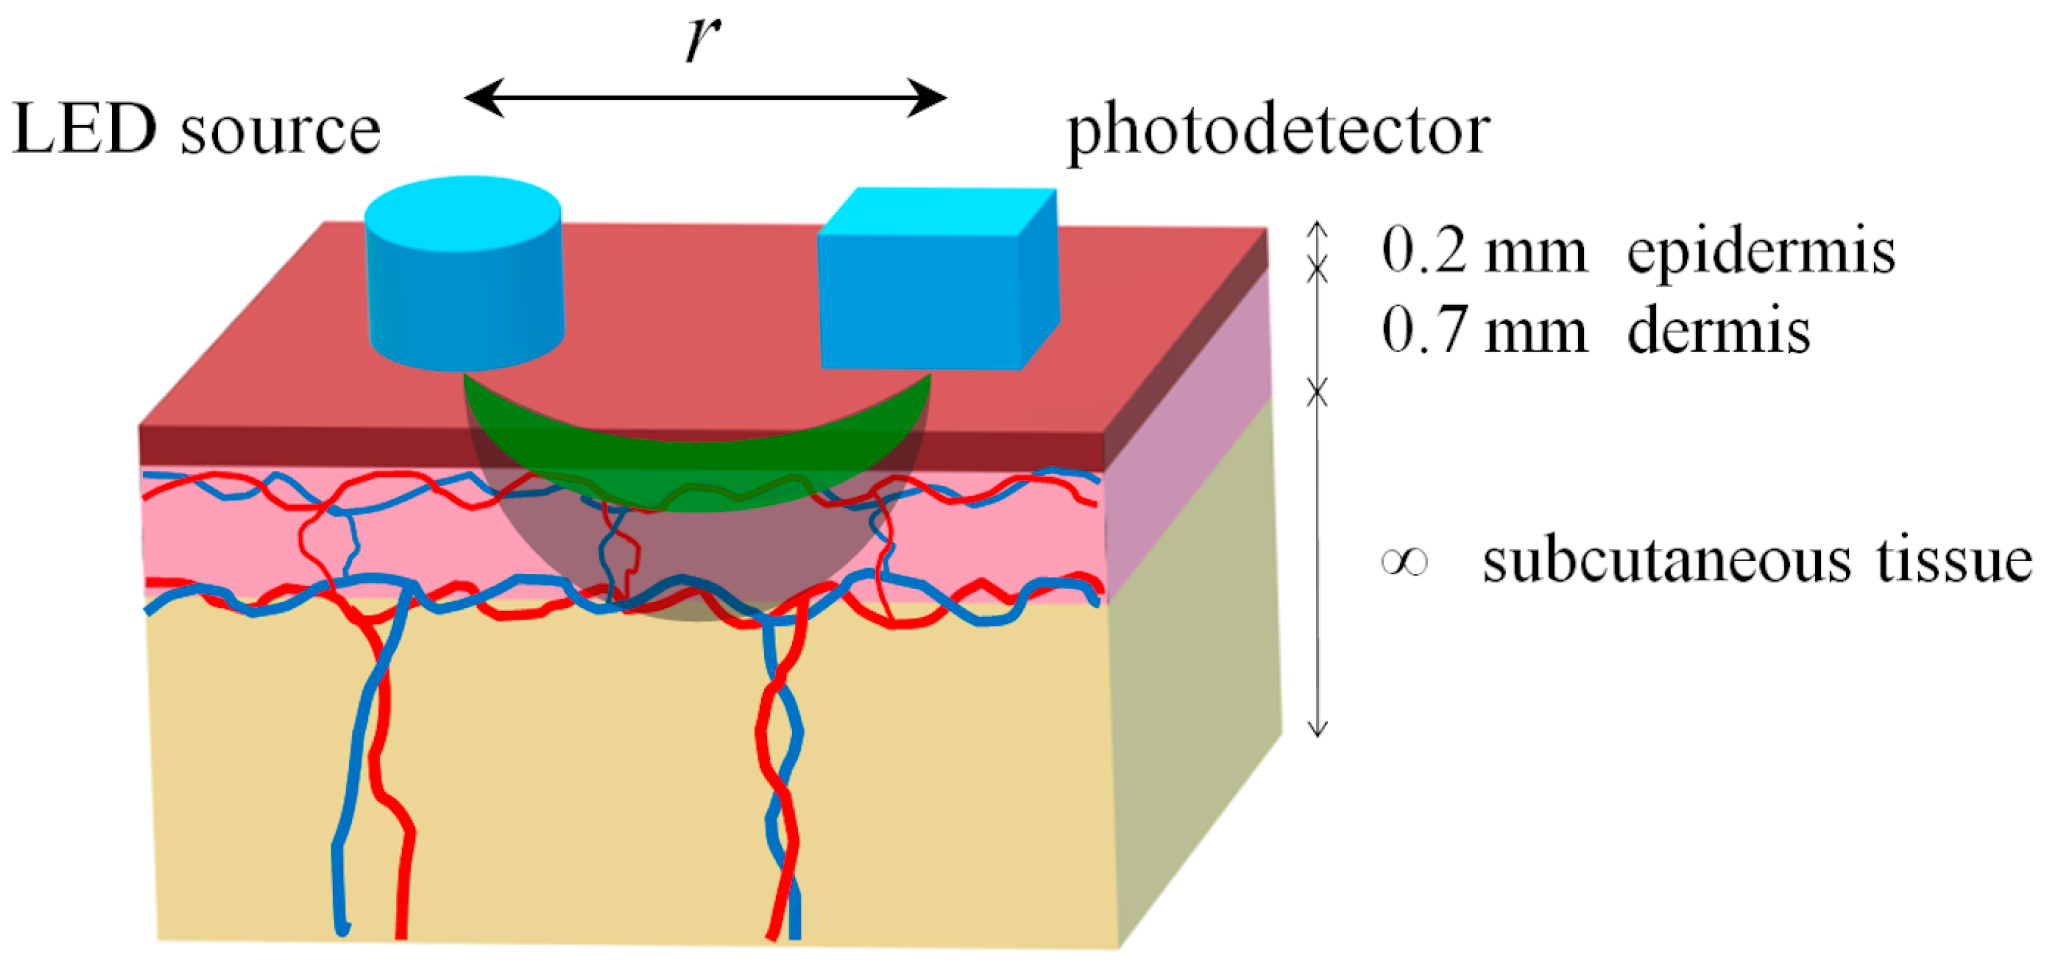
2.1. Optical Model of the Tissue
2.2. Modeling of Variable Blood Volume
2.3. Modeling of RBC Aggregation
2.4. Monte Carlo Simulation Parameters
2.5. Modified Beer–Lambert Law Usage
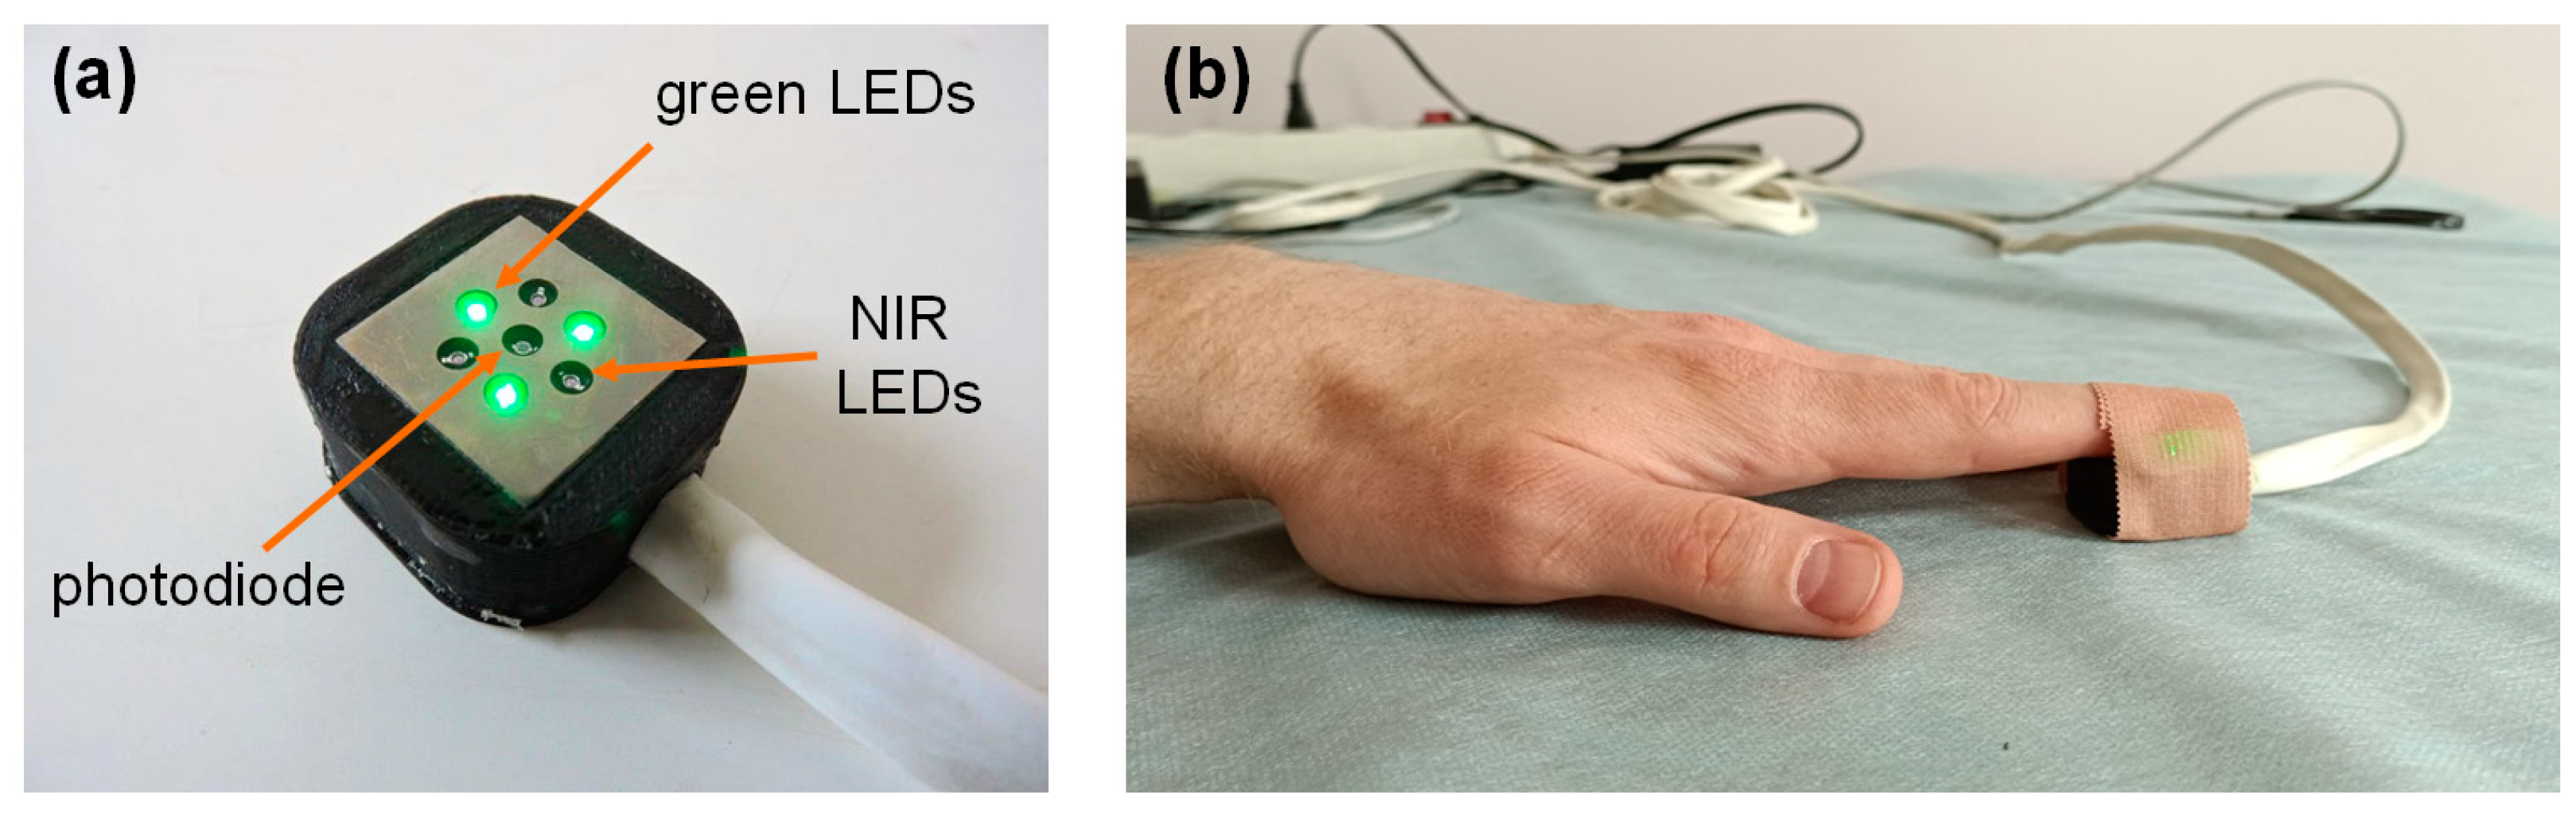
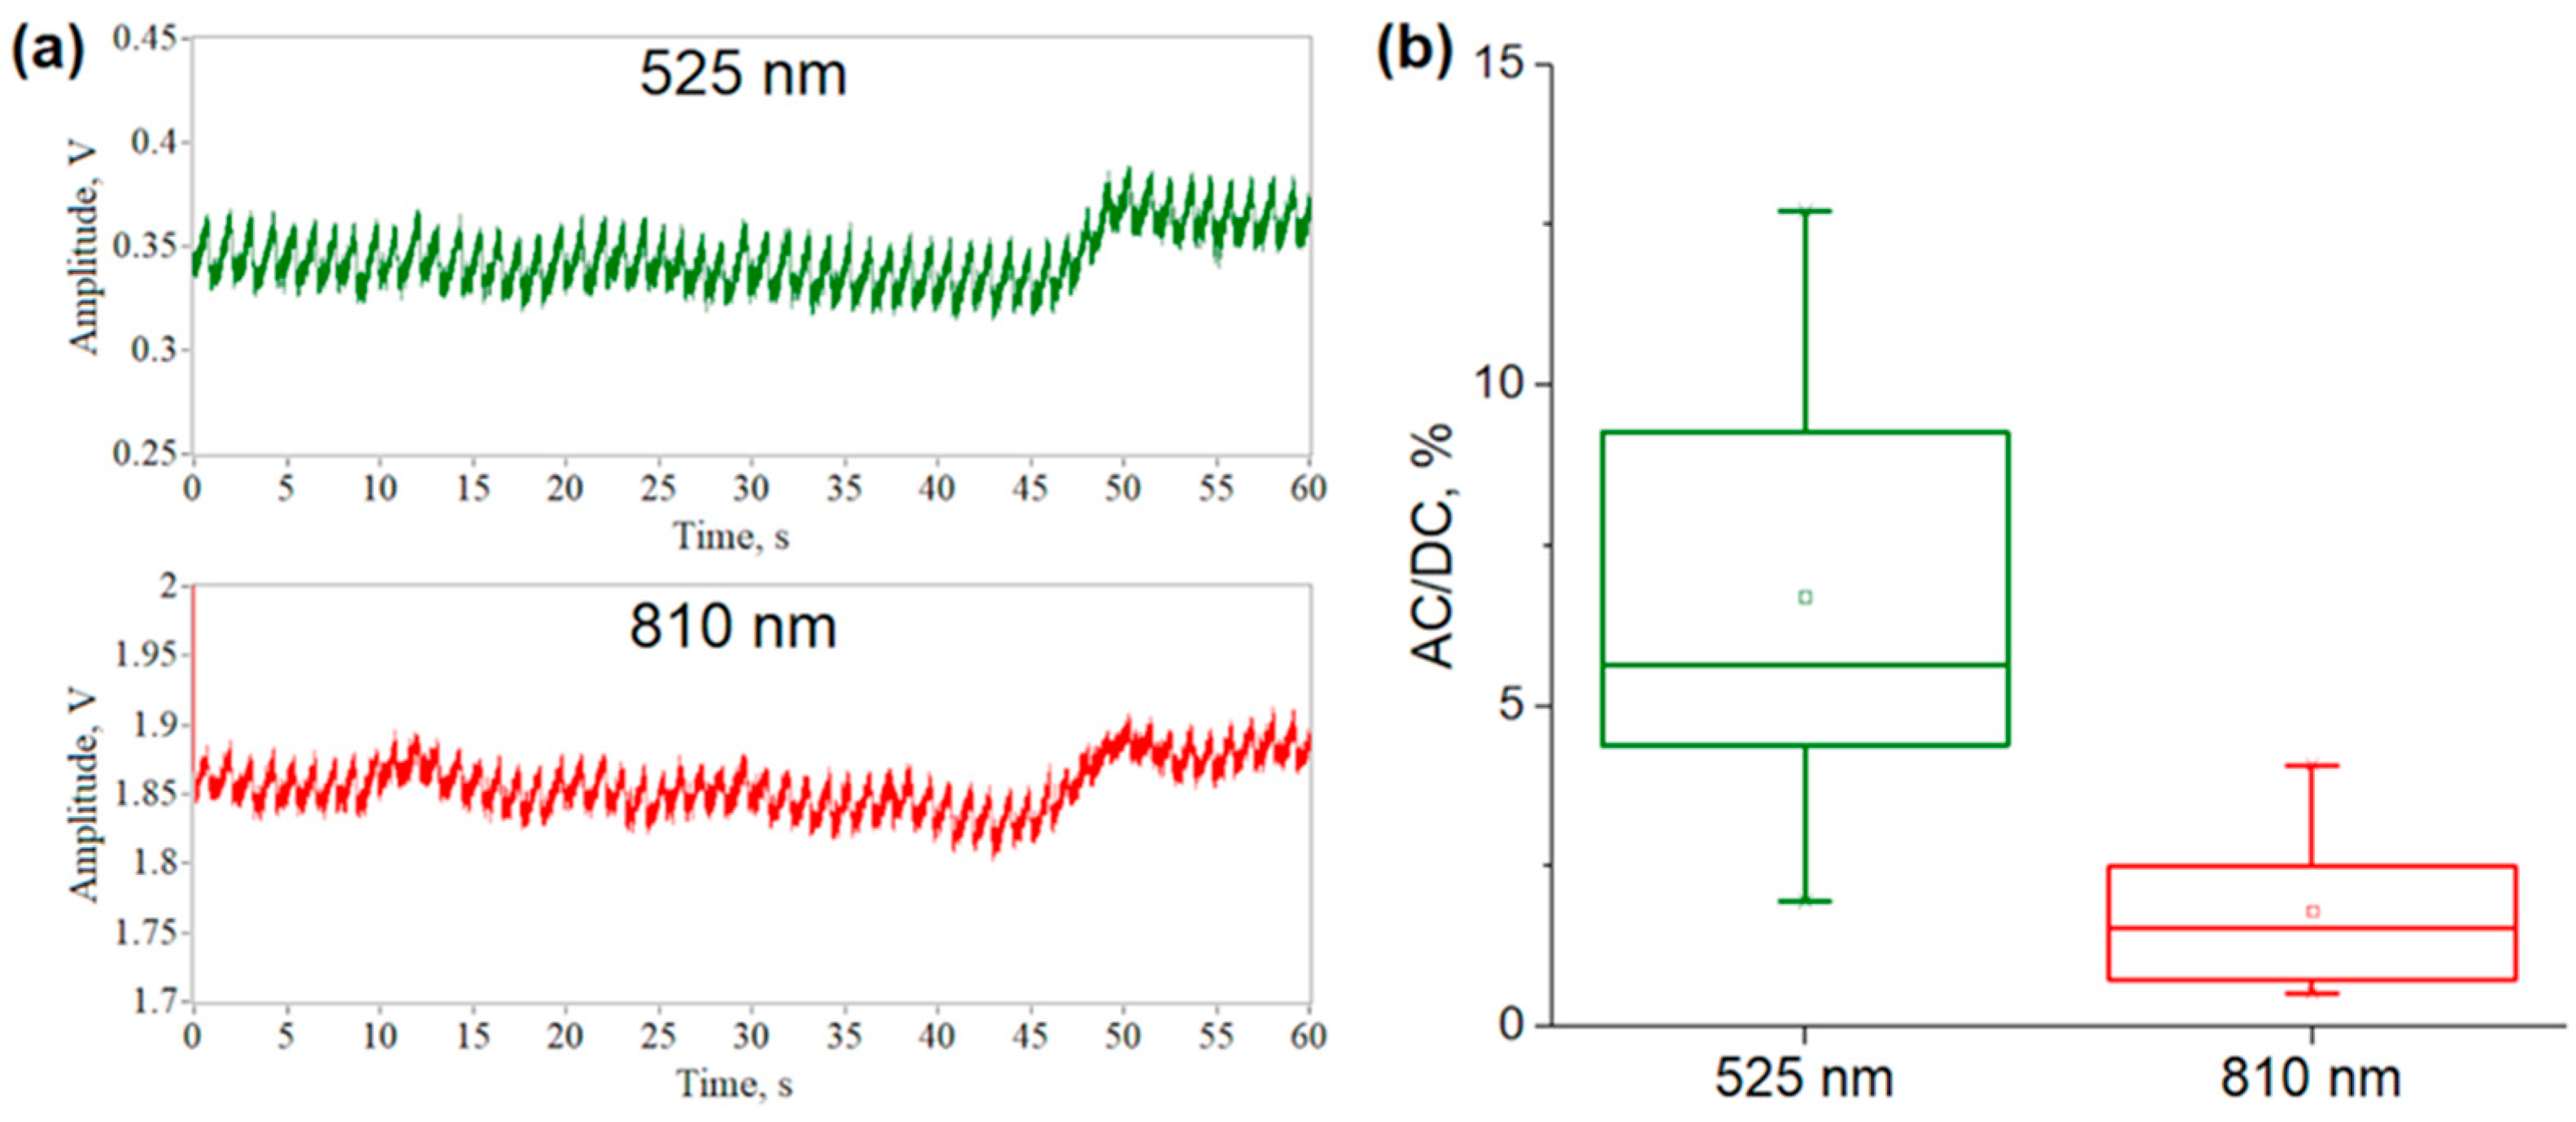
2.6. Clinical PPG Data Collection
3. Results
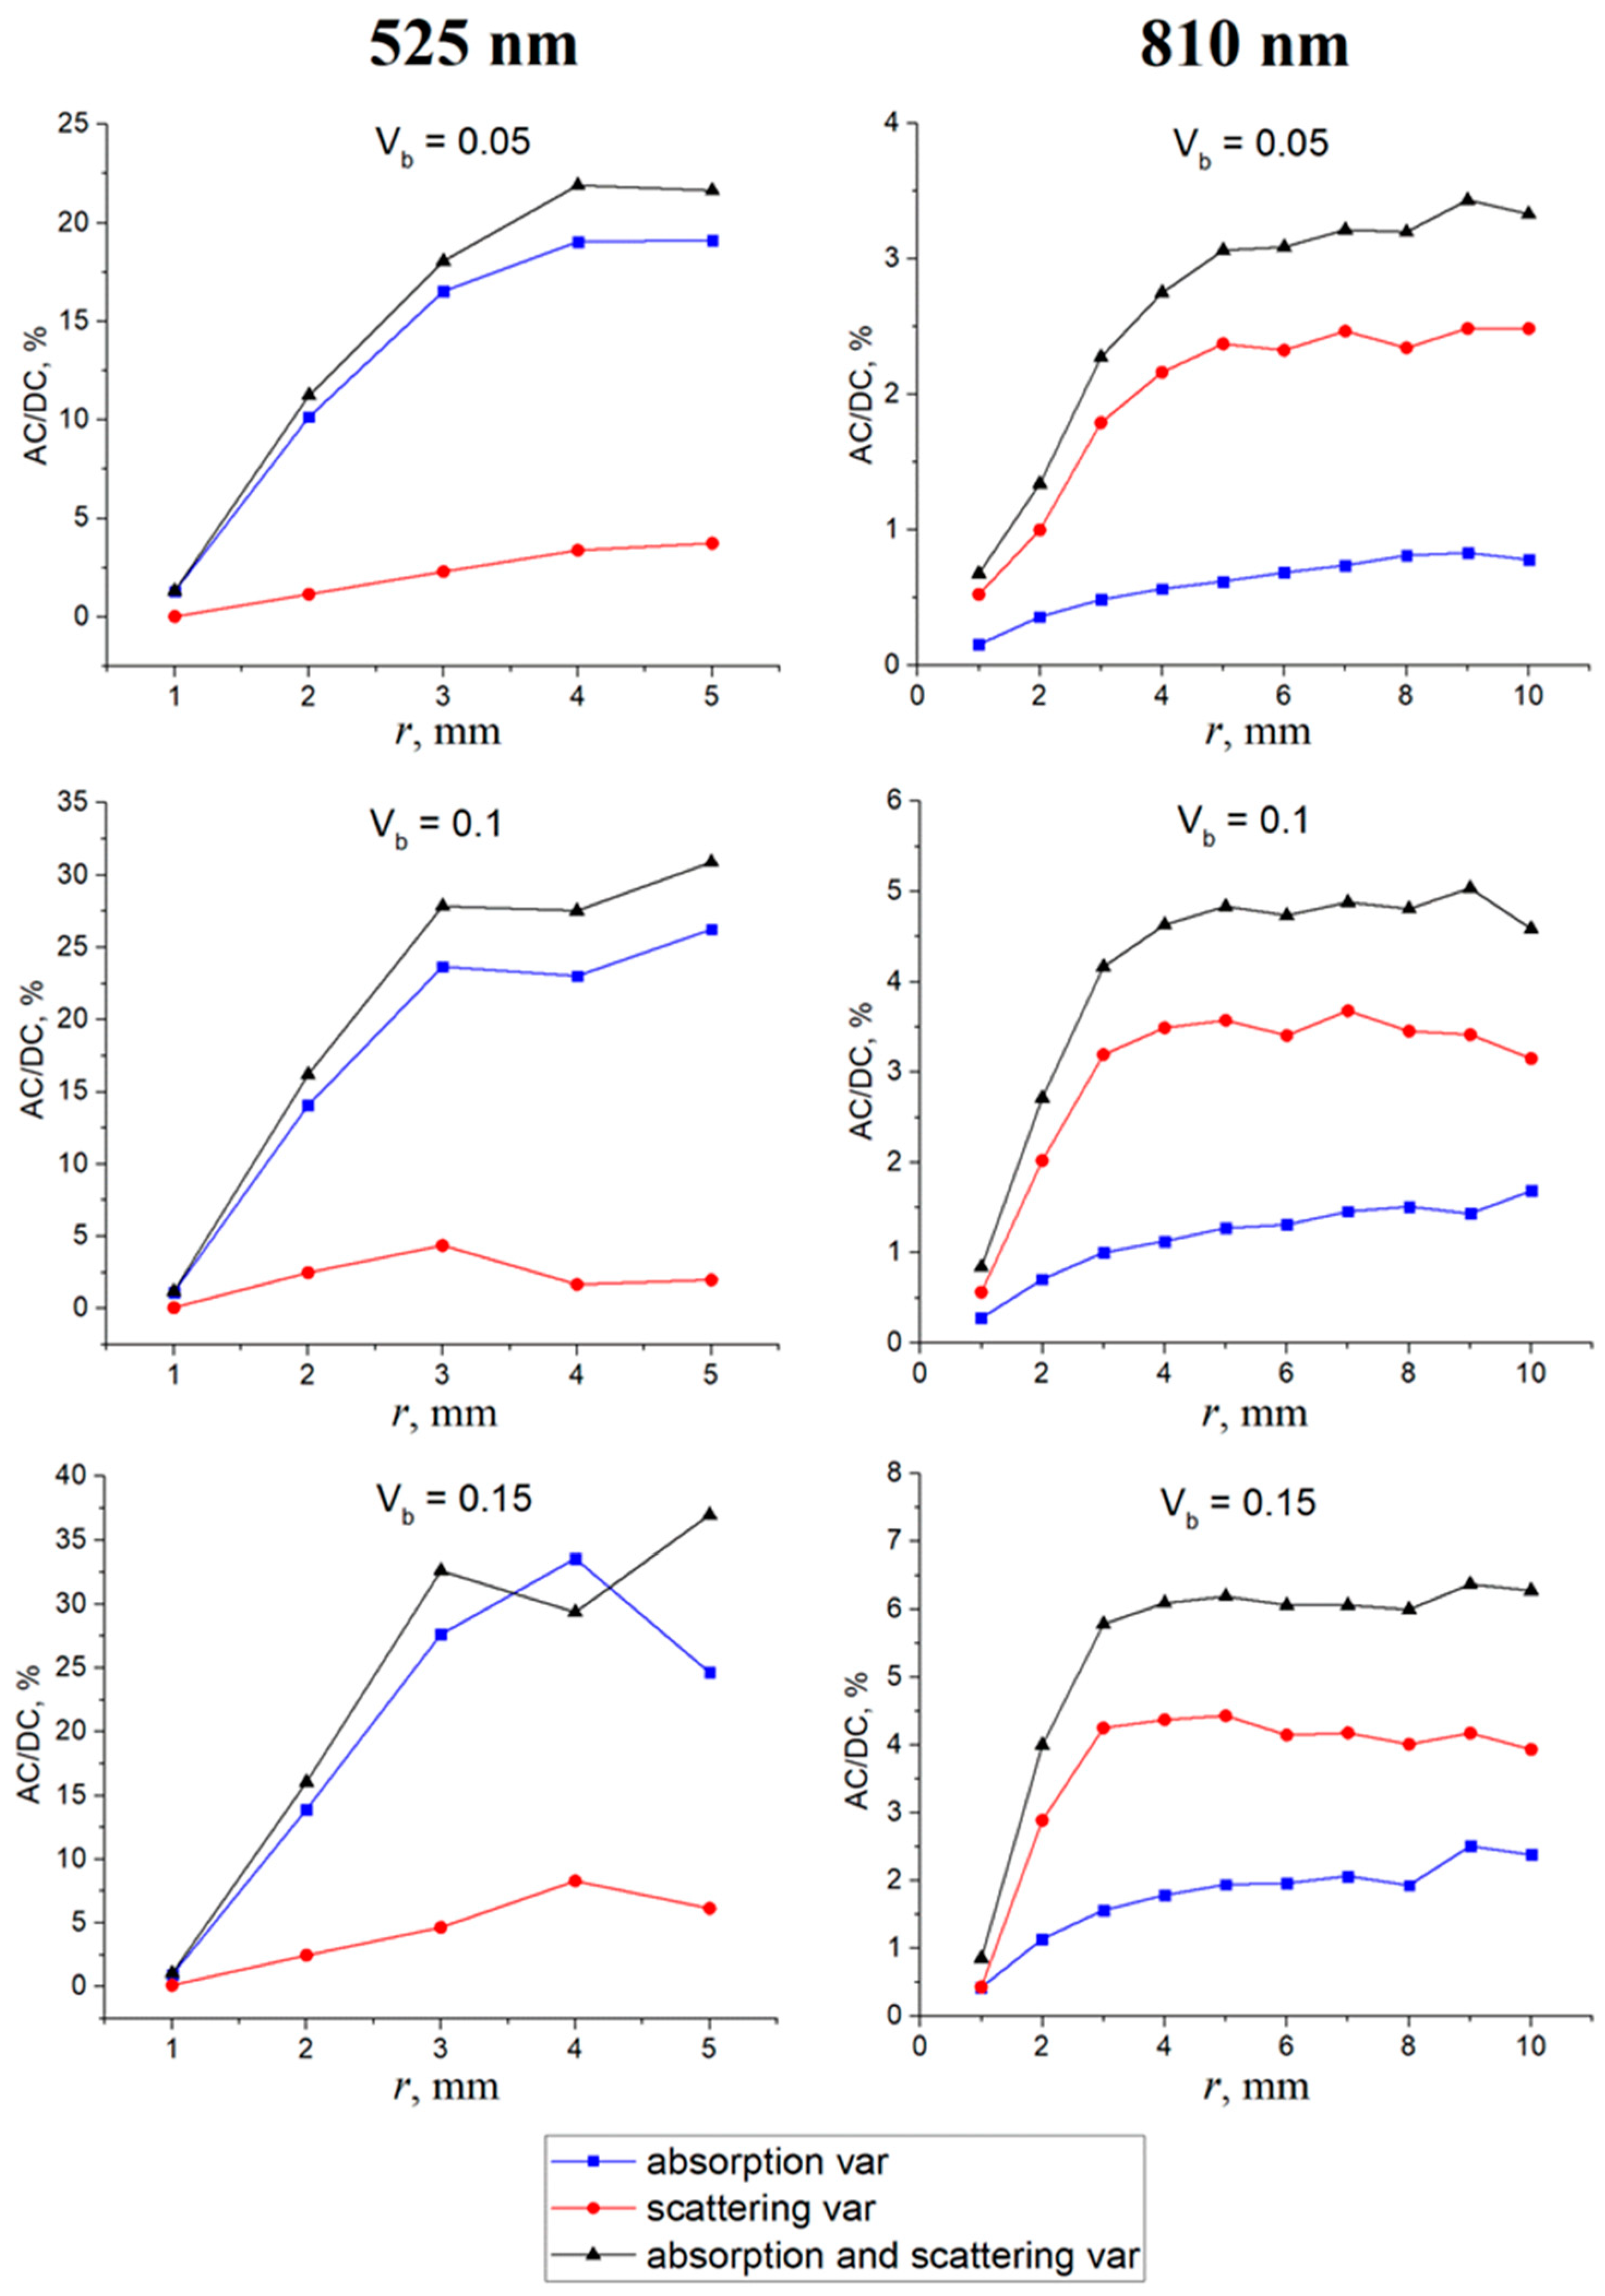
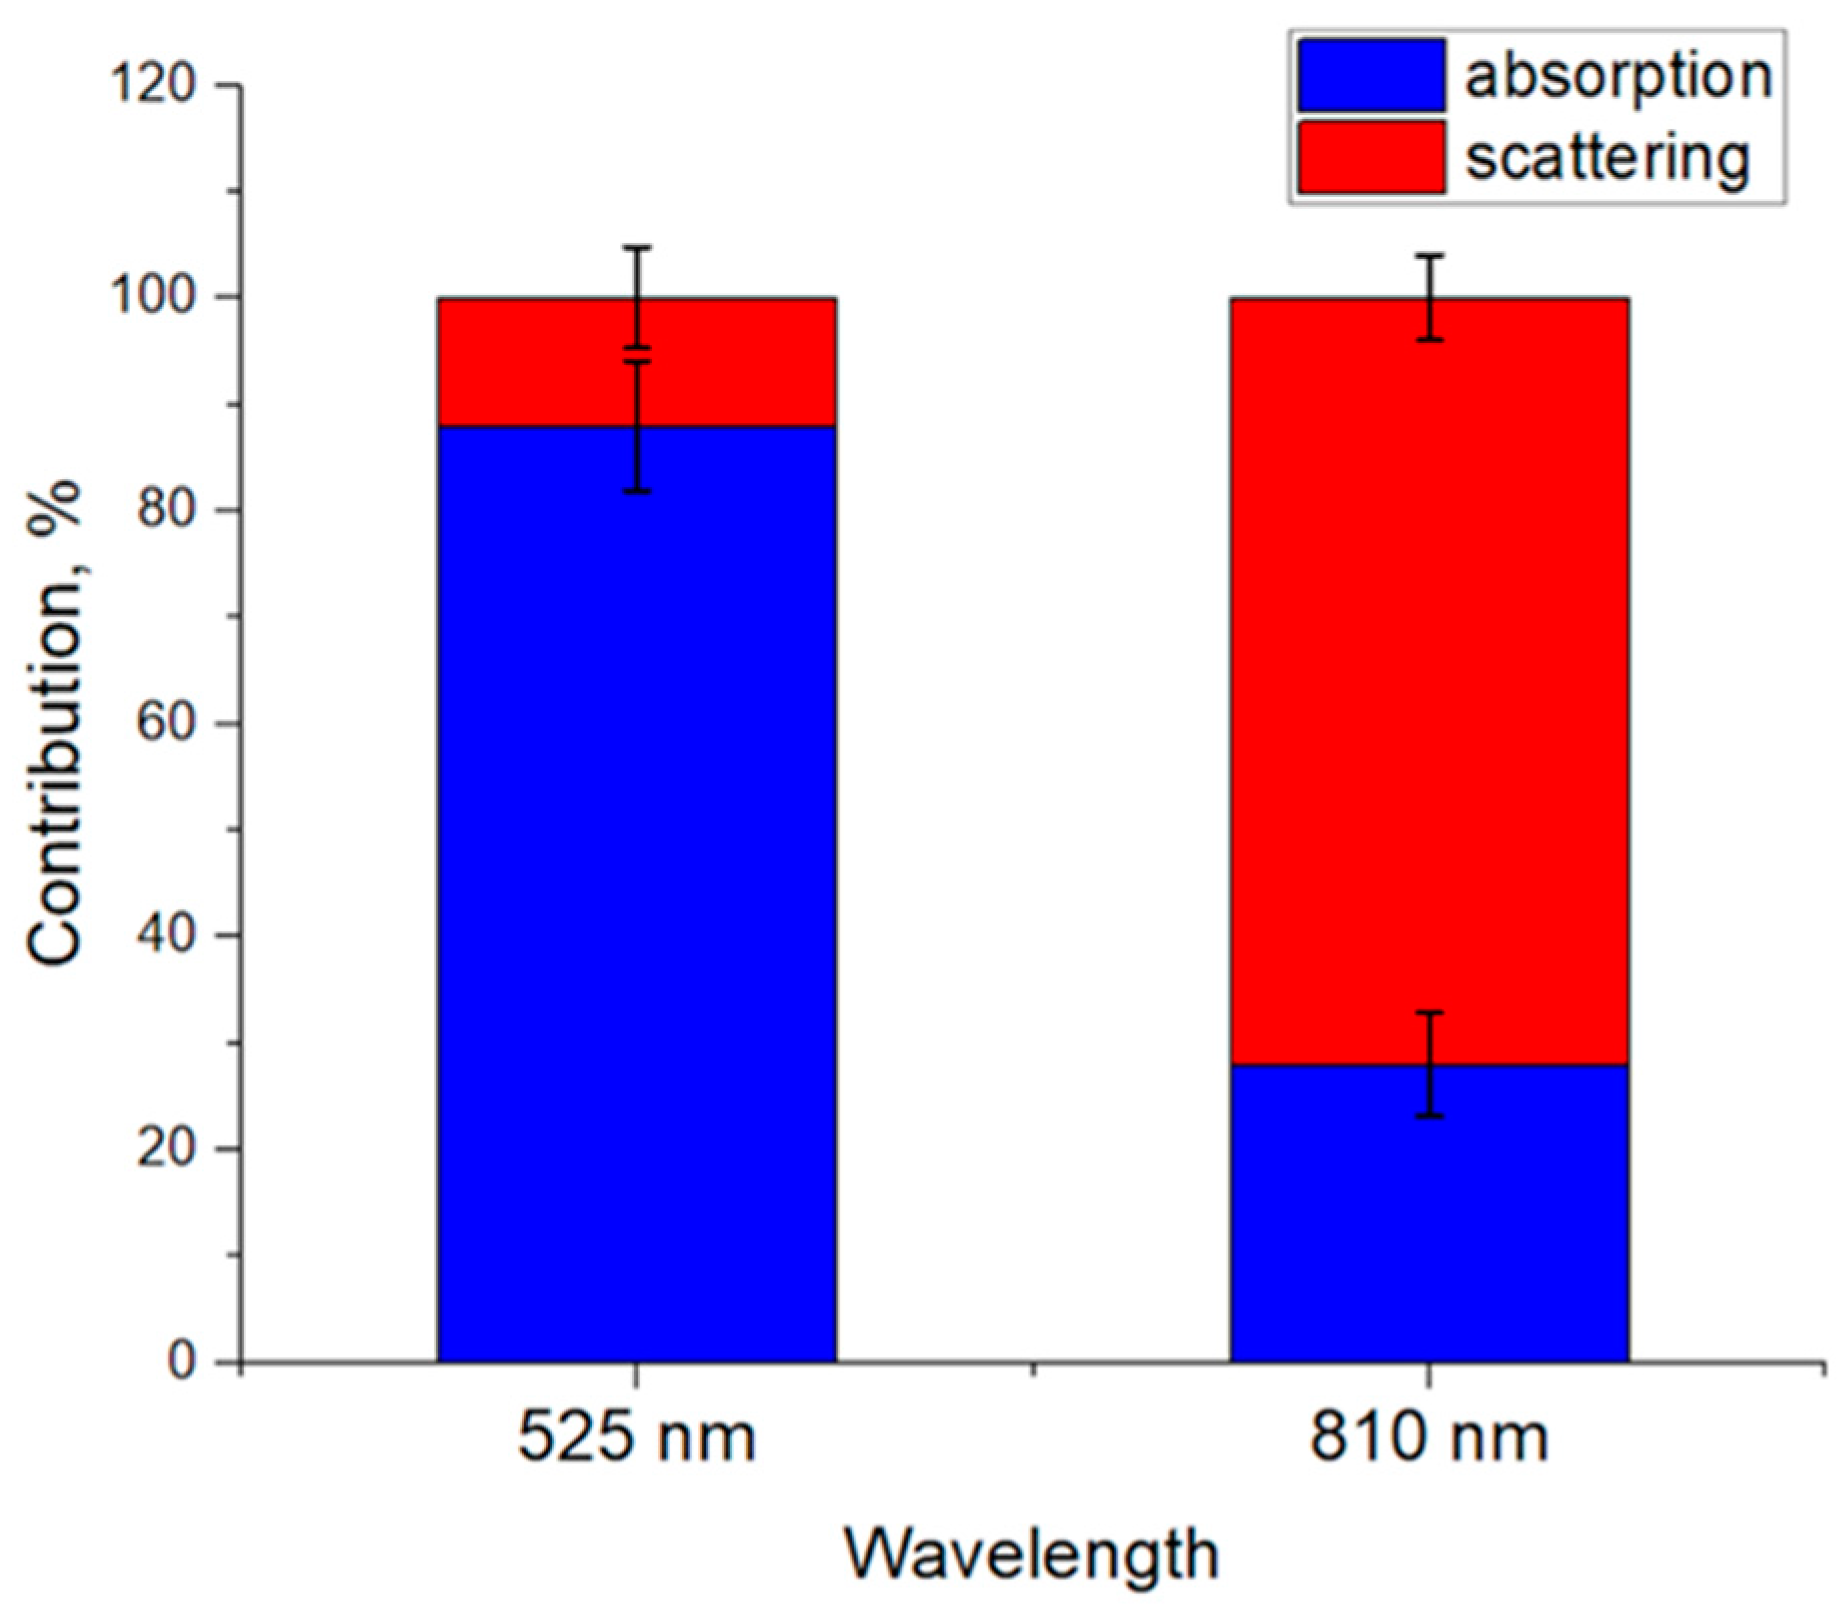
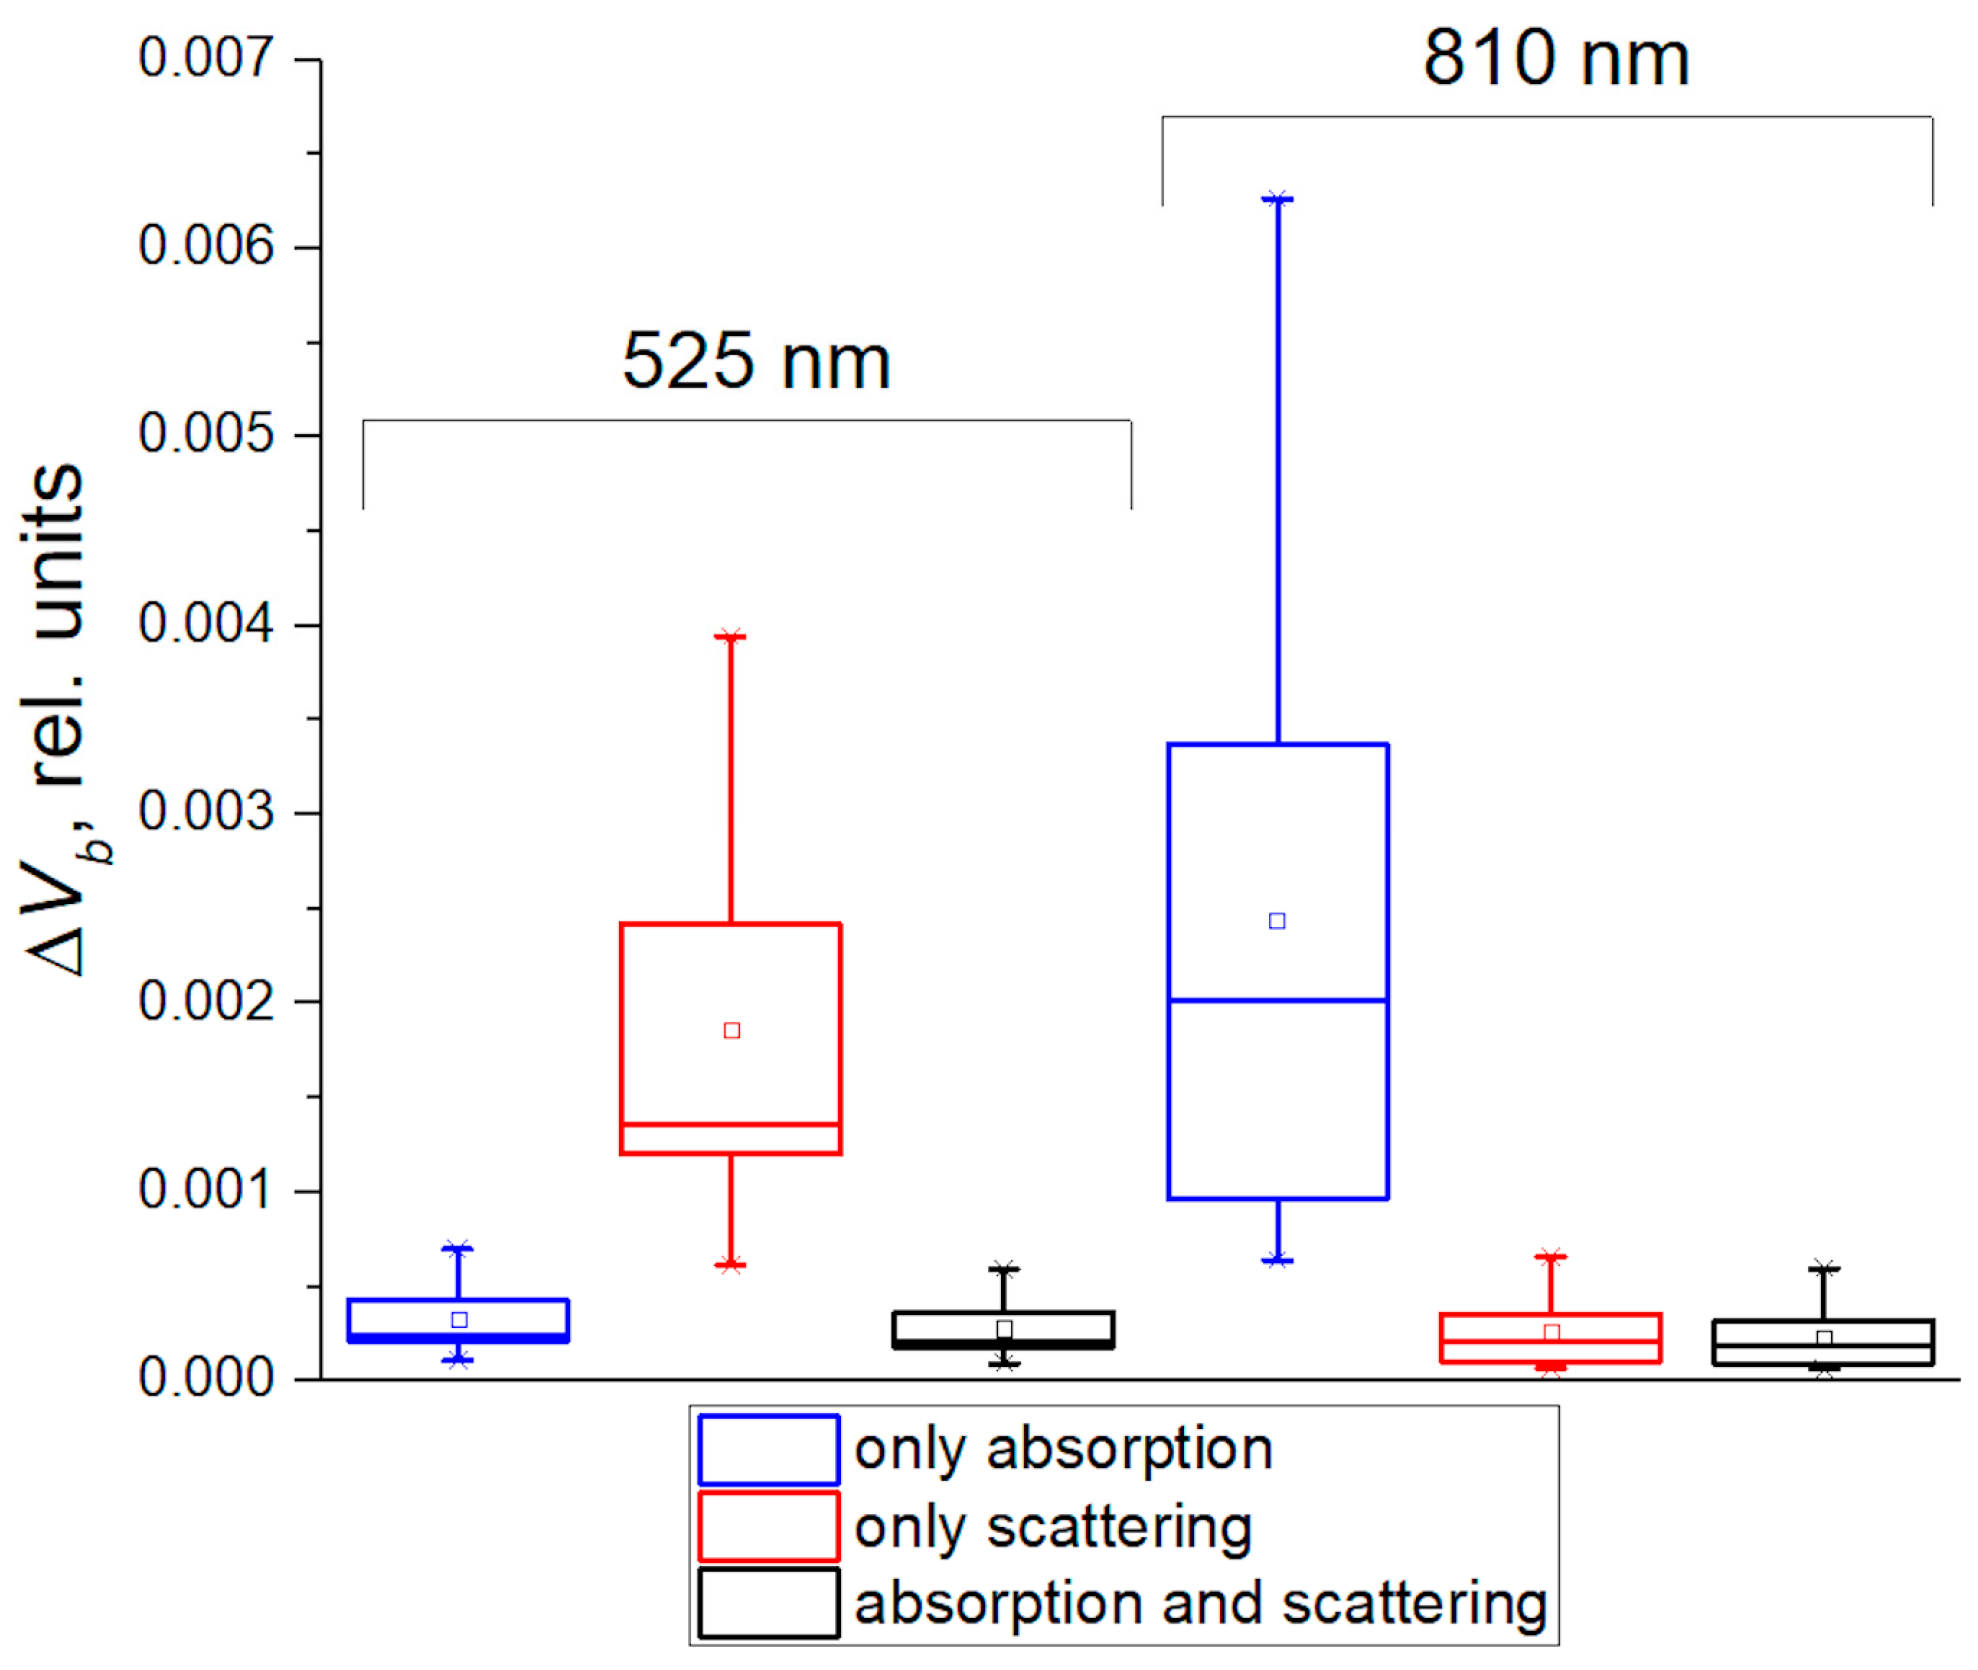
3.1. Contribution of Absorption and Scattering Variations to the PPG Signal
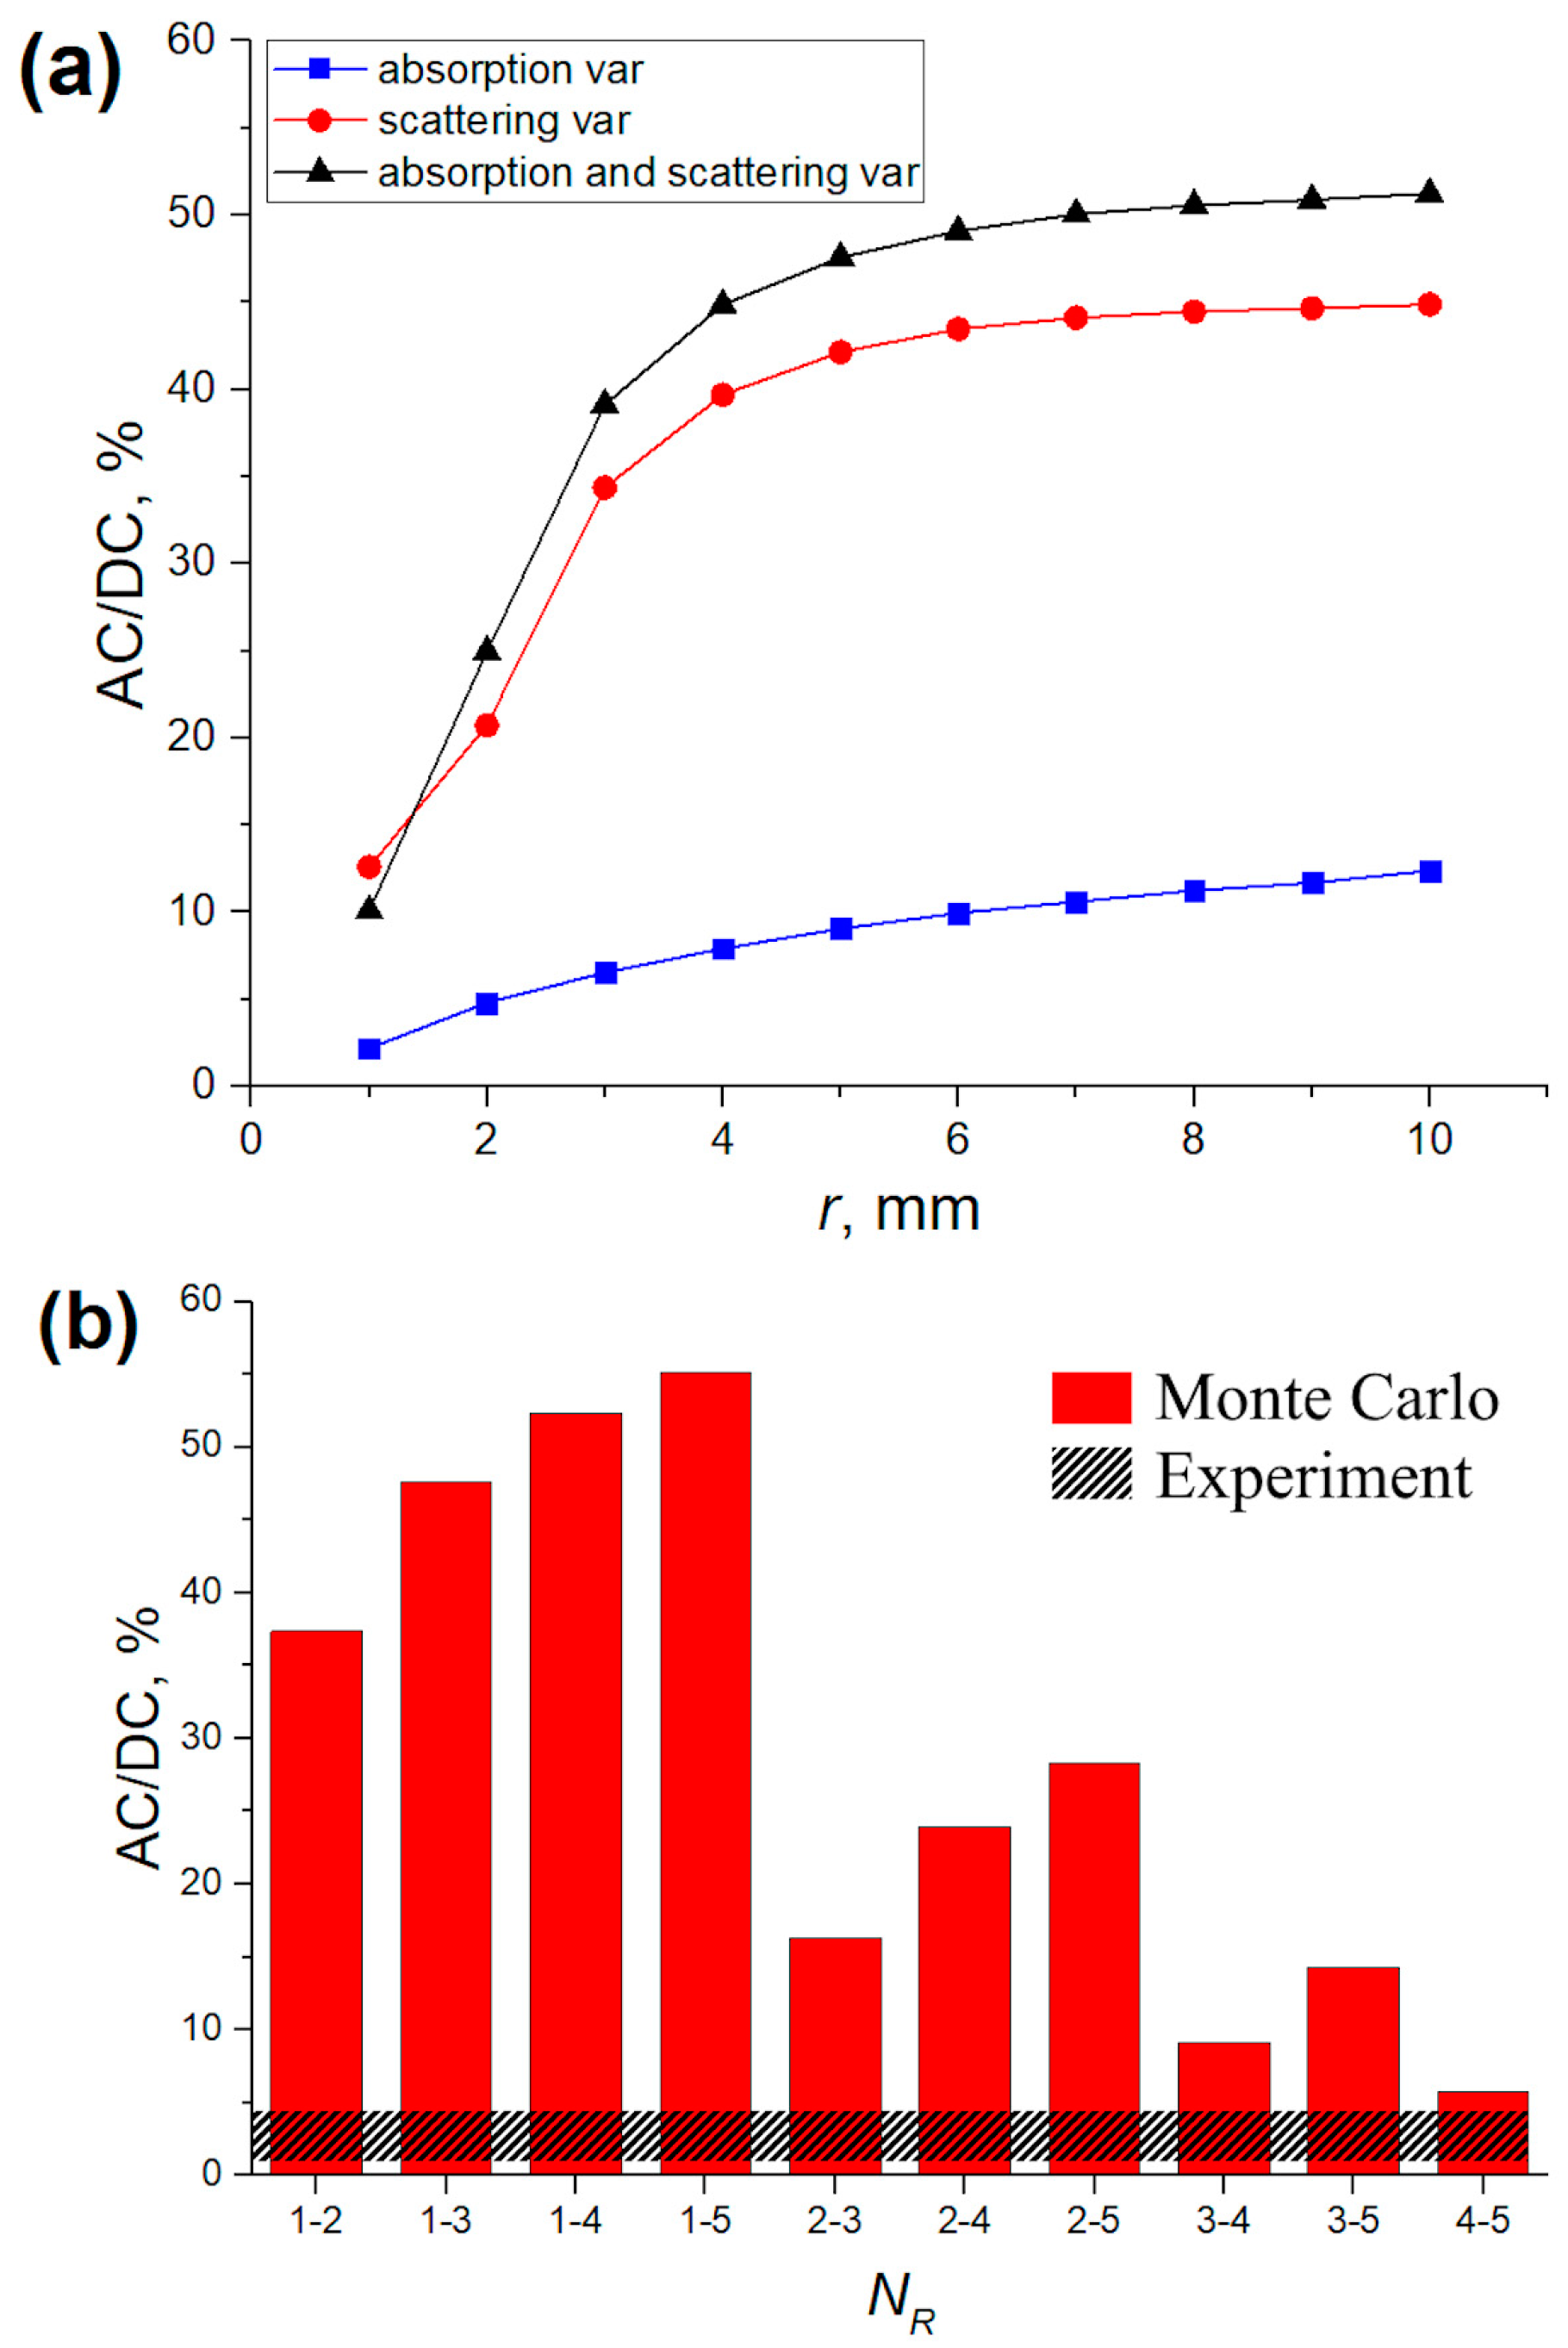
3.2. Verification of MC Results Using Experimental Data and MBLL
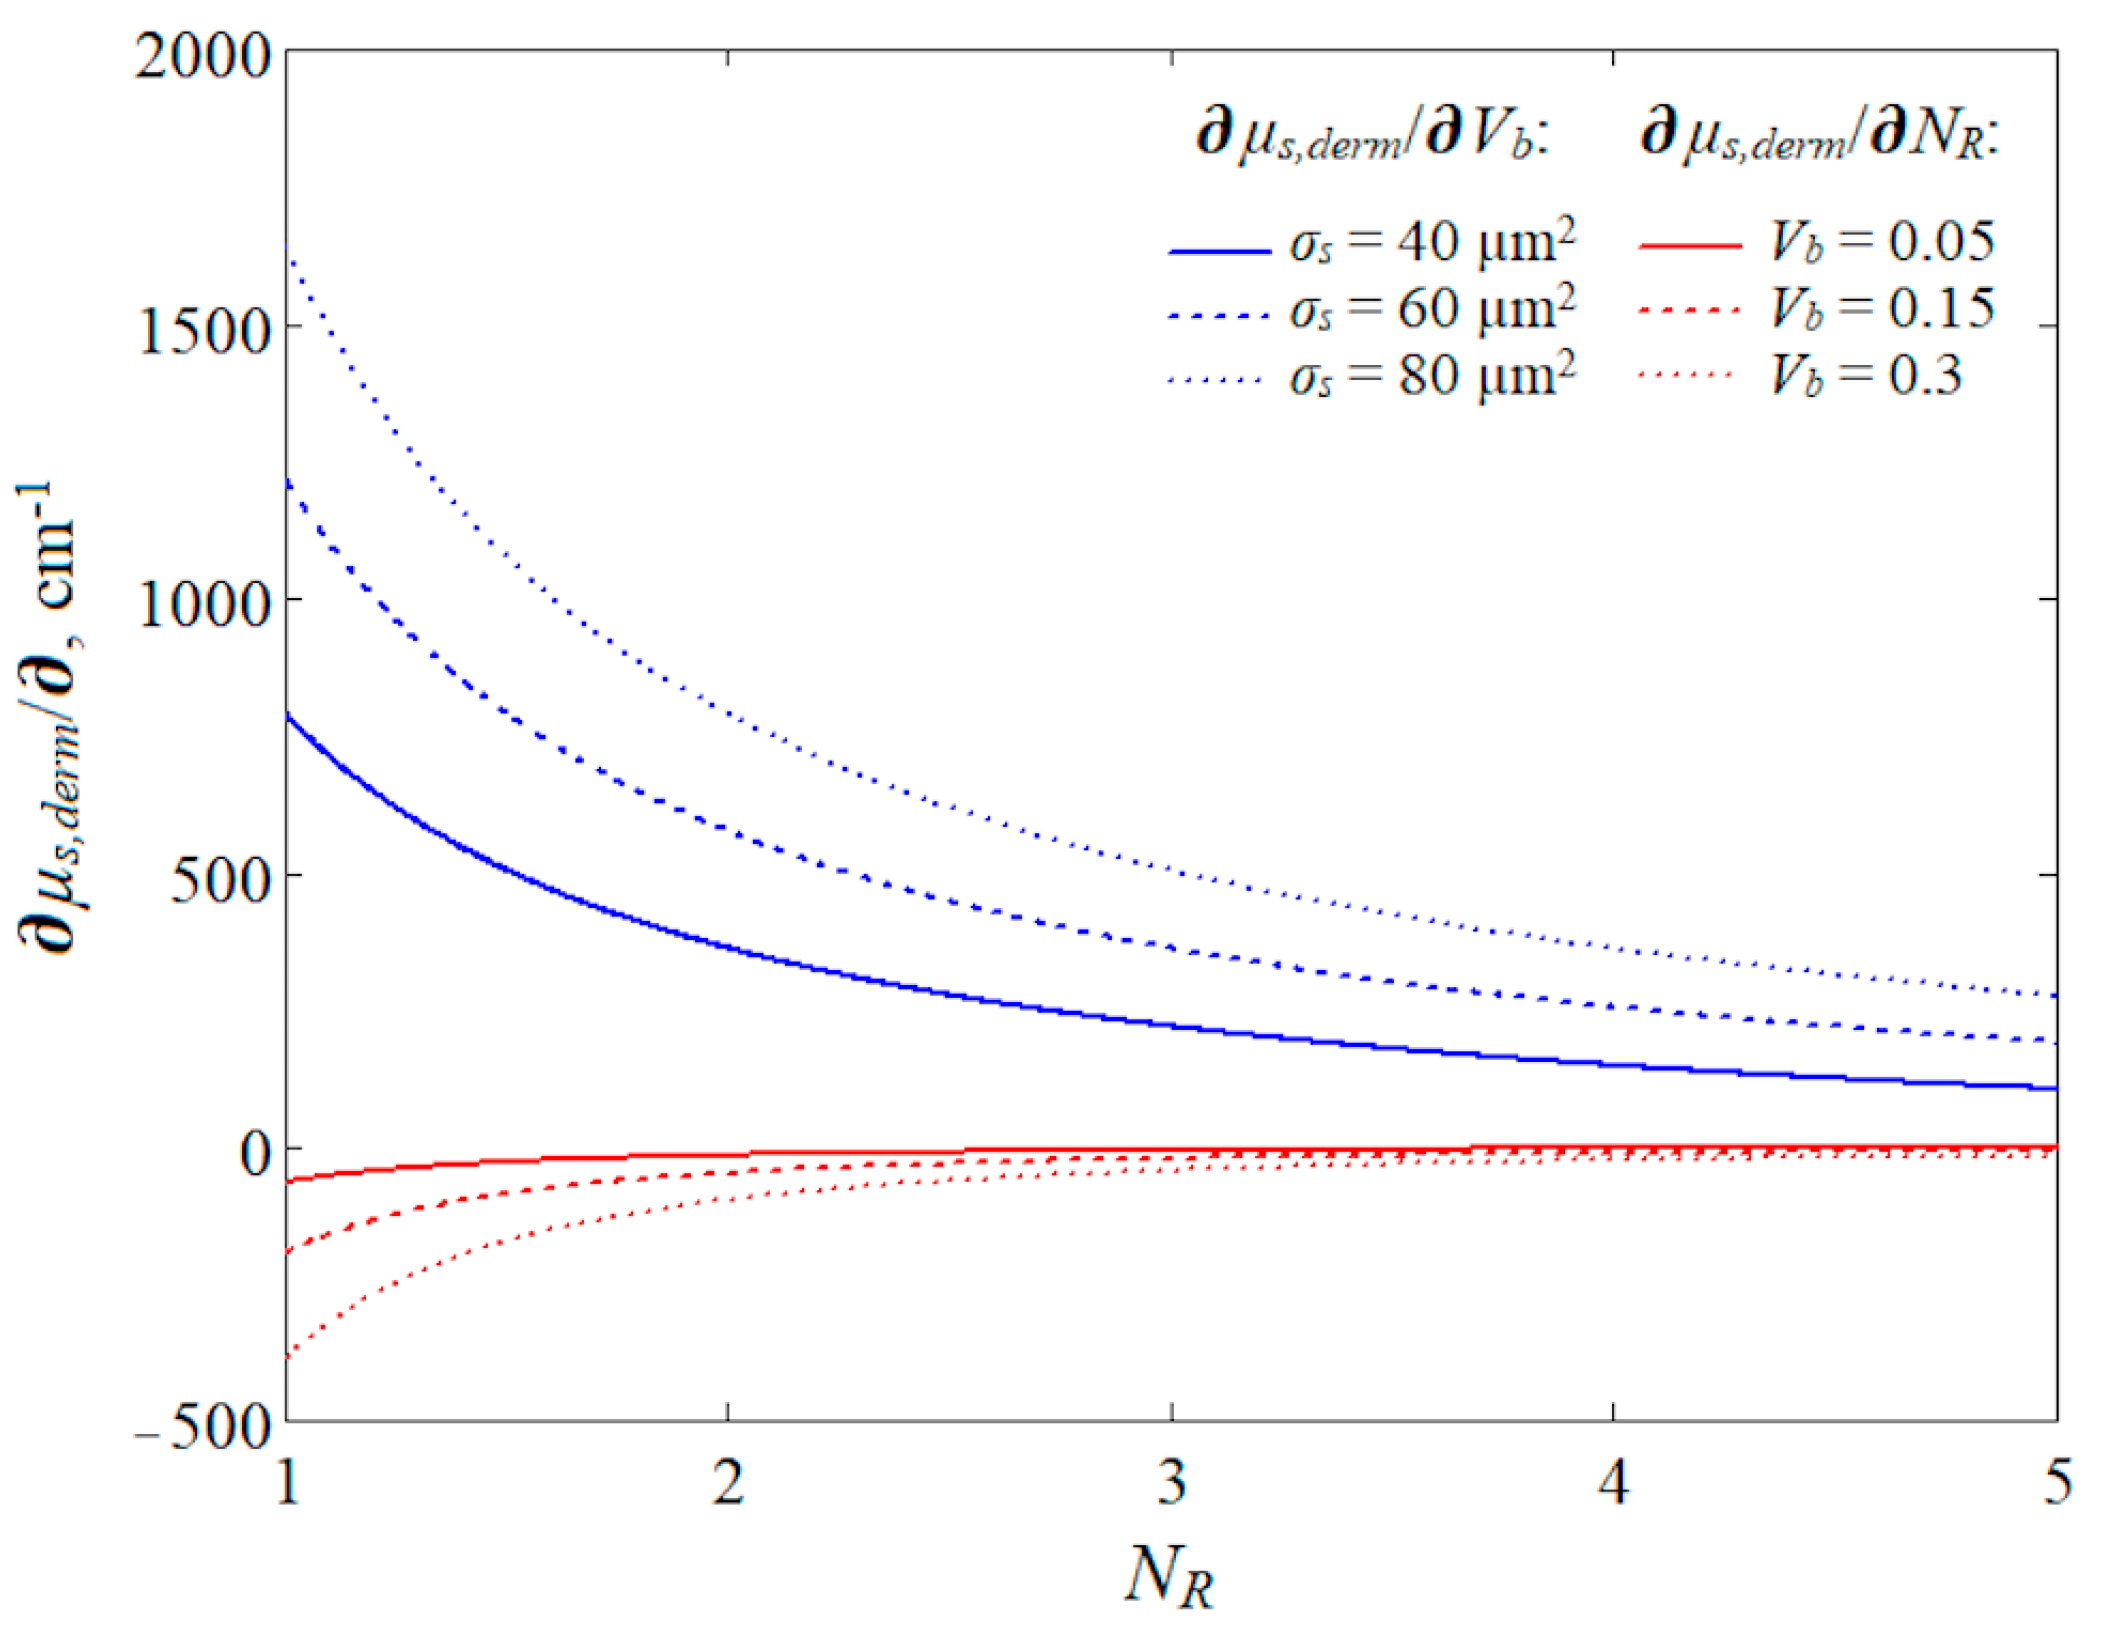
3.3. Modeling of the Aggregation Effect for NIR Light
4. Discussion
5. Conclusions
Author Contributions
Funding
Institutional Review Board Statement
Informed Consent Statement
Data Availability Statement
Conflicts of Interest
References
- Allen, J. Photoplethysmography and its application in clinical physiological measurement. Physiol. Meas. 2007, 28, R1–R39. [Google Scholar] [CrossRef] [PubMed]
- Kamal, A.A.R.; Harness, J.B.; Irving, G.; Mearns, A.J. Skin photoplethysmography—A review. Comput. Methods Programs Biomed. 1989, 28, 257–269. [Google Scholar] [CrossRef] [PubMed]
- Elgendi, M. On the analysis of fingertip photoplethysmogram signals. Curr. Cardiol. Rev. 2012, 8, 14–25. [Google Scholar] [CrossRef]
- Kyriacou, P.A.; Chatterjee, S. The origin of photoplethysmography. In Photoplethysmography; Allen, J., Kyriacou, P., Eds.; Academic Press: New York, NY, USA, 2022; pp. 17–43. [Google Scholar]
- Reisner, A.; Shaltis, P.A.; McCombie, D.; Asada, H.H.; Warner, D.S.; Warner, M.A. Utility of the photoplethysmogram in circulatory monitoring. J. Amer. Soc. Anesth. 2008, 108, 950–958. [Google Scholar] [CrossRef] [PubMed]
- Moço, A.V.; Stuijk, S.; de Haan, G. New insights into the origin of remote PPG signals in visible light and infrared. Sci. Rep. 2018, 8, 8501. [Google Scholar] [CrossRef]
- Nijboer, J.A.; Dorlas, J.C.; Mahieu, H.F. Photoelectric plethysmography-some fundamental aspects of the reflection and transmission methods. Clin. Phys. Physiol. Meas. 1981, 2, 205. [Google Scholar] [CrossRef]
- Lindberg, L.G.; Oberg, P.A. Optical properties of blood in motion. Opt. Exp. 1993, 32, 253–257. [Google Scholar] [CrossRef]
- Shvartsman, L.D.; Fine, I. Optical transmission of blood: Effect of erythrocyte aggregation. IEEE Trans. Biomed. Eng. 2003, 50, 1026–1033. [Google Scholar] [CrossRef]
- Fine, I.; Kaminsky, A. Scattering-driven PPG signal model. Biomed. Opt. Exp. 2022, 13, 2286–2298. [Google Scholar] [CrossRef]
- Njoum, H.; Kyriacou, P.A. Photoplethysmography for the Assessment of Haemorheology. Sci. Rep. 2017, 7, 1406. [Google Scholar] [CrossRef]
- Kamshilin, A.A.; Nippolainen, E.; Sidorov, I.S.; Vasilev, P.V.; Erofeev, N.P.; Podolian, N.P.; Romashko, R.V. A new look at the essence of the imaging photoplethysmography. Sci. Rep. 2015, 5, 10494. [Google Scholar] [CrossRef] [PubMed]
- Chatterjee, S.; Budidha, K.; Kyriacou, P. Investigating the origin of photoplethysmography using a multiwavelength Monte Carlo model. Physiol. Meas. 2020, 41, 084001. [Google Scholar] [CrossRef]
- Mejia-Mejia, E.; Allen, J.; Budidha, K.; El-Hajj, C.; Kyriacou, P.A.; Charlton, P.H. Photoplethysmography signal processing and synthesis. In Photoplethysmography; Academic Press: New York, NY, USA, 2022; pp. 69–146. [Google Scholar] [CrossRef]
- Merlo, S.; Bello, V.; Bodo, E.; Pizzurro, S. A VCSEL-Based NIR Transillumination System for Morpho-Functional Imaging. Sensors 2019, 19, 851. [Google Scholar] [CrossRef] [PubMed]
- Nitzan, M.; Ovadia-Blechman, Z. Physical and physiological interpretations of the PPG signal. In Photoplethysmography; Academic Press: New York, NY, USA, 2022; pp. 319–340. [Google Scholar] [CrossRef]
- Moscato, S.; Palmerini, L.; Palumbo, P.; Chiari, L. Quality Assessment and Morphological Analysis of Photoplethysmography in Daily Life. Front. Digit. Health 2022, 4, 912353. [Google Scholar] [CrossRef] [PubMed]
- Boonya-Ananta, T.; Rodriguez, A.J.; Ajmal, A.; Du Le, V.N.; Hansen, A.K.; Hutcheson, J.D.; Ramella-Roman, J.C. Synthetic photoplethysmography (PPG) of the radial artery through parallelized Monte Carlo and its correlation to body mass index (BMI). Sci. Rep. 2021, 11, 2570. [Google Scholar] [CrossRef] [PubMed]
- Lapitan, D.G.; Tarasov, A.P.; Rogatkin, D.A. Justification of the photoplethysmography sensor configuration by Monte Carlo modeling of the pulse waveform. J. Biomed. Photonics Eng. 2022, 8, 030306. [Google Scholar] [CrossRef]
- Lapitan, D.G.; Tarasov, A.P.; Rogatkin, D.A. Dependence of the registered blood flow in incoherent optical fluctuation flowmetry on the mean photon path length in a tissue. Photonics 2023, 10, 190. [Google Scholar] [CrossRef]
- Reuss, J.L. Multilayer modeling of reflectance pulse oximetry. IEEE Trans. Biomed. Eng. 2005, 52, 153–159. [Google Scholar] [CrossRef] [PubMed]
- Jacques, S.L. Skin Optics Summary. Oregon Medical Laser Center News. 1998. Available online: https://omlc.org/news/jan98/skinoptics.html (accessed on 23 November 2023).
- Saidi, I.S. Transcutaneous Optical Measurement of Hyperbilirubinemia in Neonates. PhD. Thesis, Rice University, Houston, TX, USA, 1992. [Google Scholar]
- Meglinski, I.V.; Matcher, S.J. Computer simulation of the skin reflectance spectra. Comput. Methods Programs Biomed. 2003, 70, 179–186. [Google Scholar] [CrossRef]
- Jacques, S.L. Optical properties of biological tissues: A review. Phys. Med. Biol. 2013, 58, R37–R61. [Google Scholar] [CrossRef]
- Cui, W.; Ostrander, L.E.; Lee, B.Y. In vivo reflectance of blood and tissue as a function of light wavelength. IEEE Trans. Biomed. Eng. 1990, 37, 632–639. [Google Scholar] [CrossRef] [PubMed]
- Chatterjee, S.; Kyriacou, P.A. Monte Carlo Analysis of Optical Interactions in Reflectance and Transmittance Finger Photoplethysmography. Sensors 2019, 19, 789. [Google Scholar] [CrossRef] [PubMed]
- Yeom, E.; Lee, S.J. Microfluidic-based speckle analysis for sensitive measurement of erythrocyte aggregation: A comparison of four methods for detection of elevated erythrocyte aggregation in diabetic rat blood. Biomicrofluidics 2015, 9, 024110. [Google Scholar] [CrossRef]
- Wang, L.; Jacques, S.L.; Zheng, L. MCML—Monte Carlo modeling of light transport in multi-layered tissues. Comput. Meth. Programs Biomed. 1995, 47, 131–146. [Google Scholar] [CrossRef]
- Tarasov, A.P. Acceleration of Monte Carlo simulation of light transport in tissues using disk-detector geometry in the backscattering problem. In Proceeding of the 2020 International Conference Laser Optics (ICLO), St. Petersburg, Russia, 2–6 November 2020; p. 1. [Google Scholar] [CrossRef]
- Bosschaart, N.; Edelman, G.J.; Aalders, M.C.; van Leeuwen, T.G.; Faber, D.J. A literature review and novel theoretical approach on the optical properties of whole blood. Lasers Med. Sci. 2014, 29, 453–479. [Google Scholar] [CrossRef] [PubMed]
- Hale, G.M.; Querry, M.R. Optical constants of water in the 200-nm to 200-m wavelength region. Appl. Opt. 1973, 12, 555–563. [Google Scholar] [CrossRef] [PubMed]
- Simpson, C.R.; Kohl, M.; Essenpreis, M.; Cope, M. Near-infrared optical properties of ex vivo human skin and subcutaneous tissues measured using the Monte Carlo inversion technique. Phys. Med. Biol. 1998, 43, 2465–2478. [Google Scholar] [CrossRef] [PubMed]
- Salomatina, E.; Jiang, B.; Novak, J.; Yaroslavsky, A.N. Optical properties of normal and cancerous human skin in the visible and near-infrared spectral range. J. Biomed. Opt. 2006, 11, 064026. [Google Scholar] [CrossRef]
- Bi, L.; Yang, P. Modeling of light scattering by biconcave and deformed red blood cells with the invariant imbedding T-matrix method. J. Biomed. Opt. 2013, 18, 055001. [Google Scholar] [CrossRef]
- Kocsis, L.; Herman, P.; Eke, A. The modified Beer–Lambert law revisited. Phys. Med. Biol. 2006, 51, N91. [Google Scholar] [CrossRef]
- Lapitan, D.G.; Rogatkin, D.A. Optical incoherent technique for noninvasive assessment of blood flow in tissues: Theoretical model and experimental study. J. Biophotonics 2021, 14, e202000459. [Google Scholar] [CrossRef] [PubMed]
- Lapitan, D.G.; Rogatkin, D.A.; Molchanova, E.A.; Tarasov, A.P. Estimation of phase distortions of the photoplethysmographic signal in digital IIR filtering. Sci. Rep. 2024, 14, 6546. [Google Scholar] [CrossRef] [PubMed]
- Lapitan, D.G.; Tarasov, A.P. Analytical assessment of the modulation depth of photoplethysmographic signal based on the modified Beer-Lambert law. In Proceedings of the 2019 IEEE 8th International Conference on Advanced Optoelectronics and Lasers (CAOL), Sozopol, Bulgaria, 6–8 September 2019; pp. 103–106. [Google Scholar] [CrossRef]
- Rovas, G.; Bikia, V.; Stergiopulos, N. Quantification of the Phenomena Affecting Reflective Arterial Photoplethysmography. Bioengineering 2023, 10, 460. [Google Scholar] [CrossRef] [PubMed]

| Layer | Optical Parameters | Anatomical Parameters | ||||||
|---|---|---|---|---|---|---|---|---|
| Parameter, cm−1 | Wavelength | Thickness, mm | Vmel, Rel. Units | Vw, Rel. Units | Vb, Rel. Units | |||
| 525 nm | 810 nm | |||||||
| Epidermis | μa | 29.689 | 7.066 | 0.2 | 0.05 | 0.2 | – | |
| μs | 308.5 | 183.9 | ||||||
| Dermis | μa | Vb,0 = 0.05 | 8.484 | 0.46 | 0.7 | – | 0.6 | var |
| Vb,0 = 0.1 | 16.529 | 0.653 | ||||||
| Vb,0 = 0.15 | 24.574 | 0.846 | ||||||
| μs | Vb,0 = 0.05 | 242.7 | 101.3 | |||||
| Vb,0 = 0.1 | 270.7 | 136 | ||||||
| Vb,0 = 0.15 | 298.6 | 170.8 | ||||||
| Subcutaneous tissue | μa | 8.717 | 1.349 | ∞ | – | 0.15 | 0.05 | |
| μs | 159.7 | 102.7 | ||||||
| Parameter | Value |
|---|---|
| σa,HbO2(λ), µm2 | 0.09 |
| σa,Hb(λ), µm2 | 0.08 |
| σs(λ), µm2 | 60 |
| H, rel. units | 0.45 |
| V0, µm3 | 90 |
| NR | 1, 2, 3, 4, 5 |
Disclaimer/Publisher’s Note: The statements, opinions and data contained in all publications are solely those of the individual author(s) and contributor(s) and not of MDPI and/or the editor(s). MDPI and/or the editor(s) disclaim responsibility for any injury to people or property resulting from any ideas, methods, instructions or products referred to in the content. |
© 2024 by the authors. Licensee MDPI, Basel, Switzerland. This article is an open access article distributed under the terms and conditions of the Creative Commons Attribution (CC BY) license (https://creativecommons.org/licenses/by/4.0/).
Share and Cite
Lapitan, D.G.; Tarasov, A.P.; Shtyflyuk, M.E.; Rogatkin, D.A. On the Origin of the Photoplethysmography Signal: Modeling of Volumetric and Aggregation Effects. Photonics 2024, 11, 637. https://doi.org/10.3390/photonics11070637
Lapitan DG, Tarasov AP, Shtyflyuk ME, Rogatkin DA. On the Origin of the Photoplethysmography Signal: Modeling of Volumetric and Aggregation Effects. Photonics. 2024; 11(7):637. https://doi.org/10.3390/photonics11070637
Chicago/Turabian StyleLapitan, Denis G., Andrey P. Tarasov, Maria E. Shtyflyuk, and Dmitry A. Rogatkin. 2024. "On the Origin of the Photoplethysmography Signal: Modeling of Volumetric and Aggregation Effects" Photonics 11, no. 7: 637. https://doi.org/10.3390/photonics11070637
APA StyleLapitan, D. G., Tarasov, A. P., Shtyflyuk, M. E., & Rogatkin, D. A. (2024). On the Origin of the Photoplethysmography Signal: Modeling of Volumetric and Aggregation Effects. Photonics, 11(7), 637. https://doi.org/10.3390/photonics11070637