Article

A Numerical Study of Microwave Frequency Comb Generation in a Semiconductor Laser Subject to Modulated Optical Injection and Optoelectronic Feedback

1
College of Electronic and Optical Engineering & College of Flexible Electronics (Future Technology), Nanjing University of Posts and Telecommunications, Nanjing 210023, China
2
School of Computer Science and Engineering, Bangor University, Bangor LL57 1UT, UK
*
Authors to whom correspondence should be addressed.
Photonics 2024, 11(8), 741; https://doi.org/10.3390/photonics11080741
Submission received: 17 July 2024 / Revised: 6 August 2024 / Accepted: 7 August 2024 / Published: 8 August 2024
(This article belongs to the Special Issue New Perspectives in Microwave Photonics)

Abstract

:
This study presents a comprehensive numerical investigation on the generation of a microwave frequency comb (MFC) using a semiconductor laser subjected to periodic-modulated optical injection. To enhance performance, optoelectronic feedback is incorporated through a dual-drive Mach–Zehnder modulator. The results show that the first optoelectronic feedback loop, with a delay time inversely proportional to the modulation frequency, can optimize MFC generation through a mode-locking effect and the second optoelectronic feedback loop with a multiple delay time of the first one can further enhance the performance of the MFC. The comb linewidth appears to decrease with the increase in the second-loop delay time in the power function. These results are consistent with experimental observations reported in the literature. We also explore the impact of the feedback index on comb contrast, the statistical characteristics of the central 128 lines within the MFC, and side peak suppression. The simulation results demonstrate the presence of an optimal feedback index. The study also reveals that linewidth reduction, through increasing the feedback index and delay time, comes at the cost of declining side peak suppression. These findings collectively contribute to a deeper understanding of the factors influencing MFC generation and pave the way for the design and optimization of high-performance MFC systems for various applications.

1. Introduction

The microwave frequency comb (MFC), characterized by uniform comb spacing and coherent, stable phase relationships, has attracted substantial attention owing to its diverse applications in fields such as radio over fiber, sensors, radar, and metrology [1,2,3,4]. Traditional electronic approaches, including lumped and distributed methods, can produce a range of tunable harmonic frequencies. Nevertheless, as the oscillation frequency increases, these methods suffer from the gradual degradation of phase noise and power, which adversely affects their practicality.
The rapid development of microwave photonic technology has emerged as a promising alternative for high-performance MFC generation, prompting extensive research efforts. Notably, the heterodyne of the optical frequency comb (OFC) from a mode-locked laser has demonstrated the creation of an MFC with an extremely narrow linewidth [5,6]. However, limitations in pulse repetition hinder the adjustment of comb spacing. An innovative approach, as proposed and experimentally demonstrated by Chan [7], employs the harmonic frequency-locked state output from a semiconductor laser (SL) subject to optoelectronic feedback. Yet, this method faces constraints with a limited bandwidth of a few GHz due to electronic bandwidth limitations.
In exploring applications of nonlinear dynamics, external modulation, optoelectronic oscillators, and optical injection can also be used for the optical frequency comb and MFC generation [8,9,10,11,12,13,14]. For instance, when an SL subject to optical pulse injection from an optoelectronic feedback laser, the MFC bandwidth can be improved to 20.0 GHz within a ±5 dB amplitude variation [15]. Further advancements, such as a 57.6 GHz bandwidth MFC using a current-modulated SL under optical injection [16] and a scheme addressing power drops with increasing harmonics through regular pulse injection have also been explored [17]. Utilizing an optoelectronic feedback loop with a Vernier configuration, the comb spacing tuning from 3.072 to 4.710 GHz is demonstrated [18]. Based on an actively mode-locked OEO, a density MFC with a center frequency tuning from 3.5 GHz to 6.5 GHz is generated [19]. Additionally, MFC generation based on integrated mutually coupled distributed feedback (DFB) lasers is also reported [20].
Recent attention has turned toward photonics microwave generation based on the period-one (P1) oscillation in optically injected SLs. This approach offers high tunability, cost-efficiency, and single sideband characteristics [21,22,23,24,25]. By implementing period-modulated optical injection, the microwave frequency generated experiences dynamic changes with a determined step, eventually transforming into an frequency-modulated continuous-wave microwave signal, i.e., a density MFC in the frequency domain [26,27,28,29]. Though the MFC based on P1 has been experimentally demonstrated, the systematic theoretical simulations have not been conducted. Additionally, the effect of the feedback index on the characteristics of the MFC signal and the power variation in the comb lines have not been studied in experiments. The feedback index is an important parameter that affects the performance of feedback systems. Minimal power variation between the comb lines is a key factor in the design and optimization of microwave frequency comb generators, impacting their functionality and application in various fields. Meanwhile, in [25], a second optoelectronic feedback is introduced to eliminate the degradation of comb contrast caused by introducing long delayed feedback, which reduces the linewidth. However, the external cavity mode originating from the second feedback, which leads to side peaks, has not been addressed. These side peaks can reduce the purity of the MFC, making them undesirable.
In this paper, we systematically simulate and analyze a photonics MFC based on the optically injected SL with optoelectronic feedback by focusing on the evolution of MFC bandwidth, linewidth, the power variation in comb lines, and the side-peak suppression coefficient (SPSC). These simulation results could serve as a guide for optimizing operational conditions.

2. Theoretical Model

Figure 1 outlines the principle of the high-performance MFC in an SL subject to the modulated optical injection and optoelectronic feedback. A continuous wave (CW)-light from the master semiconductor laser (M-SL) passes through an attenuator (Att), a dual-drive Mach-Zehnder modulator (DMZM), a polarization controller (PC), and an optical circulator (Cir); it then injects into the slave semiconductor laser (S-SL). The master-slave configuration with SLs can emit P1 oscillation in the slave SL over a wide range of injection parameters. By periodically modulating the CW-light injection using the DMZM, the P1 oscillation can be remolded to generate the MFC [29]. Additionally, for the enhancement of MFC performance, we incorporate dual optoelectronic feedbacks. It should be noted that the shortest feedback loop should hold a delay time equal to the reciprocal of the modulation frequency, whereas the other loop with a delay time multiple of that is used to narrow the linewidth and reduce the phase noise.
The dynamics of the slave SL with modulated optical injection and optoelectronic feedback is fully described using the temporal evolution of the complex optical field and the charge carrier density. For the sake of simplicity, the complex field amplitude and charge carrier density are normalized to a and n, respectively. Therefore, the following rate equations bear similarities to those in [24,30], but we modify the injection term which incorporates DMZM-modulated optical injection.
a t = 1 i b 2 γ c γ n γ s J n γ p a 2 1 a + ξ i γ c e i 2 π f i t a i + Γ
n t = γ s + γ n a 2 n γ s J 1 γ p γ c a 2 a 2 1
where b is the linewidth enhancement factor, γ c is the cavity decay rate, γ n is the differential carrier relaxation rate, γ s is the spontaneous carrier relaxation rate, γ p is the nonlinear carrier relaxation rate, J is the normalized bias current, and ξ i is the injection strength. f i is the frequency detuning of the optical injection with respect to the free-running slave SL. a i presents the normalized complex field amplitude of actual injection light after the DMZM, which follows the equation derived from [31].
a i = cos π v D C + v 1 t v 2 t 2 v π e i π v D C + v 1 t + v 2 t 2 v π
where v 1 and v 2 are the driving signals for the upper and lower arms of the DMZM, respectively, v π denotes the half-wave voltage of the DMZM, and v D C refers to the DC bias voltage, which is set at v π / 2 for non-inverting linear operation through its low-frequency electrode. Here, v 1 and v 2 originate from the signal generator and optoelectronic feedback, respectively, and can be written as
v 1 = m v π cos 2 π f m t
v 2 t = v π κ 1 a t τ 1 2 + κ 2 a t τ 2 2
where m is the modulation index of the upper arm, f m is the modulation frequency, κ j is the feedback index, and the subscript j (j = 1, 2) denotes the feedback loop 1 and loop 2, respectively.
Moreover, the spontaneous emission noise modeled using a Langevin fluctuating force Γ is also taken into account, where the real and imaginary parts are uncorrelated and stochastic. The ergodicity can be described as [32],
Γ t Γ t = 4 π Δ f 1 + b 2 δ t t
Γ t Γ t = 0
Γ t = 0
where Δ f is the full width at half-maximum (FWHM) of the free-running slave SL. The second order Runge–Kutta integration method with a temporal resolution of 1 ps is used to numerically solve (1)–(2), and the duration of the time series is 1 ms. The optical spectrum and power spectrum of the slave SL emission are obtained by applying the Fourier transform on a ( t ) and a ( t ) 2 , respectively. The parameters used in the simulation are given in Table 1.

3. Results

The P1 oscillation emitted using the optical injected slave SL for the photonic microwave generation has been extensively studied [22,24,33,34]. It is well known that the microwave frequency can be adjusted easily by setting the injection parameters ( ξ i , f i ). Figure 2a shows the optical spectrum of the slave SL with the injection parameters (0.13, 7 GHz), where a relatively narrow P1 microwave is observed [24,30]. The x-axes of the optical spectra are the frequency offset from the free-running frequency of the slave laser; therefore, the regenerated frequency component corresponding to the injection light is observed at f i = 7 GHz in the optical spectrum. Moreover, due to the optical injection, the original frequency component corresponding to the free-running scene witnesses a red shift. The beating of the regenerated frequency ( f i ) and the red-shift cavity resonance frequency ( f r ) would give rise to a microwave signal with a frequency f 0 = f i f r = 15.625 GHz, as illustrated in Figure 2b. The 3 dB linewidth of the microwave is about 1.5 MHz, calculated using both smooth and Lorenz fitting to the power spectrum. For the CW injection signal, its power can be adjusted using an intensity modulator to change the f r in real time, thereby achieving frequency modulation for f 0 . Figure 2c,d present the optical and power spectra of the slave SL when the injection is periodically modulated. The sinusoidal driving signal v 1 with m = 0.12 and f m = 16.25 MHz is employed. Notably, the frequency component corresponding to f i = 7 GHz remains visible in the optical spectrum. In contrast, the red-shift cavity resonance exhibits a distinct wide-band characteristic due to the modulated injection, as seen from a macro perspective. The inset figure in Figure 2c provides a close-up view of the spectrum within the red-shift cavity resonance range. Here, the frequency components in the spectrum of the red-shift cavity resonance exhibit a periodic discrete frequency with a step of f m . The beating between the regenerated frequency f i and the periodic discrete frequency components results in a dense MFC centered on f 0 with a frequency space of f m , as depicted in Figure 2d. These results are consistent with the experimental demonstrations reported in [26,29]. Moreover, as shown in the inset in Figure 2d, the comb contrast is approximately 16 dB [35].
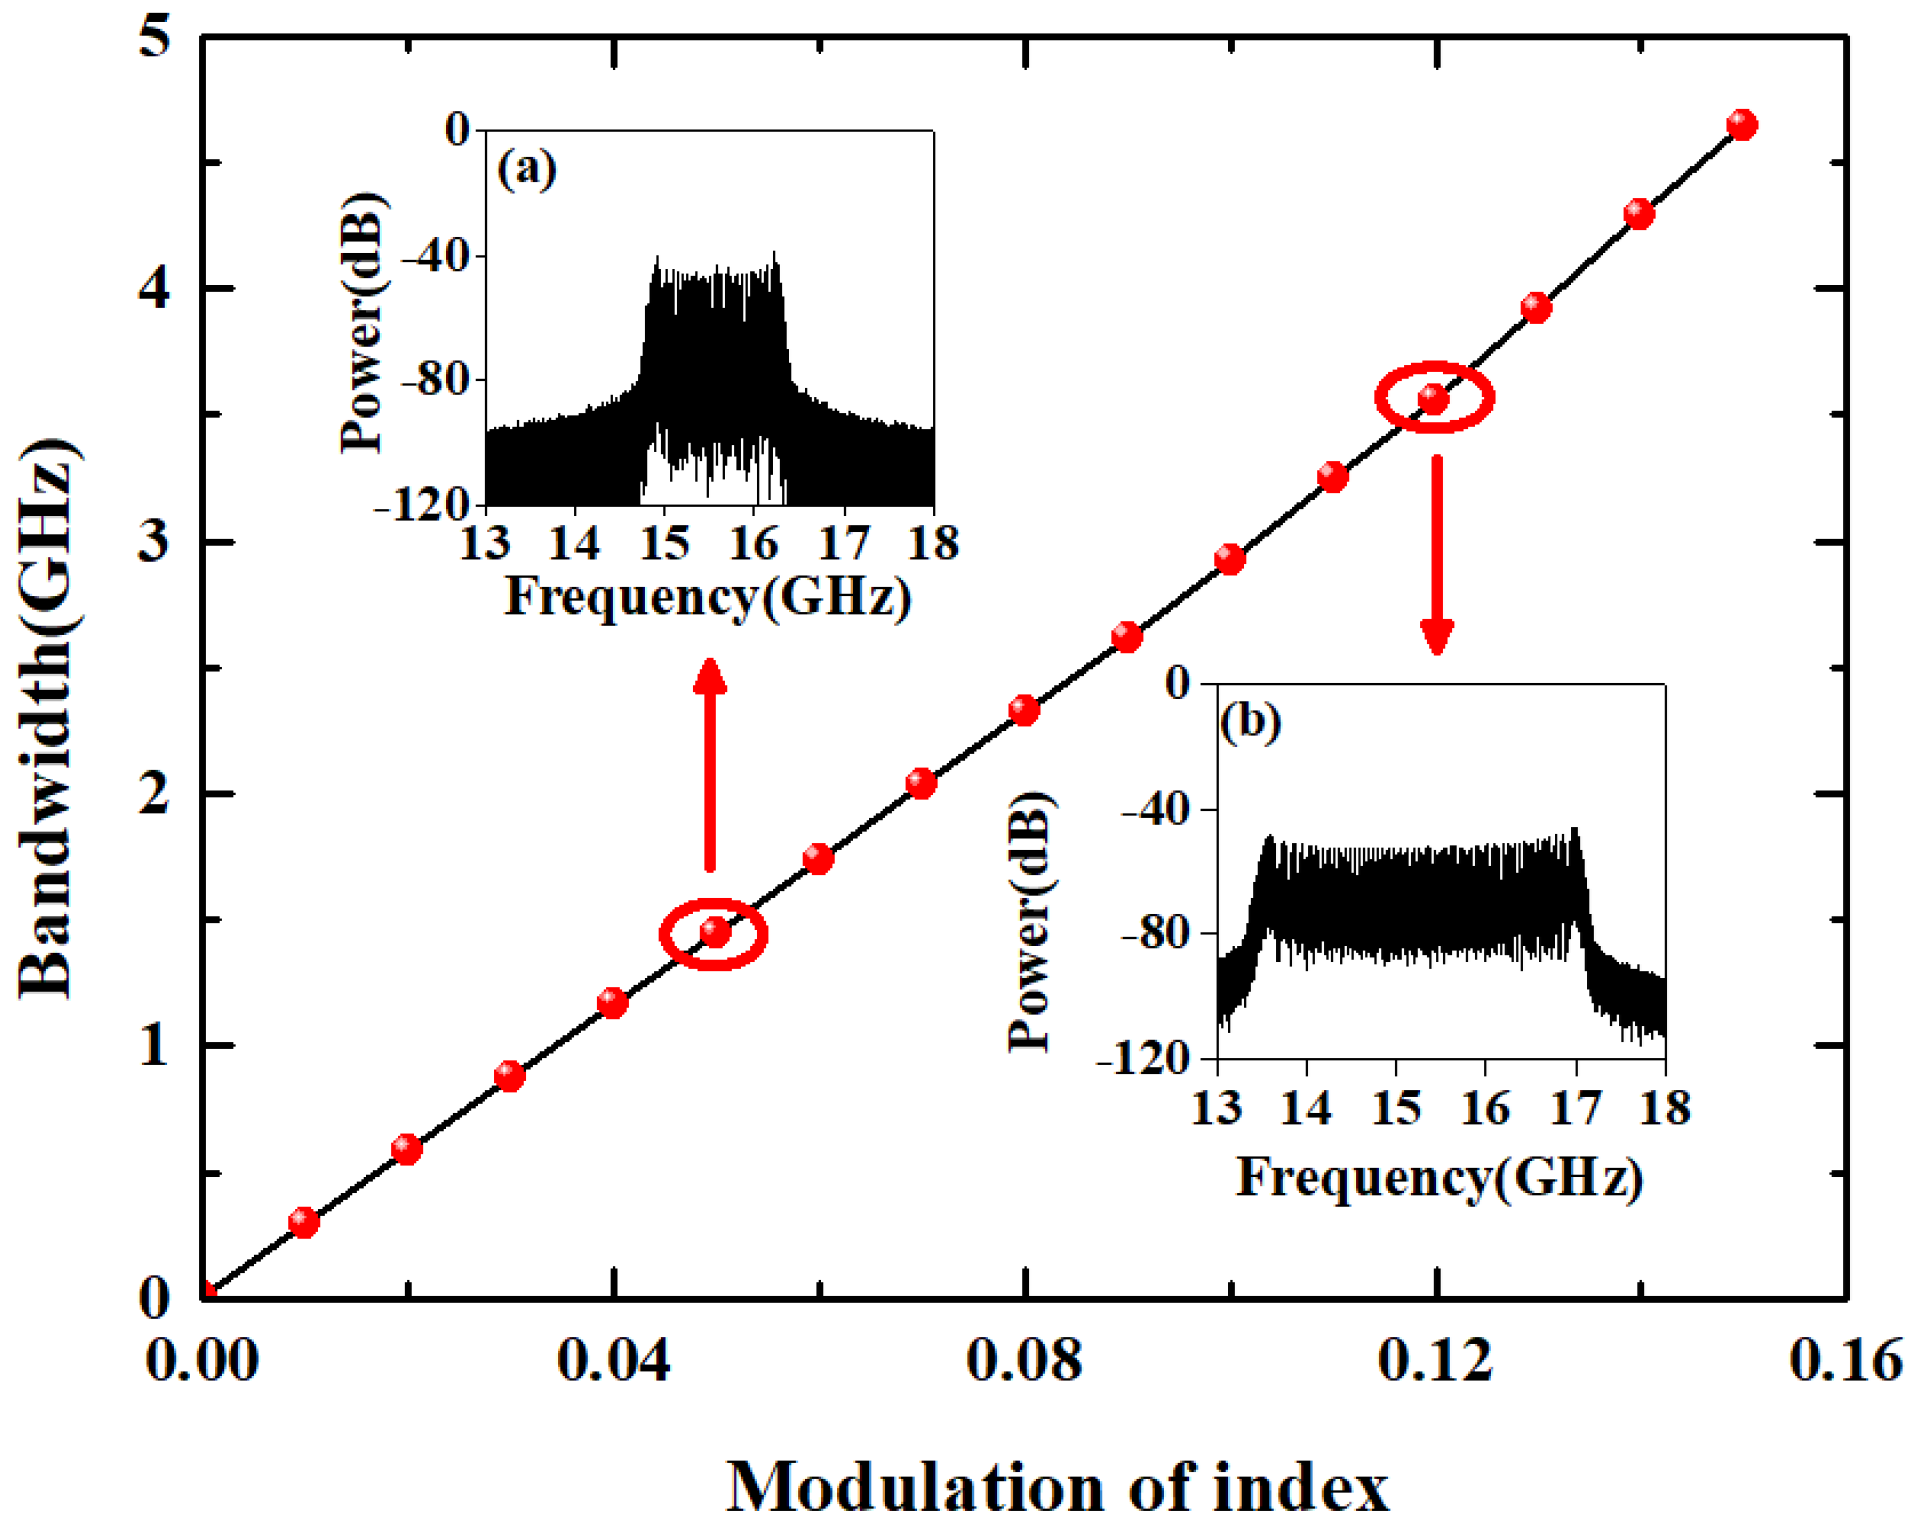
To gain an insight into the evolution of the microwave performance versus the modulation index m, we first study the MFC bandwidth. In this context, the MFC bandwidth is defined as the span of the MFC power spectrum within a ±5 dB variation [7]. As shown in Figure 3, the MFC bandwidth increases linearly with the increase of m. The insets (a) and (b) in Figure 3 present the MFC spectra, corresponding to m = 0.05 and 0.12, respectively, resulting in a MFC bandwidth of approximately 1.5 GHz and 3.5 GHz, respectively. It is noted that the center frequency of the MFC remains nearly unchanged, and adjusting m allows for the easy modulation of the MFC bandwidth to several GHz. In line with the report in [28], without optoelectronic feedback, the MFC is poor; therefore, no further discussion is performed here.
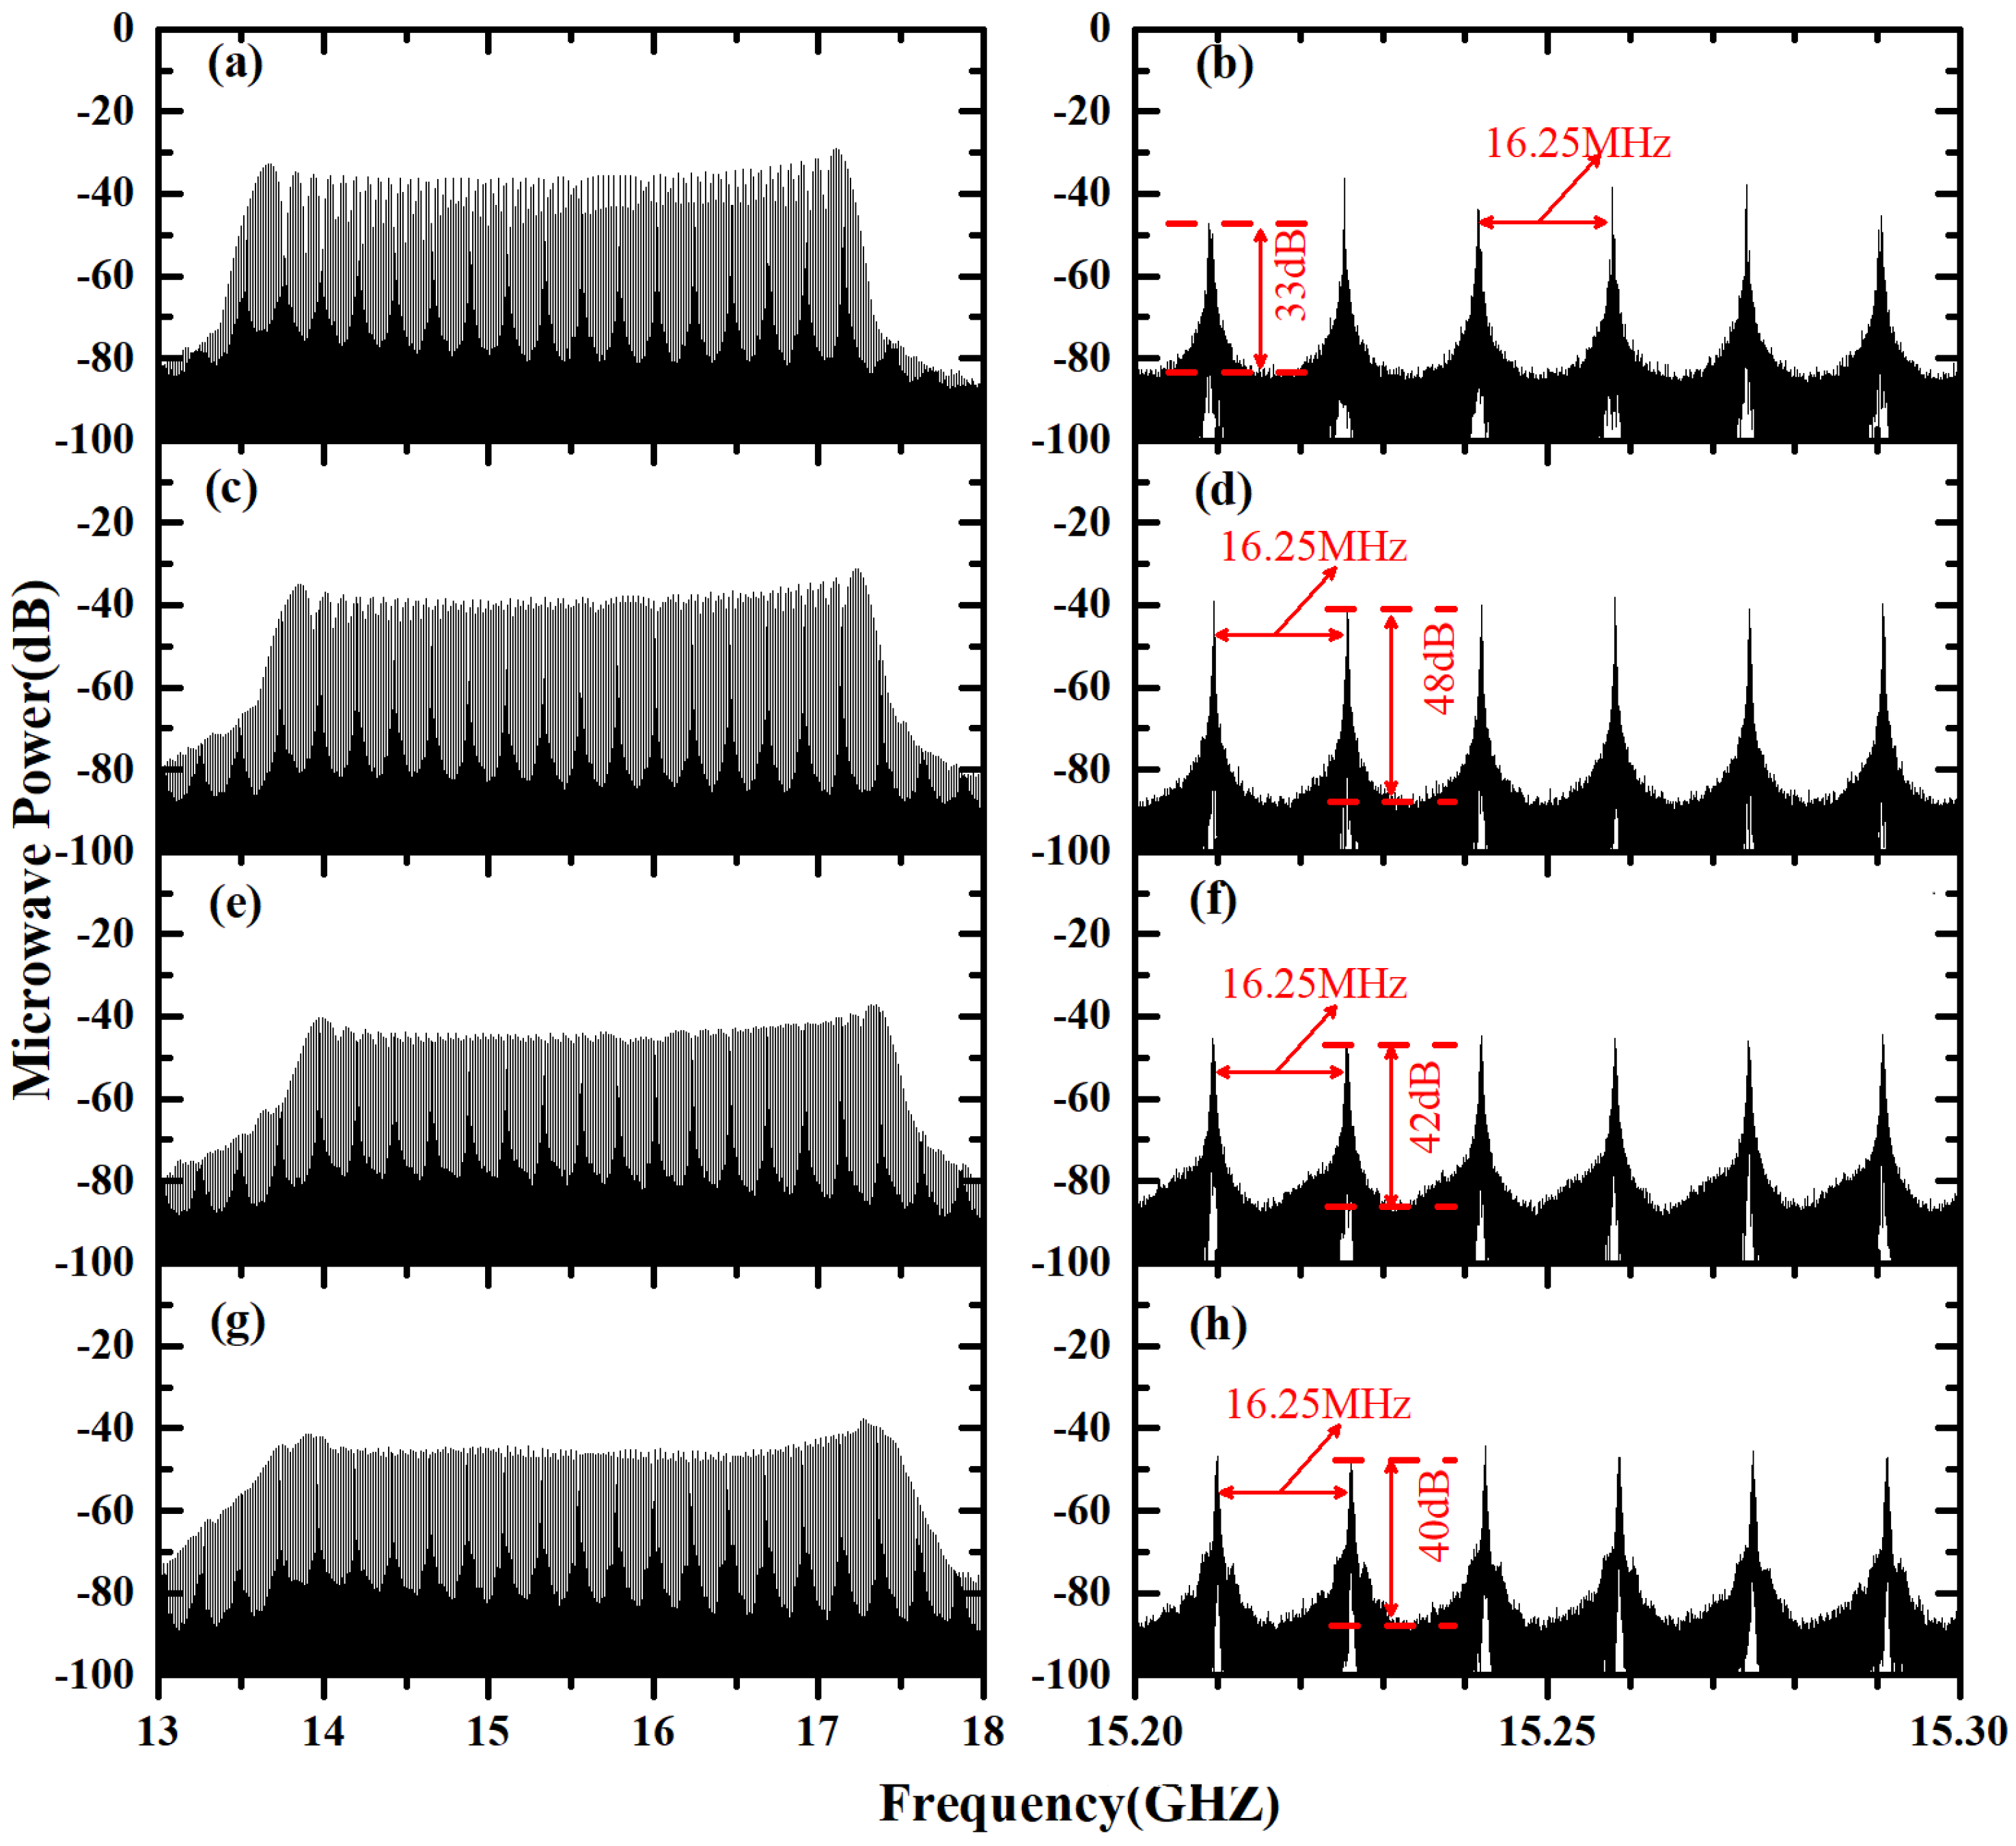
Next, this work will focus on studying the effects of optoelectronic feedback on enhancing the quality of the generated MFC, especially for the impact of the feedback index on the characteristics of the MFC, which was not explored in the experiments reported in [25]. First, we will numerically investigate the generation of MFC using a single-loop optoelectronic feedback system, where the delay time is set as τ 1 = 1 / f m for Fourier domain mode locking [29]. The power spectra of the MFC with different feedback indices κ 1 are displayed in Figure 4. In the case with κ 1 = 0.04, as shown in Figure 4a, the MFC bandwidth remains at approximately 3.5 GHz, similar to the case without feedback. Figure 4b provides a zoom-in of the MFC spectrum with a span of 100 MHz. It reveals a comb contrast of about 33 dB, representing a notable 17 dB improvement compared to the case without feedback [See Figure 2d]. However, there is an observable power variation in the MFC lines. Upon increasing κ 1 to 0.08, as shown in Figure 4c,d, the MFC bandwidth remains almost unchanged, while the power variation in the MFC line is significantly suppressed, and the comb contrast witnesses a significant improvement to approximately 48 dB. Upon further increasing κ 1 to 0.10, the powers of the MFC lines become more consistent, but the comb contrast decreases to approximately 42 dB (as shown in Figure 4e,f). Subsequently, with κ 1 raised to 0.12, as shown in Figure 4g,h, the powers of the MFC lines can still remain relatively constant, but the comb contrast experiences a further decline to around 40 dB. This is primarily due to the reduction in MFC line power resulting from excessive feedback index utilization. Moreover, the introduction of the feedback loop does not significantly alter the bandwidth of the MFC (as observed in Figure 2d and Figure 4).
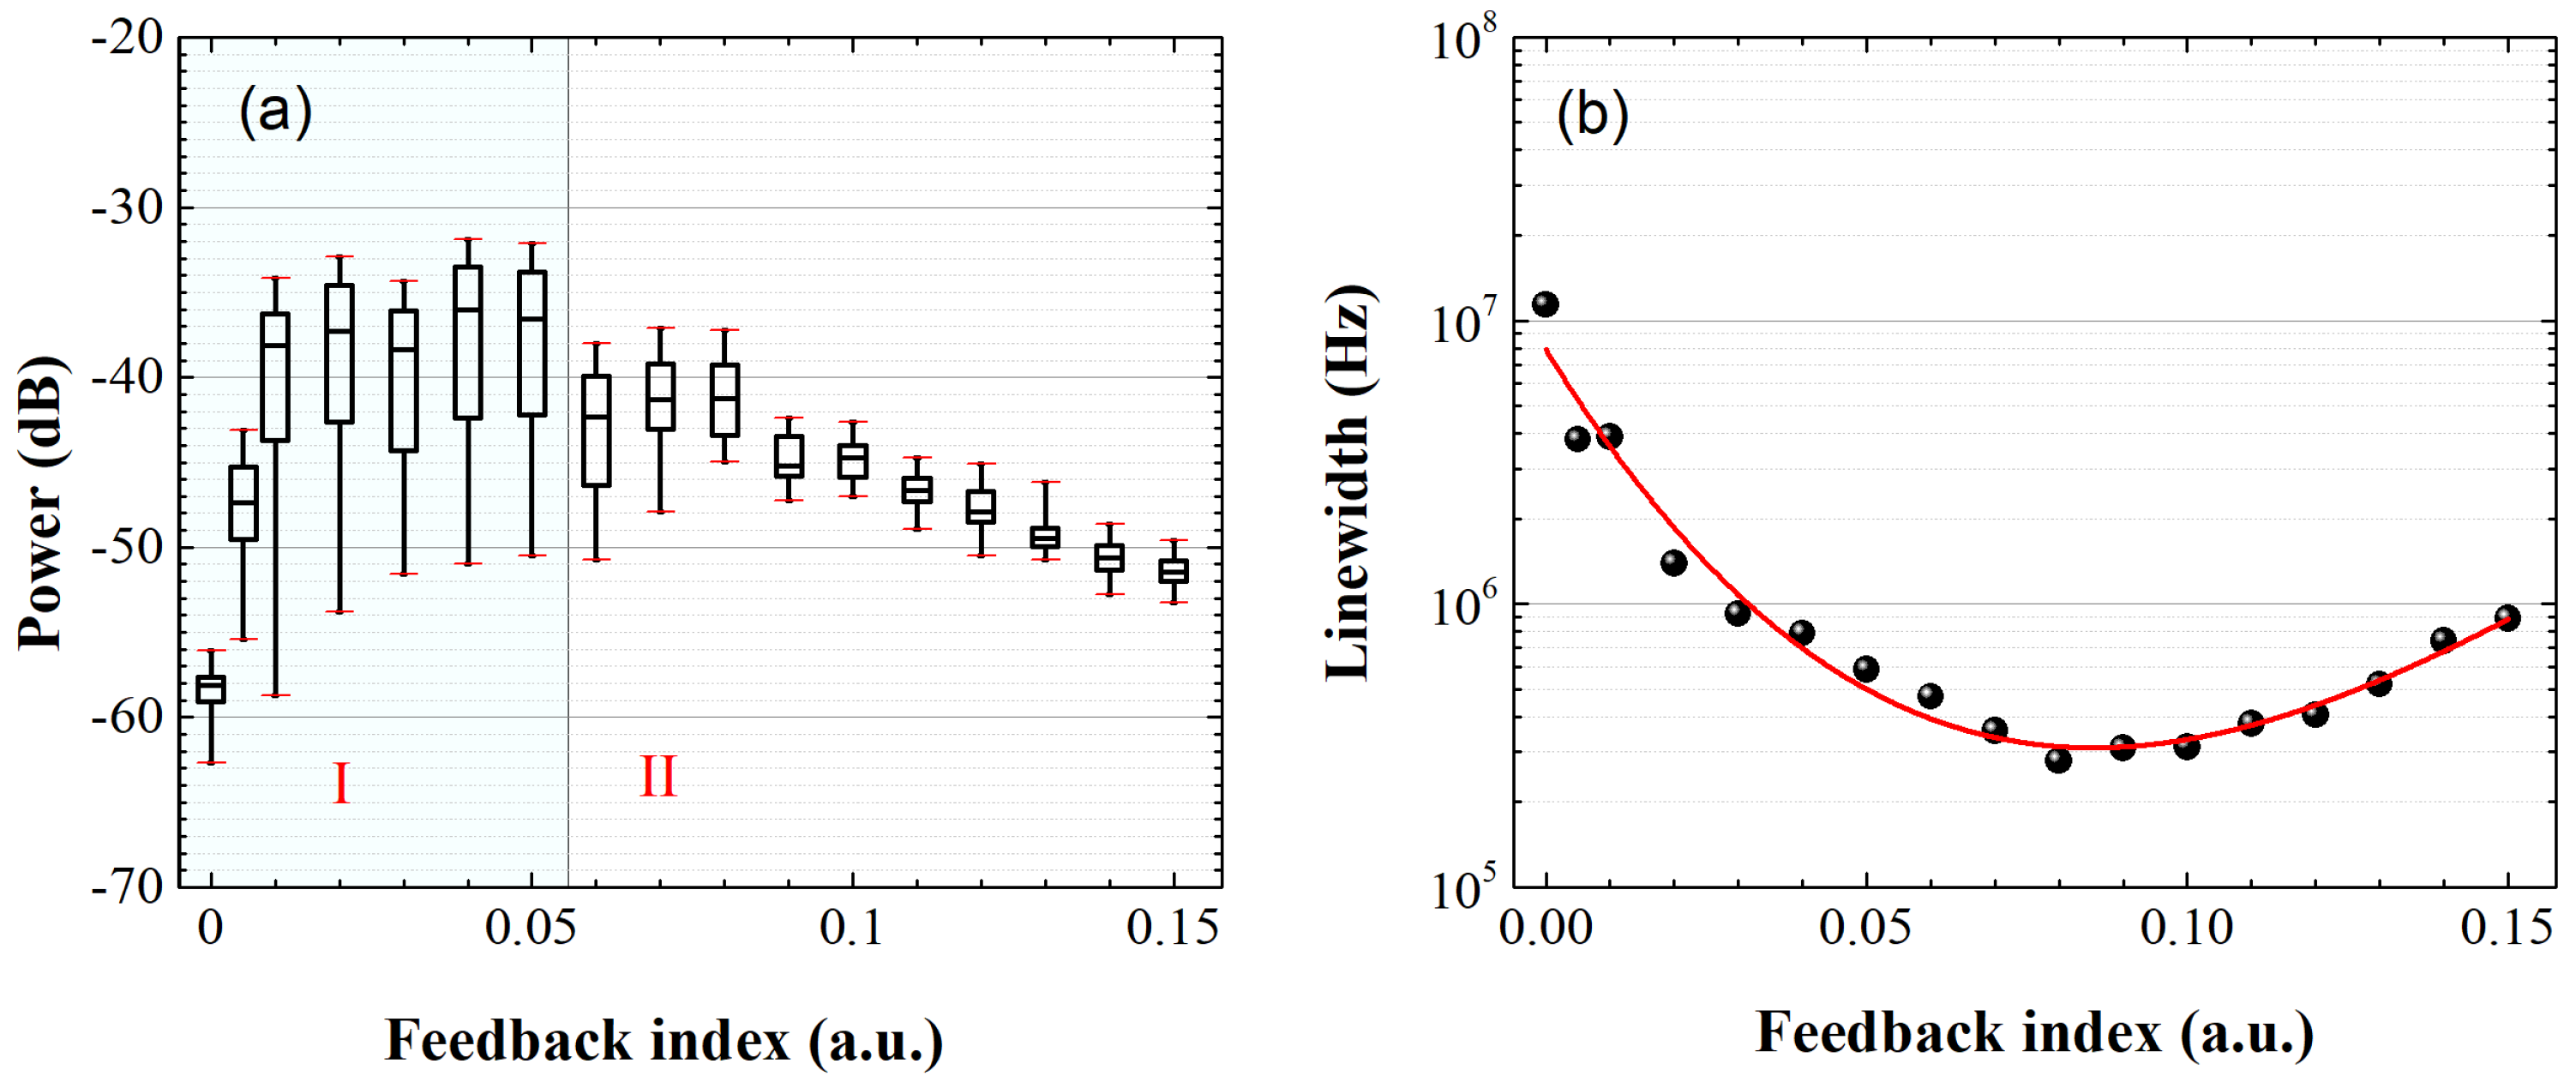
The mode locking effect induced via optoelectronic feedback is further assessed through the statistical characteristics of the 128 lines located at the center of the MFC. In Figure 5a, the statistical property of line powers within the MFC are depicted. Without feedback ( κ 1 = 0), the line powers are centered around a significantly low value, approximately −58 dB (median). As κ 1 increases, the median of the line powers within the MFC initially exhibits a rapid increase until κ 1 = 0.01 is reached. Subsequently, it tends to stabilize, but the line powers exhibit a relatively wide distribution over a wide range of power values, continuing until κ 1 = 0.05. This suggests that the MFC with κ 1 0.05 in the optoelectronic feedback is not well locked and remains unstable (region I). When κ 1 > 0.05, the MFC tends to stabilize, and a relatively concentrated distribution of the line powers is observed (region II). For example, when κ 1 is set at 0.06 or 0.07, the lines exhibit a fluctuation of over 11 dB, but for κ 1 0.08, the fluctuations are further reduced to less than 6 dB. Moreover, it should be noted that when κ 1 exceeds 0.08, the median power of the 128 lines drops slightly with the increase of κ 1 . For instance, with κ 1 = 0.08, the median is approximately −41 dB, while at κ 1 = 0.15, the median decreases to approximately −51.5 dB. Therefore, there is an optimal feedback index. The quartile deviation [length of the rectangle in Figure 5a] follows a similar trend with increasing κ 1 . Figure 5b displays the evolution of the MFC linewidth versus κ 1 , with the red curve corresponds the third-order polynomial fitting. In this case, Lorentz fitting is utilized for the linewidth estimation, and the MFC linewidth is defined as the widest 3 db-linewidth among the observed 128 lines. As κ 1 increases, the MFC linewidth initially narrows to approximately 300 kHz (at κ 1 0.08), after which it gradually increases. This phenomenon occurs because the power drop in the MFC lines causes an increase in phase noise as κ 1 approaches and surpasses m. In other words, the excessive feedback index works against the mode-locking of the MFC. Additionally, it is noteworthy that the narrow MFC linewidth is accompanied by relatively high and concentrated line powers.
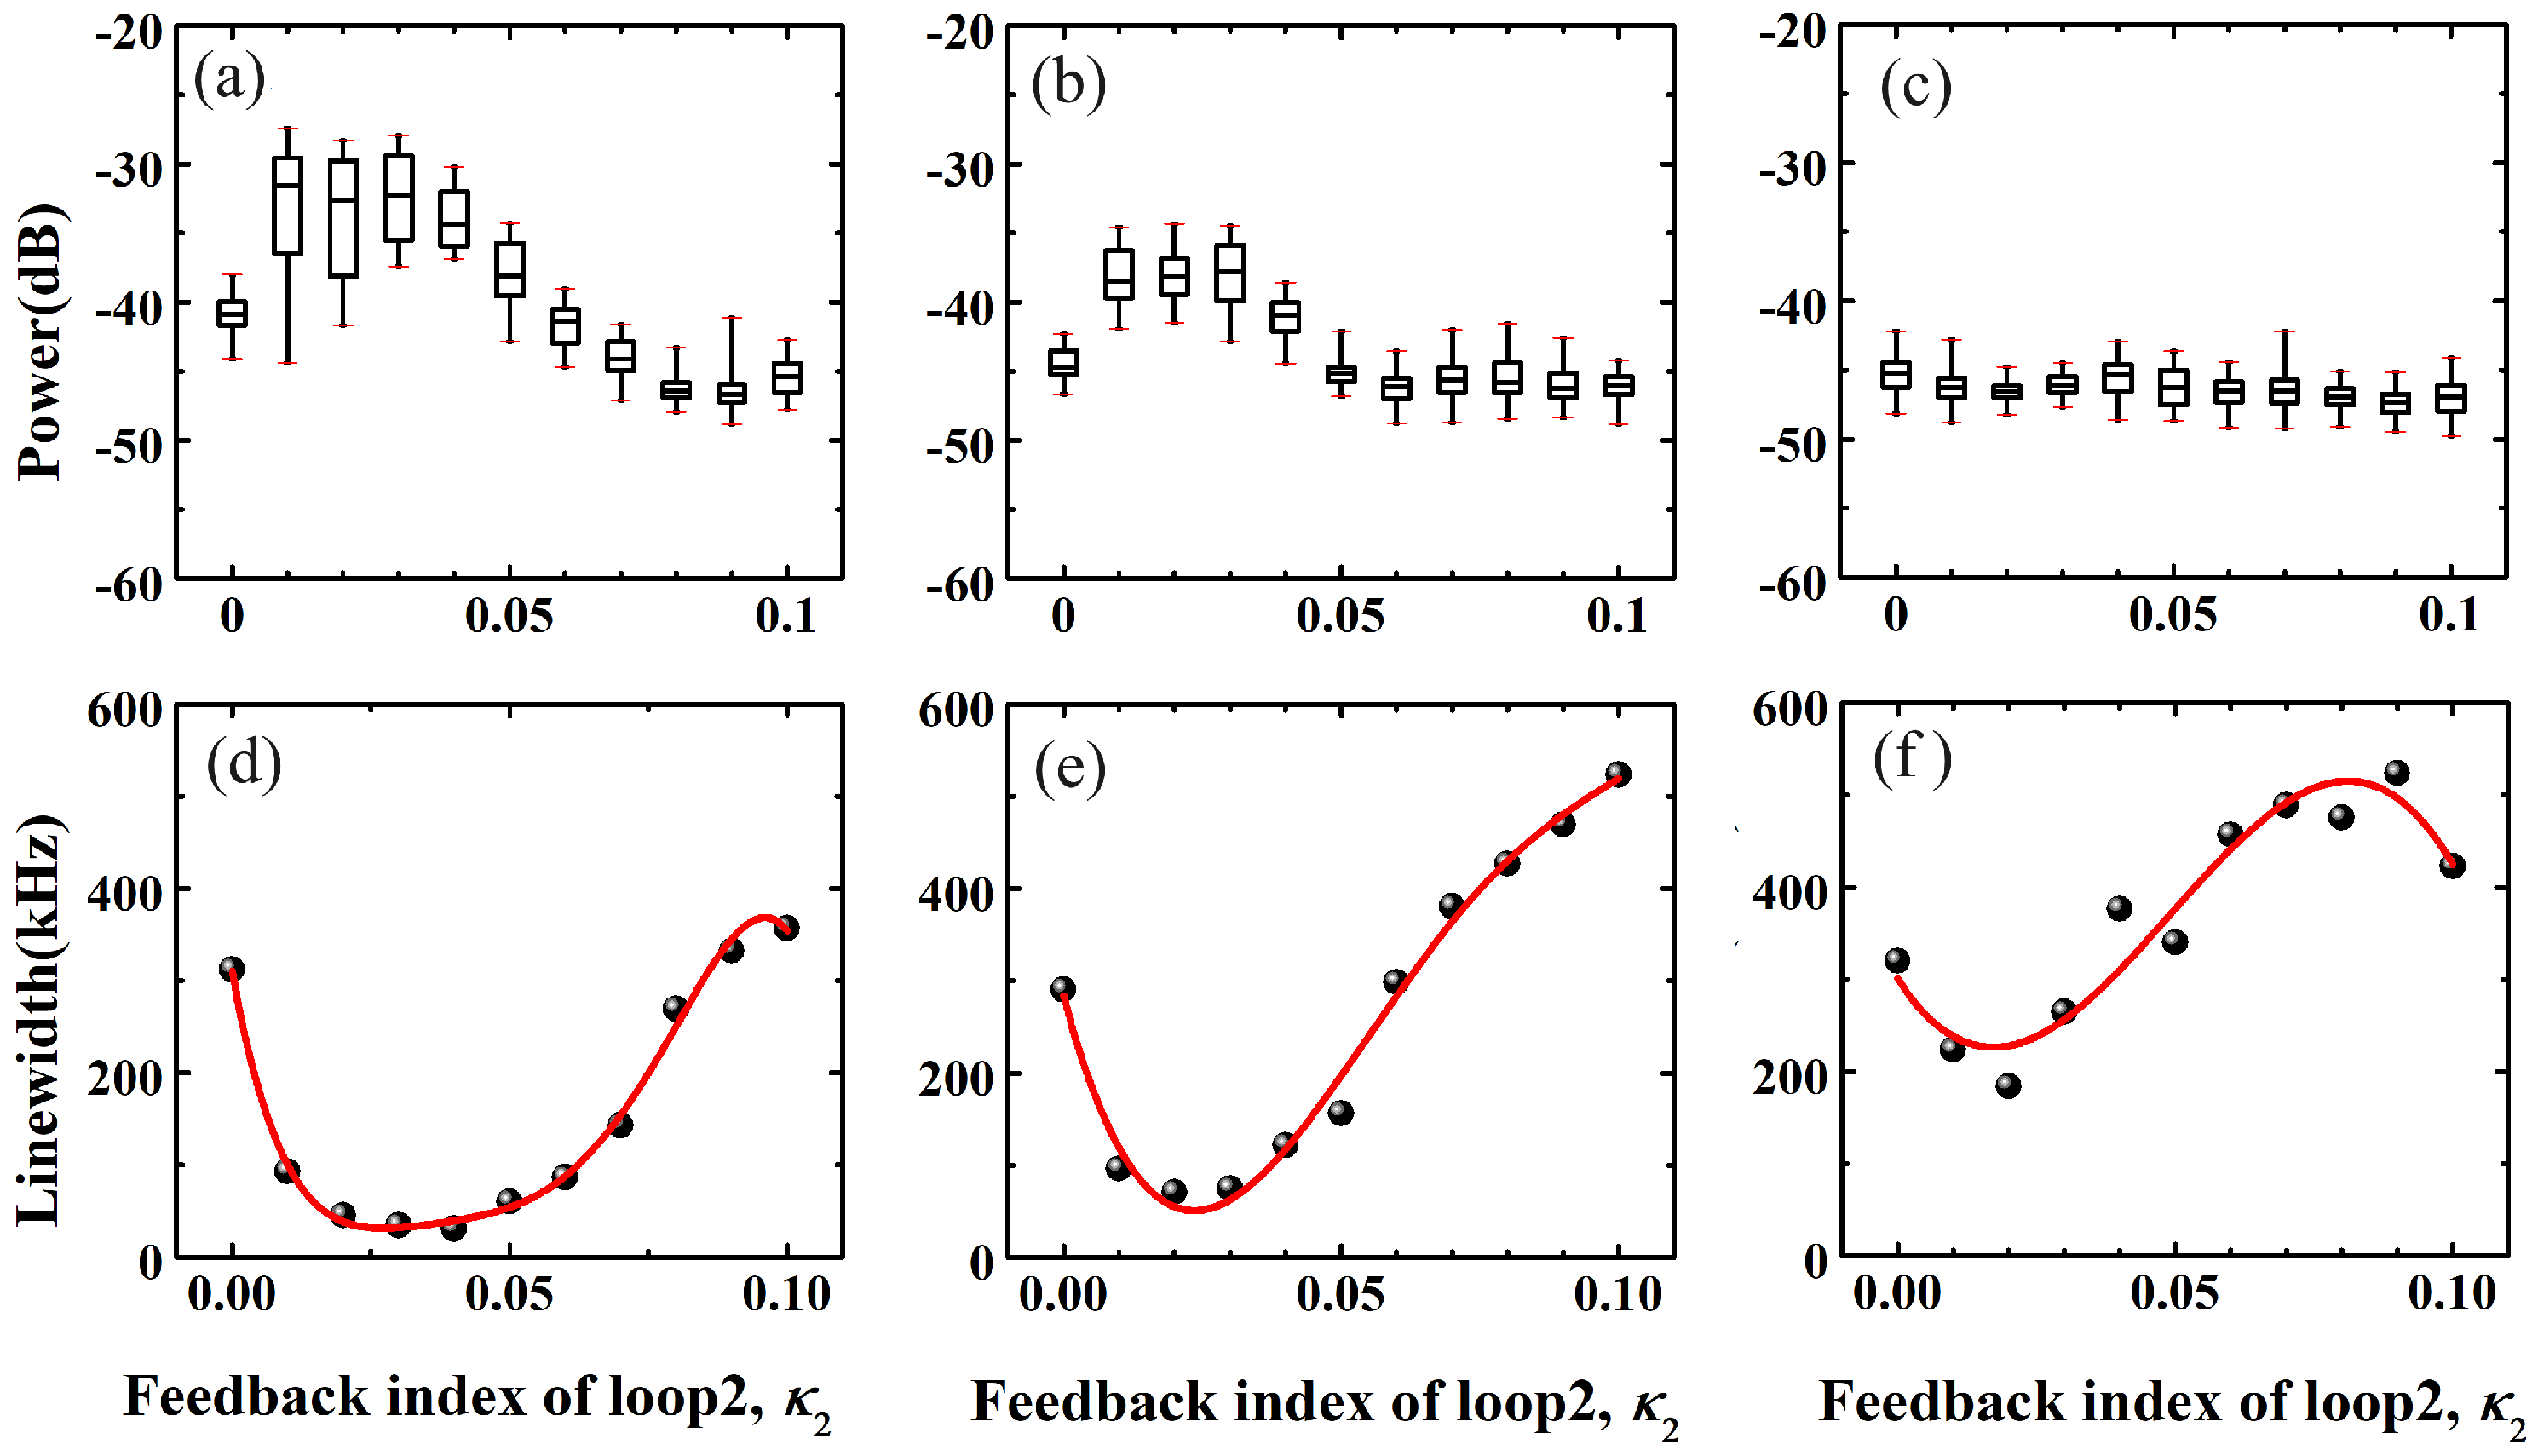
The experiment results have proved that adding a long second optoelectronic feedback (whose delay time is a multiple of the first loop) can reduce the linewidth [26]. However, to obtain an insight into the performance of MFC evolution with the feedback parameters, in our simulation, we have incorporated a second optoelectronic feedback with a delay time that is a multiple of that in the first feedback loop. Figure 6 illustrates the performance of the line powers and MFC linewidth with respect to the feedback index of loop 2, κ 2 . When κ 1 is held constant at 0.08, as shown in Figure 6a, the median of the MFC line powers initially increases with increasing κ 2 . Within the range of a κ 2 value between 0.01 and 0.03, it remains relatively stable but exhibits a notable line power variation (>9 dB) within the central 128 lines of the MFC lines. As κ 2 continues to rise, the median power experiences a noticeable drop, while the power variation within the central 128 lines decreases. Figure 6d shows the MFC linewidth as a function of κ 2 . As κ 2 increases, the MFC linewidth reduces to approximately 30 kHz at κ 2 = 0.03, down from 290 kHz at κ 2 = 0. Further increases in κ 2 result in an increase in the linewidth. Figure 6b,e show results with κ 1 = 0.10. The line powers and the MFC linewidth exhibit a similar evolution to the case with κ 1 = 0.08. However, the power variations in the MFC lines with weak feedback, i.e., κ 2 = 0.01 or 0.02, are significantly reduced. The case with κ 1 = 0.12 is displayed in Figure 6c,f. In contrast to the cases with κ 1 = 0.08 and κ 1 = 0.10, when κ 1 = 0.12, the MFC line exhibits relatively low power variation and median power, but the MFC linewidth reduction achieved by loop 2 is relatively small (from ∼300 kHz to ∼200 kHz). In summary, by appropriately setting the κ 1 and κ 2 , the linewidth can be effectively narrowed with small power variation.
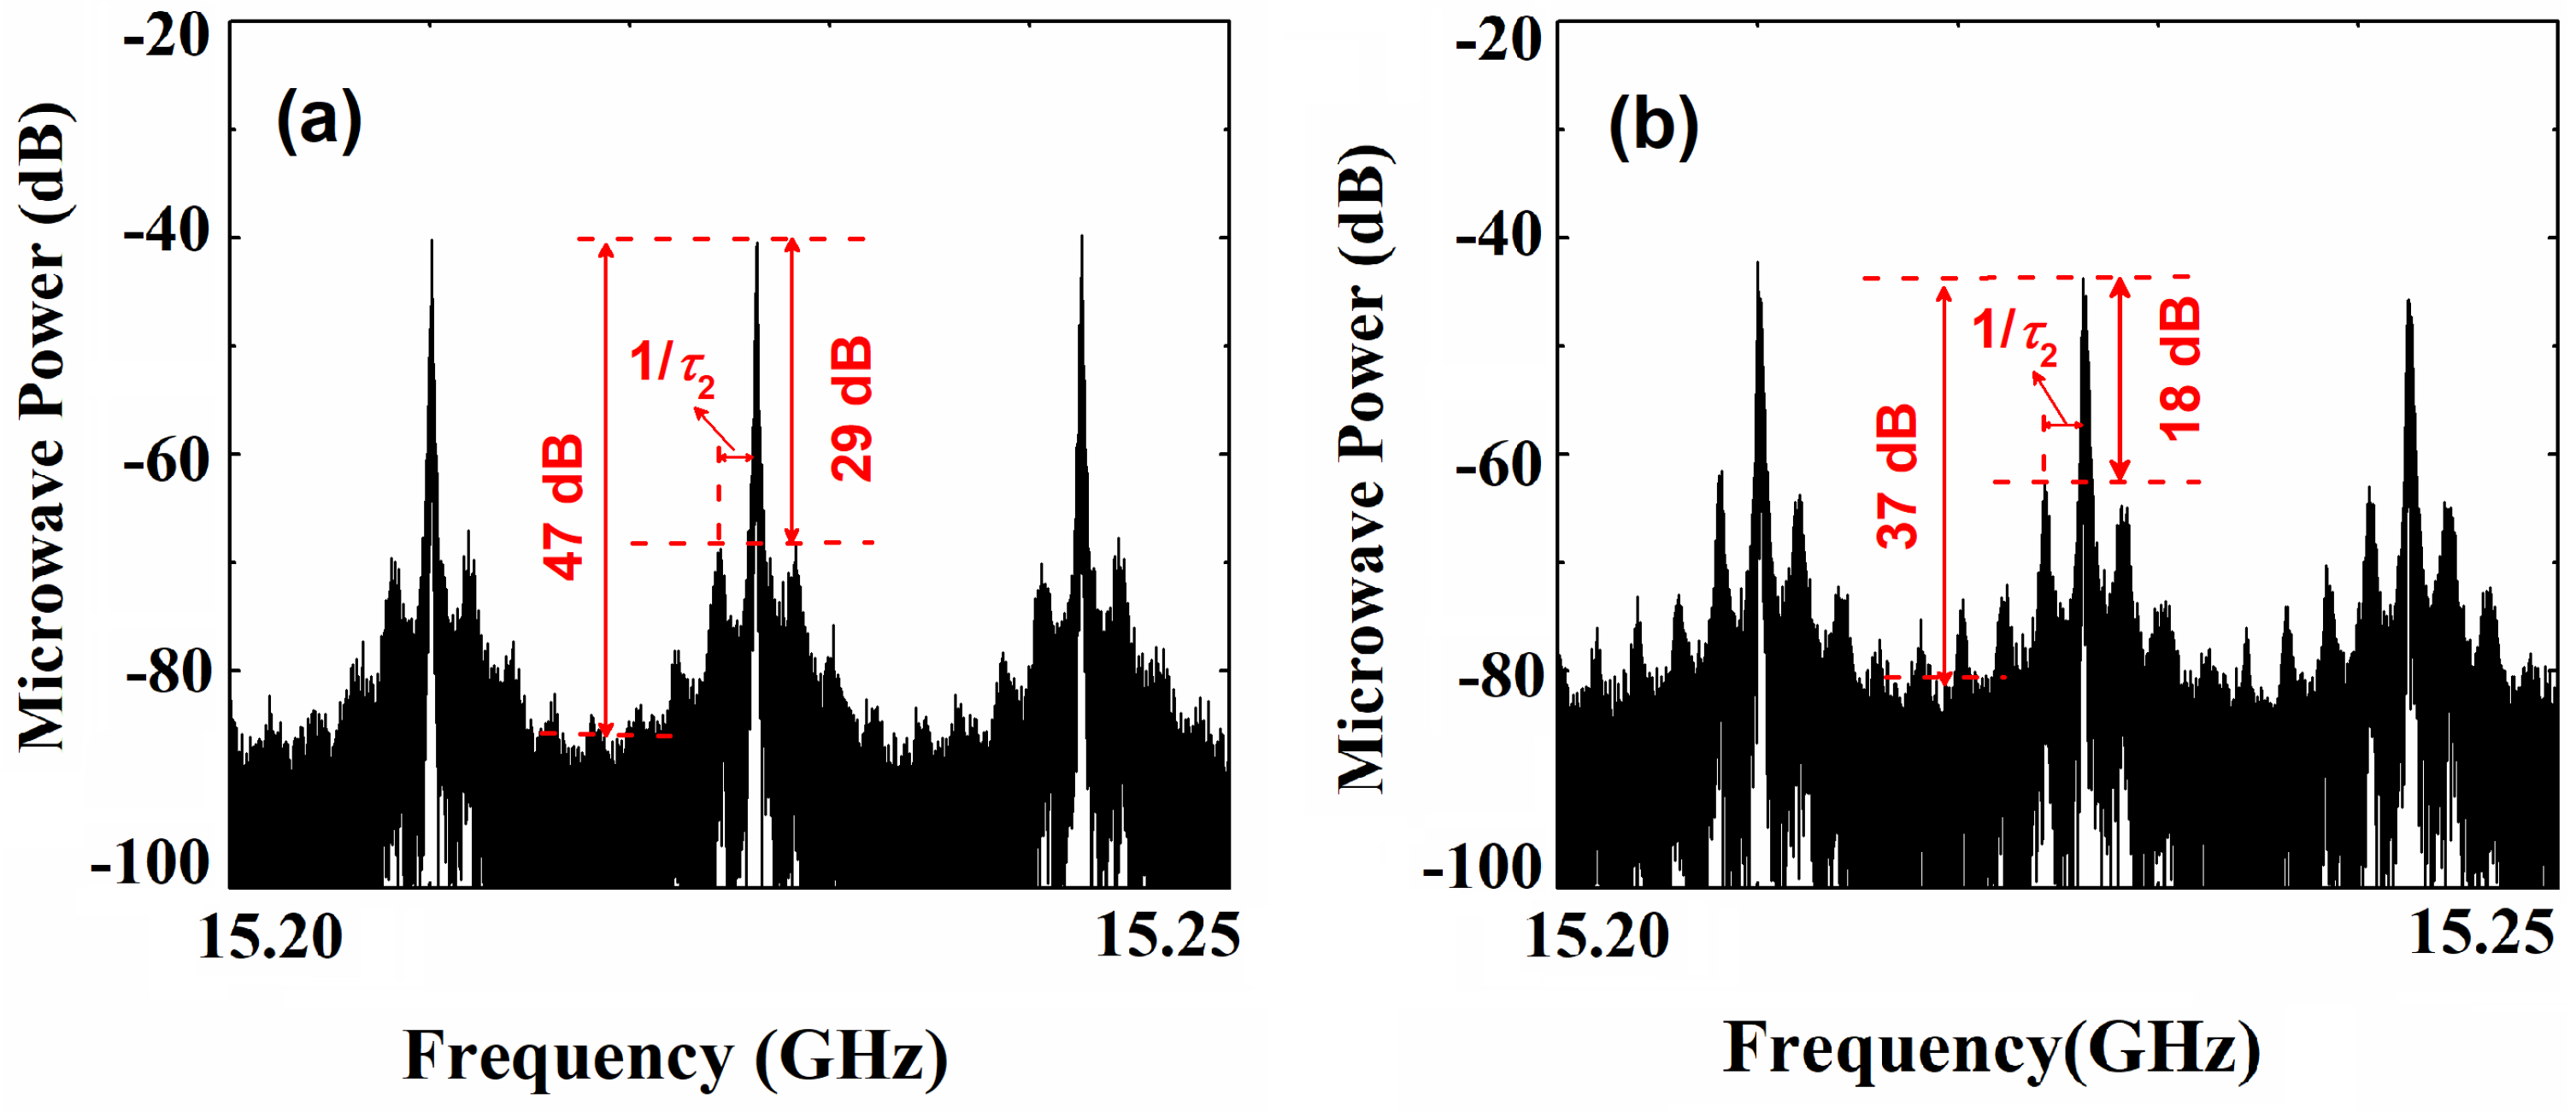
Figure 7 shows the power spectra of the MFC with a span of 50 MHz. Side peaks, spaced at 1 / τ 2 intervals around the MFC, are observed. It is evident that the external cavity mode (ECM) originating from loop 2 leads to these side peaks. These side peaks can reduce the purity of the MFC, making them undesirable. Therefore, it is crucial to investigate the impact of feedback parameters on these side peaks. To quantitatively describe the side peaks, we define the side-peak suppression coefficient (SPSC) as the ratio of the MFC line power to that of the strongest side-peak power. For instance, when κ 1 = 0.10 and κ 2 = 0.04, as shown in Figure 7a, the SPSC measures 29 dB with the power of the side peaks around −70 dB. As shown in Figure 7b, when κ 2 = 0.08, the side peak power increases to approximately −62 dB, and the line power experiences a slight decrease to approximately −44 dB, resulting in a decrease in SPSC to around 18 dB. Moreover, as it shows, the comb contrast also witnesses a drop of ∼10 dB (from 47 dB at κ 2 = 0.04 to 37 dB at κ 2 = 0.08).
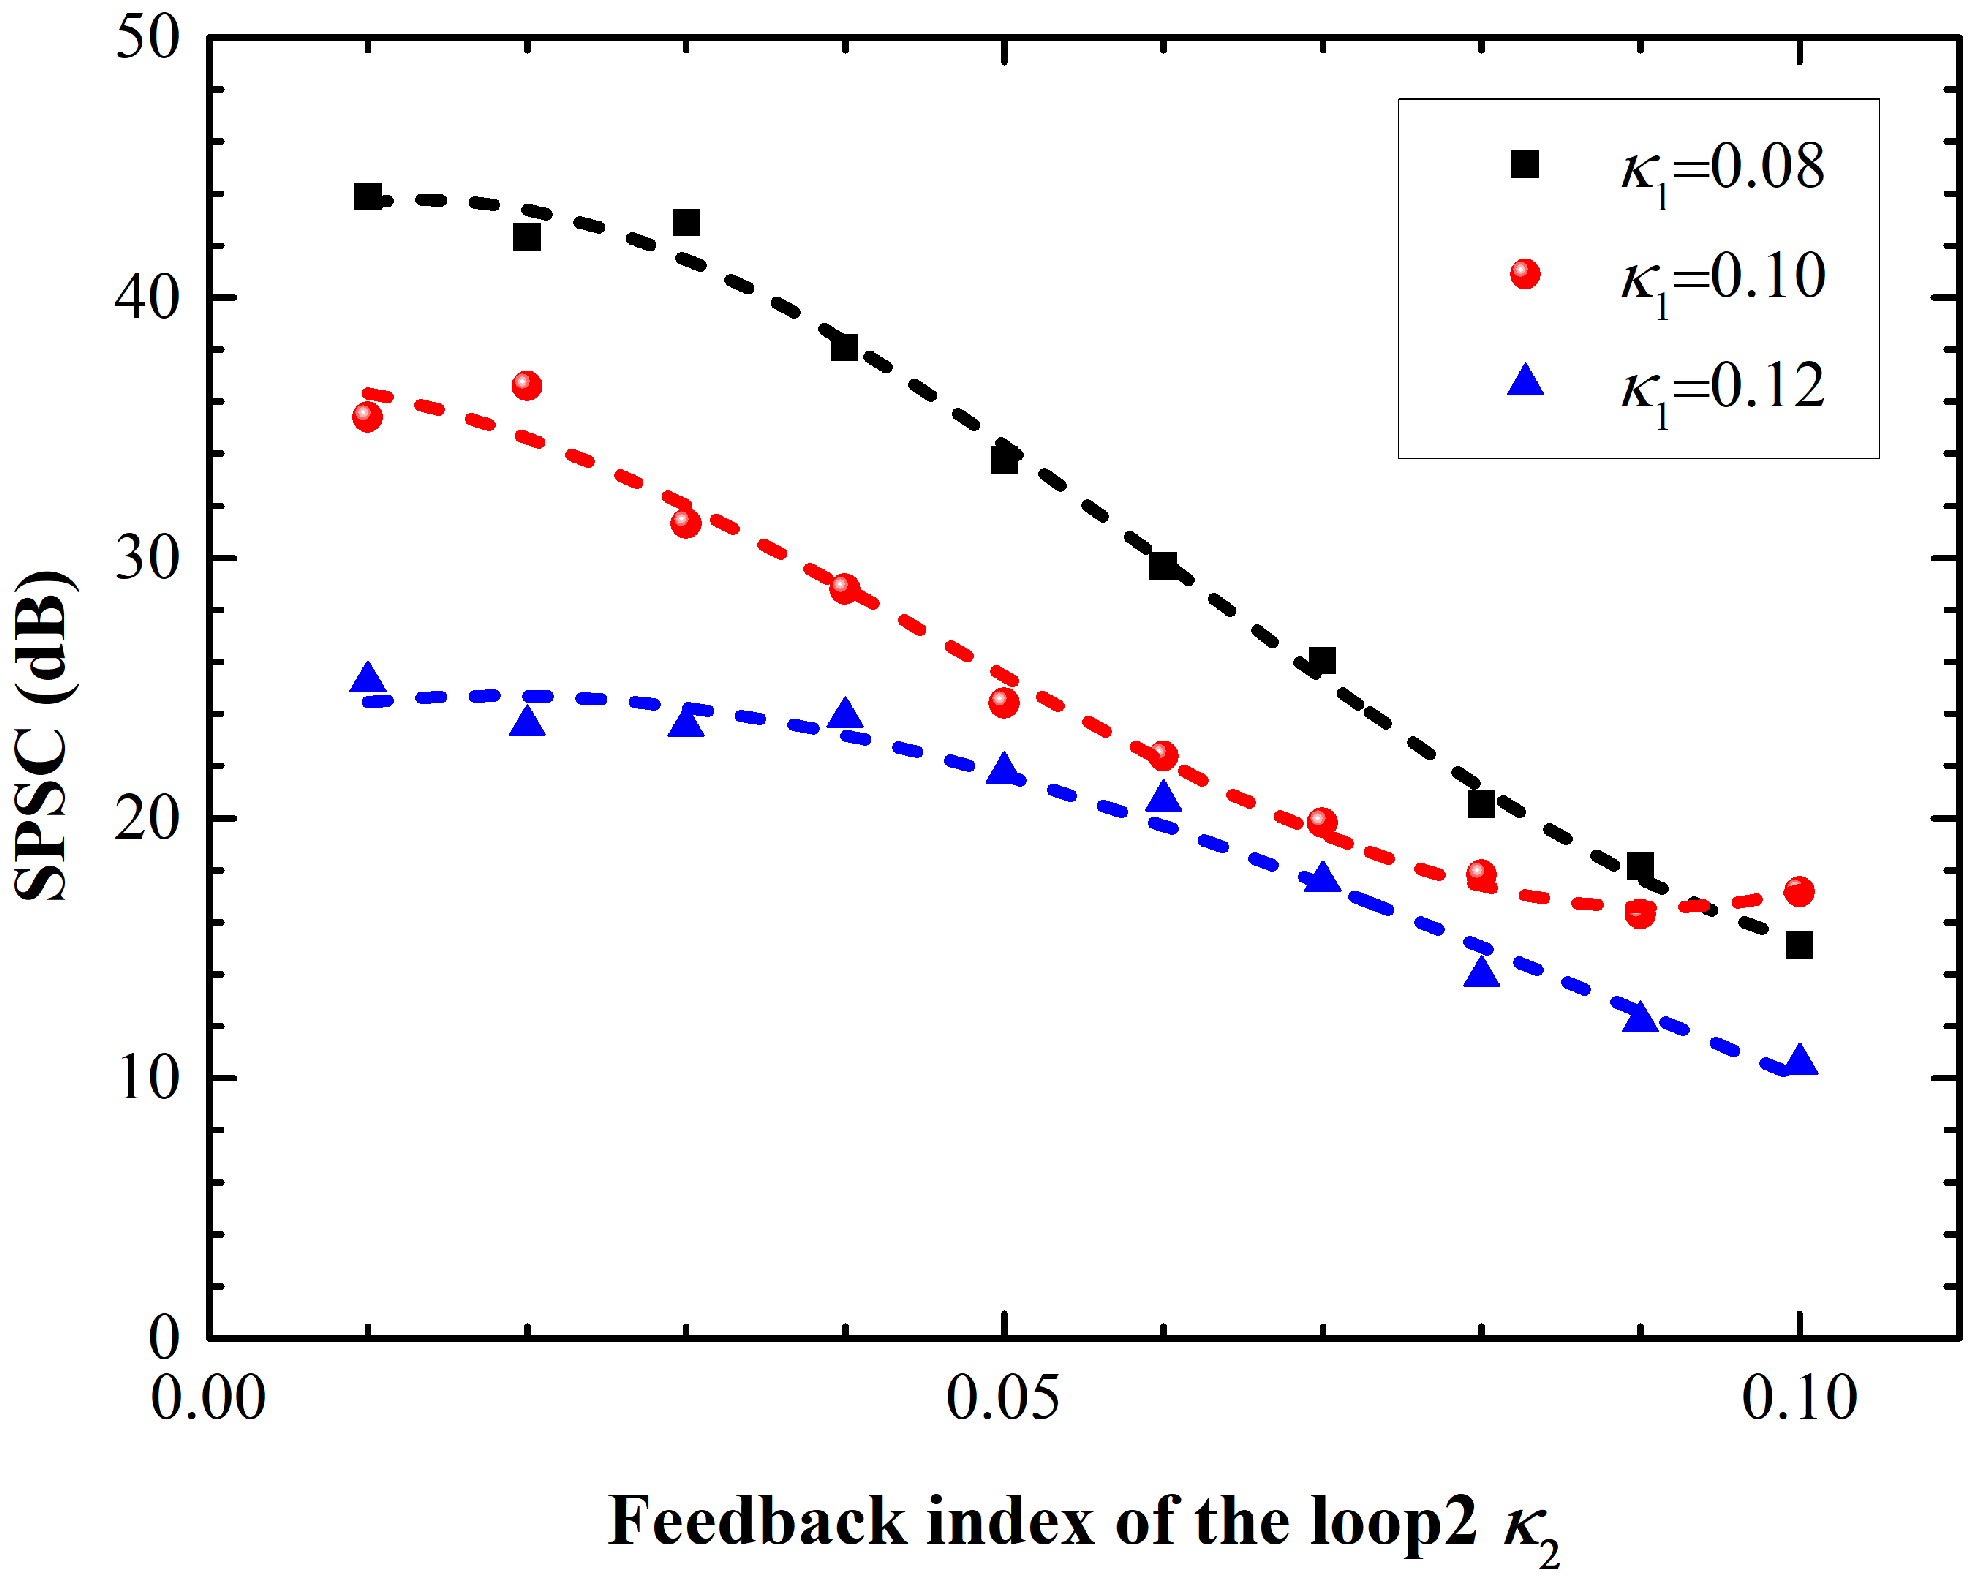
Figure 8 presents the SPSC as a function of κ 2 with different κ 1 . As κ 2 increases, the SPSC decreases, particularly when k 2 > 0.02. This reduction is attributed to the strengthening of feedback, which enhances the presence of the ECM and consequently diminishes the SPSC. Furthermore, it is noteworthy that κ 1 = 0.08 holds the highest SPSC, while κ 1 = 0.12 results in the lowest SPSC. This difference can be attributed to the power evolution of the MFC influenced by κ 1 [Seeing Figure 6].
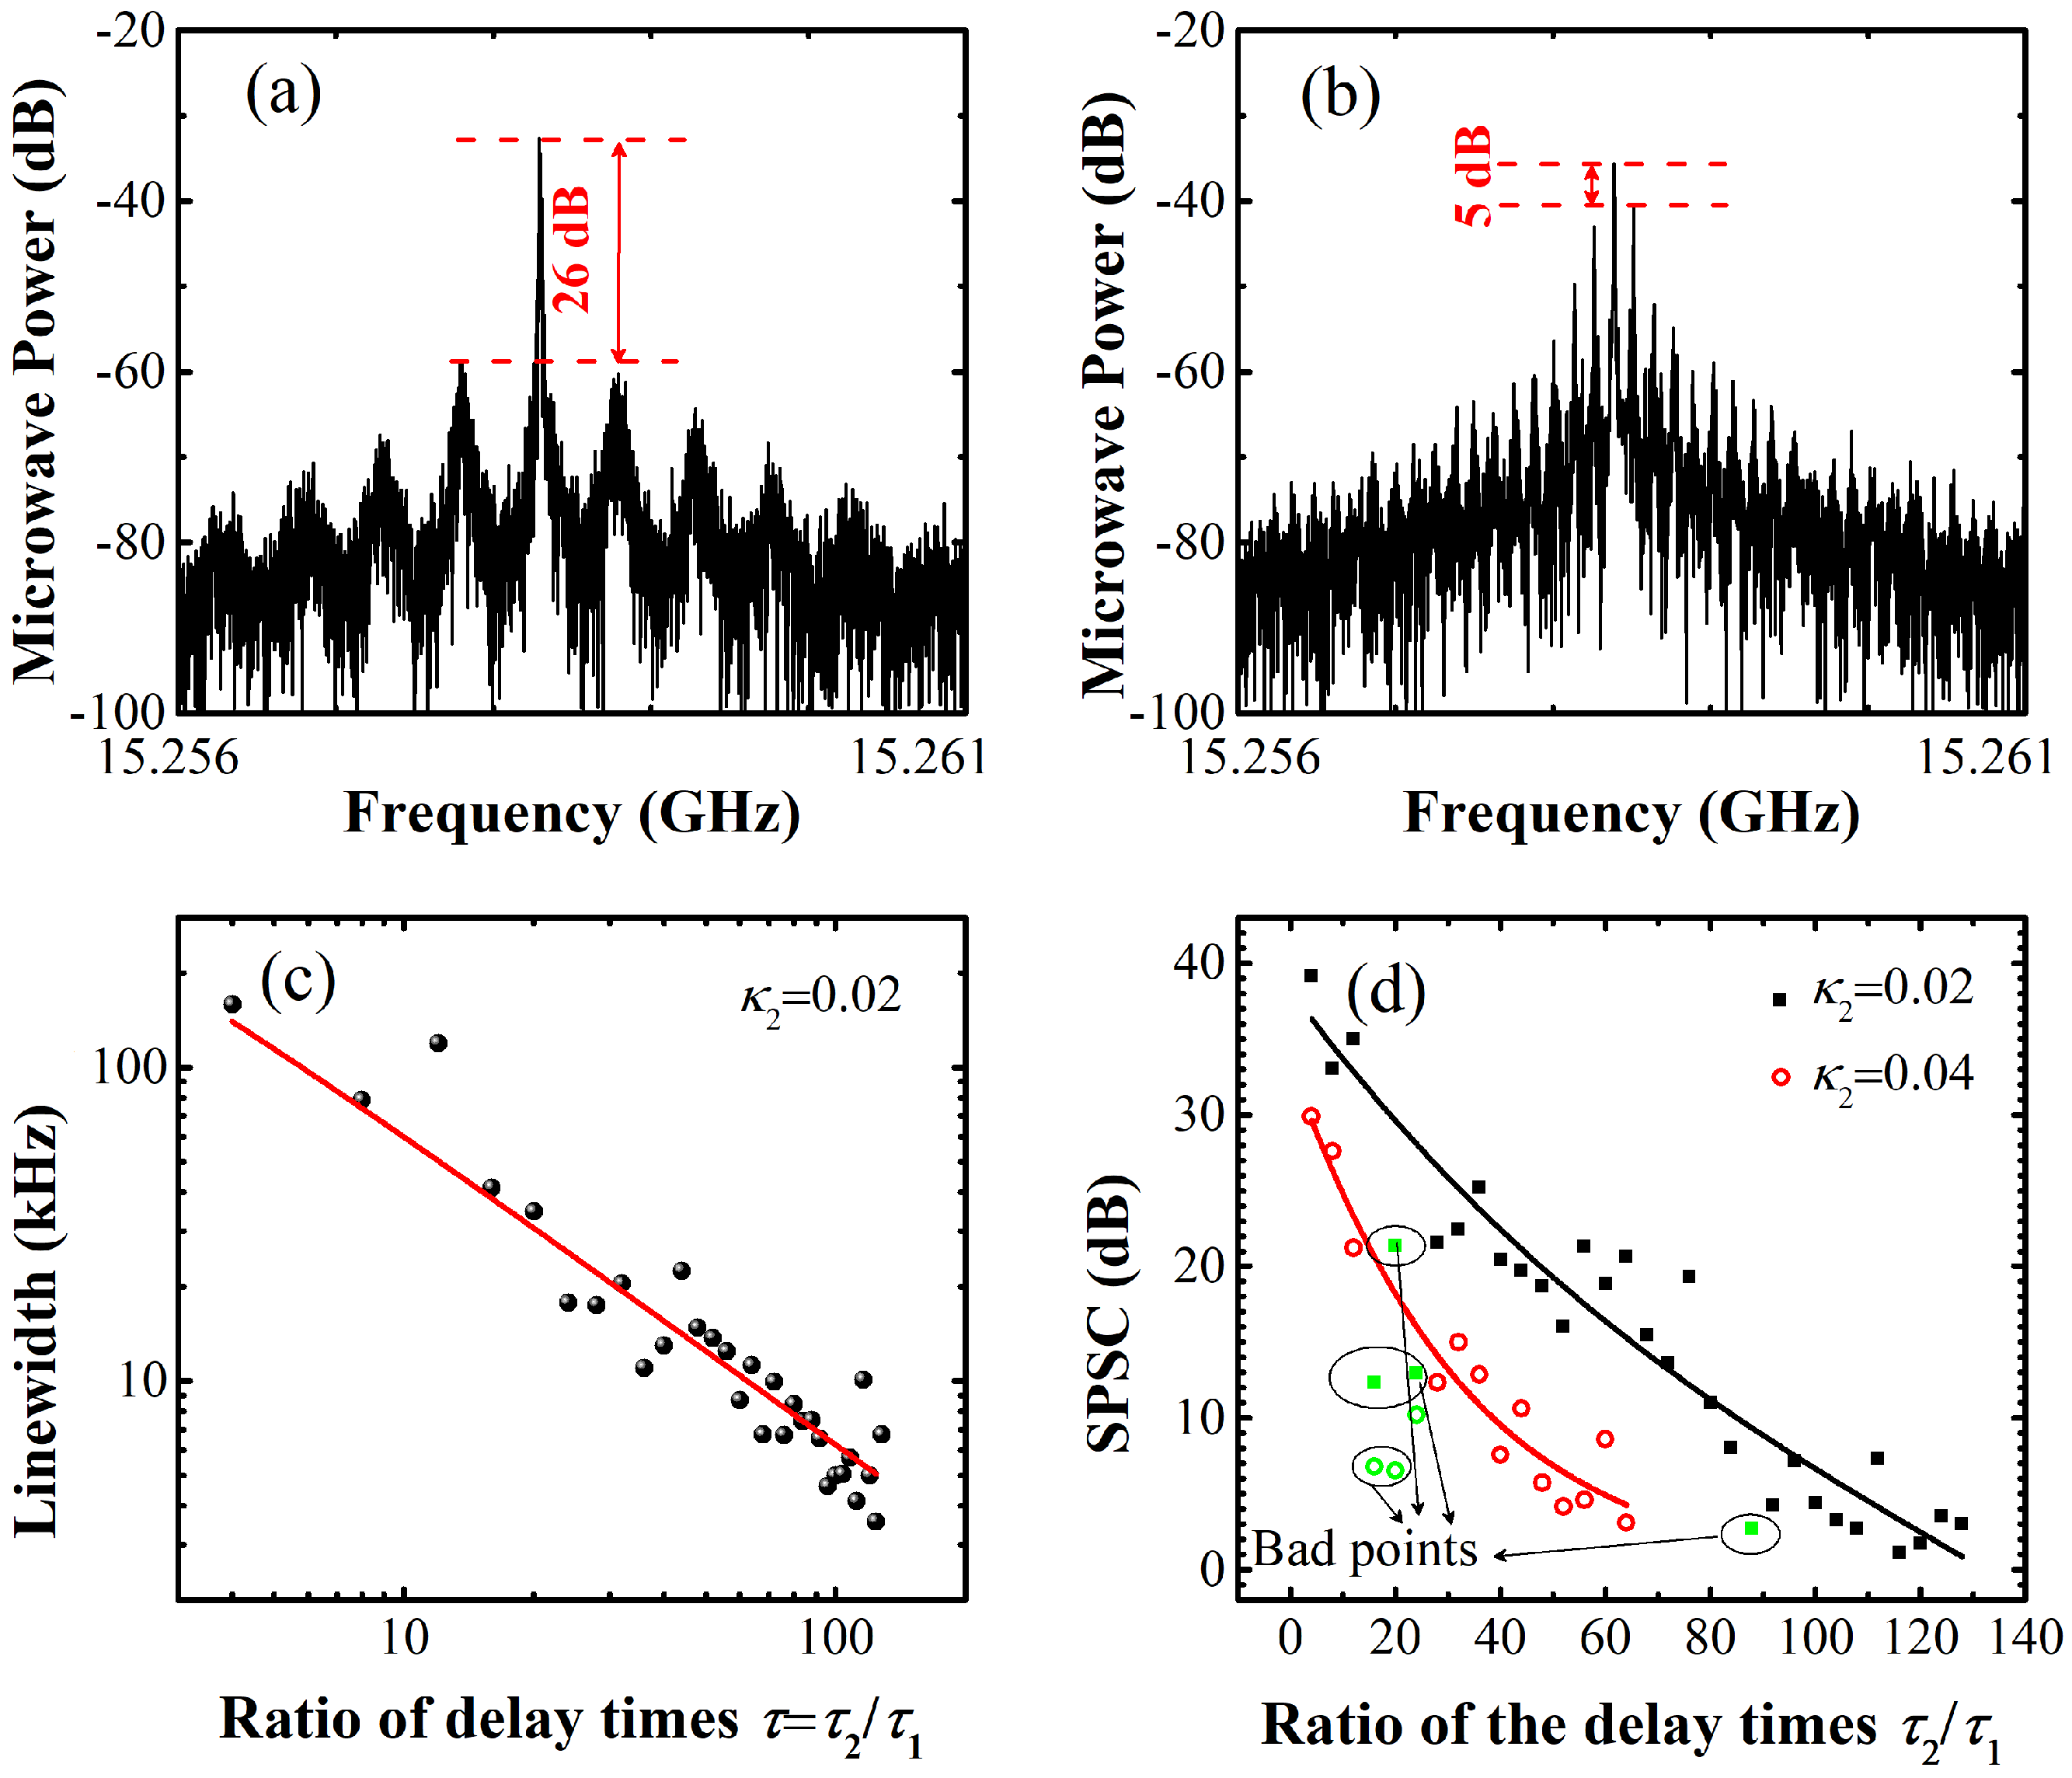
The time delay ratio τ = τ 2 / τ 1 of the feedback loops also plays a key role in reducing the MFC linewidth, as experimentally demonstrated in previous research [26]. Figure 9a,b present the MFC spectra for the cases with τ = 32 and τ = 128, respectively. With τ = 32, the SPSC is about 26 dB, whereas for the case with τ = 128, the SPSC decreases to approximately 7 dB. Figure 9c illustrates the evolution of linewidth as a function of the delay time ratio. Clearly, as τ increases, the linewidth decreases, and this reduction follows an approximate power function (as indicated by the red curve representing the exponential function fitting). Figure 9d shows the SPSC evolution as a function of the time delay ratio. The squares and dots are representative cases with κ 2 = 0.02 and 0.04, respectively. As τ increases, the SPSC undergoes a rapid decrease (as indicated by the solid curves representing third-order polynomial fitting). Additionally, it is worth noting that in the case with κ 2 = 0.02, the SPSC undergoes a rapid decrease (as indicated by the solid curves representing third-order polynomial fitting). When κ 2 increases to 0.04, a similar evolution trend can still be observed, but with a worse SPSC. Furthermore, some data points in the SPSC evolution as τ increases appear to be significantly lower than expected. This discrepancy arises from the lack of phase matching between the two feedback loops.The above results show that there is trade-off between the linewidth performance and the SPSC. Therefore, by carefully balancing these parameters, optimal conditions for MFC can be achieved based on specific performance requirements.

4. Discussion

In this study, we conducted a detailed numerical analysis of MFC generation based on P1 dynamics. Our results reveal the critical role of optoelectronic feedback mechanisms in improving the performance of MFC generation systems. Specifically, by integrating a specialized delay time setting, we have demonstrated the potential of optoelectronic feedback to enhance MFC performance through mode-locking, resulting in both narrow linewidth and sustained long-term stability. Our research finds that the feedback index plays a pivotal role in high-performance MFC generation. For a single optoelectronic, the stability of the MFC increases with the increase in the feedback index in the high-feedback index regime. However, there is an optimal feedback index for achieving the narrowest linewidth. Our results show that a 300 kHz MFC linewidth is attainable at a feedback index of 0.08. The introduction of a second optoelectronic feedback mechanism further enhances the quality of the MFC generated, illustrating the impact of both feedback index and delay time adjustments in feedback loop 2 (the longer feedback loop). We observed that increasing the feedback index initially narrows the linewidth, which subsequently broadens. It is also worth noting that the feedback index in loop 2 should be smaller than that in loop 1. Moreover, we noted that increasing the delay time ratio leads to an almost exponential reduction in linewidth. However, employing the second feedback loop introduces external cavity modes, which can cause undesirable side-peaks around the main MFC line, especially at larger feedback delay time ratios.

Author Contributions

Conceptualization, writing—original draft, C.X.; investigation, validation, W.C.; writing—review editing, B.Z.; project administration, funding acquisition, Z.Z.; supervision, writing—review editing, Y.H. All authors have read and agreed to the published version of the manuscript.

Funding

This work was supported in part by the National Natural Science Foundation of China (Grant Nos. 62005129, 62175116, 62201279), Foundation of Jiangsu Provincial Double-Innovation Doctor Program under Grant (Grant No. CZ106SC20020), Nanjing University of Posts and Telecommunications Start Funding (Grant No. NY220079), the 1311 Talent Plan of NJUPT, and Project of Key Laboratory of Radar Imaging and Microwave Photonics (Nanjing University of Aeronautics and Astronautics), Ministry of Education (Grant No. NJ20220001).

Institutional Review Board Statement

Not applicable.

Informed Consent Statement

Not applicable.

Data Availability Statement

Data underlying the results presented in this paper are not publicly available at this time but may be obtained from the authors upon reasonable request.

Conflicts of Interest

The authors declare no conflicts of interest.

References

  1. Lin, F.Y.; Liu, J.M. Diverse waveform generation using semiconductor lasers for radar and microwave applications. IEEE J. Quantum Electron. 2004, 40, 682–689. [Google Scholar] [CrossRef]
  2. Xu, Z.; Shu, X. Fiber Optic Sensor Based on Vernier Microwave Frequency Comb. J. Lightw. Technol. 2019, 37, 3503–3509. [Google Scholar] [CrossRef]
  3. Yasui, T.; Yokoyama, S.; Inaba, H.; Minoshima, K.; Nagatsuma, T.; Araki, T. Terahertz Frequency Metrology Based on Frequency Comb. IEEE J. Sel. Topics Quantum Electron. 2011, 17, 191–201. [Google Scholar] [CrossRef]
  4. Ng’oma, A.; Fortusini, D.; Parekh, D.; Yang, W.; Sauer, M.; Benjamin, S.D.; Hofmann, W.H.E.; Amann, M.C.; Chang-Hasnain, C.J. Performance of a Multi-Gb/s 60 GHz Radio Over Fiber System Employing a Directly Modulated Optically Injection-Locked VCSEL. J. Lightw. Technol. 2010, 28, 2436–2444. [Google Scholar] [CrossRef]
  5. Hagmann, M.J.; Stenger, F.S.; Yarotski, D.A. Linewidth of the harmonics in a microwave frequency comb generated by focusing a mode-locked ultrafast laser on a tunneling junction. J. Appl. Phys. 2013, 114, 223107. [Google Scholar] [CrossRef]
  6. Hagmann, M.J.; Efimov, A.; Taylor, A.J.; Yarotski, D.A. Microwave frequency-comb generation in a tunneling junction by intermode mixing of ultrafast laser pulses. Appl. Phys. Lett. 2011, 99, 011112. [Google Scholar] [CrossRef]
  7. Chan, S.C.; Xia, G.; Liu, J.M. Optical generation of a precise microwave frequency comb by harmonic frequency locking. Opt. lett. 2007, 32, 1917–1919. [Google Scholar] [CrossRef] [PubMed]
  8. Quirce, A.; de Dios, C.; Valle, A.; Acedo, P. VCSEL-Based Optical Frequency Combs Expansion Induced by Polarized Optical Injection. IEEE J. Sel. Topics Quantum Electron. 2019, 25, 1–9. [Google Scholar] [CrossRef]
  9. AlMulla, M. Microwave frequency comb generation through optical double-locked semiconductor lasers. Optik 2020, 223, 165506. [Google Scholar] [CrossRef]
  10. Rosado, A.; Martin, E.P.; Pérez-Serrano, A.; Tijero, J.M.G.; Esquivias, I.; Anandarajah, P.M. Optical frequency comb generation via pulsed gain-switching in externally-injected semiconductor lasers using step-recovery diodes. Opt. Laser Technol. 2020, 131, 106392. [Google Scholar] [CrossRef]
  11. Doumbia, Y.; Wolfersberger, D.; Panajotov, K.; Sciamanna, M. Tailoring frequency combs through VCSEL polarization dynamics. Opt. Express 2021, 29, 33976–33991. [Google Scholar] [CrossRef] [PubMed]
  12. Jain, G.; Gutierrez-Pascual, D.; Wallace, M.J.; Donegan, J.F.; Anandarajah, P.M. Experimental Investigation of External Optical Injection and its Application in Gain-Switched Wavelength Tunable Optical Frequency Comb Generation. J. Lightw. Technol. 2021, 39, 5884–5895. [Google Scholar] [CrossRef]
  13. Wu, B.; Zhao, Q. Research on Optical Mutual Injection to Generate Tunable Microwave Frequency Combs. Photonics 2024, 11, 195. [Google Scholar] [CrossRef]
  14. Li, W.; Yao, J. Investigation of Photonically Assisted Microwave Frequency Multiplication Based on External Modulation. IEEE Trans. Microw. Theory Tech. 2010, 58, 3259–3268. [Google Scholar] [CrossRef]
  15. Juan, Y.S.; Lin, F.Y. Ultra broadband microwave frequency combs generated by an optical pulse-injected semiconductor laser. Opt. Express 2009, 17, 18596–18605. [Google Scholar] [CrossRef] [PubMed]
  16. Fan, L.; Xia, G.; Tang, X.; Deng, T.; Chen, J.J.; Lin, X.; Li, Y.N.; Wu, Z. Tunable Ultra-Broadband Microwave Frequency Combs Generation Based on a Current Modulated Semiconductor Laser Under Optical Injection. IEEE Access 2017, 5, 17764–17771. [Google Scholar] [CrossRef]
  17. Xu, X.Q.; Fan, L.; Xia, G.; Wu, Z. Numerical Investigation on Ultra-Broadband Tunable Microwave Frequency Comb Generation Using a Semiconductor Laser under Regular Pulse Injection. IEEE Access 2018, 6, 55284–55290. [Google Scholar] [CrossRef]
  18. Shen, Z.; Jin, C.; Yang, J.; Zhang, S.; Tang, M.; Wang, K. Method for the generation of microwave frequency combs based on a Vernier optoelectronic feedback loop. Opt. Express 2020, 28, 35118–35127. [Google Scholar] [CrossRef] [PubMed]
  19. Li, Y.; Wang, M.; Gao, P.; Zhang, J.; Yin, B.; Wang, C.; Fan, G. Tunable Microwave Frequency Comb Generation Based on Actively Mode-Locked OEO. IEEE Photon. Technol. Lett. 2023, 35, 221–224. [Google Scholar] [CrossRef]
  20. Zhao, W.; Mao, Y.; Li, Y.; Chen, G.; Lu, D.; Kan, Q.; Zhao, L. Frequency-Tunable Broadband Microwave Comb Generation Using an Integrated Mutually Coupled DFB Laser. IEEE Photon. Technol. Lett. 2020, 32, 1407–1410. [Google Scholar] [CrossRef]
  21. Lo, K.H.; Hwang, S.K.; Donati, S. Optical feedback stabilization of photonic microwave generation using period-one nonlinear dynamics of semiconductor lasers. Opt. Express 2014, 22, 18648–18661. [Google Scholar] [CrossRef]
  22. Zhuang, J.; Chan, S.C. Tunable photonic microwave generation using optically injected semiconductor laser dynamics with optical feedback stabilization. Opt. Lett. 2013, 38, 344–346. [Google Scholar] [CrossRef]
  23. Ji, S.; Hong, Y.; Spencer, P.S.; Benedikt, J.; Davies, I. Broad tunable photonic microwave generation based on period-one dynamics of optical injection vertical-cavity surface-emitting lasers. Opt. Express 2017, 25, 19863–19871. [Google Scholar] [CrossRef] [PubMed]
  24. Zhuang, J.; Chan, S.C. Phase noise characteristics of microwave signals generated by semiconductor laser dynamics. Opt. Express 2015, 23, 2777–2797. [Google Scholar] [CrossRef] [PubMed]
  25. Alharthi, S.S. Broad tunable photonic microwave signal generation using optically-injected 1310 nm spin-VCSELs. Results Phys. 2022, 44, 106007. [Google Scholar] [CrossRef]
  26. Zhang, R.; Zhou, P.; Li, K.; Bao, H.; Li, N. Photonic generation of high-performance microwave frequency combs using an optically injected semiconductor laser with dual-loop optoelectronic feedback. Opt. Lett. 2021, 46, 4622–4625. [Google Scholar] [CrossRef] [PubMed]
  27. Zhou, P.; Zhang, F.; Guo, Q.; Li, S.; Pan, S. Reconfigurable Radar Waveform Generation Based on an Optically Injected Semiconductor Laser. IEEE J. Sel. Topics Quantum Electron. 2017, 23, 1–9. [Google Scholar] [CrossRef]
  28. Zhou, P.; Zhang, F.; Pan, S. Generation of Linear Frequency-Modulated Waveforms by a Frequency-Sweeping Optoelectronic Oscillator. J. Lightw. Technol. 2018, 36, 3927–3934. [Google Scholar] [CrossRef]
  29. Zhuang, J.; Li, X.Z.; Li, S.; Chan, S.C. Frequency-modulated microwave generation with feedback stabilization using an optically injected semiconductor laser. Opt. Lett. 2016, 41, 5764–5767. [Google Scholar] [CrossRef]
  30. Xue, C.; Ji, S.; Hong, Y.; Jiang, N.; Li, H.; Qiu, K. Numerical investigation of photonic microwave generation in an optically injected semiconductor laser subject to filtered optical feedback. Opt. Express 2019, 27, 5065–5082. [Google Scholar] [CrossRef]
  31. Kim, H.; Gnauck, A.H. Chirp characteristics of dual-drive. Mach-Zehnder modulator with a finite DC extinction ratio. IEEE Photon. Technol. Lett. 2002, 14, 298–300. [Google Scholar]
  32. Simpson, T.B.; Liu, J.M.; Huang, K.F.; Tai, K. Nonlinear dynamics induced by external optical injection in semiconductor lasers. Quantum Semiclass. Opt. 1997, 9, 765–784. [Google Scholar] [CrossRef]
  33. Ji, S.; Xue, C.; Valle, A.; Spencer, P.S.; Li, H.; Hong, Y. Stabilization of Photonic Microwave Generation in Vertical-Cavity Surface-Emitting Lasers with Optical Injection and Feedback. J. Lightw. Technol. 2018, 36, 4347–4353. [Google Scholar] [CrossRef]
  34. Xue, C.; Chang, D.S.; Fan, Y.; Ji, S.; Zhang, Z.; Lin, H.; Spencer, P.S.; Hong, Y. Characteristics of microwave photonic signal generation using vertical-cavity surface-emitting lasers with optical injection and feedback. J. Opt. Soc. Am. B 2020, 37, 1394–1400. [Google Scholar] [CrossRef]
  35. Brunel, M.; Vallet, M. Pulse-to-pulse coherent beat note generated by a passively Q-switched two-frequency laser. Opt. Lett. 2008, 33, 2524–2526. [Google Scholar] [CrossRef]
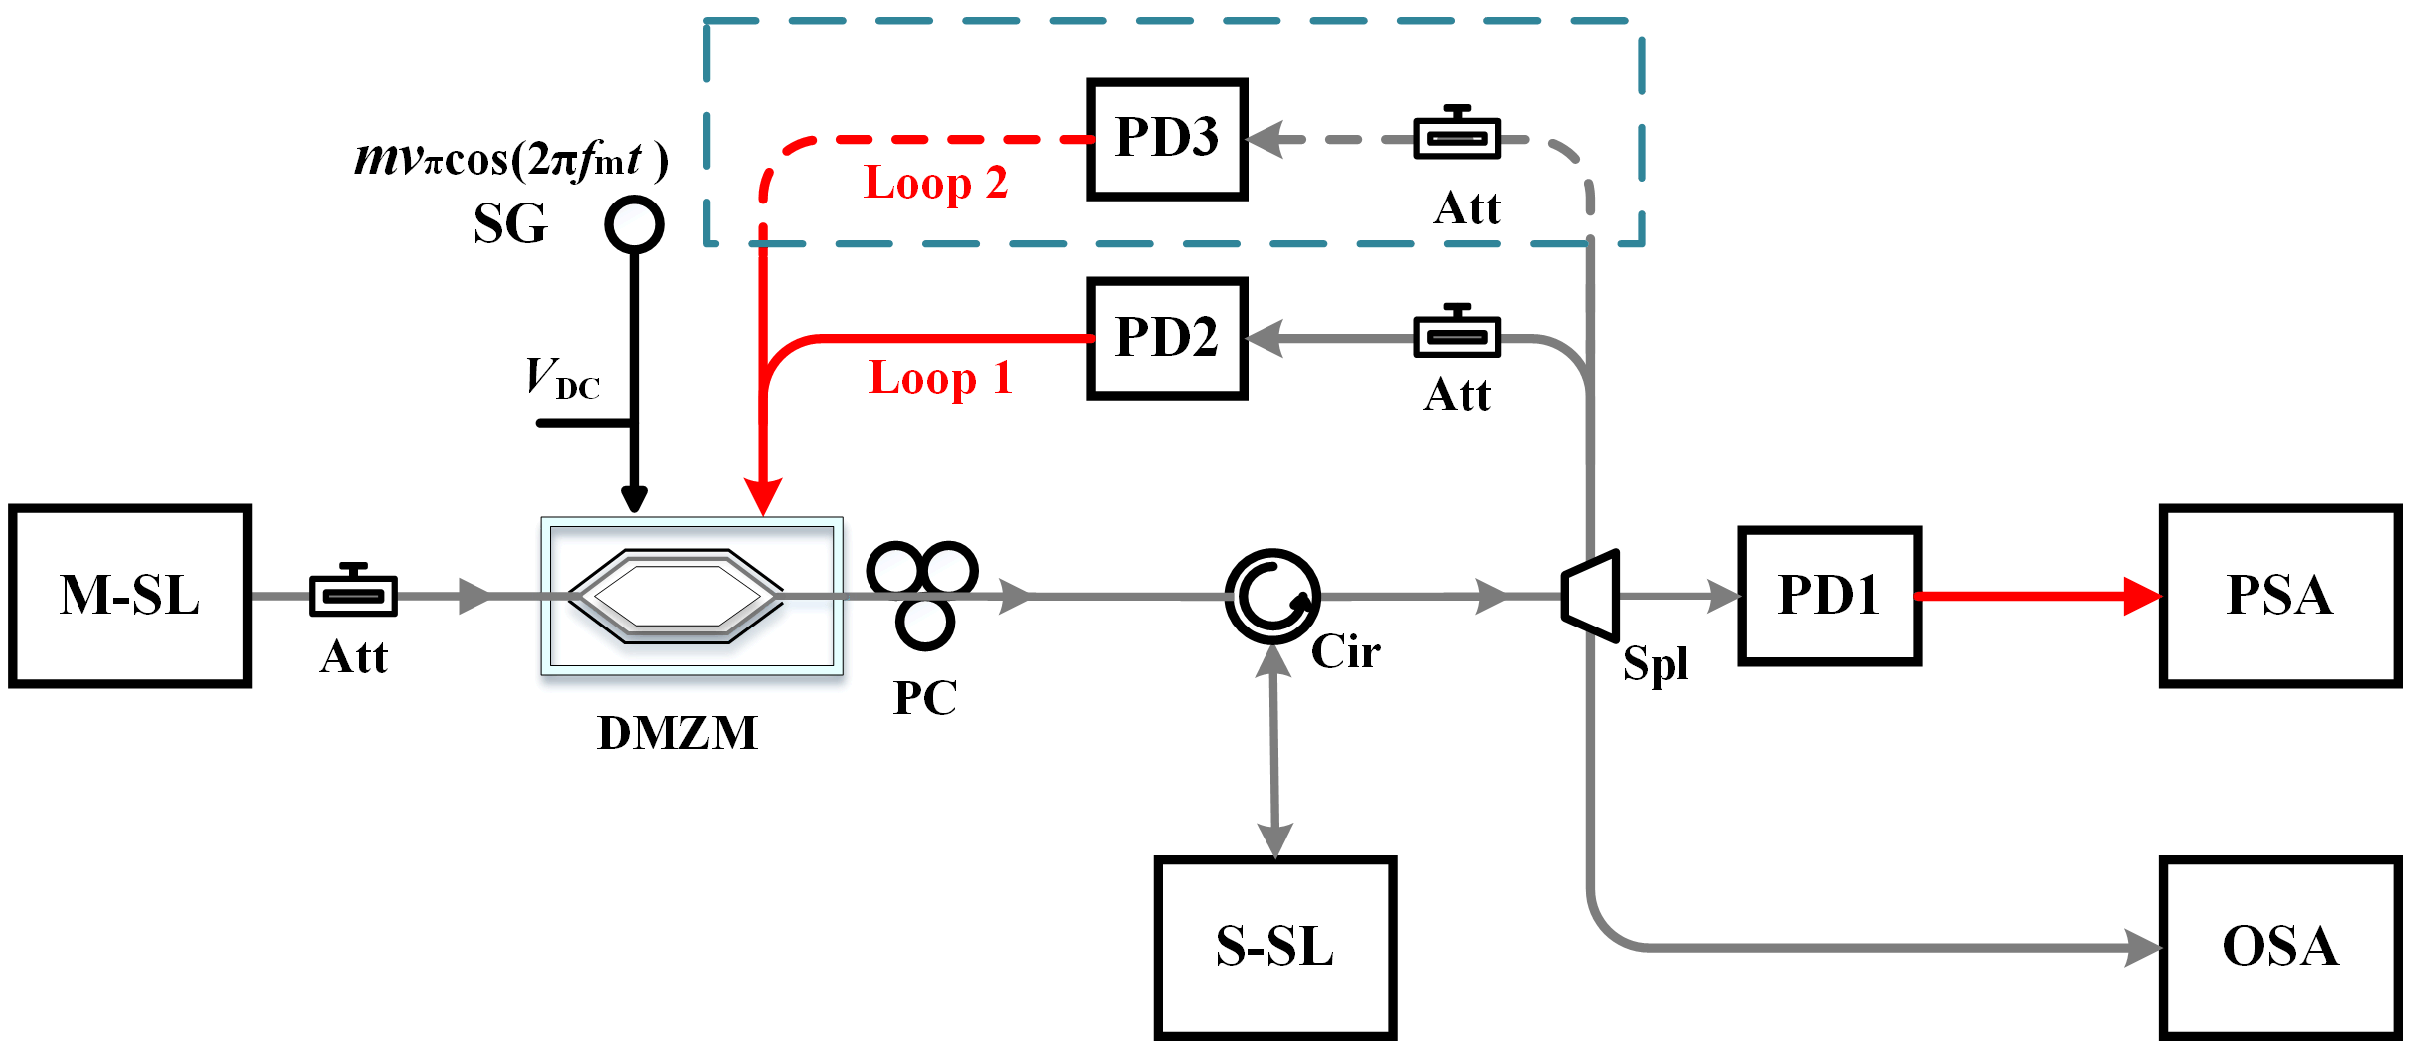
Figure 1. Scheme diagram of the MFC based on the modulated optical injection and optoelectronic feedback. PD: photodetector, Att: attenuator, PC: polarization controller, SG: signal generator, Cir: optical circulator, Spl: splitter, DMZM: dual-drive Mach–Zehnder modulator, OSA: optical spectrum analyzer, PSA: power spectrum analyzer.
Photonics 11 00741 g001
Figure 2. Optical spectra (left column) and power spectra (right column) of the case with injection parameters (0.13, 7 GHz): (a,b) correspond to the case with conventional optical injection, (c,d) are for the case with modulated optical injection.
Photonics 11 00741 g002
Figure 3. Bandwidth of the MFC as a function of modulation index. The insets (a,b) show the MFC spectra with respect to the modulation index m = 0.05 and m = 0.12, respectively.
Photonics 11 00741 g003
Figure 4. Power spectra of the generated dense MFC signals when the single-loop feedback τ 1 = 61.53 ns: (a,b) with κ 1 = 0.04, (c,d) with κ 1 = 0.08, (e,f) with κ 1 = 0.10, and (g,h) with κ 1 = 0.12.
Photonics 11 00741 g004
Figure 5. (a) Boxplot of line power with extreme values and quartiles and (b) 3-dB linewidth of the MFC as a function of feedback index κ 1 .
Photonics 11 00741 g005
Figure 6. Boxplot of line power and linewidth of the MFC as a function of the second-loop feedback index κ 2 , τ 2 = 8 τ 1 : (a,d) are for the case with κ 1 = 0.08, (b,e) are for the case with κ 1 = 0.1, and (c,f) are for the case with κ 1 = 0.12.
Photonics 11 00741 g006
Figure 7. Power spectra of the MFC with (a) κ 2 = 0.04 and (b) κ 2 = 0.08, κ 1 = 0.10 and τ 2 = 8 τ 1 .
Photonics 11 00741 g007
Figure 8. SPSC as a function of feedback index in loop 2, κ 2 .
Photonics 11 00741 g008
Figure 9. Power spectra of the MFC where (a) τ = 32, (b) τ = 128, (c), and linewidth and (d) SPSC are a function of the delay time ratio, κ 1 = 0.10, and κ 2 = 0.02.
Photonics 11 00741 g009
Table 1. Summary of Symbols in the model.
ParametersSymbolValue
The cavity decay rate γ c 0.536 ps−1
The nonlinear carrier relaxation rate γ p 19.1 ns−1
The differential carrier relaxation rate γ n 7.53 ns−1
The spontaneous carrier relaxation rate γ s 5.96 ns−1
Linewidth enhancement factorb3.2
Frequency detuning of the optical injection f i 7 GHz
Injection strength ξ i 0.13
FWHM of the free-running slave SL Δ f 30 MHz
Half-wave voltage of the DMZM v π 1 V
DC bias voltage v D C v π / 2
Normalized bias currentJ1.222
Modulation index of the upper armm0.12
Modulation frequency of the upper arm f m 16.25 MHz
Disclaimer/Publisher’s Note: The statements, opinions and data contained in all publications are solely those of the individual author(s) and contributor(s) and not of MDPI and/or the editor(s). MDPI and/or the editor(s) disclaim responsibility for any injury to people or property resulting from any ideas, methods, instructions or products referred to in the content.