Abstract
In the vitrification of high-level radioactive liquid waste (HLW), the separation of sodium-molybdate melts is a problem because it reduces the chemical durability of the vitrified waste. A glass with both high MoO3 solubility and chemical durability is required for the safe disposal of radioactive waste. In this study, we investigate the effects of vanadium oxide on the phase separation of the molybdenum-rich phase and the water resistance of the resulting glass by phase equilibrium experiments and chemical durability test. Phase equilibrium experiments were performed on SiO2-B2O3-Al2O3-ZnO-CaO-Na2O-LiO2-MoO3 system glasses and on glasses with V2O5 added. The results showed that MoO3 solubility increased when V2O5 was added. The increase in MoO3 solubility in borosilicate melts may be associated with the viscosity-lowering effect of V2O5. Chemical durability tests were performed on borosilicate glass compositions obtained from phase equilibrium experiments. The normalized leaching rates of V2O5-bearing glasses were higher than those of other glasses. This is due to the higher network modifier/network former ratio of the glass tested. The normalized elemental mass loss of glass containing waste components increases with increasing leaching duration. This suggests that the waste component prevents the formation of a gel layer at the reaction front.
1. Introduction
High-level radioactive liquid waste (HLW) generated in the spent fuel reprocessing process melts with glass and is geologically disposed of as vitrified waste [1,2,3,4,5,6,7,8]. Glass used for vitrification requires high chemical durability. Many countries, including Japan, plan to use borosilicate glass for HLW vitrification [9,10,11,12,13]. Borosilicate glass is considered durable, easy to manufacture, and capable of homogeneously dissolving various elements.
In the vitrification process of HLW, it is necessary to pay attention to the behavior of molybdenum, which is one of the fission products. Molybdenum has low solubility in silicate melts and separates into borosilicate melts and sodium-molybdate melts by liquid-liquid immiscibility [14] during the melting stage. The molybdenum-rich separated phase, called as the yellow phase (YP), is highly soluble in water and can dissolve various fission products [15]. Therefore, the separation of YP significantly reduces the chemical durability of the vitrified waste [16,17]. The crystallization of the molybdenum phase has been investigated for glasses with various compositions [18,19,20,21,22,23,24,25,26,27,28,29]. It has been indicated that the solubility of MoO3 in borosilicate glasses increased with increasing B2O3/SiO2 ratio [19,25,28,29] and decreasing Al2O3 content [25,28,29].
In order to improve the solubility of molybdenum in waste glass, the effect of an additive component has also been examined. One of the candidates is vanadium-bearing glass. Manara et al. [30] reported that V2O5 added borosilicate glass exhibits a high immobilizing capacity for sulfur containing HLW. Lian et al. [26] indicated that the crystallization tendency of powellite (CaMoO4) was suppressed in V2O5 added borosilicate glasses, and the molybdenum solubility was improved. Moreover, chemical durability test (PCT) results showed that the normalized leaching rate of V2O5-bearing glass remained at a much lower level than that of standard borosilicate glass. Sugawara et al. [29] indicated that the addition of V2O5 accelerates the crystallization of powellite when the glass is slowly cooled (1 °C/min). This is the opposite result mentioned by Lian et al. [26], suggesting that cooling rate affects the crystallization tendency of powellite.
Although the crystallization of powellite has been investigated in detail, the effect of vanadium on the phase separation of sodium-molybdate, the main component of YP, has not yet been reported. In this study, we investigated the liquid-liquid immiscibility of V2O5-bearing MoO3-rich borosilicate melt by phase equilibrium experiments. We also report the water resistance of the resulting glass through a chemical durability test.
2. Experimental
2.1. Strategy
First, we describe the flow of our experiments using the schematic phase diagram shown in Figure 1. The initial composition of experimental material is C in Figure 1, which is a composition with X mol% MoO3 added to composition A. When the C is kept at temperature T1 and equilibrated, it separates into a silicate melt (D) and a molybdate melt (E). The composition F is the normalized composition of D without MoO3. Then, the MoO3 content of D is equal to the MoO3 solubility of F (Y mol%) under equilibrium conditions.
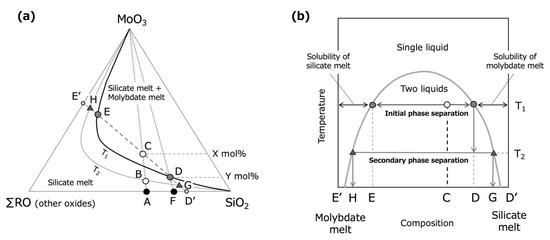
Figure 1.
Schematic phase diagram showing immiscibility between silicate liquid and molybdate liquid in (a) the pseudo-ternary system of SiO2-MoO3-∑RO (other oxides) estimated from the phase relationship of the SiO2-MoO3-Na2O system [31] and (b) the pseudo-binary system between D’ and E’ in (a). The black solid curve represents the phase boundary between a single liquid and two liquids at temperature T1, and the gray curve is at temperature T2 (T1 > T2). The initial composition of the phase equilibrium experiments in this study is composition C, which is composition A with X mol% MoO3 added. Since the C is in the two-phase region, it separates into a silicate melt of composition D and a molybdate melt of composition E when kept at T1. The MoO3 content in composition D (Y mol%) is equal to the saturation solubility of MoO3 for composition F.
In previous studies [19,20,21,22,23,24,26,27,29], solubility and crystallization of molybdenum phases have been examined by using glasses with a relatively smaller amount of MoO3 (<10 wt% or 5 mol%, for example, composition B in Figure 1). In this case, because MoO3 content is less than equilibrium solubility at temperature (T1), phase separation and/or crystallization may occur during cooling, even if it is a single liquid at T1. The opposite effect of vanadium oxide on the powellite crystallization described above may have been caused by the different cooling rate, quench in [26] and slow cooling in [29].
In contrast, phase equilibrium experiments for the samples with an excess amount of MoO3 provide equilibrium solubility. Based on those experiments, we have determined the phase separated compositions D and E in the borosilicate systems and used them for the thermodynamic analysis of liquid-liquid immiscibility [25,28]. In this study, we determined equilibrium MoO3 solubility by phase equilibrium experiments at 1200 °C or 1000 °C for a V2O5-bearing borosilicate system.
2.2. Phase Equilibrium Experiments
Chemical composition of starting materials is shown in Table 1.

Table 1.
Chemical composition of samples for phase equilibrium experiments (mol%).
The 19A2 composition is borosilicate glass, which is expected to be used in Japan for HLW vitrification [29,32]. The difference between the 19A2 and glass compositions of Lian et al. [26], who investigated the effect of vanadium, is that our glass has a higher Na2O/CaO ratio and contains ZnO and LiO2. The 21E has a composition of 19A2 with V2O5 added. The 21E2 has a composition with an increased B2O3/SiO2 ratio compared to the 21E in order to improve the MoO3 solubility.
Reagent grades SiO2, B2O3, Al2O3, ZnO, CaCO3, Na2CO3, Li2CO3, V2O5, and MoO3 were weighed and mixed in an agate mortar. The mixed sample was placed in a platinum crucible, covered with an alumina lid, and held in a heating furnace at 1200 °C or 1000 °C for 24 h. Then it was quenched by cooling the bottom of the crucible with water.
After the experiment, the sample separated into upper glass and lower precipitate. A few pieces of glass and precipitate were randomly selected, mounted in epoxy, and polished under oil. Backscattered electron images (BEI) of glass were observed using electro-probe microanalysis (EPMA).
The Li2O content of experimental samples was analyzed by Inductively Coupled Plasma Atomic Emission Spectroscopy (ICP-AES), B2O3 by EPMA, and other elements by X-ray Fluorescence analysis (XRF). For ICP-AES analysis, the sample was crushed, and acid decomposition was performed. The XRF analysis was carried out by the glass bead method.
The amounts (mass %) of phase separated glass, and precipitate, were determined by mass-balance calculation. Let and be the analytical values of oxide components (mass %) for glass and precipitate, respectively, and be the initial composition. Then, the , and the amount of B2O3-loss by volatilization during the experiment, were obtained by minimizing the residual, expressed by the following equation:
where i represents oxides other than B2O3.
Our preliminary experiments confirm that most of the B2O3 loss occurs within 6 h, after which the composition of the sample remains constant.
2.3. Chemical Durability Test
A chemical durability test was conducted to investigate the water resistance of the borosilicate glass after phase separation (D in Figure 1). In order to prevent the difference in leaching rate due to the difference in MoO3 content, Glass compositions were normalized to 100% without MoO3 (F in Figure 1), and then 2mol% MoO3, which is lower than the solubility limit, was added for all glasses. The glass composition is shown in Table 2. For comparison, we also tested simulated HLW glass containing waste components (Bead composition).
Table 2.
Chemical composition (mol%) of glasses for the chemical durability test. NF, Sum of network-forming or intermediate oxides (SiO2 + B2O3 + Al2O3 + ZnO + V2O5); NM, Sum of network-modifier oxides (CaO + Na2O + Li2O). The glass composition by Lian et al. [26] is also indicated for comparison.
The chemical durability test was conducted in accordance with MCC-3. The glass samples were crushed and sieved to adjust the particle size to 40–75 μm, ultrasonically cleaned in acetone, and dried. For the leaching solution, 1 L of ultrapure water was adjusted to pH 9 (room temperature) using KOH aqueous solution. A Teflon container was placed on a magnetic stirrer with a hot plate, and a thermocouple was attached to the container to measure the experimental temperature. The experiment was conducted at 90 °C. Once the temperature of the leaching solution in the Teflon container stabilized at 90 °C, 0.235 g of glass powder was added to the leaching solution. The solution was stirred during the test, but the water was not replaced. The leachates were collected after 2, 4, 6, 8, 24, 30, and 48 h, and the concentrations of Si and B were investigated using ICP-AES. The normalized leaching rate was obtained from the concentration of the leachate using the following formula,
where LRi is the normalized leaching rate (g/m2d), Ci is the concentration of element i in the leachate (g/L), fi is the weight fraction of element i in glass, V is the leachate volume (L), SA is the surface area of the powder sample (m2), and Δt is the experiment time (days). The SA was determined using a surface area analyzer in BET nitrogen adsorption. The SA was approximately 0.5 m2/g and the SA/V ratio was approximately 118 m−1.
3. Results and Discussion
3.1. Phase Separation of Borosilicate Melt and Molybdate Melt
After the experiment, the sample separated into silicate glass in the upper part and a molybdenum-rich precipitate in the lower part (Figure 2). It is considered that the glass in the upper part corresponds to the HLW glass, and the precipitates can be regarded as simulated YP. As for the appearance of the glass, 19A2 was white, and 21E and 21E2 were slightly yellowish. The precipitate of 19A2 was ivory and more brittle than glass, and those of 21E and 21E2 were ocher and slightly harder than that of 19A2.
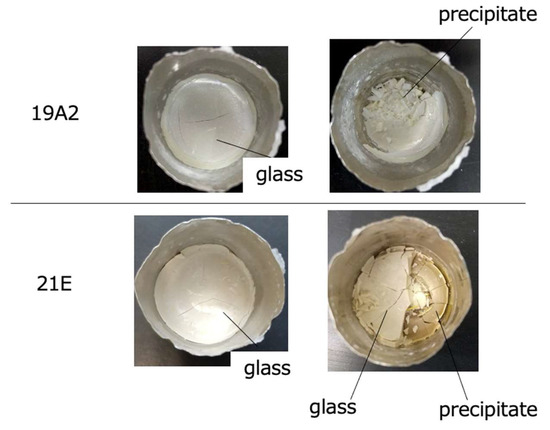
Figure 2.
Appearance of glass and precipitate was observed for 19A2 and 21E compositions after phase equilibrium experiments at 1200 °C.
Figure 3 shows backscattered electron images of the glass and precipitate. Spherical particles and holes with a diameter of about 1–3 μm were observed in the glass. They were higher at 1200 °C than at 1000 °C and more pronounced at 21E and 21E2 than at 19A2. Similar textures has been previously reported in MoO3-bearing sodium-rich silicate glasses [29,33].
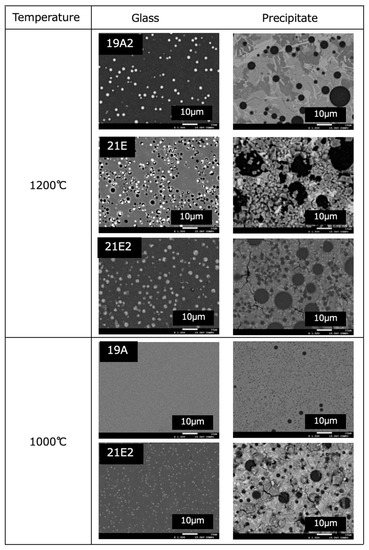
Figure 3.
Backscattered electron images of glass and precipitate.
EPMA analysis indicated the spherical particles were Powellite (CaMoO4). The white color of the glass (Figure 2) is derived from those powellite particles. These powellites were not originally precipitated at experimental temperatures and are considered to have been formed by nucleation and crystal growth during cooling.
It is likely that the sodium-molybate phase (Na2MoO4, Na2Mo2O7) was also crystallized from molybdate melt formed by secondary phase separation during cooling (H in Figure 1). However, it is speculated that it was lost by polishing and holes were left since Na2MoO4 is water soluble (solubility of 653 g/L) [34]. Sugawara et al. [29] reported that the frequency and size of holes on the sample surface are related to the intensity of Na2MoO4·2H2O in bulk glasses measured by XRD.
The fact that there were fewer powellites at 1000 °C than at 1200 °C was due to a decrease in MoO3 solubility at lower temperatures. Similarly, powellite was more pronounced in 21E2 than in 19A2 at constant temperature (Figure 3), indicating that the addition of V2O5 increased MoO3 solubility.
The precipitates consisted of spherical silicate glass with a diameter of 5–15 μm (black spherical phase in Figure 3) and a molybdate matrix. It is considered that they were molybdate melts at experimental temperatures. The proportion of spherical silicate phase was greater at 1200 °C than at 1000 °C.
3.2. Effect of V2O5 on MoO3 Solubility in Glass
Table 3 summarizes the chemical composition of silicate glass and molybdenum-rich precipitates. B2O3 and Al2O3 were partitioned into silicate phases, while Na2O, Li2O, and V2O5 were enriched in molybdate phases. The MoO3 solubility was 4.3mol% for 19A2 at 1200 °C, increased to 5.6 mol% for 21E and 8.6mol% for 21E2, and decreased with decreasing temperature. The fact that there were fewer powellite crystals at 1000 °C than at 1200 °C was consistent with a decrease in MoO3 solubility at lower temperatures. Similarly, powellite and sherical holes were more pronounced in 21E2 than in 19A2 at the same temperature (Figure 3). This is also in agreement with the increase in MoO3 solubility.
Table 3.
Chemical composition (mol%) of glass and precipitate obtained from phase equilibrium experiments. The glass composition by Lian et al. [26] is also indicated for comparison.
Table 4 shows the results of the mass balance calculation. The volatilization loss of B2O3 during the experiment was 5–8 mass%. The proportion of the phase separated molybdate phase was in the range of 22–33 mass% and the smallest in the 21E2 at 1200 °C.
Table 4.
Results of the mass balance calculation (mass %).
The solubility of MoO3 in the borosilicate melt was improved by the addition of V2O5 (Table 3). This can be discussed from the viewpoint of melt viscosity and structure.
In general, it is known that the MoO3 solubility in silicate melts increases as the degree of polymerization of the melt decreases. For example, MoO3 solubility increases with increasing Na2O/SiO2 ratio in the SiO2-Na2O-MoO3 system [31] and B2O3/SiO2 ratio in sodium-borosilicate glass [19,25,28,29] and decreasing Al2O3 content in alumino-borosilicate glass [25,28,29]. The degree of polymerization of the silicate melt is related to the magnitude of the viscosity. Therefore, the compositional dependence of MoO3 solubility can be roughly discussed by using melt viscosity [28,29].
The addition of a viscosity-reducing component to silicate melt leads to depolymerization of the borosilicate network and facilitates the incorporation of large-sized MoO42− ions into the melt structure. Ferkl et al. [35] discussed the compositional dependence of the viscosity of low-level waste glass melts based on the analyses of the augmented Adam-Gibbs model. According to the report, V2O5 is the component that decreases the viscosity. This suggests that vanadium is the component that suppresses phase separation and increases molybdenum solubility.
Lian et al. [26] investigated the crystallization behavior of the molybdenum phase in glasses of SiO2-B2O3-Al2O3-Na2O-CaO-V2O5-MoO3 systems quenched at 1300 °C. They reported that when the glass composition is constant, an increase in V2O5 suppresses powellite crystallization. The glass transition temperatures (Tg) of the glasses by Lian et al. decreased with increasing V2O5 content. Since Tg is approximately equal to the temperature at which the viscosity of the supercooled melt reaches 1012 Pa·s, the decrease in Tg represents a decrease in isothermal viscosity. In other words, the conclusion of Lian et al. [26], showing the suppression of powellite by vanadium, can also be explained in terms of melt viscosity.
Spectroscopic studies on borosilicate glasses containing vanadium and molybdenum [36] indicate that MoO42− ions coordinate preferentially with alkali ions such as Na+. However, when vanadium is added, the VO4 unit associates with alkali ions, which prevents the formation of sodium molybdate and suppresses YP generation. These are consistent with our experimental results, which showed that V2O5-bearing glasses increase the solubility of MoO3.
3.3. Chemical Durability Test
Figure 4 shows the normalized leaching rates of Si and B against water in each glass. The normalized leaching rate decreased sharply until 24 h later, and then the rate of decrease slowed down. The leaching rate of V2O5 added glasses (21E, 21E2) was higher than that of 19A2. Bead glass had the slowest leaching rate at the beginning, but it reversed after 24 h and was the fastest after 48 h.
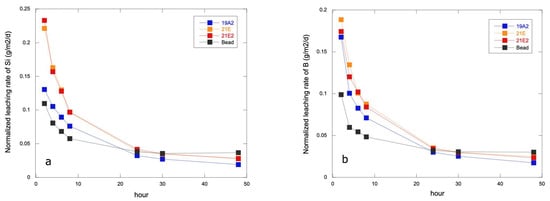
Figure 4.
Normalized leaching rate of (a) Si and (b) B from glass to water as a function of time.
The leaching rate of V2O5-bearing glass (21E, 21E2) was higher than that of 19A2, resulting in lower chemical durability (Figure 4). The water resistance of silicate glass is considered to be dependent on the bond strengths of the oxide components. The bond strengths are as follows: SiO2: 444, BO3/2: 372, VO5/2: 377~469, AlO3/2: 331~423, ZnO: 301, CaO: 134, NaO1/2: 84 and LiO1/2: 151 (kJ/mol) [37]. The network former and intermediate components (SiO2, BO3/2, VO5/2, AlO3/2, ZnO) show generally higher bond strengths, and the chemical durability increases with increasing proportions of these oxides. Therefore, the V2O5 may have improved the chemical durability, as reported by Lian et al. [26].
In this study, however, the V2O5-bearing glass showed a higher normalized leaching rate. This can be attributed to differences in the ratios of components other than vanadium (Figure 4). The MCC-3 test was performed on the glass composition obtained after phase separation (F in Figure 1). The V2O5-bearing glasses, 21E and 21E2, had a higher network modifier (NM)/network former (NF) ratio than that of vanadium-free glass (19A2). For this reason, it is considered that the 21E and 21E2 glasses decreased their chemical durability despite the addition of vanadium oxide.
Bead glass, which contains the simulated waste components, initially had the slowest leaching rate, but this was reversed after 24 h, and the test results showed the fastest leaching rate after 48 h (Figure 4). Figure 5 shows the normalized elemental mass loss (NLi). The NLi of the simulated bead glass varied linearly with time, unlike the glass without the waste component (19A2, 21E, 21E2). This result may be related to the layer formed on the contact surface by the reaction of glass and water. The reaction between glass and water initially results in the dissolution of glass. Then, the dissolution rate gradually decreases and approaches a constant rate. The slow dissolution of glasses over long periods of time is generally attributed to the saturation of silica in the solution. As the glass reacts with water, a gel layer is formed on the surface of the glass due to the repolymerization of dissolved silica. The dissolution of glass when the solution is close to saturation is thought to be prevented by the formation of a gel layer [38,39,40,41,42,43].
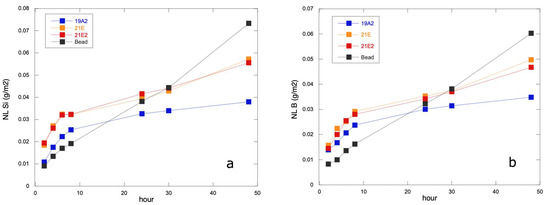
Figure 5.
Normalized elemental mass loss of (a) Si and (b) B as a function of time.
Cailleteau et al. [43] carried out chemical durability tests for SiO2-ZrO2-B2O3-Na2O-CaO glasses to investigate the effect of changes in the gel structure on the leaching rate. They reported that the densification of the gel formed on the glass surface reduced the rate of alteration. It was also reported that an increase in the percentage of the insoluble element ZrO2 in the glass suppressed the densification of the gel and increased the degree of corrosion of the glass after the experiment. In the Bead composition of this study, it is possible that the presence of the waste component prevented the formation of a gel layer at the reaction front that could inhibit glass corrosion, and that leaching continued.
4. Conclusions
In this study, phase equilibrium experiments and chemical durability tests were performed on the glasses in the system SiO2-B2O3-Al2O3-ZnO-CaO-Na2O-Li2O-V2O5-MoO3 to investigate the applicability of vanadium added glass to radioactive waste treatment.
Phase equilibrium experiments were performed at 1200 °C and 1000 °C for compositions with an excess amount of MoO3 (13 mol%) to separate the molybdate melts. The addition of V2O5 suppressed the phase separation of the molybdenum phase and increased MoO3 solubility in the borosilicate melt. This may be related to the fact that V2O5 causes the depolymerization of silicate melt, facilitating the incorporation of MoO42− ions into the structure. Vanadium-bearing glass is thought to suppress the occurrence of the yellow phase in the vitrification of high-level waste.
The chemical durability tests were performed for the borosilicate glass composition obtained from the phase equilibrium experiments. No improvement in water resistance was observed due to the high network modifier/network former ratio of vanadium-bearing glass. The normalized elemental mass loss of simulated HLW glass containing waste components (Bead composition) increased linearly with time. This suggests that the waste component prevents the formation of a gel layer by reaction with water. A more detailed comparative study of the effect of vanadium addition on the chemical durability of glass is needed, considering not only the major components but also the effect of waste components.
Author Contributions
Conceptualization, M.N. and T.S.; methodology, M.N. and T.S.; formal analysis, M.N.; investigation, M.N.; resources, T.S.; writing—original draft preparation, M.N.; writing—review and editing, T.S.; supervision, T.S. All authors have read and agreed to the published version of the manuscript.
Funding
This research received no external funding.
Data Availability Statement
Raw data were generated at the Graduate School of Engineering Science, Akita University. Derived data supporting the results of this study is available from the authors upon request.
Acknowledgments
The authors would like to thank Toshiaki Ohira for his help in EPMA, ICP-AES, and XRF analysis.
Conflicts of Interest
The authors declare no conflict of interest.
References
- Lutze, W. Radioactive Waste Forms for the Future; Ewing, R.C., Ed.; North-Holland: Amsterdam, The Netherlands, 1988; pp. 335–392. [Google Scholar]
- Lutze, L. Glassy and crystalline high-level nuclear waste forms - An attempt at critical evaluation. In Proceedings of the International Symposium on Ceramics in Nuclear Waste Management, Cincinnati, OH, USA, 30 April–2 May 1979; pp. 47–51. [Google Scholar]
- Ojovan, M.I.; Lee, W.E. Glassy Wasteforms for Nuclear Waste Immobilization. Metall. Mater. Trans. A 2011, 42, 837–851. [Google Scholar] [CrossRef]
- Vernaza, E.T.; Bruezière, J.R.M. History of Nuclear Waste Glass in France. Proc. Mater. Sci. 2014, 7, 3–9. [Google Scholar] [CrossRef]
- Thorpe, C.L.; Neeway, J.J.; Pearce, C.I.; Hand, R.J.; Fisher, A.J.; Walling, S.A.; Hyatt, N.C.; Kruger, A.A.; Schweiger, M.; Kosson, D.S.; et al. Forty years of durability assessment of nuclear waste glass by standard methods. Npj Mater. Degrad. 2021, 5, 61. [Google Scholar] [CrossRef]
- Ojovan, M.I.; Lee, W.E. New Developments in Glassy Nuclear Waste Forms; Nova Science Publishers: NewYork, NY, USA, 2007. [Google Scholar]
- McCloy, J.S.; Goel, A. Glass-ceramics for nuclear-waste immobilization. MRS Bull. 2017, 42, 233–240. [Google Scholar] [CrossRef]
- Donald, I.W. Waste Immobilization in Glass and Ceramic Based Hosts, Radioactive, Toxic and Hazardous Wastes; Wiley: Chichester, UK, 2010. [Google Scholar] [CrossRef]
- Ojovan, M.I.; Lee, W.E. An Introduction to Nuclear Waste Immobilization; Elsevier: Amsterdam, The Netherlands, 2005. [Google Scholar]
- Terai, R.; Eguchi, K.; Yamanaka, H. In Proceedings of the International Symposium on Ceramics in Nuclear Waste Management. Cincinnati, OH, USA, 30 April–2 May 1979, pp. 62–65.
- Manaktala, H.K. An Assessment of Borosilicate Glass as a High-level Waste Form; Nuclear Waste Regulatory Analyses: San Antonio, TX, USA, 1992; CNW 92-017. [Google Scholar]
- Donald, I.W.; Metcalfe, B.L.; Taylor, R.N.J. The immobilization of high level radioactive wastes using ceramics and glasses. J. Mater. Sci. 1997, 32, 5851–5887. [Google Scholar] [CrossRef]
- Goel, A.; McCloy, J.S.; Pokorny, R.; Kruger, A.A. Challenges with vitrification of Hanford High-Level Waste (HLW) to borosilicate glass—An overview. J. Non-Cryst. Solids 2019, 4, 100033. [Google Scholar] [CrossRef]
- Mazurin, O.V.; Porai-Koshits, E.A. Phase Separation in Glass; North-Holland: Amsterdam, The Netherlands, 1984. [Google Scholar] [CrossRef]
- Lee, W.E.; Ojovan, M.I.; Stennett, M.C.; Hyatt, N.C. Immobilisation of radioactive waste in glasses, glass composite materials and ceramics. Adv. Appl. Ceram. 2006, 105, 3–12. [Google Scholar] [CrossRef]
- Nicoleau, E.; Schuller, S.; Angeli, F.; Charpentier, T.; Jollivet, P.; Alexandre, L.G.; Fournier, M.; Mesbah, A.; Vasconcelos, F. Phase separation and crystallization effects on the structure and durability of molybdenum borosilicate glass. J. Non-Cryst. Solids 2015, 427, 120–133. [Google Scholar] [CrossRef]
- Kroeker, S.; Schuller, S.; Wren, J.E.C.; Greer, B.J.; Mesbah, A. 133Cs and 23Na MAS NMR spectroscopy of molybdate crystallization in model nuclear glasses. J. Am. Ceram. Soc. 2016, 99, 1557–1564. [Google Scholar] [CrossRef]
- Yamane, M.; Nakao, Y. Phase separation in the glass containing high level radioactive waste. Yogyo-Kyokai-Shi 1979, 87, 328–332. [Google Scholar] [CrossRef]
- Caurant, D.; Majérus, O.; Fadel, E.; Lenoir, M.; Gervais, C.; Pinet, O. Effect of molybdenum on the Sstructure and on the crystallization of SiO2–Na2O–CaO–B2O3 Glasses. J. Am. Ceram. Soc. 2007, 90, 774–783. [Google Scholar] [CrossRef]
- Magnin, M.; Schuller, S.; Caurant, D.; Majérus, O.; Ligny, D.D.; Mercier, C. Effect of compositional changes on the structure and crystallization tendency of a borosilicate glass containing MoO3. Ceram. Trans. Ser. 2009, 13, 59–67. [Google Scholar]
- Chouard, N.; Caurant, D.; Majérus, O.; Dussossoy, J.L.; Ledieu, A.; Peuget, S.; Hadjean, R.B.; Ramos, J.P.P. Effect of neodymium oxide on the solubility of MoO3 in an aluminoborosilicate glass. J. Non-Cryst. Solids 2011, 357, 2752–2762. [Google Scholar] [CrossRef]
- Taurines, T.; Boizot, B. Microstructure of powellite-rich glass-ceramics: A model system for high level waste immobilization. J. Am. Ceram. Soc. 2012, 95, 1105–1111. [Google Scholar] [CrossRef]
- Chouard, N.; Caurant, D.; Majérus, O.; Guezi-Hasni, N.; Dussossoy, J.L.; Baddour-Hadjean, R.; Pereira-Ramos, J.P. Thermal stability of SiO2-B2O3-Al2O3-Na2O-CaO glasses with high Nd2O3 and MoO3 concentrations. J. Alloys Compd. 2016, 671, 84–99. [Google Scholar] [CrossRef]
- Brehault, A.; Patil, D.; Kamat, H.; Youngman, R.E.; Thirion, L.M.; Mauro, J.C.; Corkhill, C.L.; McCloy, J.S.; Goel, A. Compositional Dependence of Solubility/Retention of Molybdenum Oxides in Aluminoborosilicate-Based Model Nuclear Waste Glasses. J. Phys. Chem. B 2018, 122, 1714–1729. [Google Scholar] [CrossRef]
- Sugawara, T.; Ohira, T.; Oowak, K.; Kanehira, N. Thermodynamic optimization of phase separation of molybdenum phase in high-level waste glass. In Proceedings of the ICG Annual Meeting, Yokohama, Japan, 23–28 September 2018. ICGY037. [Google Scholar]
- Lian, Q.; Zhang, X.; Ji, H.; Yu, P.; Guo, X.; Wan, W.; Liu, H.; Zheng, K.; Zhu, Y.; Wang, H.; et al. Effect of V2O5 on crystallization tendency and chemical durability of Mo-bearing aluminoborosilicate glass. Mater. Res. Express 2020, 7, 045201. [Google Scholar] [CrossRef]
- Zhou, J.; Liao, Q.; Wang, F.; Wang, Y.; Zhu, H.; Zhu, Y. Effect of Na2O and CaO on the solubility and crystallization of Mo in borosilicate glasses. J. Non-Cryst. Solids 2021, 557, 120623. [Google Scholar] [CrossRef]
- Sugawara, T.; Ohira, T.; Oowak, K.; Tsukada, T. International Year of Glass 2022; Future prospects of glass science in the reprocessing process: (3) The reaction behavior of Molybdenum in a glass melter: Recent progress. In Proceedings of the Atomic Energy Society of Japan, Annual Meeting, Online, 16–18 March 2022. 3I_PL03. [Google Scholar]
- Sugawara, T.; Ohira, T.; Sekine, A.; Adachi, M.; Sato, H. Crystallization of molybdenum oxide phase from simulated high-level waste glass under slow cooling. J. Ceram. Soc. Jpn. 2020, 130, 933–942. [Google Scholar] [CrossRef]
- Manara, D.; Grandjean, A.; Pinet, O.; Dussossoy, J.L.; Neuville, D.R. Sulfur behavior in silicate glasses and melts: Implications for sulfate incorporation in nuclear waste glasses as a function of alkali cation and V2O5 content. J. Non-Cryst. Solids 2007, 353, 12–23. [Google Scholar] [CrossRef]
- Stemprok, M.; Voldan, J. Homogenous silicate glasses in systems Na2O-SiO2-WO3 and Na2O-SiO2-MoO3. Ceramics-Silikaty 1974, 18, 19–30. [Google Scholar]
- Uruga, K.; Tsukada, T.; Usami, T. Generation mechanism and prevention method of secondary molybdate phase during vitrification of PUREX wastes in liquid-fed ceramic melter. J. Nucl. Sci. Technol. 2020, 57, 433–443. [Google Scholar] [CrossRef]
- Schuller, S.; Gosse, S.; Rogez, J. Glass, crystallization and phase separation: An insight into glass enriched in MoO3. In Proceedings of the Joint ICTP-IAEA Workshop on Fundamentals of Vitrification and Vitreous Materials for Nuclear Waste Immobilization (smr 3159), Trieste, Italy, 6–10 November 2017; cea-02400187. [Google Scholar]
- Buekers, J.; Mertens, J.; Smolders, E. Toxicity of the molybdate anion in soil is partially explained by effects of the accompanying cation or by soil pH. Environ. Toxicol. Chem. 2010, 29, 1274–1278. [Google Scholar] [CrossRef] [PubMed]
- Ferkl, P.; Hrma, P.; Kruger, A.A. Augmented Adam-Gibbs model for glass melt viscosity and configuration entropy as functions of temperature and composition. J. Non. Cryst. Solids 2022, 595, 121832. [Google Scholar] [CrossRef]
- Suzuki, M.; Umesaki, N.; Tanaka, T.; Ohkubo, T.; Kakihara, T.; Hashimoto, T.; Kawashima, H. Structural behaviour of vanadium ions in alkali borosilicate glass for nuclear waste storage. Phys. Chem. Glasses B 2018, 59, 181–192. [Google Scholar] [CrossRef]
- Sun, K.H. Fundamental condition of glass formation. J. Am. Chem. Soc. 1947, 30, 277–281. [Google Scholar] [CrossRef]
- Grambow, B. Corrosion of glass. In Uhlig’s Corrosion Handbook, 2nd ed.; Revie, R.W., Ed.; Wiley: Chichester, UK, 2000; pp. 411–437. [Google Scholar]
- Barkatt, A.; Macedo, P.B.; Gibson, B.C.; Montrose, C.J. Modelling of waste performance and system release. Mater. Res. Soc. Symp. Proc. 1984, 44, 3–13. [Google Scholar] [CrossRef]
- Delage, F.; Ghaleb, D.; Dussossoy, J.L. A mechanistic model for understanding nuclear waste glass dissolution. J. Nucl. Mater. 1992, 190, 191–197. [Google Scholar] [CrossRef]
- Xing, S.B.; Buechele, A.C.; Pegg, I.L. Effect of surface layers on the dissolution of nuclear waste glasses. Mater. Res. Soc. Symp. Proc. 1994, 333, 541–548. [Google Scholar] [CrossRef]
- Gin, S.; Ribet, I.; Couillard, M. Role and properties of the gel formed during nuclear glass alteration: Importance of gel formation conditions. J. Nucl. Mater. 2001, 298, 1–10. [Google Scholar] [CrossRef]
- Cailleteau, C.; Angeli, F.; Devreux, F.; Gin, S.; Jestin, J.; Jollivet, P.; Spalla, O. Insight into Silicate-Glass Corrosion Mechanisms. Nat. Mater. 2008, 7, 978–983. [Google Scholar] [CrossRef]


Disclaimer/Publisher’s Note: The statements, opinions and data contained in all publications are solely those of the individual author(s) and contributor(s) and not of MDPI and/or the editor(s). MDPI and/or the editor(s) disclaim responsibility for any injury to people or property resulting from any ideas, methods, instructions or products referred to in the content. |
© 2023 by the authors. Licensee MDPI, Basel, Switzerland. This article is an open access article distributed under the terms and conditions of the Creative Commons Attribution (CC BY) license (https://creativecommons.org/licenses/by/4.0/).