Article

CuFe2O4 Nanofiber Incorporated with a Three-Dimensional Graphene Sheet Composite Electrode for Supercapacitor and Electrochemical Sensor Application

by
Sivaramakrishnan Vinothini
1,†,
Arjunan Karthi Keyan
1,†,
Subramanian Sakthinathan
1,
Te-Wei Chiu
1,* and
Naratip Vittayakorn
2,*
1
Department of Materials and Mineral Resources Engineering, National Taipei University of Technology, No. 1, Section 3, Chung-Hsiao East Road, Taipei 106, Taiwan
2
Advanced Materials Research Unit, Faculty of Science, King Mongkut’s Institute of Technology Ladkrabang, 1 Chalong Krung 1 Alley, Lat Krabang, Bangkok 10520, Thailand
*
Authors to whom correspondence should be addressed.
These authors contributed equally to this work.
Inorganics 2024, 12(6), 164; https://doi.org/10.3390/inorganics12060164
Submission received: 2 May 2024 / Revised: 8 June 2024 / Accepted: 9 June 2024 / Published: 12 June 2024

Abstract

:
The demand for regenerative energy and electric automotive applications has grown in recent decades. Supercapacitors have multiple applications in consumer alternative electronic products due to their excellent energy density, rapid charge/discharge time, and safety. CuFe2O4-incorporated three-dimensional graphene sheet (3DGS) nanocomposites were studied by different characterization studies such as X-ray diffraction, transmission electron microscopy, and scanning electron microscopy. The electrochemical studies were based on cyclic voltammetry (CV), galvanostatic charge–discharge (GCD), and electrochemical impedance spectroscopy (EIS) measurements. As prepared, 3DGS/CuFe2O4 nanocomposites exhibited an excellent surface area, high energy storage with appreciable durability, and excellent electrocatalysis properties. A supercapacitor with 3DGS/CuFe2O4-coated nickel foam (NF) electrodes exhibited an excellent specific capacitance of 488.98 Fg−1, a higher current density, as well as a higher power density. After charge–discharge cycles in a 2.0 M KOH aqueous electrolyte solution, the 3DGS/CuFe2O4/NF electrodes exhibited an outstanding cyclic stability of roughly 95% at 10 Ag−1, indicating that the prepared nanocomposites could have the potential for energy storage applications. Moreover, the 3DGS/CuFe2O4 electrode exhibited an excellent electrochemical detection of chloramphenicol with a detection limit of 0.5 µM, linear range of 5–400 µM, and electrode sensitivity of 3.7478 µA µM−1 cm−2.

Graphical Abstract

1. Introduction

Research on sustainable and renewable energy sources is ongoing due to the declining fossil fuel reserves and growing population [1,2]. Meanwhile, energy storage devices are widely used in digital communications, electric motor vehicles, data storage, and portable electronic devices. Numerous batteries and high-performance capacitors have been developed for such uses [3]. Among these, supercapacitors, also called ultracapacitors or micro-capacitors, are essential to accumulator systems because they can supply significant power over a brief period in addition to receiving and storing energy. Research on cutting-edge energy storage technologies has gained significant attention in recent decades [4,5]. Supercapacitors are an appealing energy storage technology because of their extended cycle life, superior operational safety, and high power capabilities over secondary batteries [6]. Supercapacitors will displace batteries in the future due to their advantages of rapid power transmission, fast charging, discharging capability, increased power density, and good cycle stability. The energy storage density of supercapacitors is currently lower than that of batteries; hence, the main goal of current research on supercapacitors is to increase the energy storage density [7,8].
Supercapacitors have been classified into three categories based on the electrode materials’ charge or energy storage mechanism: electrochemical double-layered capacitors (EDLC), pseudo-capacitors, and hybrid supercapacitors [9]. EDLC capacitors store energy or a charge through ion adsorption at the electrode/electrolyte interface, whereas pseudo capacitors store a charge or energy through the electrochemically reversible faradic process. Hybrid supercapacitors have more advantages than EDLC and pseudo-capacitors [10,11,12,13]. EDLCs are efficient electrical energy storage devices because of their simple structure, cycle stability, and high power density. EDLC mechanisms commonly follow the charge storage of carbon-based electrode materials and their derivatives. In contrast, charge storage by conducting polymers or metal oxides is followed by pseudocapacitive mechanisms [14,15].
The safety concerns and low charge–discharge cycles of the lithium-ion batteries on the market make the development of high-energy supercapacitors an urgent necessity for all portable electronic devices [16,17]. Nevertheless, the primary issue impeding the advancement of supercapacitors has been their poor energy density. There are two primary study areas for increasing the energy density of supercapacitors. One focuses on creating new electrode materials; the other aims to create new electrolytes. Therefore, a suitable chemical composition must be chosen, and the electrode material must be improved to boost the specific capacity and long-term cycle stability [18,19].
Chloramphenicol (CAP) is a broadly and frequently used antibiotic drug to treat bacterial infections in both humans and animals [20]. Furthermore, an excess of CAP can build up in food and water, posing a severe risk to human health as well as the welfare of all animals [21]. Currently, the use of CAP in animal husbandry has been globally prohibited, and the highest allowable residual amount of CAP in food is 0.3 μg/kg. Moreover, CAP can accumulate in food and water, endangering not just the health of humans but also the welfare of all other living things [22,23]. However, because of its high effectiveness and low cost, CAP is still used illegally to treat illnesses in cattle and other animals. Therefore, it is crucial to create a sensitive and dependable sensor for identifying CAP in food and medicine samples [24,25]. Commonly used detection methods for CAP detection are gas chromatography–mass spectrometry, surface-enhanced Raman scattering, liquid chromatography–tandem mass spectrometry, and fluorescence. However, using the required instrumentation for on-site direct detection is challenging because of the complex processes, the need for professional operators, and heavy equipment. However, electrochemical detection has the advantages of simplicity, portability, and low pollution, and it offers various analytical techniques such as cyclic voltammetry, square-wave voltammetry, linear sweep voltammetry, and differential pulse voltammetry [26].
The spinel-structured transition metal ferrites having a general formula of MFe2O4 (M = Cu, Cr, Ag, Au, Pd, Pt, Ru, Mn, Co, Cu, and Ni) have been used in electronics and capacitors in recent years due to their environmental friendliness, variable oxidation states, electronic conductivity, capacitive nature, chemical stability, rapid redox properties, unique crystal structures, low price, high theoretical capacity, and great abundance [27,28]. The properties of the ferrite complexes can be changed by varying the identity of the divalent M2+ cation with the electronic configuration of 3d104s1 [29,30].
Transition metal ferrite fiber structure materials are a significant field of investigation because they have potential applications in many areas due to their high theoretical capacity [31,32]. Moreover, transition metal ferrite fiber can be synthesized by numerous techniques, including the template, sol-gel, co-precipitation, solvothermal, electrodeposition, microwave, and hydrothermal methods [33,34]. Among these techniques, electrospinning method is an effective and simple way to prepare transition metal ferrite fibers. Transition metal oxide nanofibers provide an efficient charge and ion transfer that is beneficial for electrochemical signal production [35]. The specific surface areas of the relatively smooth fiber morphologies are generally low compared to those of porous or 2D structures [36].
M. Israr et al. studied CuFe2O4/GNPs for supercapacitors and photocatalytic applications [37]. K. Atacan et al. reported CuFe2O4/RGO/gold nanoparticles for L-cysteine detection [38]. H. Yang et al. reported CoFe2O4/rGO nanoparticles for oxygen reduction [39]. G. A. T. Battad et al. studied CuFe2O4/RGO for a malathion sensor [40]. M. Baghayeri et al. developed MWCNTs/CuFe2O4 for bisphenol detection [41]. S. Tajik et al. studied ZnFe2O4/RGO for the detection of hydrazine [42]. G. Bharath et al. reported Ru–CoFe2O4/RGO for high-performance photoelectrodes [43]. R. Khan et al. developed CuFe2O4-Fe2O3 for high-performance capacitor electrodes [44]. S. Tajik et al. reported CuFe2O4 nanoparticles for the detection of sunset yellow [45]. W. Liang et al. fabricated CuFe2O4 for electrical energy storage [46]. J. C. Bhangoji et al. identified CuO-CuFe2O4@rGO for paracetamol sensing [47]. V. Mahdikhah et al. reported CoFe2O4/rGO for the degradation of organic dyes [48]. Y. Zhang et al. reported good results for CoFe2O4/rGO for peroxymonosulfate activation [49]. Therefore, based on the above work, copper ferrite (CuFe2O4) was chosen in the current study.
CuFe2O4 has a formidable chemical stability, high catalytic activity, excellent mechanical strength, high theoretical capacity, thermal stability, chemical stability, electrical properties, and natural abundance [50]. Therefore, based on the aforementioned findings, CuFe2O4 has been widely used in electronics, sensors, catalysts, magnetic memory, high-frequency equipment, medication delivery, lithium-ion batteries, and anode materials. Furthermore, CuFe2O4 can be characterized as a tetragonal I41/amd structure or a cubic (Fd3m) structure based on the amount of Cu2+ that occupies the octahedral sites. Additionally, Cu2+ and Fe3+ ions occupy two distinct interstitial positions in a cubic close-packed arrangement of oxygen ions for an inverted spinel structure. Furthermore, because of the remarkable efficiency of inter-valence electron migration from Cu+ to Cu2+ and Fe2+ to Fe3+ ion pairs in the octahedral sites, CuFe2O4 has the best electron transmission efficiency among all metal ferrites in terms of catalytic activity [51].
In addition, electrospinning preparation is considered an efficient and simple method for fabricating hollow nanofibers, with inorganic, organic, and polymer fiber nanomaterials prepared by this facile method [52,53]. Electrospun nanofibers can be widely used in various applications due to their high surface area and electrical conductivity. Predominantly, the formation of hollow nanofibers by the electrospinning process is attributed to the decomposition of organic polymers at high temperatures [54]. Compared with other traditional preparation methods, electrospinning is attractive because it is very simple, effective, and low cost, with a good repeatability, high yield, and scalability. However, it has also been reported that ferrite-modified electrodes have defects such as a low electronic conductivity, improper volume changes during the charge/discharge processes, and poor cycling stability. Therefore, carbon needs to be incorporated for high-performance capacitance to be achieved [55,56,57].
Carbon materials like graphite, graphene, multi-walled carbon nanotubes, and activated carbon are used to increase the specific capacitance and energy densities. Graphene is especially used for energy storage devices due to its high conductivity, thermal conductivity, transparency, excellent mechanical strength, large surface area (theoretical value 2630 m2g−1), and chemical stability. Because of its unique mechanical, thermal, and electrical properties, graphene has attracted a lot of attention in different fields of application. In addition, 2D van der Waals heterostructure materials have gained a lot of attention because of their potential application to create unique electrical and optoelectronic memory devices, field-effect transistors, photodetectors, light-emitting diodes, solar cells, and memory devices [58]. Furthermore, using 2D materials in sensors presents built-in benefits for creating adaptable, quick-operating memory devices with significant charge storage capacities. However, graphene oxide exhibits stable dispersion in aqueous medium due to its highly hydrophilic nature, so the 2D nature of graphene will be lost. Hence, a 2D graphene-based capacitor has a low specific capacitance, which is the reason for the parallel restacking and agglomeration of graphene sheets by the van der Waals interactions between the neighboring graphene sheets. Therefore, the restacking and aggregation of the nanosheets efficiently reduce the surface area of 2D graphene on which charges are accumulated to form double-layer capacity, leading to loss of capacitance [59,60,61,62].
To solve this problem, the modification of GO is essential to suppress the aggregation of graphene. Currently, three-dimensional graphene sheet (3DGS) materials are considered excellent materials for supercapacitors due to their random orientation, partial stacking, microporous structure, highly wrinkled structure, and atomistic perforations. This unique structural orientation of 3DGS improves the storage capacity and the free movement of the ions via porous geometry. Furthermore, 3DGS have a low density, high electrical conductivity, easy electrolyte penetration, low diffusion resistance, and high specific surface area. These 3DGS can play a major role in improving composite efficiency, charge, and discharge. The properties above of the 3DGS make them a promising material for high-performance supercapacitor electrodes with better capacitance performance [63,64,65,66,67].
In this work, we have prepared a CuFe2O4 fiber using the electrospinning approach and applied to supercapacitor electrode preparation. The highly active and highly specific surface area of 3DGS with CuFe2O4 fiber exhibited a significant power density, high capacitance, and stable cyclic performance due to the synergetic effect between the 3DGS and CuFe2O4 fiber. The prepared 3DGS/CuFe2O4/NF electrode obtained significant specific capacitance (Fg−1), marvelous cycling stability (Ag−1), excellent charge–discharge process, and practical applications. In addition, the GCE/3DGS/CuFe2O4 modified electrode has been used for the accurate electrochemical detection of CAP by cyclic voltammetry and differential pulse voltammetry. The electroanalytical performances of the GCE/ 3DGS/CuFe2O4 electrode were tested for the limit of detection, linearity, repeatability, and reproducibility. The electrochemical application of this GCE/3DGS/CuFe2O4 electrode will be expanded in future work.

2. Preparation of Three-Dimensional Graphene Sheets/Copper Ferrite Fiber Composite (3DGS/CuFe2O4)

2.1. 3DGS Preparation

As reported in previous research, graphene oxide was prepared using a modified Hummers’ method. Briefly, graphite (5.0 g) and concentrated sulfuric acid (60 mL) were stirred at room temperature, and sodium nitrate (2.5 g) was slowly added. After that, the mixture was cooled in an ice water bath. To maintain the low temperature, KMnO₄ (5.0 g) was slowly added to the system under vigorous agitation. The whole reaction mixture was shifted to a 35 °C water bath and stirred for about 3 h, after which H2O2 (20 mL) and water (500 mL) were added to the reaction mixture for about 1 h. Finally, the reaction mixture was filtered and cleaned with diluted HCl solution and continuously washed with water to remove the acid and unreacted materials. The obtained GO powder was characterized and stored in a desiccator for further use. Samples of 3DGS were prepared through the traditional hydrothermal reduction process. First, GO (2.0 g) was added to deionized water with ultrasonication for 1 h. Afterward, the prepared GO solution with H2SO4 (2 mL) mixture was sonicated and stirred for up to 20 min. Finally, the stirred solution was transferred into a Teflon-coated sealed autoclave and held at 150 °C in an oven for 12 h. After the heating, the autoclave was cooled to laboratory temperature, and the black-colored product was obtained. Finally, the product was collected and washed with water to obtain the 3DGS. The prepared 3DGS were further used for electrochemical studies.

2.2. Transition Metal Ferrite Fiber Preparation

To prepare the transition metal ferrite, copper (II) nitrate hexahydrate (Cu(NO3)2·xH2O), iron (III) nitrate nonahydrate (Fe(NO3)3·9H2O), poly (vinyl pyrrolidone) (PVP), and N, N-dimethylformamide (DMF) were used as the starting chemicals. In a typical preparation procedure, calculated amounts of copper (II) nitrate hexahydrate and iron (III) nitrate nonahydrate were dissolved into N, N-dimethylformamide with magnetic stirring. Then, a calculated amount of polyvinyl pyrrolidone (PVP) was dissolved into the aforementioned solution under vigorous stirring for more than 12 h at laboratory temperature to form a precursor solution. The copper and iron metal precursor solution was transferred to an electrospinning instrument in a horizontal programmable glass syringe pump (diameter = 4.2 mm) equipped with a capillary tube needle (ID = 0.5 mm), connected to a high-voltage source with the flow at 0.02 mL/h. Aluminum foil was fixed as a collector 15 cm from the capillary needle to form an electrospinning jet. After the electrospinning process, CuFe2O4 electrospun nanofibers were collected on the aluminum foil. The collected CuFe2O4 nanofibers were calcined at 800 °C for 5 h with a heating rate of 10 °C min−1 to evaporate any impurities and polymer to obtain the CuFe2O4 fiber.

2.3. The 3DGS/CuFe2O4 Fiber Composite Preparation

The calculated amount of 3DGS was dispersed in methanol and sonicated for 30 min. Afterward, the prepared electrospun transition metal ferrite fiber (CuFe2O4) was mixed with the above-mentioned mixture and stirred for 10 min. After that, the prepared precursor solution was transferred into the autoclave, which was tightly sealed. The loaded autoclave was placed in an oven and the reaction temperature was maintained at 180 °C for 12 h. After the reaction, the autoclave was allowed to cool gradually to room temperature. The resultant product, the 3DGS/CuFe2O4 composite was filtered, washed with cooling water, and dried.

2.4. Supercapacitor Electrode Preparation and Studies

Electrochemical experiments were performed at an electrochemical workstation with three-electrode electrochemical cells in optimized electrolytes. A coated nickel foam electrode was the working electrode, platinum wire was the counter electrode, and silver/silver chloride (Ag/AgCl) was the reference electrode. All the electrochemical studies were conducted at room temperature. The cyclic voltammetry (CV) and galvanostatic charge–discharge (GCD) experiments were performed on a CHI electrochemical workstation. The as-synthesized three-dimensional graphene sheets/CuFe2O4 composite material (80 wt %) and carbon black (15 wt %) were mixed with N-methyl pyrrolidinone (0.4 mL) to form a homogeneous mixture. After that, 15 μL of the mixture was coated on a 1 × 1 cm2 area of the nickel foam (NF) electrode via drop-casting (solution-casting method) and dried overnight. The prepared electrode was soaked in electrolyte for a few minutes before the electrochemical experiment began. A 2M KOH electrolyte solution was prepared by a simple chemical method. PVA (1 g) was mixed with DI water and then stirred to form a clear solution. After that, 10 mL of KOH (2.0 M) solution was mixed with the above solution to form a gel-like homogeneous electrolyte solution.

2.5. Glassy Carbon Electrode Entrapped with 3DGS/CuFe2O4 Nanofiber Composite (GCE/3DGS/CuFe2O4) Preparation

The following process was used to prepare the GCE/3DGS/CuFe2O4 electrode. First, 2 mg of 3DGS/CuFe2O4 nanomaterial was dispersed in 1 mL of ethanol by the ultrasonication method for 15 min. Initially, 2 mg of 3DGS/CuFe2O4 nanomaterial was mixed with 1 mL of ethanol using an ultrasonication technique for 15 min to form a composite. Next, the drop-casting process was used to coat the 6 µL of dispersed 3DGS/CuFe2O4 composite material over the GCE surface. Then, the prepared GCE/3DGS/CuFe2O4 electrode was allowed to dry for a few hours at room temperature. The GCE/3DGS/CuFe2O4 electrode preparation and electrochemical usage are illustrated in Scheme 1.

2.6. Capacitance and Energy Density Calculation

Electrode capacitance and energy density were calculated by the equation below. The electrochemical performance of the prepared electrodes was studied using a three-electrode electrochemical system in the presence of a suitable electrolyte. The proposed materials coated on the Ni foam were used as the working electrode, Pt wire as a counter electrode, and Ag/AgCl as a reference electrode. The galvanostatic charge–discharge (GCD) and cyclic voltammetry (CV) experiments were performed on an electrochemical workstation. To prepare the supercapacitor electrode, 8 mg material, 1.72 mg carbon black, 0.8 mg PVDF, and 50 μL NMP were mixed and stirred for 15 min. Then, the paste was applied to a 1 × 1 cm NF and dried overnight. The specific capacitance of the electrodes was calculated using the equations below.
From the CV measurements,
C = Q/mΔV
where C is the specific capacitance (Fg−1), m is the mass of the active material (unit of g), Q represents the average charge during the charge–discharge (GCD) process (C), and ΔV is the working potential (V).
From the GCD measurements,
C = IΔt/mΔV
where I (A) is the applied current density during the GCD process and Δt (s) is the discharge time.
The energy density was calculated by
E = 1/2CΔV2
and power density was calculated by
P = E/t
where E (Whkg−1) is the energy density, C (Fg−1) is the specific capacitance, P (Wkg−1) is the power density, and t (s) is the discharge time.

3. Characterization Studies

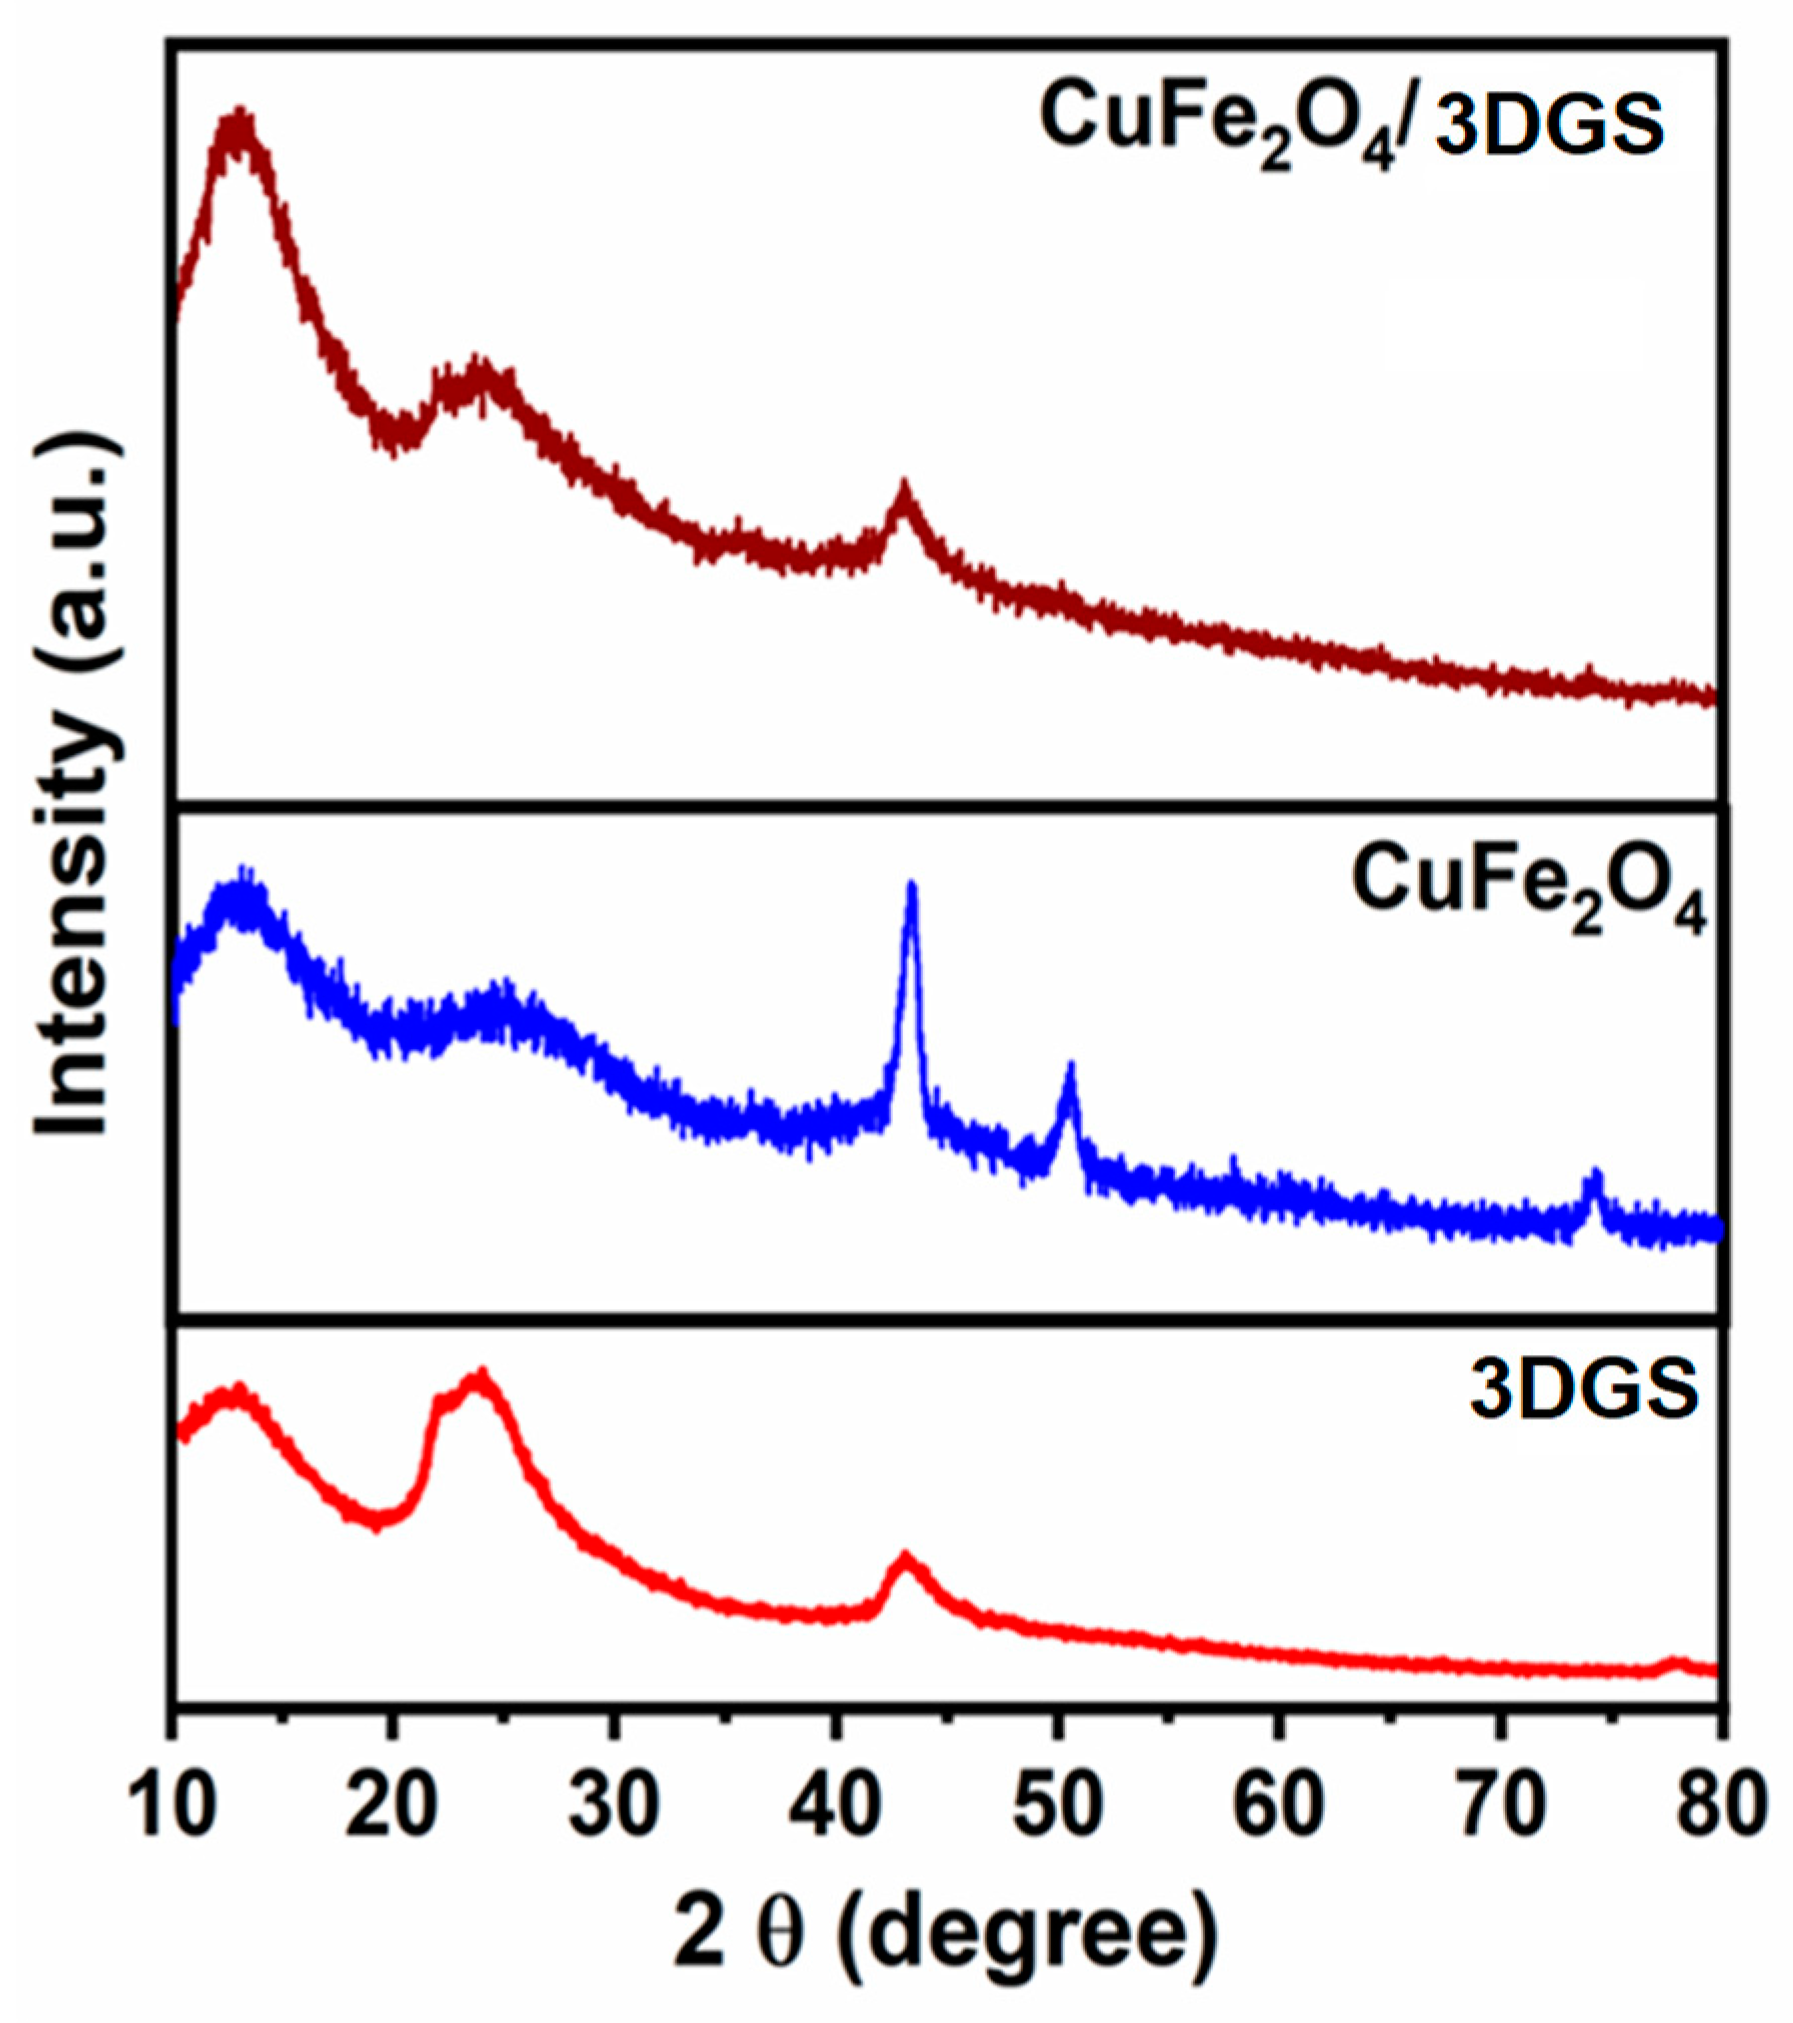
3.1. Crystalline Structure

The structures of 3DGS, CuFe2O4, and 3DGS/CuFe2O4 were characterized by XRD, EDS, FESEM, TEM, Raman spectra, and EIS analysis. Figure 1 shows the X-ray diffraction patterns of the as-prepared 3DGS, CuFe2O4 fiber, and 3DGS/CuFe2O4 composite analyzed by X-ray powder diffraction. The 3DGS carbon material exhibits two major characteristic peaks at 2θ = 25° and 43°. The XRD patterns of CuFe2O4 fiber peaks presented at 18.51°, 30.17°, 35.64°, 37.17°, 43.4°, 57.05°, 62.77°, and 74.54° for the (111), (220), (311), (222), (400), (422), (511), and (533) planes. Furthermore, the XRD plane was consistent with the standard spectrum of face-centered cubic phase CuFe2O4 with no detectable impurity phases, demonstrating that the CuFe2O4 fiber could be prepared by the electrospinning method after a calcination treatment. The diffraction peaks and positions matched the standard XRD data for CuFe2O4 (JCPDS 01-077-0010). The same characteristic peaks were observed in the previously reported composite materials. Therefore, the XRD patterns indicated the good formation of the 3DGS/CuFe2O4 composite.

3.2. FESEM and TEM Studies

Figure 2 shows the FESEM image of the prepared (A–D) CuFe2O4 fiber, (E,F) 3DGS, and (G–I) 3DGS/CuFe2O4 composites. The FESEM images of the CuFe2O4 fibers revealed continuous nanofibers with a uniform ∼400 ± 2 nm diameter. The surfaces of the CuFe2O4 nanofibers were smooth, and the average diameter of the CuFe2O4 nanofibers was reduced due to the decomposition of PVP and PAN. The SEM images of the 3DGS/CuFe2O4 composite show CuFe2O4 fibers well incorporated with 3DGS. Also, the prepared nanofibers appeared to have smooth surfaces due to the amorphous nature of the 3DGS/CuFe2O4 composites. Figure 2D–H presents the composite elemental mapping.
Additionally, the EDX spectra exhibited a homogenous and consistent elemental distribution throughout the composite. Figure 2I shows the elemental mappings of the 3DGS/CuFe2O4 composite, exhibiting Cu, O, C, and Fe elements. The EDS spectra revealed that only copper (Cu), oxygen (O), carbon (C), and iron (Fe) were present without contaminants. Additionally, the elemental mapping results in Figure 2J–M demonstrated that the copper, oxygen, carbon, and iron in the scanning area were distributed uniformly in the 3DGS/CuFe2O4 composite. Figure 2N displays the EDX spectra of the 3DGS/CuFe2O4 composite, showing the elemental distributions of Cu, O, C, and Fe.
TEM images revealed more information about the 3DGS/CuFe2O4 composite. Figure 3 presents typical TEM images of (A) the CuFe2O4 fiber, (B) 3DGS, and (C,D) the 3DGS/CuFe2O4 composite. The image of CuFe2O4 shows good fiber formation with an average fiber diameter of 400 nm. The TEM image of 3DGS shows a good curtain sheet structure, and those of the 3DGS/CuFe2O4 composite show that CuFe2O4 nanofibers were randomly aligned and intercalated on the 3DGS surface, consistent with FESEM and TEM observation.

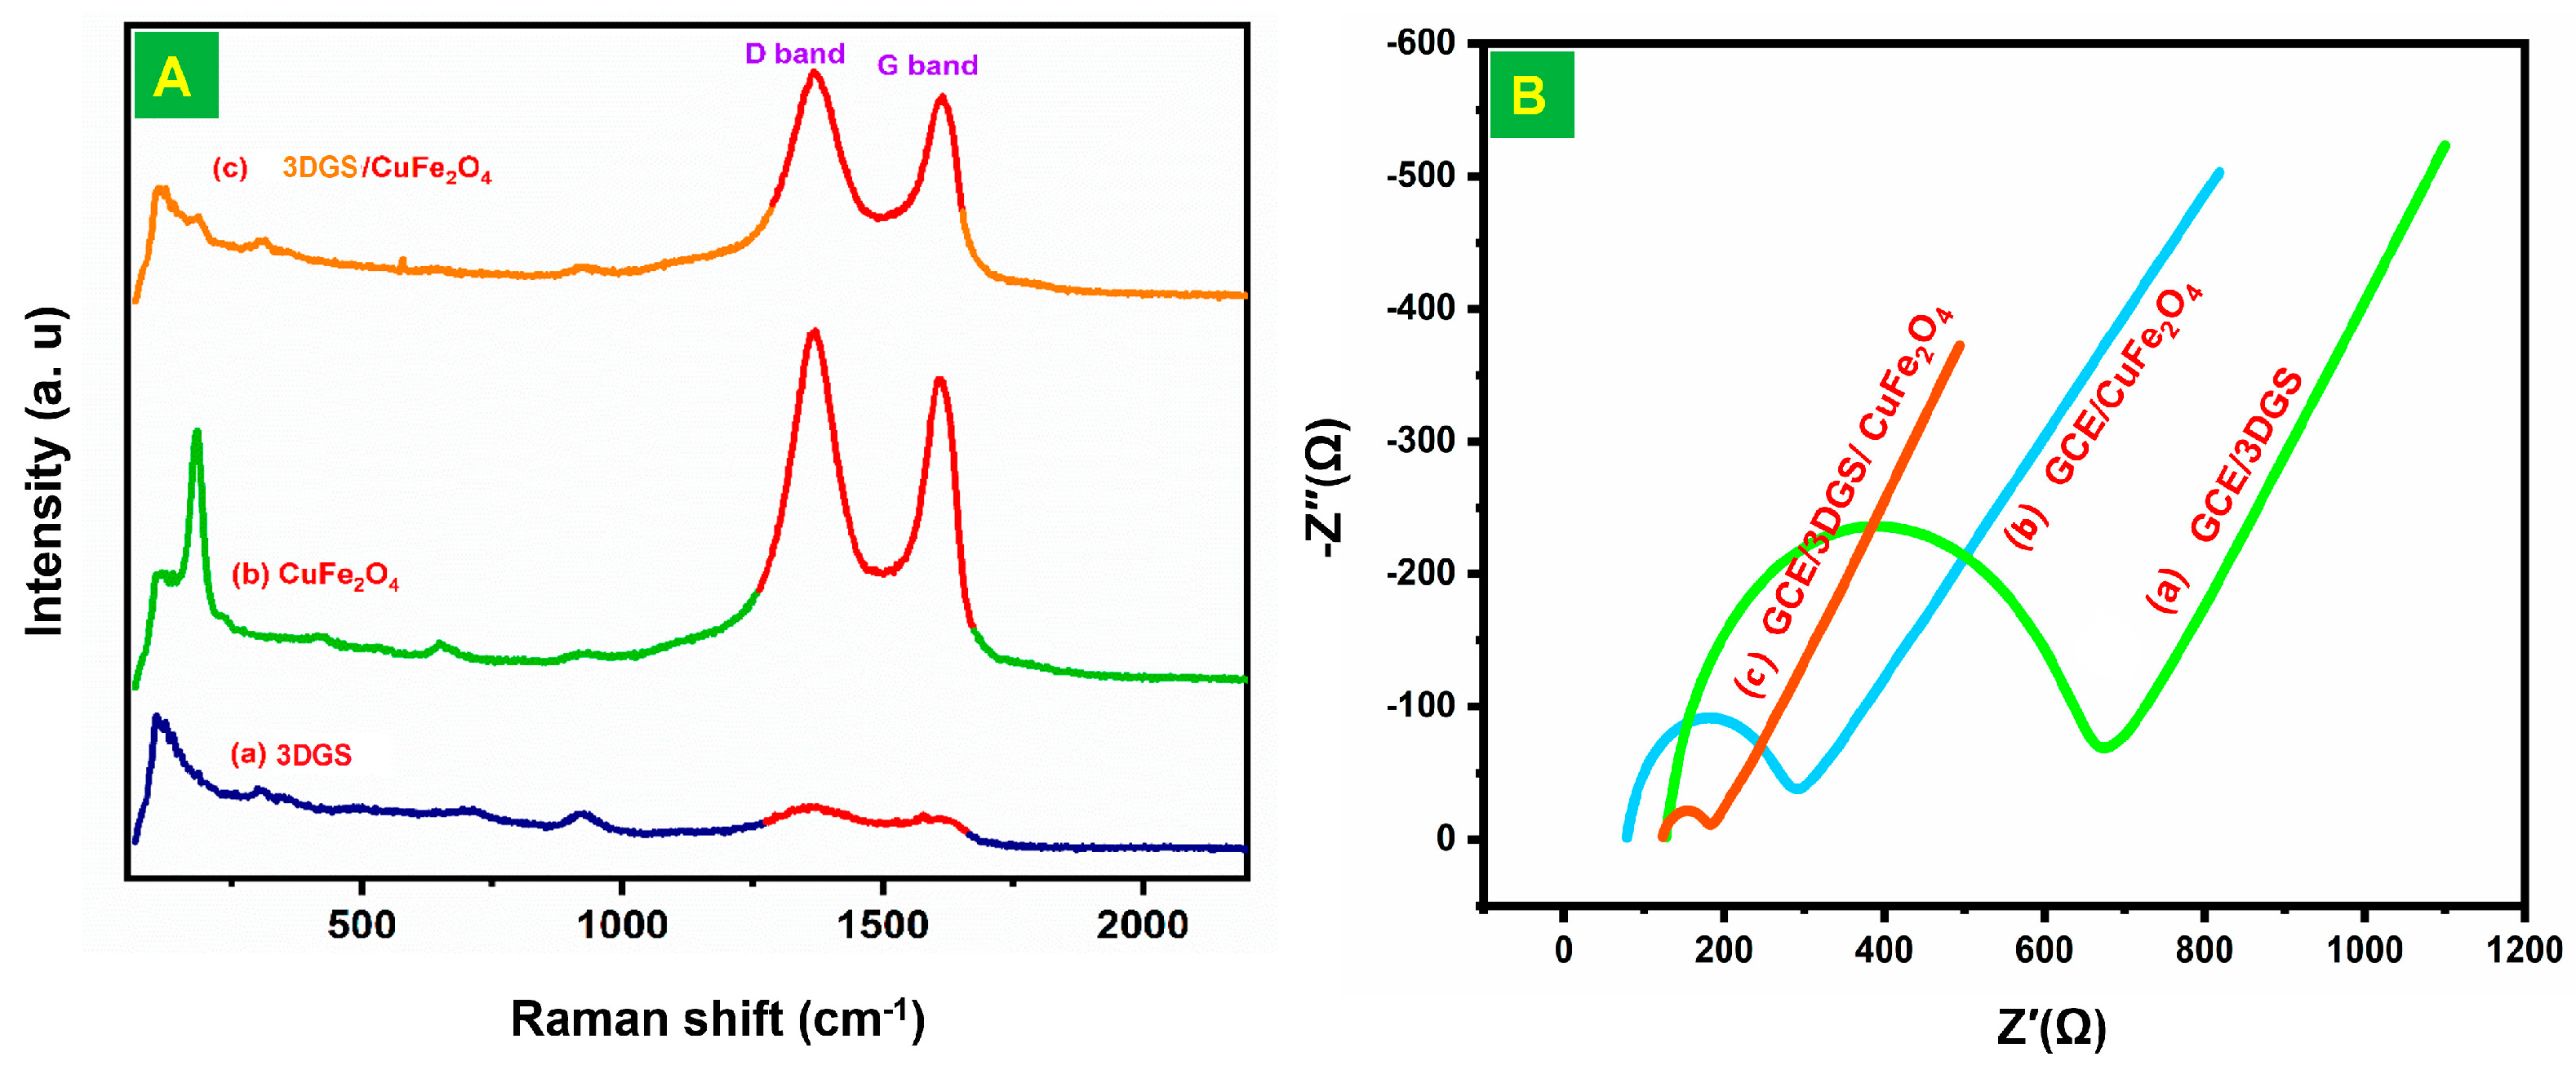
3.3. Raman and EIS Studies

Raman spectra were used to confirm the composite synthesis and electronic interaction between 3DGS and CuFe2O4 fibers. Figure 4A shows the Raman spectra of 3DGS, CuFe2O4 fibers, and 3DGS/CuFe2O4 composite. The spectra of 3DGS display two prominent D and G bands at 1354 and 1606 cm−1, respectively, while CuFe2O4 fibers have D and G bands at 1354 cm−1 and 1606 cm−1. It is well known that the D and G bands arise due to the E2g mode. In addition, the 3DGS/CuFe2O4 composite shows the D and G bands at 1354 and 1606 cm−1. The ID/IG band intensity ratios of RGO, CuFe2O4, and 3DGS/CuFe2O4 were found to be ID/IG = 0.97, ID/IG = 0.86, and ID/IG = 1.17, respectively. These Raman spectra confirm the possible electronic interaction between the 3DGS and CuFe2O4 fiber, indicating a conjugated graphene oxide network (sp2) after the loading of the CuFe2O4 fiber.
Electrochemical impedance spectroscopy analysis was used to identify electron transfer and electrode resistance. The Nyquist plot has two regions. The semicircular region is electron transfer resistance (Rct), and the linear region is a diffusion-controlled process. Figure 4B exhibits the EIS spectra of (a) 3DGS, (b) CuFe2O4 fibers, and (c) 3DGS/CuFe2O4 composite-decorated GCE electrodes in 5 mM [Fe(CN)6]4−/3− solution with 0.05 M phosphate buffer (pH 7) with 0.1 M KCl electrolyte. The range of frequencies of the EIS spectra was 0.1 Hz−1 MHz. The electrode Rct values were determined by using the Randles equivalent circuit model to fit the Nyquist plot. After the modification of GCE with 3DGS and CuFe2O4 fibers, the Rct values were 545 Ω and 217 Ω, respectively. Finally, the Rct values of the 3DGS/CuFe2O4 composite exhibited smaller Rct values (61 Ω) than the electrodes with 3DGS and CuFe2O4 fibers due to the excellent electron transfer and low resistance. The reason was that the 3DGS and CuFe2O4 fibers created a strong π-π noncovalent interaction, enhancing the electrical conductivity of GCE/3DGS/CuFe2O4 electrodes. In other words, the low resistance of the 3DGS/CuFe2O4 electrode should be ascribed to the high electronic conductivity and fast electron flow rate.

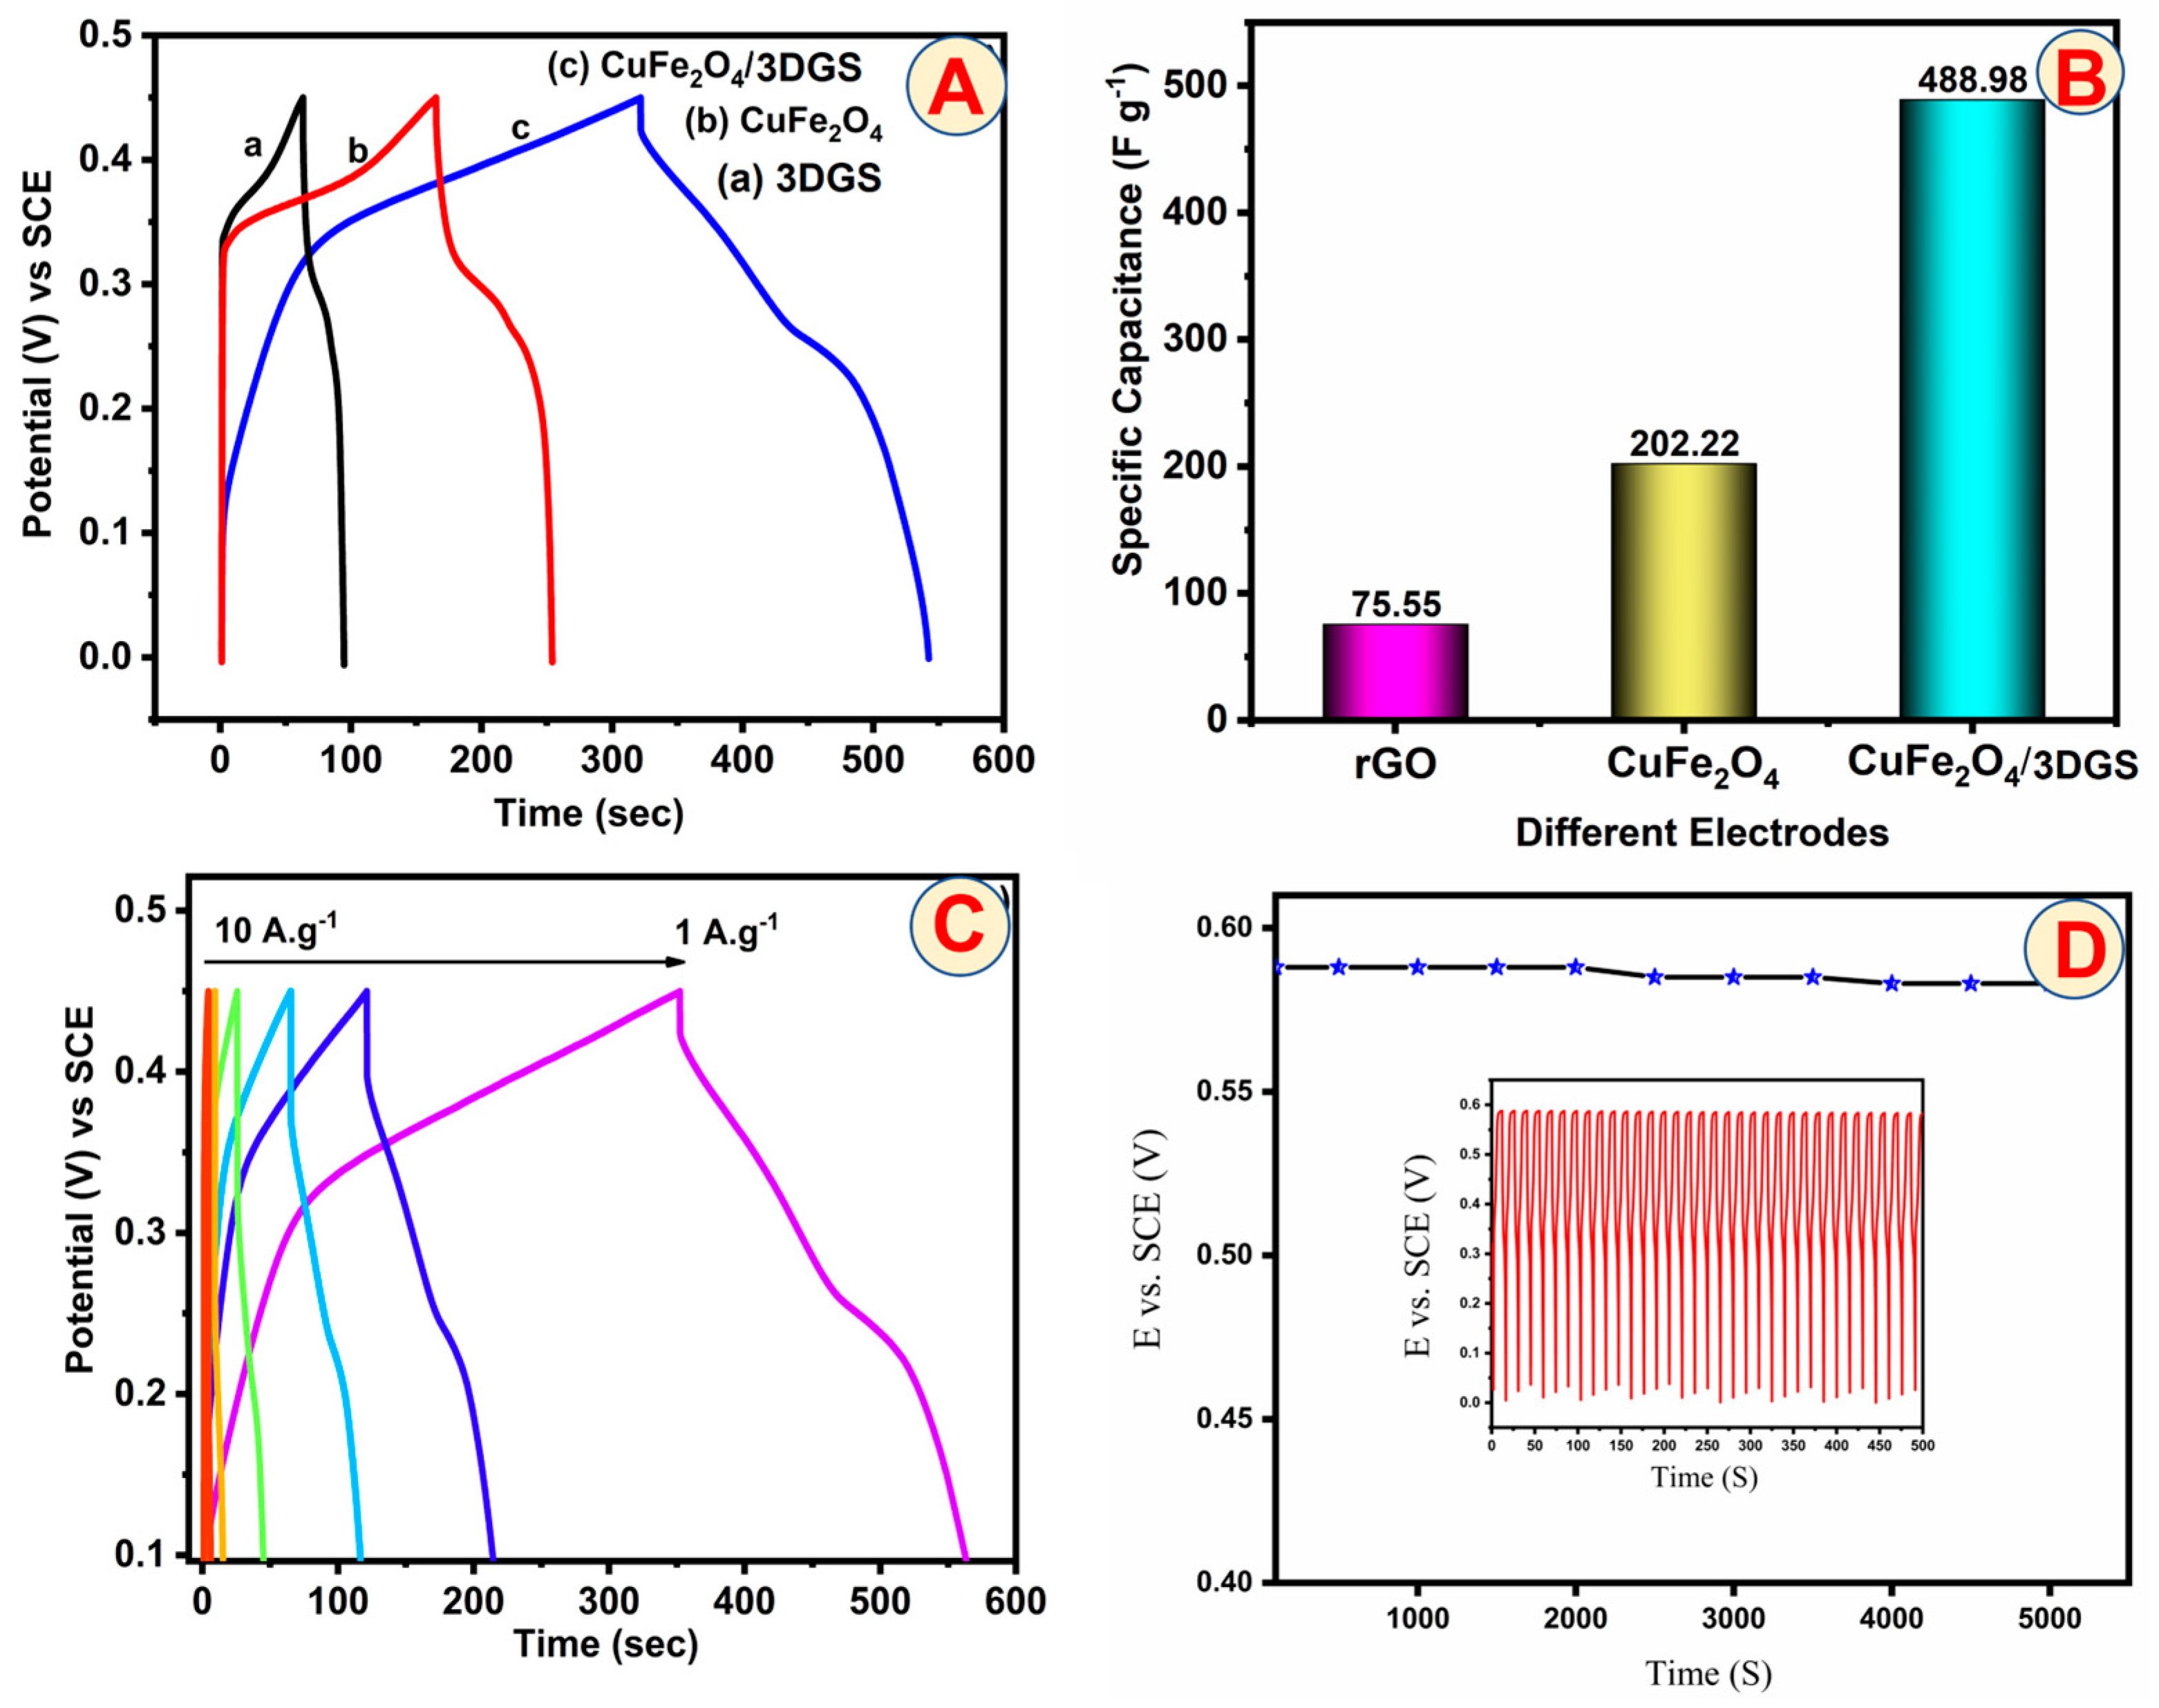
4. Supercapacitor Studies

A comparison of the capacitive performances of the three modified electrodes 3DGS/NF, CuFe2O4/NF, and 3DGS/CuFe2O4/NF using cyclic voltammetry in 2 M KOH was conducted in the potential range of 0 to +0.45 V at 50 mVs−1, and the results are displayed in Figure 5A. The cyclic voltammograms of 3DGS/NF, CuFe2O4/NF, and 3DGS/CuFe2O4/NF showed the presence of redox couples at about 0.26, 0.23, and 0.21 V, respectively. In the 2 M KOH electrolyte system, CuFe2O4 shows Faradaic redox reactions in the positive potential side due to the intervalence charge transfer between Cu2+/Cu+ and Fe3+/Fe2+. A pair of redox peaks of CuFe2O4 indicates its pseudocapacitive nature [68].
CuFe2O4 + H2O + 2e ⇆ CuO + 2FeO + 2OH
2CuO + H2O + 2e ⇆ Cu2O + 2OH
The electrophoretic peak of 3DGS exhibited a weak voltammetry response with very little background current in the potential range of 0 to +0.45 V. After that, the CuFe2O4/NF electrode exhibited a rapid increase in the peak current because CuFe2O4 oxidizes above this potential. Finally, the 3DGS/CuFe2O4/NF electrode obtained a higher Faradaic capacitance due to the higher electrocatalysis and good intercalation between 3DGS and CuFe2O4. The cyclic voltammetry area of the supercapacitor electrode serves as a window into the specific capacitance. The cyclic voltammetry area of the 3DGS/CuFe2O4/NF electrode was higher than those of the 3DGS and CuFe2O4 electrodes. Curiously, the cyclic voltammogram of the 3DGS/CuFe2O4/NF electrode displayed an even larger region, and the rectangular voltammogram form was indicative of a hybrid capacitor. In addition, the 3DGS/CuFe2O4/NF electrode displayed rectangular-shaped voltammograms typical of a hybrid capacitor, with contributions from the Faradaic reaction and double–layer charging. Moreover, the intercalation and deintercalation of K+ ions in the 3DGS/CuFe2O4/NF electrode were the cause of the higher Faradaic capacitance. The electrode capacitance was calculated using the formula given in Equation (7).
C = Q/ΔV mFg−1
where “ΔV” is the potential window of capacitance, “Q” refers to the total charge of the anodic and cathodic peak cycle, and “m” is the weight of the electrode material. The specific capacitance of the CuFe2O4/NF electrode (202.22 Fg−1) was higher than that of the 3DGS/Nf electrode (75.55 Fg−1). However, the 3DGS/CuFe2O4/NF (488.98 Fg−1) exhibited a remarkable increase in specific capacitance compared to 3DGS/NF and CuFe2O4/NF. The aforementioned results confirmed that the effective capacitance of CuFe2O4 and 3DGS led to the increased specific capacitance.
The cyclic voltammograms of the 3DGS/CuFe2O4/NF electrode in a 2 M KOH solution at different scan rates (10 to 100 mVs−1) are displayed in Figure 5B. In that figure, the anodic and cathodic peak currents plotted against the square root scan rate show a linear trend, indicating that the Na+ ion intercalation and deintercalation processes were diffusion-controlled.
Figure 5C presents a plot of the specific capacitance values vs. the scan rate. These findings indicate that increasing the scan rate from 10 to 100 mVs−1 decreased the specific capacitance value. The K+ ions can easily diffuse into practically all accessible areas of the electrode materials at low scan rates, resulting in a sufficient insertion reaction and nearly flawless capacitive behavior. At a high scan rate, the K+ ion can approach the outer surface of the electrode material, and the K+ ion is located away from the 3DGS/CuFe2O4/NF electrode surface; hence, it makes little contribution to the electrochemical capacitive behavior because the outer active surface is used for charge storage and electroactive materials are used at high discharge current densities, preventing ions in the electrolyte from entering the inner surface of the active material [9,10,13]. However, the current densities are decreasing, and ions in the electrolytes are entering the inner surface of the 3DGS/CuFe2O4/NF electrode materials. As a result, the scan rate increases to reduce capacitance.
GCD measurement is a very useful technique for the analysis of the specific capacitance of prepared supercapacitor electrode materials. Figure 6A shows the specific capacitance of the as-prepared 3DGS/CuFe2O4 composite after increasing the charge and discharging current density. Consequently, the galvanostatic discharge time of the 3DGS/CuFe2O4/NF composites was longer than that of the other produced materials, namely 3DGS/NF and CuFe2O4/NF. In addition, the results indicated that the 3DGS/CuFe2O4 composite had a more significant charge capacity nature, which was well consistent with the CV investigations (Figure 5A). The 3DGS/NF, CuFe2O4/NF, and 3DGS/CuFe2O4/NF electrodes’ galvanostatic charge–discharge behavior is depicted in Figure 6A under an applied constant current density of 2 Ag−1 in the potential range of 0.4 to 0.5 V in 2 M KOH. The following Equation (8) was used to calculate the capacitance values.
Cs = i ∆t/(m∆v)
where “m” is the mass of the supercapacitive material, “∆v” is the potential window, “I” is the charge or discharge current (A), and “∆t” is the discharge time (S).
The specific capacitance of the prepared electrodes was made of all materials at a constant density of 1 Ag−1. Another observation is that there is very good agreement between the specific capacitance values obtained from charge–discharge experiments and cyclic voltammetry. Furthermore, the curves show two variation ranges during the charge and discharge steps. The time dependence of the potential is linear below approximately −0.3 V, demonstrating the behavior of pure double-layer capacitance resulting from the separation of charges at the electrode/electrolyte interface. Above −0.3 V, the dependency becomes nonlinear, indicating the normal behavior of pseudo capacitance. The specific capacitance values of the as-made 3DGS/CuFe2O4/NF electrode are better in 3DGS/NF and CuFe2O4/NF. The comparison results show that our 3DGS/CuFe2O4/NF electrode performs better than several similar electrodes. One of the critical elements affecting the supercapacitor capacitive behavior is current density. Figure 6A displays the charge–discharge curves of the 3DGS/CuFe2O4/NF electrode, which were measured in 0.5 M KOH at current densities of 1 Ag−1 to 10 Ag−1 between 0.1 and 0.45 V. For the same current density values mentioned above, the calculated specific capacitance values were 488.98, 202.22, and 75.55 Fg−1, respectively. Figure 6B shows the bar diagram of specific capacitance values of the 3DGS/CuFe2O4/NF, CuFe2O4/NF, and 3DGS/NF electrodes. The 3DGS/CuFe2O4 composite system exhibits capacitive characteristics during the charging and discharging operations, as seen by the asymmetric charge–discharge lines. Due to the asymmetry between the charge–discharge and charge curves of the 3DGS/CuFe2O4/NF electrode, it may be concluded that these systems are pseudocapacitive and show double-layer contributions. The specific capacitance diminishes progressively as the current densities rise. Moreover, the specific capacitance performance of 3DGS/CuFe2O4 compared with other same material literature, and mentioned in Table S1.
As shown in Figure 6C, the specific capacitance of the prepared supercapacitor electrodes was examined at various current densities. Due to the redox reaction, the discharge reaction produced a non-linear curve and low potential decay; deep ion intercalation illustrates the pseudocapacitive nature of the prepared materials. Because ions in the electrolyte cannot penetrate the inner surface of the active material, only the outer active surface is used for charge storage, which results in the limited utilization of electroactive materials at high discharge current densities. Because ions from the electrolytes are penetrating the inner surface of the active materials at low current densities, the capacitance falls as current densities rise. One of the key features of hybrid nanostructure-based supercapacitors is the cycle stability test. Through repeated galvanostatic charge–discharge testing between 0 and 0.6 V at a constant current density of 1 Ag−1 for more than 5000 cycles, the cycle stability of the 3DGS/CuFe2O4/NF electrode was determined. Figure 6D displays the estimated specific capacitance values for a few intermittent cycles against the corresponding cycles. Figure 6D plots cycle numbers against certain capacitance values. The specific capacitance value was identified during the first 500 s cycles mentioned in the inset. Then, it was noticed that the decay slowed down, resulting in an overall loss of 20% by the end of 5000 cycles.

5. Electrochemical Sensor Performance

5.1. Different Modified Electrode Studies toward the Detection of CAP

Electrochemical studies on the detection of CAP were conducted using the normal three-electrode system in the presence of 50 µM of CAP in PBS (pH 7) at a scan rate of 50 mVs−1 using various modified electrodes. Figure 7A reveals the CV curves for the reduction of CAP for bare GCE, GCE/3DGS, GCE/CuFe2O4, and GCE/3DGS/CuFe2O4 modified electrodes. The reduced peak currents of the bare GCE are shown at −0.12 V, with the peak current of CAP being 22.2 µA. Additionally, the GCE/3DGS electrode exhibited a peak current of 83.8 µA at −0.89 V. Conversely, the GCE/CuFe2O4 electrode exhibited a peak current of 88.8 µA at a potential of −0.53 V. In the presence of CAP, the detection peak current was well-sharpened when the bare GCE surface was modified with GCE/CuFe2O4. The final GCE/3DGS/CuFe2O4 modified electrode also displayed a reduction peak of 105.7 µA at a potential of −0.68 V. The final GCE/3DGS/CuFe2O4 electrode showed a more significant peak current than the bare GCE, GCE/3DGS, and GCE/CuFe2O4 electrodes because of their superior electrocatalytic activity. The obtained CAP detection peak current bar graph diagram is provided in Figure 7B. Overall, the electrochemical detection of CAP compared with previously published CAP sensor reports showed better results. Without CAP added, the GCE/3DGS/CuFe2O4 electrode CV curves exhibited no electrochemical response in this potential range. This indicated that the GCE/3DGS/CuFe2O4 electrode only showed a selective response in the presence of CAP. The GCE/3DGS/CuFe2O4 electrode showed the reduction peak (R1) and a distinct pair of redox peaks (Q1, R2) at −0.155 V, −0.784 V, and −0.034 V, respectively. CAP was directly reduced to phenylhydroxylamine to show an R1 peak. At the same time, two redox peaks (R2 and O1) were linked to the two-electron redox process that reduces nitroso derivatives into hydroxylamine and then oxidizes hydroxylamine into a nitroso derivative (Scheme 2). We discovered that the GCE/3DGS/CuFe2O4 electrode showed the R2 peak current to be very high for CAP reduction due to the strong interaction between 3DGS and CuFe2O4. Moreover, the peak current of R1 was lower than those of R2 and Q1, indicating that the CAP reduction at the GCE/3DGS/CuFe2O4 electrode forms aryl hydroxylamine at a lower rate than the nitroso formation. Scheme 2 suggests a potential electrochemical redox mechanism of CAP on the GCE/3DGS/CuFe2O4 electrode. This demonstrates that the combination of the high electrical conductivity and the ideal large surface area of the 3DGS/CuFe2O4 composite was the reason behind the effective interaction of the CAP molecules compared to 3DGS and CuFe2O4 fiber.

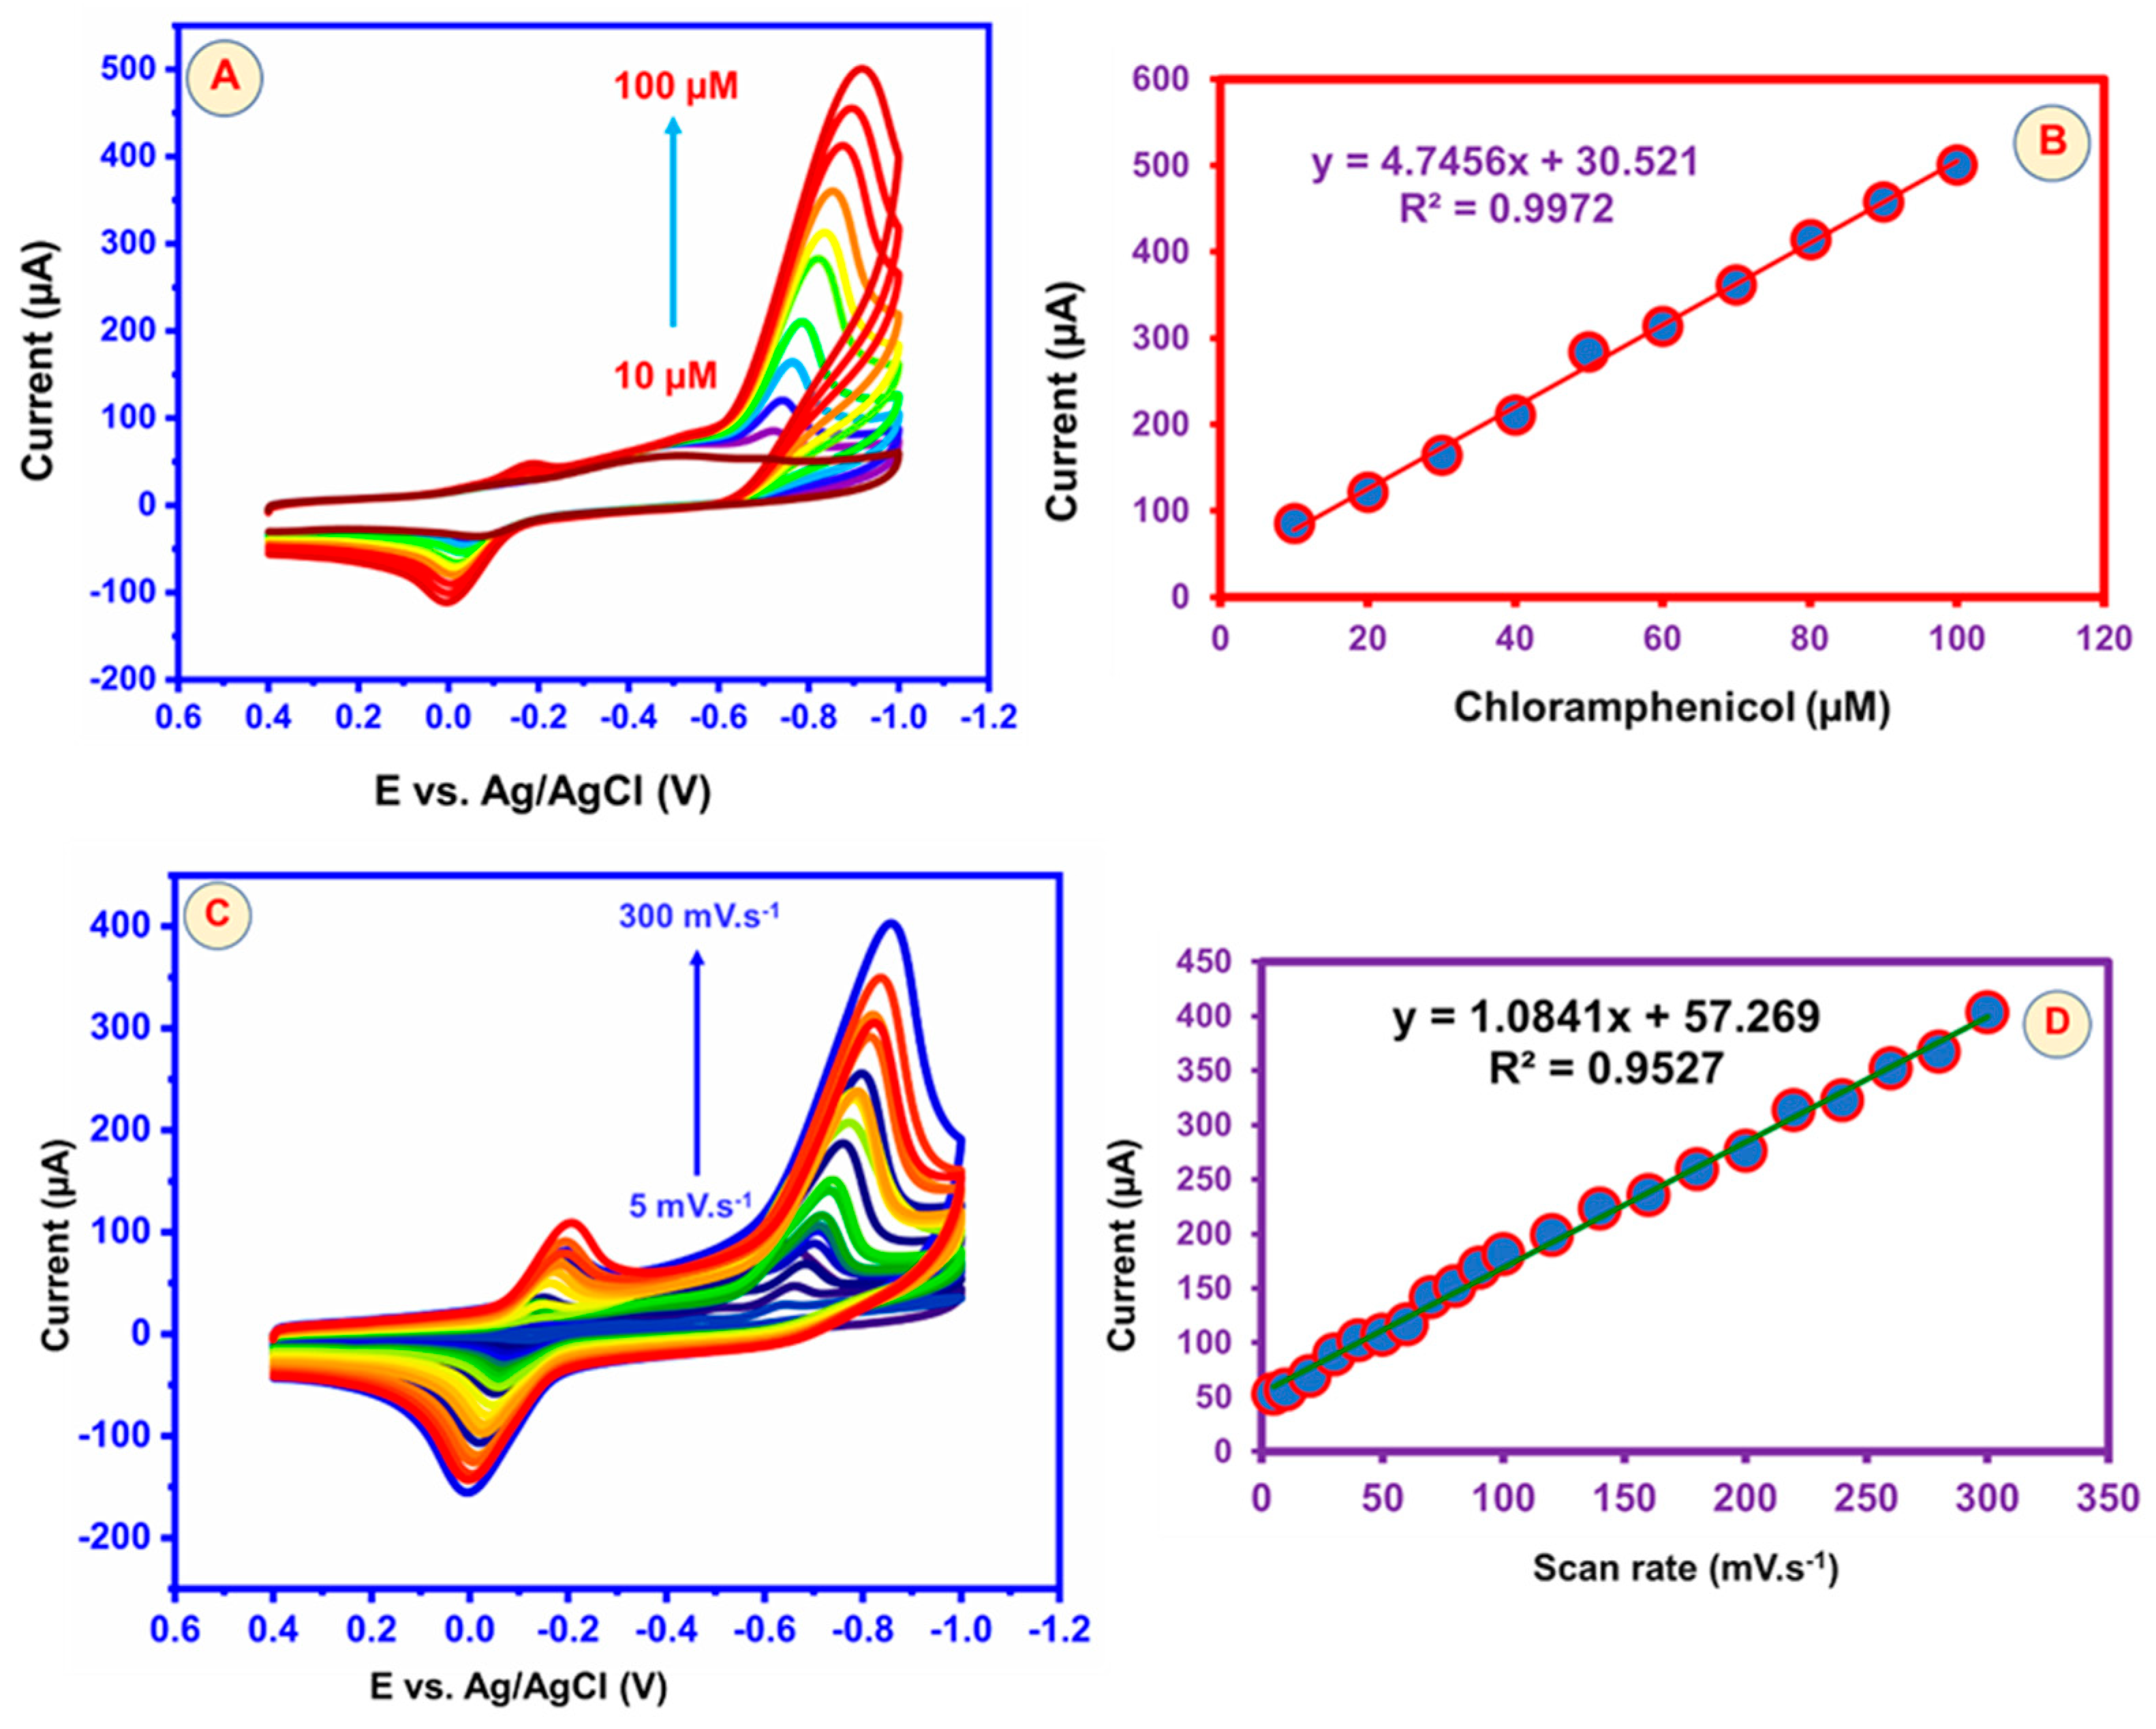
5.2. Effect of Different Concentration and Scan Rate Studies
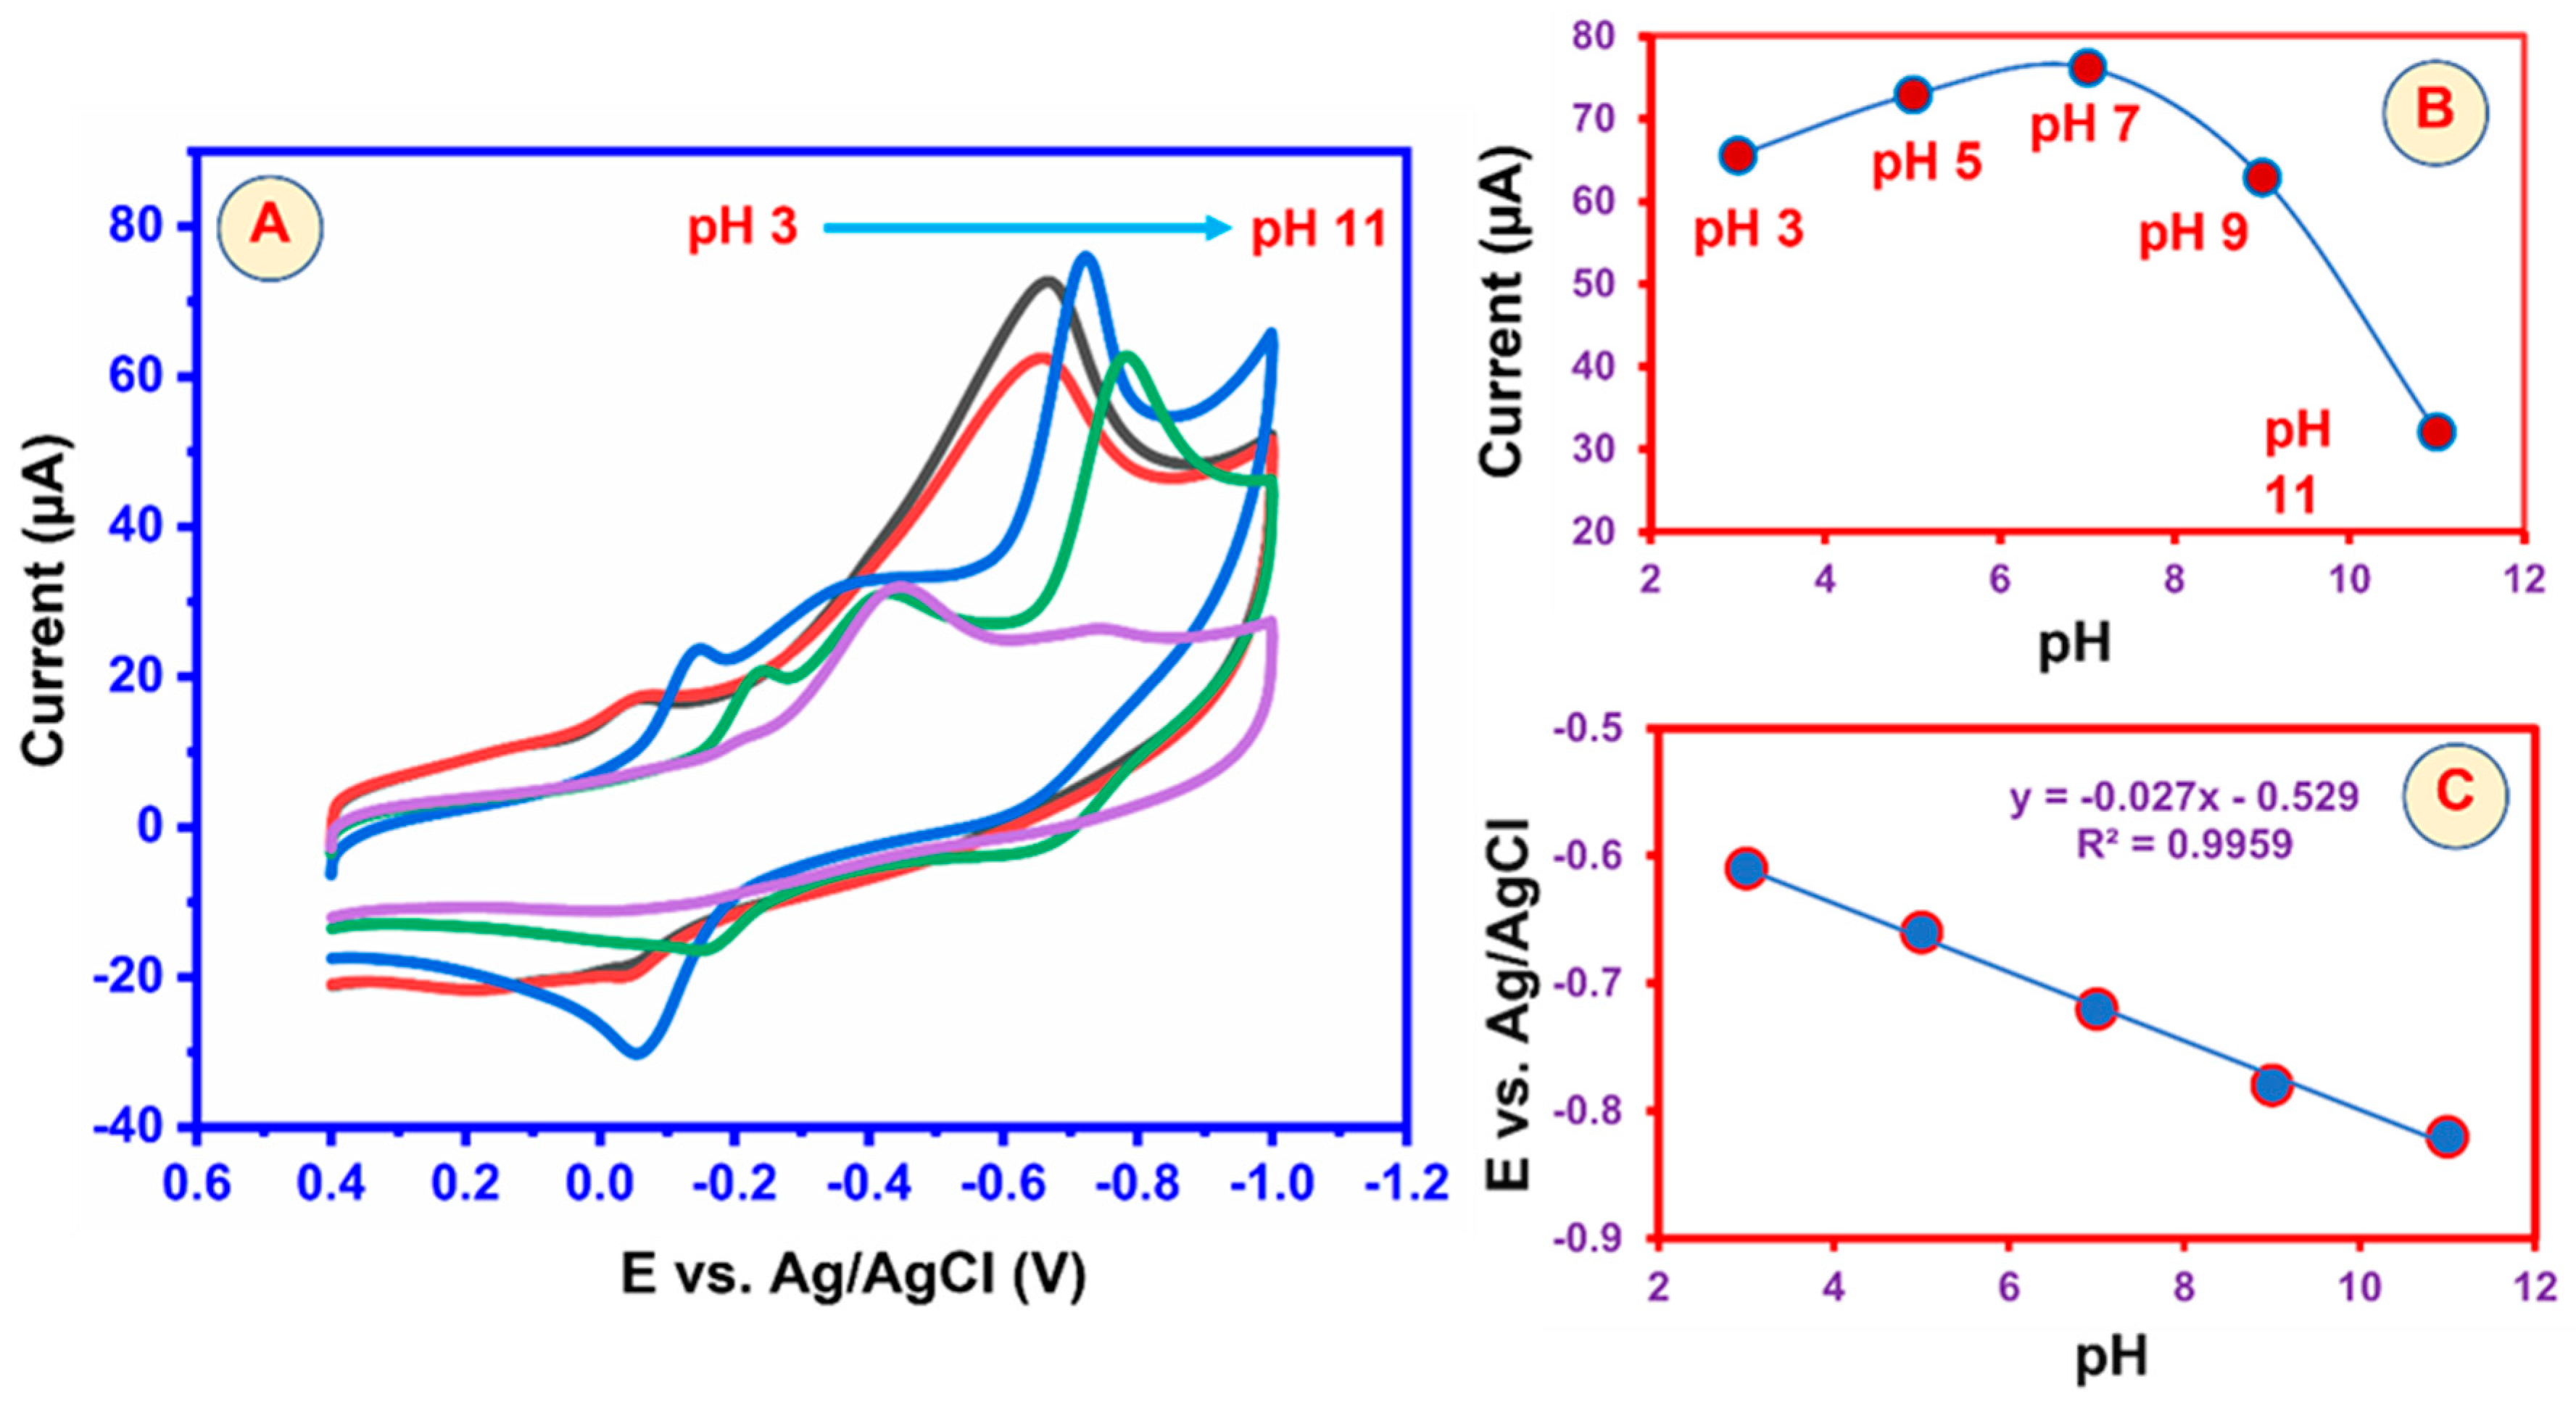
Different concentration and scan rate studies are essential in developing electrochemical sensors. Figure 8A presents the CV curves for CAP reduction performance at different concentrations in N2-saturated 0.05 M PBS. The GCE/3DGS/CuFe2O4 electrode had linear concentration ranges up to 100 μM. The CAP reduction peak current was significantly increased for the different concentration additions of CAP. The GCE/3DGS/CuFe2O4 electrode showed a good surface area, electrocatalytic activity, and electron transport responses due to the π–π stacking interaction. Figure 8B shows the linear plot between the CAP reduction peak current and different concentrations of CAP. The CAP concentration and peak current were plotted in a linear relation with the linear equation y = 4.7456x + 30.521 and the coefficient of R2 = 0.9972. These studies proved that the GCE/3DGS/CuFe2O4 electrode exhibited a good CAP electrocatalytic activity. Since the slope value was nearly equal to 1, it was likely a first-order kinetic reaction involving the electrocatalytic oxidation of CAP.
Figure 8C depicts the CV response and impact of the scan rate on the GCE/3DGS/CuFe2O4 electrodes toward the detection of CAP. The influence of the scan rate response of 50 µM of CAP was conducted for 5–300 mVs−1 scan rates in a 0.05 M PBS solution at pH 7. Figure 8D shows that increasing the scan rate also increased the CAP reduction peak current. The reduction peak current was plotted against various scan rates, and the results exhibited a good linearity, with a slope of 1.0841 and a correlation coefficient of 0.952. The good linearity suggests that the CAP reduction was a process that was regulated by an adsorption controlled reaction. The scan rate studies confirmed that the CAP reduction peak current increased for the different scan rates. Finally, the scan rate studies confirmed that the electrochemical reaction of CAP was a surface-controlled process. The scan rate results were consistent with previous CAP reports.

5.3. Effect of pH

The pH of the electrolyte solution influences the electrochemical detection performance of CAP. Therefore, we used a CV study to determine the impact of pH on the detection of CAP. The scan rate was set at 100 mVs−1 and the pH was altered between 3 and 11. Figure 9A shows the electrochemical detection peaks of CAP from a low pH solution to a high pH solution. The maximum peak current response was at pH 7; after that, it decreased slowly to pH 11. The increases in peak current up to pH 7 due to the pKa value of CAP (5.52) influenced the amount of CAP adsorbed on the GCE/3DGS/CuFe2O4 electrode surface. The peak current response loss above pH 7 was attributed to the hydrolysis of CAP. Moreover, the peak potentials shifted to more negative potentials as the pH increased from 3 to 9 for CAP determination, implying that the proton is involved in the redox reaction process. pH 7 was the most appropriate for the adsorption of CAP on the GCE/3DGS/CuFe2O4 electrode surface. The possible electrochemical reaction mechanism of CAP on the GCE/3DGS/CuFe2O4 electrode can be described by Scheme 2. Therefore, we used pH 7 for all the electrochemical studies. Figure 9B shows the linear plot relation between anodic peak potential (Ep) and pH. The slope value was near the Nernst value. This result revealed that the numbers of protons and electrons in the CAP oxidation at the GCE/3DGS/CuFe2O4 electrode were equal.

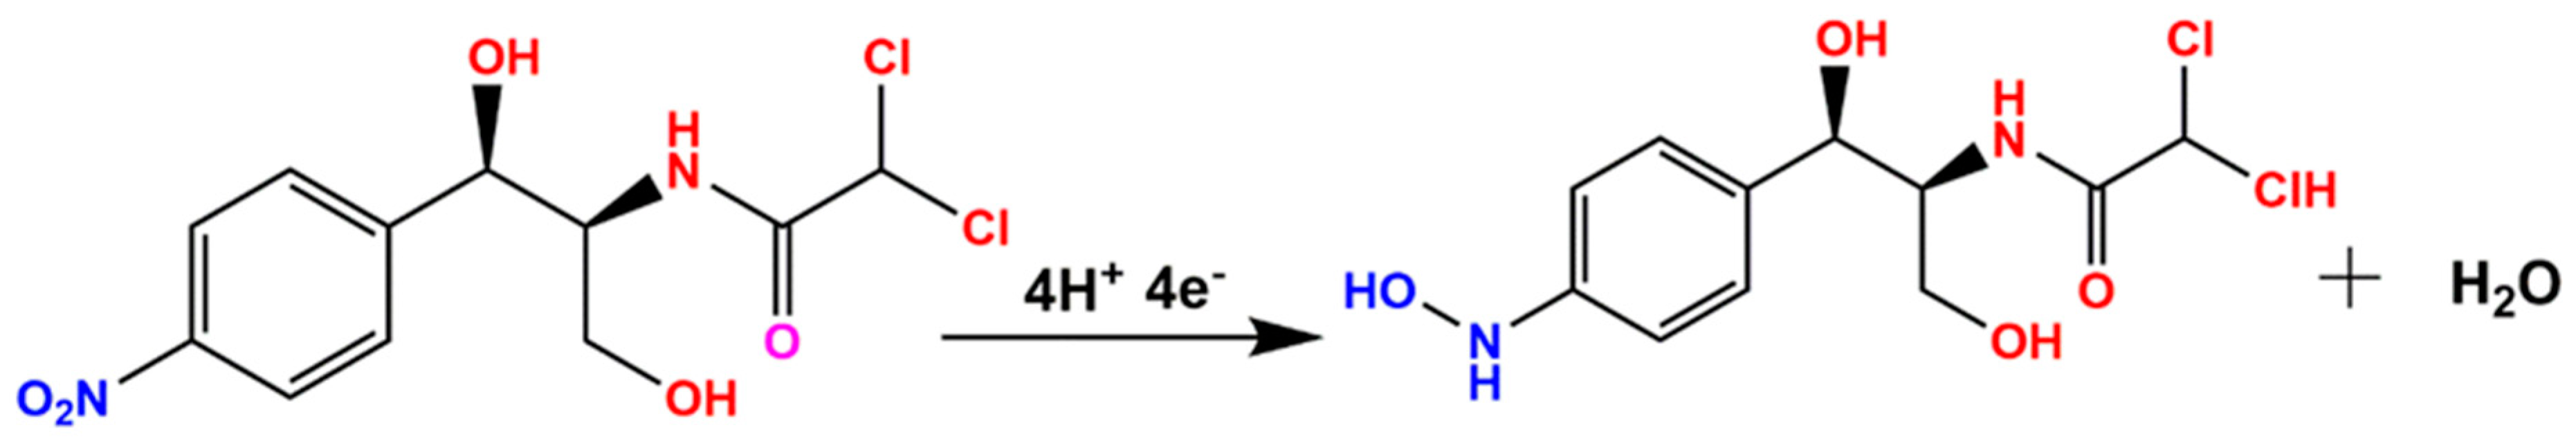
5.4. DPV Studies toward the Detection of CAP over the GCE/3DGS/CuFe2O4 Electrode

Differential pulse voltammetry (DPV) is a very sensitive method compared to other CV techniques. The electrochemical and detection ability performances of the 3DGS/CuFe2O4 electrode were evaluated by the DPV method in optimal pH 7 PBS. The electrolyte solution was well mixed before DPV measurements to ensure that the additional CAP was thoroughly blended. As a result, DPV tests were used to determine the electrode sensitivity, detection limit, and linearity of the GCE/3DGS/CuFe2O4 electrodes for CAP reduction. Figure 10A shows the performance of GCE/3DGS/CuFe2O4 electrode DPV in N2-purged PBS (pH 7) at different CAP concentrations. The peak value of the DPV increased steadily with increasing CAP concentration. There was a finite number of active spots on the electrode surface. The active site of the GCE/3DGS/CuFe2O4 electrode decreased after a CAP concentration of 400 µM because of CAP accumulation throughout the electrochemical process. At low concentrations of CAP, full occupancy of the active sites was not achieved. The CAP detection peak current rose with increases in CAP concentration. The corresponding results showed that up to 400 μM of CAP concentration was added. Furthermore, the linear calibration plot of the decreased peak current (Ipc) against CAP concentration is shown in Figure 10B, and it relates to the correlation coefficient determination of R2 = 0.9925. Ip = 0.2661 [CAP]/μM + 24,698. Furthermore, based on the slope/electrode area (sensitivity = slope/electrode active area), the electrode sensitivity was determined to be 3.7478 μAμM−1cm−2, and its linear concentration response varied from 5 to 400 μM. Furthermore, the limits of quantification (10× standard deviation/slope, S/N = 10) and detection (LOD) (3× standard deviation/slope, S/N = 3) were found to be 0.04 μM and 0.5 μM, respectively. The results were compared with those of earlier studies (Table 1). The electrochemical detection of CAP at the GCE/3DGS/CuFe2O4 electrode was lower than those of the other reported electrodes, such as P(EBT)/GCE) [LOD = 3 µM] [23], C-BN [LOD = 0.035 µM] [69], Cu–BCN/GCE [LOD = 2.41 µM] [22], Gr/CuPc/GCE [LOD = 0.75 µM] [21], GO/ZnO/GCE [LOD = 0.01 µM] [70], rGO/PdNPs/GCE [LOD = 0.02–1 µM] [71], ZnONPs/SWCNTs [LOD = 0.03 µM] [72], activated SPCE [LOD = 0.02 µM] [73], CuNDs/MWCNTs/GCE [LOD = 9.84 µM] [74], and g-C3N4/EuMoO4 [LOD = 0.4 µM] [24]. The comparison data show that the GCE/g-C3N4/EuMoO4 electrode had a better sensor response for the detection of CAP.
The findings show that, in terms of high sensitivity, low detection limit, and detection speed, the GCE/3DGS/CuFe2O4 electrode performed better than most prior sensor reports. Furthermore, the electrochemical detection of CAP at the GCE/3DGS/CuFe2O4 electrode is lower compared to other reported electrodes. The GCE/3DGS/CuFe2O4 electrode demonstrated a low detection limit of 0.5 μM, a wide linear range of 5–400 μM, and a respectable selectivity toward the detection of CAP. Furthermore, according to the data, CuFe2O4 may be a suitable electrocatalyst for the reduction of CAP due to its relatively high electron transfer rate. Furthermore, 3DGS materials have a large surface area and promote effective interaction with CuFe2O4. As a result, the GCE/3DGS/CuFe2O4 electrode can be used for the electrochemical sensing of CAP.

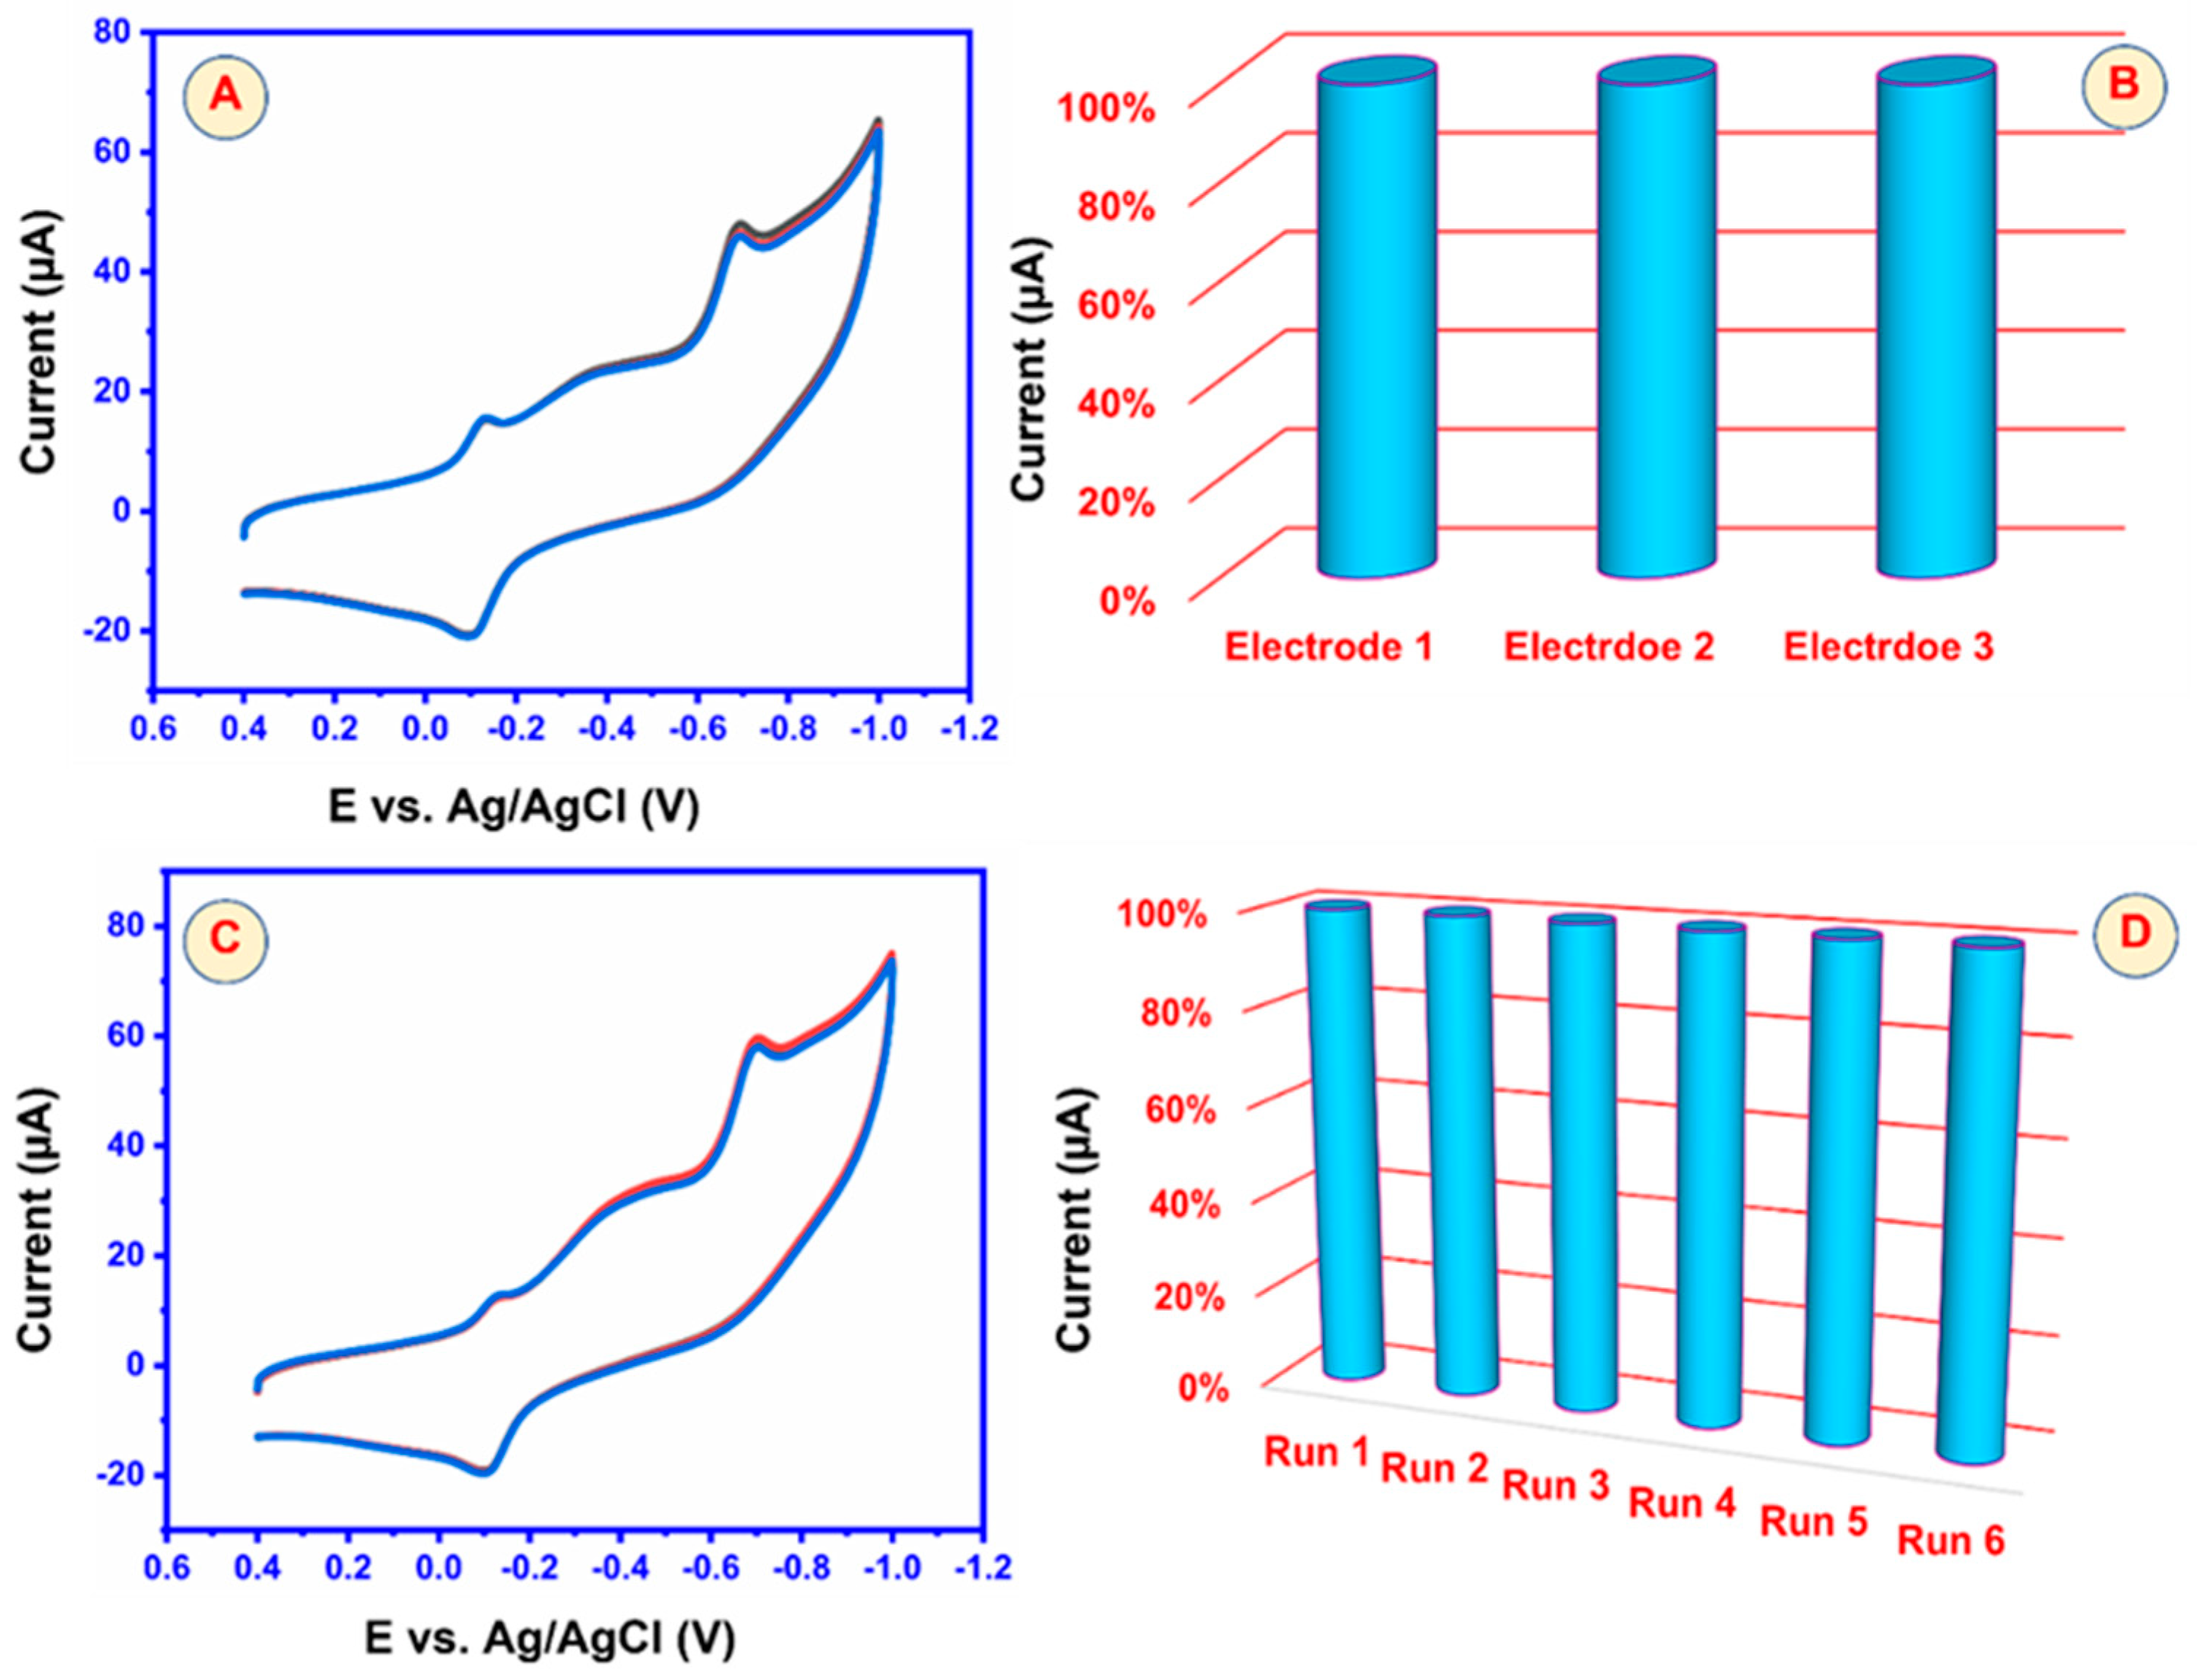
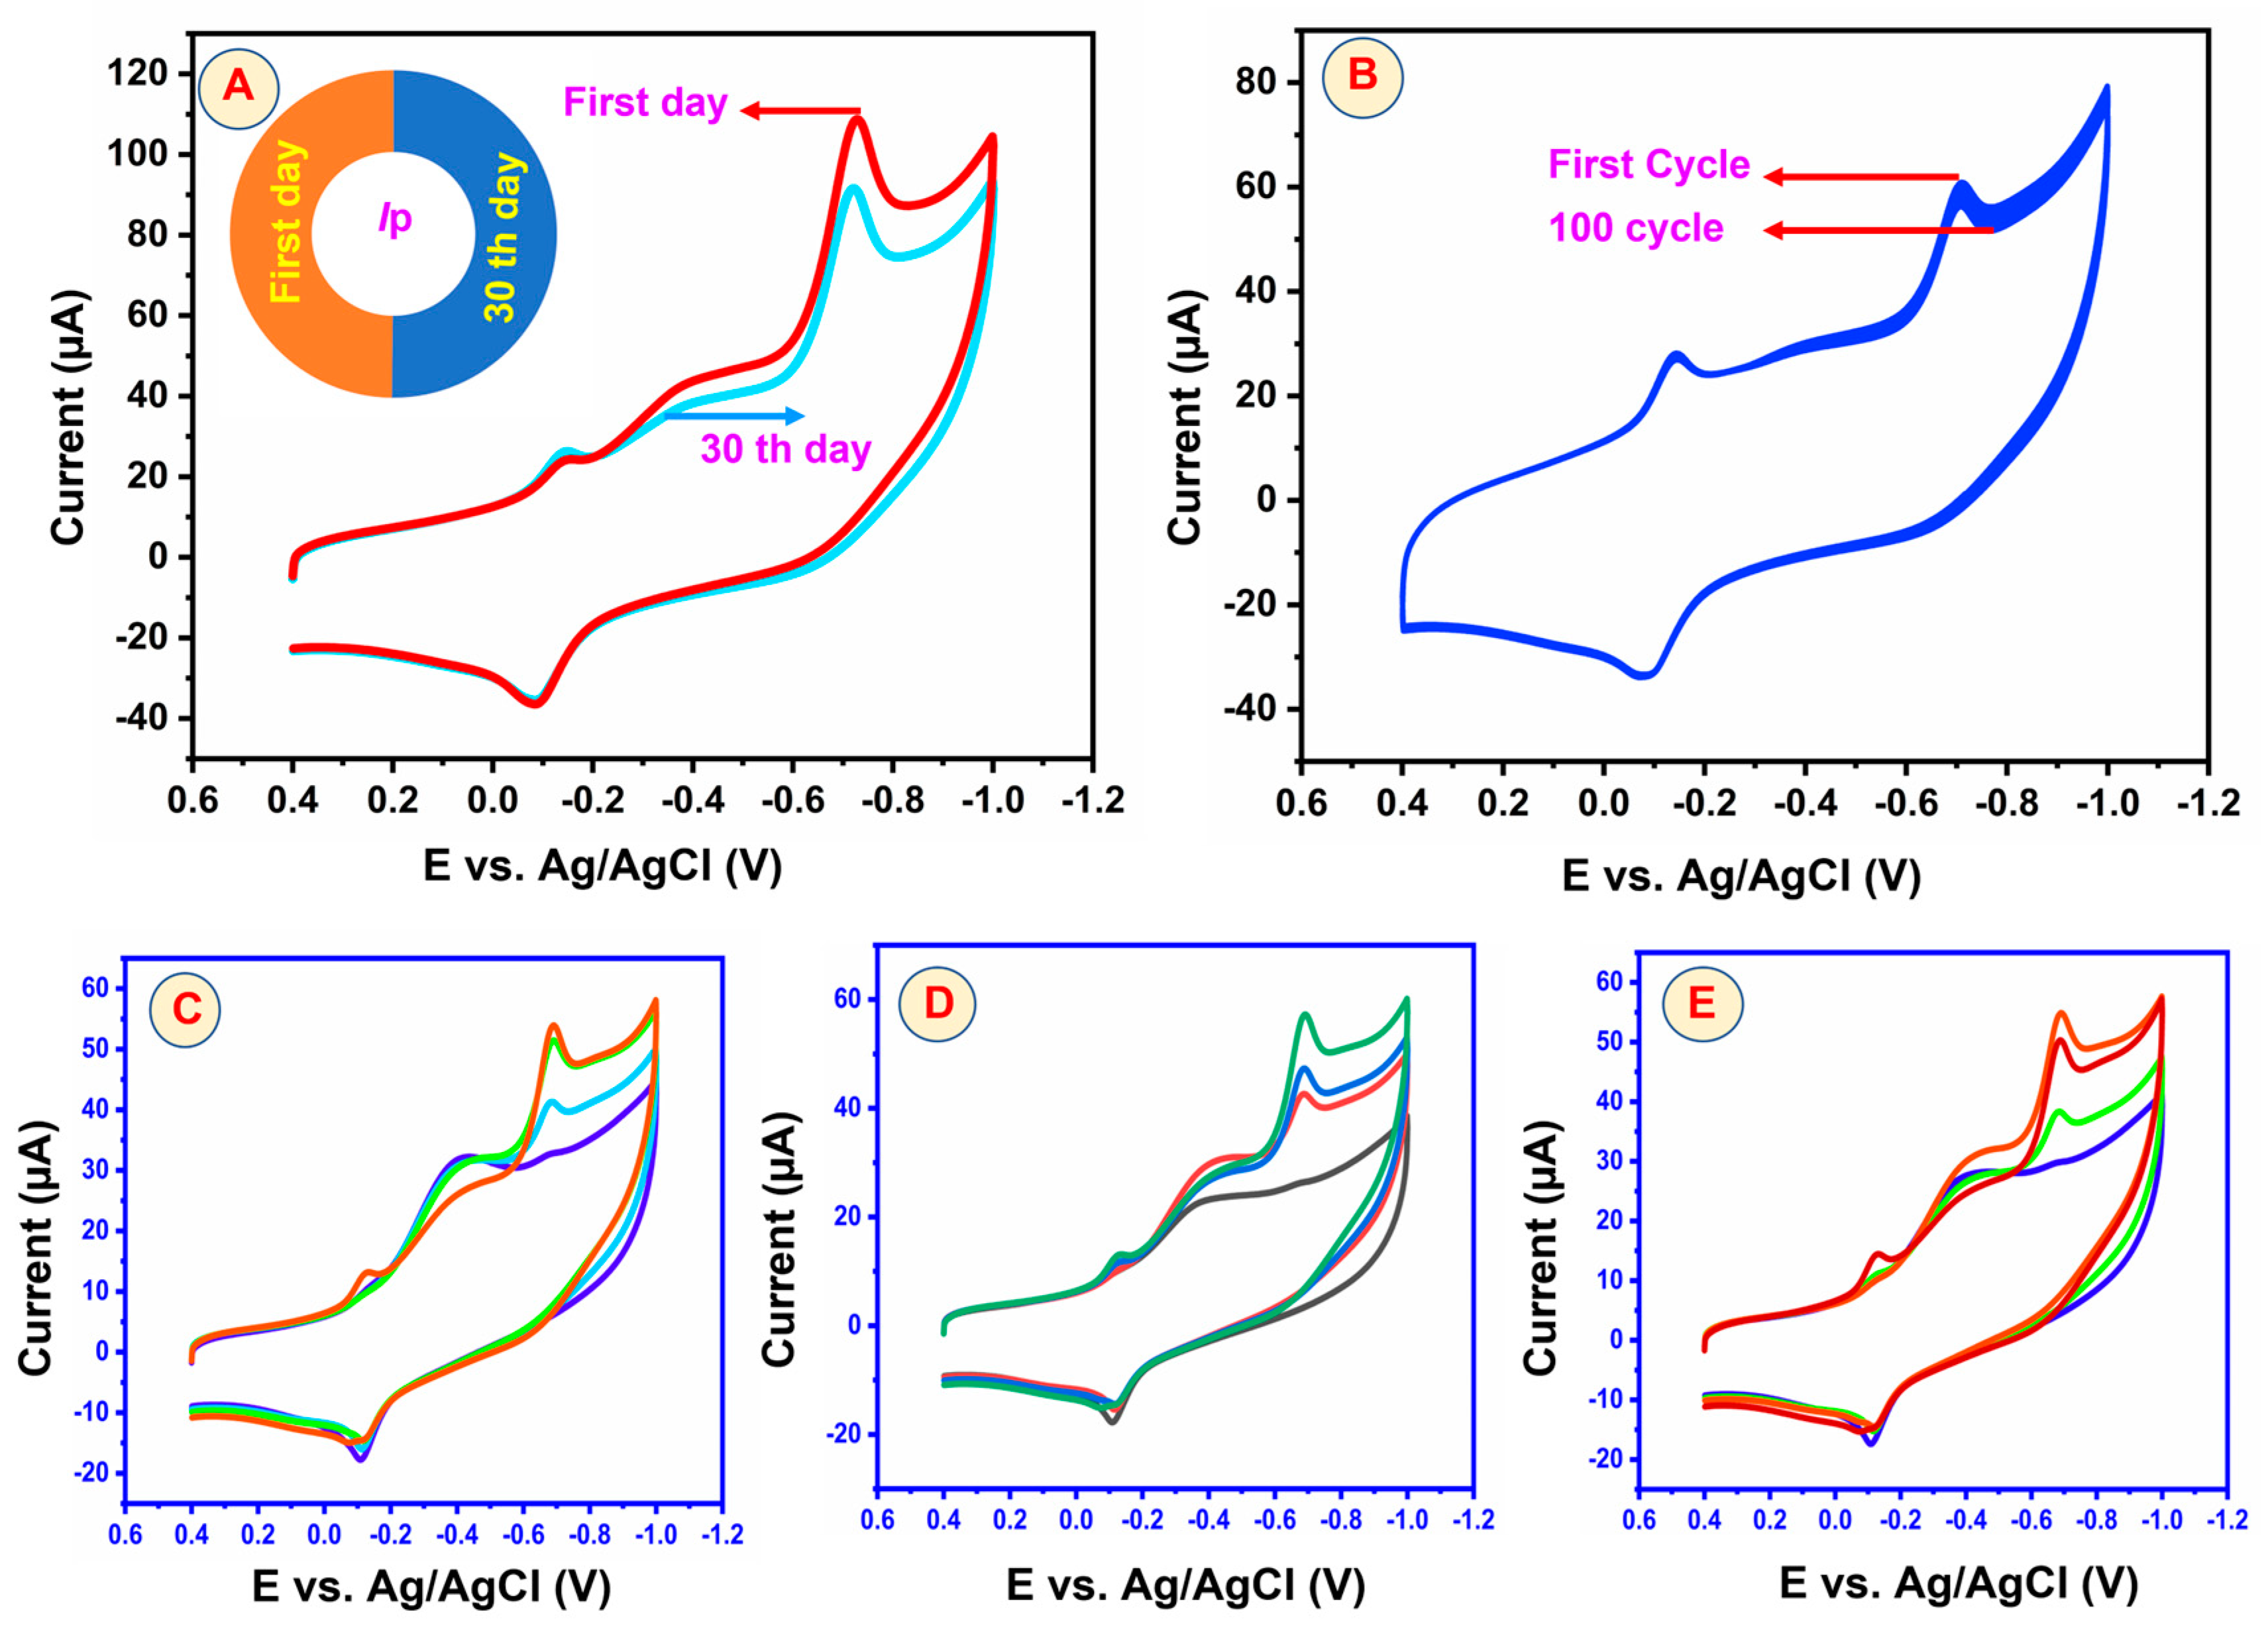
5.5. Repeatability, Reproducibility, and Stability of GCE/3DGS/CuFe2O4 Electrodes

The prepared GCE/3DGS/CuFe2O4 electrodes were tested for repeatability and reproducibility using the CV method in N2-purged PBS with 50 μM of CAP at a scan rate of 50 mVs−1. As shown in Figure 11A, the repeatability of the modified electrode was studied with six repeated electrochemical runs of the GCE/3DGS/CuFe2O4 electrode for the detection of CAP. Figure 11B shows the repeatability studies of the bar diagram of the GCE/3DGS/CuFe2O4 electrode. The CV curves demonstrated comparable cathodic currents of CAP detection with an RSD value of 2.5%, demonstrating the outstanding reproducibility of the GCE/3DGS/CuFe2O4 electrode. As illustrated in Figure 11C, the reproducibility investigation was carried out using CAP detection over three distinct GCE/3DGS/CuFe2O4 electrodes for each concentration at fixed time intervals. Figure 11D shows the reproducibility studies of the bar diagram of the GCE/3DGS/CuFe2O4 electrode. The average relative standard deviation (RSD) exhibited was 2.5%, well within the acceptable levels according to guidelines. The RSD value of the reproducibility studies was 2.1%. These results suggest that the electrode can be reliably fabricated.
Stability experiments of the GCE/3DGS/CuFe2O4 electrode were also conducted. Figure 12A presents the storage stability results of the GCE/3DGS/CuFe2O4 electrode, and Figure 12B shows the cyclic stability results of the GCE/3DGS/CuFe2O4 electrode. The GCE/3DGS/CuFe2O4 electrode was kept in 0.1 M PBS (pH = 7.4) at 25 °C for 30 days to examine its long-term stability. The GCE/3DGS/CuFe2O4 electrode demonstrated that the sensor retained 90.1% of its initial peak response, indicating the long-term 30-day storage stability of the GCE/3DGS/CuFe2O4 electrode. Additionally, the cyclic stability of the GCE/3DGS/CuFe2O4 electrode was examined with CV experiments. In CV experiments, 95.32% of the initial current response was maintained after 100 cycles, indicating high stability. The aforementioned studies show that the GCE/3DGS/CuFe2O4 electrode has a good stability, repeatability, and reproducibility in the detection of CAP.

5.6. Real Sample Analysis of the GCE/3DGS/CuFe2O4 Electrode

Figure 12C,D present the results of real sample analysis with the GCE/3DGS/CuFe2O4 electrode. We conducted such analyses in (C) milk, (D) honey, and (E) eye drop samples. These real samples were obtained from local markets and pharmacies in Taipei, Taiwan. The collected samples were diluted appropriately with distilled water and then spiked with known amounts of CAP. The assay parameters matched those applied to the laboratory specimens. The recovery rate of CAP was assessed using the standard addition method. Table 2 lists the results of the real sample analysis of milk, honey, and eye drops, showing satisfactory CAP recovery rates ranging from 97.53% to 102.53%. These real sample analyses demonstrated that the GCE/3DGS/CuFe2O4 electrode could detect real-time CAP in food and drug products.

6. Materials and Methods

Graphite, nitric acid (HNO3), sulfuric acid (H2SO4), monosodium phosphate (NaH2PO4), disodium hydrogen phosphate (Na2HPO4), N-methyl pyrrolidinone (NMP), potassium ferric cyanide (K3Fe(CN)6·3H2O), potassium ferrocyanide (K4Fe(CN)6·3H2O), sodium hydroxide (NaOH), potassium hydroxide (KOH), copper nitrate hexahydrate, iron nitrate nonahydrate, dimethylformamide were obtained from ACROS chemical company, Taiwan. Ni foam (NF) (1 × 1 cm2), glassy carbon (GC) electrode, silver/silver chloride electrode (Ag/AgCl), platinum wire (BAS Inc. Tokyo Japan), nitrogen (N2) gas, and ultra-pure double distilled water were used for all the experiments. Material preparation and characterization were carried out by suitable physical and chemical characterization techniques such as X-ray diffraction analysis (XRD) (XRD, D2 Phaser, Bruker, Billerica, Massachusetts, USA) using Cu Kα radiation (λ = 1.5406 Å). After the diffraction, the data were analyzed in MDI JADE5.0 software and compared with the JCPDS Card database. Field emission scanning electron microscopy (SEM) (JEOL, JSM-7610F, Tokyo, Japan, and Hitachi Regulus 8100, Tokyo, Japan, respectively), energy dispersive X-ray analysis (EDX), transmission electron microscopy (TEM) (Japan Electron Optic Co., Ltd., JEOL 2100F, Tokyo, Japan), Raman spectroscopy (ACRON, UniNanoTech Co., Ltd., Yonginsi, Korea), and electrochemical impedance spectroscopy (EIS) (CH Instruments, Inc. 3700 Tennison Hill Drive Austin, TX 78738 – 5012 USA). The supercapacitor performance has been determined by CHI cyclic voltammetry (CV) and the galvanostatic charge–discharge technique (CH Instruments, Inc. 3700 Tennison Hill Drive Austin, TX 78738-5012, USA). The electrochemical performance of the GCE/3DGS/CuFe2O4 modified electrode was assessed by cyclic voltammetry (CV) and differential pulse voltammetry (DPV).

7. Conclusions

In conclusion, the CuFe2O4/3DGS composite was successfully synthesized and employed for supercapacitor and electrochemical sensor applications. Several electrochemical techniques including electrochemical impedance, cyclic voltammetry, differential pulse voltammetry, and chronopotentiometry were used to assess the electrochemical performance of the GCE/3DGS/CuFe2O4 electrode. The 3DGS played a significant role in the 3DGS/CuFe2O4/NF electrode to improve the electrochemical capacitance and electrochemical sensor. Because of the hierarchical structure and good electrical conductivity, the 3DGS/CuFe2O4 composites had an excellent specific capacitance, a high current density, and a high power density. Accordingly, the results indicated that the prepared composites were promising electrodes for supercapacitor materials. Furthermore, the prepared 3DGS/CuFe2O4 composite has an excellent electrochemical performance toward the identification of CAP, with a detection limit of 0.5 µM, linear range of 5–400 µM, and electrode sensitivity of 3.7478 µA µM−1 cm−2. Furthermore, the GCE/3DGS/CuFe2O4 electrode revealed a good selective detection of CAP in real sample analysis. It also exhibited excellent repeatability, reproducibility, and stability. In conclusion, the CuFe2O4/3DGS composite exhibited a superior capacitance performance and superior electrochemical sensing.

Supplementary Materials

The following supporting information can be downloaded at: https://www.mdpi.com/article/10.3390/inorganics12060164/s1, Table S1: Specific capacitance performance of 3DGS/CuFe2O4 compared with other same material literature. References [75,76,77,78,79] are cited in the supplementary materials.

Author Contributions

Conceptualization, S.V., A.K.K., S.S. and T.-W.C.; methodology, S.V., A.K.K., S.S. and T.-W.C.; software, S.V., A.K.K. and S.S.; validation, S.V., A.K.K., S.S., T.-W.C. and N.V.; formal analysis, S.V., A.K.K., S.S., T.-W.C. and N.V.; investigation, S.V., A.K.K. and T.-W.C.; resources, T.-W.C. and N.V.; data curation, S.V., A.K.K. and S.S.; writing—original draft preparation, S.V., A.K.K. and S.S.; writing—review and editing, S.V., A.K.K., S.S., T.-W.C. and N.V.; visualization, S.V., A.K.K., S.S., T.-W.C. and N.V.; supervision, T.-W.C. and N.V.; project administration, T.-W.C. and N.V.; funding acquisition, T.-W.C. and N.V. All authors have read and agreed to the published version of the manuscript.

Funding

This research was funded by Taiwan’s Ministry of Science and Technology (NSTC 112-2221-E-027-039- and NSTC 112-2221-E-027-032) and the National Taipei University of Technology–King Mongkut’s Institute of Technology Ladkrabang Joint Research Program (NTUT-KMITL-113-01).

Data Availability Statement

Dataset available on request from the authors.

Acknowledgments

The authors appreciate the measuring capabilities provided by the Precision Research and Analysis Center of the National Taipei University of Technology (NTUT) Taiwan.

Conflicts of Interest

The authors declare no conflicts of interest.

References

  1. Sakthinathan, S.; Rajakumaran, R.; Keyan, A.K.; Yu, C.L.; Wu, C.F.; Vinothini, S.; Chen, S.M.; Chiu, T.W. Novel construction of carbon nanofiber/CuCrO2 composite for selective determination of 4-nitrophenol in environmental samples and for supercapacitor application. RSC Adv. 2021, 11, 15856. [Google Scholar] [CrossRef] [PubMed]
  2. Samy, M.M.; Mohamed, M.G.; Mahdy, A.F.M.E.; Mansoure, T.H.; Wu, K.C.W.; Kuo, S.W. High-performance supercapacitor electrodes prepared from dispersions of tetrabenzonaphthalene based conjugated microporous polymers and carbon nanotubes. ACS Appl. Mater. Interfaces 2021, 13, 51906–51916. [Google Scholar] [CrossRef]
  3. Nasiri, F.; Fotouhi, L.; Shahrokhian, S.; Zirak, M. Cobalt sulfide flower-like derived from metal organic frameworks on nickel foam as an electrode for fabrication of asymmetric supercapacitors. Sci. Rep. 2024, 14, 6045. [Google Scholar] [CrossRef]
  4. Kumar, S.; Saeed, G.; Zhu, L.; Hui, K.N.; Kim, N.H.; Lee, J.H. 0D to 3D carbon-based networks combined with pseudocapacitive electrode material for high energy density supercapacitor: A review. J. Chem. Eng. 2021, 403, 126352. [Google Scholar] [CrossRef]
  5. Wang, Y.; Zhang, L.; Hou, H.; Xu, W.; Duan, G.; He, S.; Liu, K.; Jiang, S. Recent progress in carbon based materials for supercapacitor electrodes: A review. J. Mater. Sci. 2021, 56, 173–200. [Google Scholar] [CrossRef]
  6. Young, C.; Park, T.; Yi, J.W.; Kim, J.; Hossain, M.S.A.; Kaneti, Y.V.; Yamauchi, Y. Advanced functional carbons and their hybrid nanoarchitectures towards supercapacitor applications. ChemSusChem 2018, 11, 3546–3558. [Google Scholar] [CrossRef]
  7. Lim, J.M.; Jang, Y.S.; Nguyen, H.V.T.; Kim, J.S.; Yoon, Y.; Park, B.J.; Seo, D.H.; Lee, K.K.; Han, Z.; Ostrikov, K.; et al. Advances in high-voltage supercapacitors for energy storage systems: Materials and electrolyte tailoring to implementation. Nanoscale Adv. 2023, 5, 615–626. [Google Scholar] [CrossRef] [PubMed]
  8. Han, Z.; Fang, R.; Chu, D.; Wanga, D.W.; Ostrikovd, K. Introduction to supercapacitors. Nanoscale Adv. 2023, 5, 4015–4017. [Google Scholar] [CrossRef] [PubMed]
  9. Veeramani, V.; Madhu, R.; Chen, S.M.; Sivakumar, M. Flower like nickel cobalt oxide decorated dopamine-derived carbon nanocomposite for high-performance supercapacitor applications. ACS Sustain. Chem. Eng. 2016, 4, 5013–5020. [Google Scholar] [CrossRef]
  10. Veeramani, V.; Madhu, R.; Chen, S.M.; Sivakumar, M.; Hung, C.T.; Miyamoto, N.; Liu, S.B. NiCo2O4 decorated porous carbon nanosheets for high-performance supercapacitors. Electrochim. Acta 2017, 247, 288–295. [Google Scholar] [CrossRef]
  11. Veeramani, V.; Sivakumar, M.; Chen, S.M.; Madhu, R.; Alamri, H.R.; Alothman, Z.A.; Hossain, M.S.A.; Chen, C.K.; Yamauchi, Y.; Miyamoto, N.; et al. Lignocellulosic biomass-derived, graphene sheetlike porous activated carbon for electrochemical supercapacitor and catechin sensing. RSC Adv. 2017, 7, 45668–45675. [Google Scholar] [CrossRef]
  12. Xu, G.; Han, J.; Ding, B.; Nie, P.; Pan, J.; Dou, H.; Li, H.; Zhang, X. Biomass-derived porous carbon materials with sulfur and nitrogen dual-doping for energy storage. Green Chem. 2015, 17, 1668–1674. [Google Scholar] [CrossRef]
  13. Madhu, R.; Veeramani, V.; Chen, S.M.; Veerakumar, P.; Liu, S.B. Functional porous carbon/nickel oxide nanocomposites as binder-free electrodes for supercapacitors. Chem. Eur. J. 2015, 21, 8200–8206. [Google Scholar] [CrossRef] [PubMed]
  14. Liang, Q.; Ye, L.; Huang, Z.H.; Xu, Q.; Bai, Y.; Kang, F.; Yang, Q.H. A honeycomb-like porous carbon derived from pomelo peel for use in high-performance supercapacitors. Nanoscale 2014, 6, 13831–13837. [Google Scholar] [CrossRef] [PubMed]
  15. Xu, J.; Cai, X.; Cai, S.; Shao, Y.; Hu, C.; Lu, S.; Ding, S. High energy lithium-ion batteries: Recent progress and a promising future in applications. Energy Environ. Mater. 2023, 6, e12450. [Google Scholar] [CrossRef]
  16. Liu, W.; Placke, T.; Chau, K.T. Overview of batteries and battery management for electric vehicles. Energy Rep. 2022, 8, 4058–4084. [Google Scholar] [CrossRef]
  17. Zhang, J.; Gu, M.; Chen, X. Supercapacitors for renewable energy applications: A review. Micro Nano Eng. 2023, 21, 100229. [Google Scholar] [CrossRef]
  18. Gupta, H.; Kumar, M.; Sarkar, D.; Menezes, P.W. Recent technological advances in designing electrodes and electrolytes for efficient zinc ion hybrid supercapacitors. Energy Adv. 2023, 2, 1263–1293. [Google Scholar] [CrossRef]
  19. Islam, M.S.; Hoque, S.M.; Rahaman, M.; Islam, M.R.; Irfan, A.; Sharif, A. Superior cyclic stability and capacitive performance of cation and water molecule pre intercalated δ-MnO2/h-WO3 nanostructures as supercapacitor electrodes. ACS Omega 2024, 9, 10680–10693. [Google Scholar] [CrossRef]
  20. Reddy, A.K.J.S.; Acharya, S.; Lakshmi, B.; Deepak, K.; Naveen, C.S.; Harishd, K.N.; Ramakrishna, S. A review on nanomaterial-based electrodes for the electrochemical detection of chloramphenicol and furazolidone antibiotics. Anal. Methods 2022, 14, 3228–3249. [Google Scholar]
  21. Xia, Y.M.; Zhang, W.; Li, M.Y.; Xia, M.; Zou, L.J.; Gao, W.W. Effective electrochemical determination of chloramphenicol and florfenicol based on graphene/copper phthalocyanine nanocomposites modified glassy carbon electrode. J. Electrochem. Soc. 2019, 166, B654–B663. [Google Scholar] [CrossRef]
  22. Peng, Y.; Li, M.; Jia, X.; Su, J.; Zhao, X.; Zhang, S.; Zhang, H.; Zhou, X.; Chen, J.; Huang, Y.; et al. Cu nanoparticle-decorated boron carbon nitrogen nanosheets for electrochemical determination of chloramphenicol. ACS Appl. Mater. Interfaces 2022, 14, 28956–28964. [Google Scholar] [CrossRef] [PubMed]
  23. Kaewnu, K.; Promsuwan, K.; Kanatharana, P.; Thavarungkul, P.; Limbut, W. A simple and sensitive electrochemical sensor for chloramphenicol detection in pharmaceutical samples. J. Electrochem. Soc. 2020, 167, 087506. [Google Scholar] [CrossRef]
  24. Chuanuwatanakul, S.; Chailapakul, O.; Motomizu, S. Electrochemical analysis of chloramphenicol using boron-doped diamond electrode applied to a flow-injection system. Anal. Sci. 2008, 24, 493–498. [Google Scholar] [CrossRef] [PubMed]
  25. Sakthinathan, S.; Kubendhiran, S.; Chen, S.M.; Karuppiah, C.; Chiu, T.W. Novel bifunctional electrocatalyst for ORR activity and methyl parathion detection based on reduced graphene oxide/palladium tetraphenyl porphyrin nanocomposite. Phys. Chem. C 2017, 121, 14096–14107. [Google Scholar] [CrossRef]
  26. Sakthinathan, S.; Keyan, A.K.; Vasu, D.; Vinothini, S.; Nagaraj, K.; Mangesh, V.L.; Chiu, T.W. Graphitic carbon nitride incorporated europium molybdate composite as an enhanced sensing platform for electrochemical detection of carbendazim in agricultural products. J. Electrochem. Soc. 2022, 169, 127504. [Google Scholar] [CrossRef]
  27. Chand, P.; Vaish, S.; Kumar, P. Structural, optical and dielectric properties of transition metal (MFe2O4; M = Co, Ni and Zn) nanoferrites. Phys. B Condens. Matter 2017, 524, 53–63. [Google Scholar] [CrossRef]
  28. Bhujun, B.; Tan, M.T.T.; Shanmugam, A.S. Study of mixed ternary transition metal ferrites as potential electrodes for supercapacitor applications. Results Phys. 2017, 7, 345–353. [Google Scholar] [CrossRef]
  29. Sharif, S.; Rahimi, K.; Yazdani, A. Highly improved supercapacitance properties of MnFe2O4 nanoparticles by MoS2 nanosheets. Sci. Rep. 2021, 11, 8378. [Google Scholar] [CrossRef]
  30. Kiey, S.A.A.; Ramadan, R.; Masry, M.M.E. Synthesis and characterization of mixed ternary transition metal ferrite nanoparticles comprising cobalt, copper and binary cobalt-copper for high-performance supercapacitor applications. Appl. Phys. A 2022, 128, 473. [Google Scholar] [CrossRef]
  31. Wang, L.; Bock, D.C.; Li, J.; Stach, E.A.; Marschilok, A.C.; Takeuchi, K.J.; Takeuchi, E.S. Synthesis and characterization of CuFe2O4 nano/submicron wire carbon nanotube composites as binder-free anodes for Li-ion batteries. ACS Appl. Mater. Interfaces 2018, 10, 8770–8785. [Google Scholar] [CrossRef] [PubMed]
  32. Zhao, C.; Lan, W.; Gong, H.; Bai, J.; Ramachandran, R.; Liu, S.; Wang, F. Highly sensitive acetone-sensing properties of Pt-decorated CuFe2O4 nanotubes prepared by electrospinning. Ceram. Int. 2018, 44, 2856–2863. [Google Scholar] [CrossRef]
  33. Peng, S.; Li, L.; Srinivasan, M. Electrospun CuFe2O4 nanotubes as anodes for high-performance lithium-ion batteries. J. Energy Chem. 2014, 23, 301–307. [Google Scholar] [CrossRef]
  34. Liu, H.; Zheng, Z.; Chen, B.; Liao, L.; Wang, X. Cobalt oxide porous nanofibers directly grown on conductive substrate as a binder/additive-free lithium-ion battery anode with high capacity. Nanoscale Res. Lett. 2017, 12, 302. [Google Scholar] [CrossRef] [PubMed]
  35. Kanwade, A.; Gupta, S.; Kankane, A.; Tiwari, M.K.; Srivastava, A.; Kumar, J.A.; Subhash, S.; Yadav, C.; Shirage, P.M. Transition metal oxides as a cathode for indispensable Na-ion batteries. RSC Adv. 2022, 12, 23284–23310. [Google Scholar] [CrossRef] [PubMed]
  36. Huang, J.; Guan, X.; Xu, B.; Gong, J.; Gao, Y.; Li, M. Surface porous microstructured fibers with customized functionalities for 1D functional materials. Compos. Part. B. Eng. 2021, 223, 109112. [Google Scholar] [CrossRef]
  37. Israr, M.; Iqbal, J.; Arshad, A.; Sadaf, A.; Rani, M.; Rani, M.; Jabeen, S. CuFe2O4/GNPs nanocomposites for symmetric supercapacitors and photocatalytic applications. J. Phys. D Appl. Phys. 2021, 54, 395501. [Google Scholar] [CrossRef]
  38. Atacan, K. CuFe2O4/reduced graphene oxide nanocomposite decorated with gold nanoparticles as a new electrochemical sensor material for ʟ-cysteine detection. J. Alloys Compd. 2019, 791, 391–401. [Google Scholar] [CrossRef]
  39. Yang, H.; Shi, X.; Pan, X.; Lin, S.; Zhang, X.; Du, Y.; Liu, J.; Fan, D.; Wang, Y.; Lei, M. Defect locating: One-step to monodispersed CoFe2O4/rGO nanoparticles for oxygen reduction and oxygen evolution. Int. J. Hydrogen Energy 2017, 42, 17075–17083. [Google Scholar] [CrossRef]
  40. Battad, G.A.T.; Estacio, J.G.; Indiongco, J.L.C.; Mopon, M.L., Jr. Development of a CuFe2O4 Reduced Graphene Oxide-Based Electrochemical Sensor for Malathion. Key Eng. Mater. 2020, 841, 41–47. [Google Scholar] [CrossRef]
  41. Baghayeri, M.; Amiri, A.; Fayazi, M.; Nodehi, M.; Esmaeelnia, A. Electrochemical detection of bisphenol a on a MWCNTs/CuFe2O4 nanocomposite modified glassy carbon electrode. Mater. Chem. Phys. 2021, 261, 124247. [Google Scholar] [CrossRef]
  42. Tajik, S.; Askari, M.B.; Ahmadi, S.A.; Nejad, F.G.; Dourandish, Z.; Razavi, R.; Beitollahi, H.; Bartolomeo, A.D. Electrochemical Sensor Based on ZnFe2O4/RGO Nanocomposite for Ultrasensitive Detection of Hydrazine in Real Samples. Nanomaterials 2022, 12, 491. [Google Scholar] [CrossRef] [PubMed]
  43. Bharath, G.; Hai, A.; Kiruthiga, T.; Rambabu, K.; Sabri, M.A.; Park, J.; Choi, M.Y.; Banat, F.; Haija, M.A. Fabrication of Ru–CoFe2O4/RGO hierarchical nanostructures for high-performance photoelectrodes to reduce hazards Cr(VI) into Cr(III) coupled with anodic oxidation of phenols. Chemosphere 2022, 299, 134439. [Google Scholar] [CrossRef] [PubMed]
  44. Khan, R.; Habib, M.; Gondal, M.A.; Khalil, A.; Rehman, Z.U.; Muhammad, Z.; Haleem, Y.A.; Wang, C.; Wu, C.Q.; Song, L. Facile synthesis of CuFe2O4–Fe2O3 composite for high-performance supercapacitor electrode applications. Mater. Res. Express 2017, 4, 105501. [Google Scholar] [CrossRef]
  45. Tajik, S.; Beitollahi, H. Hydrothermal synthesis of CuFe2O4 nanoparticles for highly sensitive electrochemical detection of sunset yellow. Food Chem. Toxicol. 2022, 165, 113048. [Google Scholar] [CrossRef] [PubMed]
  46. Liang, W.; Yang, W.; Sakib, S.; Zhitomirsky, I. Magnetic CuFe2O4 Nanoparticles with Pseudocapacitive Properties for Electrical Energy Storage. Molecules 2022, 27, 5313. [Google Scholar] [CrossRef] [PubMed]
  47. Bhangoji, J.C.; Kahandal, S.S.; Patil, R.S.; Lambat, T.L.; Khan, S.I.; Wadhava, G.; Mahmood, S.H.; Shendage, S.S. One Pot Synthesis of CuO-CuFe2O4@rGO Nanostructure with Synergistic Effect for Efficient Electrochemical Sensing Application of Paracetamol. ECS Adv. 2023, 2, 026503. [Google Scholar] [CrossRef]
  48. Mahdikhah, V.; Saadatkia, S.; Sheibani, S.; Ataie, A. Outstanding photocatalytic activity of CoFe2O4/rGO nanocomposite in degradation of organic dyes. Opt. Mater. 2020, 108, 110193. [Google Scholar] [CrossRef]
  49. Zhang, Y.; Cheng, Y.; Qi, H. Synergistic degradation of organic pollutants on CoFe2O4/rGO nanocomposites by peroxymonosulfate activation under LED irradiation. Appl. Surf. Sci. 2022, 579, 1521510. [Google Scholar] [CrossRef]
  50. Shi, F.; Shan, H.; Li, D.; Yin, X.; Yu, J.; Ding, B. A general strategy to fabricate soft magnetic CuFe2O4@SiO2 nanofibrous membranes as efficient and recyclable fenton-like catalysts. J. Colloid Interface Sci. 2019, 538, 620–629. [Google Scholar]
  51. Lin, L.; Cui, H.; Zeng, G.; Chen, M.; Zhang, H.; Xu, M.; Shen, X.; Bortolini, C.; Dong, M. Ag–CuFe2O4 magnetic hollow fibers for recyclable antibacterial materials. J. Mater. Chem. B 2013, 1, 2719–2723. [Google Scholar] [CrossRef] [PubMed]
  52. Zhao, J.; Cheng, Y.; Yan, X.; Sun, D.; Zhu, F.; Xue, Q. Magnetic and electrochemical properties of CuFe2O4 hollow fibers fabricated by simple electrospinning and direct annealing. Cryst. Eng. Comm. 2012, 14, 5879–5885. [Google Scholar] [CrossRef]
  53. Qiao, H.; Luo, L.; Chen, K.; Fei, Y.; Cui, R.; Wei, Q. Electrospun synthesis and lithium storage properties of magnesium ferrite nanofibers. Electrochim. Acta 2015, 160, 43–49. [Google Scholar] [CrossRef]
  54. Han, D.; Steckl, A.J. Coaxial electrospinning formation of complex polymer fibers and their applications. Chem. Plus Chem. 2019, 84, 1453–1497. [Google Scholar] [CrossRef] [PubMed]
  55. Wang, C.; Wang, J.; Zeng, L.; Qiao, Z.; Liu, X.; Liu, H.; Zhang, J.; Ding, J. Fabrication of electrospun polymer nanofibers with diverse morphologies. Molecules 2019, 24, 834. [Google Scholar] [CrossRef] [PubMed]
  56. Hsu, K.C.; Keyan, A.K.; Hung, C.W.; Sakthinathan, S.; Yu, C.L.; Chiu, T.W.; Nagaraj, K.; Fan, F.Y.; Shan, Y.K.; Chen, P.C. Fabrication of CuYO2 nanofibers by electrospinning and applied to hydrogen harvest. Materials 2022, 15, 8957. [Google Scholar] [CrossRef] [PubMed]
  57. Su, S.Y.; Wang, S.S.; Sakthinathan, S.; Chiu, T.W.; Park, J.H. Preparation of CuAl2O4 submicron tubes from electrospun Al2O3 fibers. Ceram. Int. 2019, 45, 1439–1442. [Google Scholar] [CrossRef]
  58. Dastgeer, G.; Nisar, S.; Rasheed, A.; Akbar, K.; Chavan, V.D.; Kim, D.K.; Wabaidur, S.M.; Zulfiqar, M.W.; Eom, J. Atomically engineered, high-speed non-volatile flash memory device exhibiting multibit data storage operations. Nano Energy 2024, 119, 109106. [Google Scholar] [CrossRef]
  59. Xu, Y.; Lin, Z.; Huang, X.; Liu, Y.; Huang, Y.; Duan, X. Flexible solid-state supercapacitors based on three-dimensional graphene hydrogel films. ACS Nano 2013, 7, 4042–4049. [Google Scholar] [CrossRef]
  60. Cao, X.; Yin, Z.; Zhang, H. Three-dimensional graphene materials: Preparation, structures, and application in supercapacitors. Energy Environ. Sci. 2014, 7, 1850–1865. [Google Scholar] [CrossRef]
  61. Yang, M.; Lee, K.G.; Lee, S.J.; Lee, S.B.; Han, Y.K.; Choi, B.G. Three-dimensional expanded graphene-metal oxide film via solid state microwave irradiation for aqueous asymmetric supercapacitors. ACS Appl. Mater. Interfaces 2015, 7, 22364–22371. [Google Scholar] [CrossRef] [PubMed]
  62. Hu, J.; Kang, Z.; Li, F.; Huang, X. Graphene with three-dimensional architecture for high-performance supercapacitor. Carbon 2014, 67, 221–229. [Google Scholar] [CrossRef]
  63. Li, C.; Zhang, X.; Wang, K.; Zhang, H.T.; Sun, X.Z.; Ma, Y.W. Three-dimensional graphene networks for supercapacitor electrode materials. New Carbon Mater. 2015, 30, 193–206. [Google Scholar] [CrossRef]
  64. Zaka, A.; Hayat, K.; Hayat, K.; Hayat, K.; Mittal, V. Recent trends in the use of three-dimensional graphene structures for supercapacitors. ACS Appl. Electron. Mater. 2021, 3, 574–596. [Google Scholar] [CrossRef]
  65. Xu, Y.; Shi, G.; Duan, X. Self-assembled three-dimensional graphene macrostructures: Synthesis and applications in supercapacitors. Acc. Chem. Res. 2015, 48, 1666–1675. [Google Scholar] [CrossRef]
  66. Niu, Z.; Zhang, Y.; Zhang, Y.; Lu, X.; Liu, J. Enhanced electrochemical performance of three-dimensional graphene/carbon nanotube composite for supercapacitor application. J. Alloys Compd. 2020, 820, 153114. [Google Scholar] [CrossRef]
  67. Singh, K.; Kumar, S.; Agarwal, K.; Soni, K.; Gedela, V.R.; Ghosh, K. Three-dimensional graphene with MoS2 nanohybrid as potential energy storage/transfer device. Sci. Rep. 2017, 7, 9458. [Google Scholar] [CrossRef]
  68. Rania, B.; Sahua, N.K. Electrochemical properties of CoFe2O4 nanoparticles and its rGO composite for supercapacitor. Diam. Relat. Mater. 2020, 108, 107978. [Google Scholar] [CrossRef]
  69. Yin, J.; Ouyang, H.; Li, W.; Long, Y. An Effective Electrochemical platform for chloramphenicol detection based on carbon doped boron nitride nanosheets. Biosensors 2023, 13, 116. [Google Scholar] [CrossRef]
  70. Sebastian, N.; Yu, W.C.; Balram, D. Electrochemical detection of an antibiotic drug chloramphenicol based on a graphene oxide/hierarchical zinc oxide nanocomposite. Inorg. Chem. Front. 2019, 6, 82–93. [Google Scholar] [CrossRef]
  71. Yi, W.; Li, Z.; Dong, C.; Li, H.W.; Li, J. Electrochemical detection of chloramphenicol using palladium nanoparticles decorated reduced graphene oxide. Microchem. J. 2019, 148, 774–783. [Google Scholar] [CrossRef]
  72. Wang, W.; Sun, D. Electrochemical determination of chloramphenicol based on ZnO-NPs/SWCNTs composite modified glassy carbon electrode. Int. J. Electrochem. Sci. 2021, 16, 210216. [Google Scholar] [CrossRef]
  73. Hailu, T.; Li, Y.K.; Tessema, M. Electrochemical determination of chloramphenicol in milk and eye-drop using easily activated screen-printed carbon electrodes. Iran. J. Anal. Chem. 2021, 8, 93–101. [Google Scholar]
  74. Peng, R.; Chen, W.; Zhou, Q. Electrochemical sensor for chloramphenicol based on copper nano dendrites and carbon nanotubes. Ionics 2022, 28, 451–462. [Google Scholar] [CrossRef]
  75. Zhang, W.; Quan, B.; Lee, C.; Park, S.K.; Li, X.; Choi, E.; Diao, G.; Piao, Y. One-step facile solvothermal synthesis of copper ferrite–graphene composite as a high-performance supercapacitor material. ACS Appl. Mater. Interfaces 2015, 7, 2404–2414. [Google Scholar] [CrossRef] [PubMed]
  76. Guo, Y.; Chen, Y.; Hu, X.; Yao, Y.; Li, Z. Tween modified CuFe2O4 nanoparticles with enhanced supercapacitor performance. Colloids Surf. Physicochem. Eng. Asp. 2021, 631, 127676. [Google Scholar] [CrossRef]
  77. Saravanakumar, B.; Ramachandran, S.P.; Ravi, G.; Ganesh, V.; Guduru, R.K.; Yuvakkumar, R. Electrochemical Performances of Monodispersed Spherical CuFe2O4 Nanoparticles for Pseudocapacitive Applications. Vacuum 2019, 168, 108798. [Google Scholar] [CrossRef]
  78. Polat, S.; Faris, D. Fabrication of CuFe2O4@g-C3N4@GNPs Nanocomposites as Anode Material for Supercapacitor Applications. Ceram. Int. 2022, 48, 24609–24618. [Google Scholar] [CrossRef]
  79. Zhu, M.; Meng, D.; Wang, C.; Diao, G. Facile fabrication of hierarchically porous CuFe2O4 nanospheres with enhanced capacitance property. ACS Appl. Mater. Interfaces 2013, 5, 6030–6037. [Google Scholar] [CrossRef]
Scheme 1. Schematic representation of 3DGS/CuFe2O4 fiber composite preparation for supercapacitor and sensor application.
Inorganics 12 00164 sch001
Figure 1. XRD patterns of the as-prepared materials: 3DGS, CuFe2O4, and 3DGS/CuFe2O4 composite.
Inorganics 12 00164 g001
Figure 2. FESEM micrographs of the (AD) CuFe2O4 fibers, (E,F) 3DGS, (G,H) 3DGS/CuFe2O4. (I) EDX elemental mapping of overall 3DGS/CuFe2O4. Elemental mapping of (J) copper (Cu), (K) oxygen (O), (L) carbon (C), (M) iron (Fe), and (N) EDX spectra of 3DGS/CuFe2O4 composite.
Inorganics 12 00164 g002
Figure 3. TEM images of (A) CuFe2O4 fibers, (B) 3DGS, and (C,D) 3DGS/CuFe2O4 composite.
Inorganics 12 00164 g003
Figure 4. (A) Raman spectra of 3DGS, CuFe2O4 fiber, and 3DGS/CuFe2O4 composite. (B) Electrochemical impedance spectra studies of (a) GCE/3DGS, (b) GCE/CuFe2O4, and (c) GCE/3DGS/CuFe2O4 electrodes in 0.05 M phosphate buffer (pH 7) containing 5 mM [Fe(CN)6]4−/3− with 0.1 M KCl electrolyte solution.
Inorganics 12 00164 g004
Figure 5. (A) CVs of (a) 3DGS/NF, (b) CuFe2O4/NF, and (c) 3DGS/CuFe2O4/NF in 2 M KOH at a scan rate of 50 mVs−1. (B) Cyclic voltammograms of 3DGS/CuFe2O4/NF in 2 M KOH at various scan rates from 10 to 100 mVs−1. (C) Linear plot of peak current against the square root of scan rates.
Inorganics 12 00164 g005
Figure 6. (A) Galvanostatic charge–discharge curves of 3DGS/NF, CuFe2O4/NF, and 3DGS/CuFe2O4/NF in 2 M KOH at a current density of 2 Ag−1. (B) Bar diagram of the specific capacitance for different current densities of 3DGS/NF, CuFe2O4/NF, and 3DGS/CuFe2O4/NF. (C) GCD curves at 3DGS/CuFe2O4/NF electrode at 1–10 A.g−1 current densities. (D) Cycle stability at 3DGS/CuFe2O4/NF in 2 M KOH at 2.5 A.g−1. (Inset) A plot of specific capacitance vs. cycle numbers (inset cycle stability of 500 s).
Inorganics 12 00164 g006
Figure 7. (A). CV response of the bare (a) GCE, (b) GCE/3DGS, (c) GCE/CuFe2O4, and (d) GCE/3DGS/CuFe2O4 electrodes in the presence of 50 µM of CAP in PBS (pH 7) at a scan rate of 50 mVs−1, and (e) CV response of bare GCE and GCE/3DGS/CuFe2O4 electrodes without CAP in PBS (pH 7) at a scan rate of 50 mVs−1. (B) Peak current of the bare GCE, GCE/3DGS, GCE/CuFe2O4 fiber, and GCE/3DGS/CuFe2O4 electrode for CAP detection.
Inorganics 12 00164 g007
Scheme 2. Electrochemical detection mechanisms of CAP on the GCE/3DGS/CuFe2O4 electrode.
Inorganics 12 00164 sch002
Figure 8. (A) CV curve response of the GCE/3DGS/CuFe2O4 electrode for the different concentrations of 10–100 µM in the presence of CAP in PBS (pH 7) at a scan rate of 50 mVs−1. (B) Calibration plot for different concentrations of CAP. (C) CV response curves at different scan rates in the presence of 50 µM of CAP in PBS (pH 7). (D) Calibration plot for the square root of scan rates (5–300 mVs−1) vs. peak current.
Inorganics 12 00164 g008
Figure 9. (A). CV response of the GCE/3DGS/CuFe2O4 electrode in the presence of 50 µM of CAP in PBS (pH 3–11) at a scan rate of 50 mVs−1. (B). Correspondence to peak current at various pH levels. (C). Effects of pH on the CAP detection peak potential vs. pH.
Inorganics 12 00164 g009
Figure 10. (A) DPV response at different concentrations of CAP by the GCE/3DGS/CuFe2O4 electrode. (B) Calibration plot for different concentrations of CAP versus peak current.
Inorganics 12 00164 g010
Figure 11. (A) Repeatability study of the GCE/3DGS/CuFe2O4 electrode. (B) Bar diagram of different repeatability peak currents. (C) Reproducibility study of five different GCE/3DGS/CuFe2O4 electrodes. (D) Bar diagram of different repeatability peak currents in N2-purged PBS with 50 μM of CAP at a scan rate of 50 mVs−1.
Inorganics 12 00164 g011
Figure 12. (A) Storage stability results of the GCE/3DGS/CuFe2O4 electrode. (B) Cyclic stability results of five different GCE/3DGS/CuFe2O4 electrodes in N2-purged PBS with 50 μM of CAP at a scan rate of 50 mVs−1. Real sample analysis of CAP in (C) milk samples, (D) honey samples, and (E) eye drops samples by the GCE/3DGS/CuFe2O4 electrode in N2-purged PBS with CAP at a scan rate of 50 mVs−1.
Inorganics 12 00164 g012
Table 1. Comparison of the electrochemical sensor performances of different modified electrochemical sensors for the detection of CAP under different analytical conditions.
Modified ElectrodeLinear Range (µM)Detection Limit (µM)References
P(EBT)/GCE)0.01–4.03[23]
C-BN0.1–7000.035[69]
Cu−BCN/GCE0.01−1.122.41[22]
Gr/CuPc/GCE1–300.75[21]
GO/ZnO/GCE0.2–1240.01[70]
rGO/PdNPs/GCE0.050.05–1[71]
ZnO NPs/SWCNTs10–1400.03[72]
Activated SPCE0.05–1000.02[73]
CuNDs/MWCNTs/GCE0.15–12.09.84[74]
g-C3N4/EuMoO450–4000.4[24]
GCE/3DGS/CuFe2O4 5–400 µM 0.5This work
Table 2. Real sample analysis of CAP in milk, honey, and eye drop samples.
SampleAdded (µM)Found (µM)Recovery (µM)RSD (%)
Milk2019.2962.52
4035.6892.15
6058.797.82.19
Honey2019.597.52.25
4039.598.71.95
6059.899.62.36
Eye drop2019.8992.42
4039.398.21.93
6058.697.62.12
Disclaimer/Publisher’s Note: The statements, opinions and data contained in all publications are solely those of the individual author(s) and contributor(s) and not of MDPI and/or the editor(s). MDPI and/or the editor(s) disclaim responsibility for any injury to people or property resulting from any ideas, methods, instructions or products referred to in the content.

