
Cost Optimization of Graphene Oxide-Modified Ultra-High-Performance Concrete Based on Machine Learning Methods

Abstract
:
1. Introduction
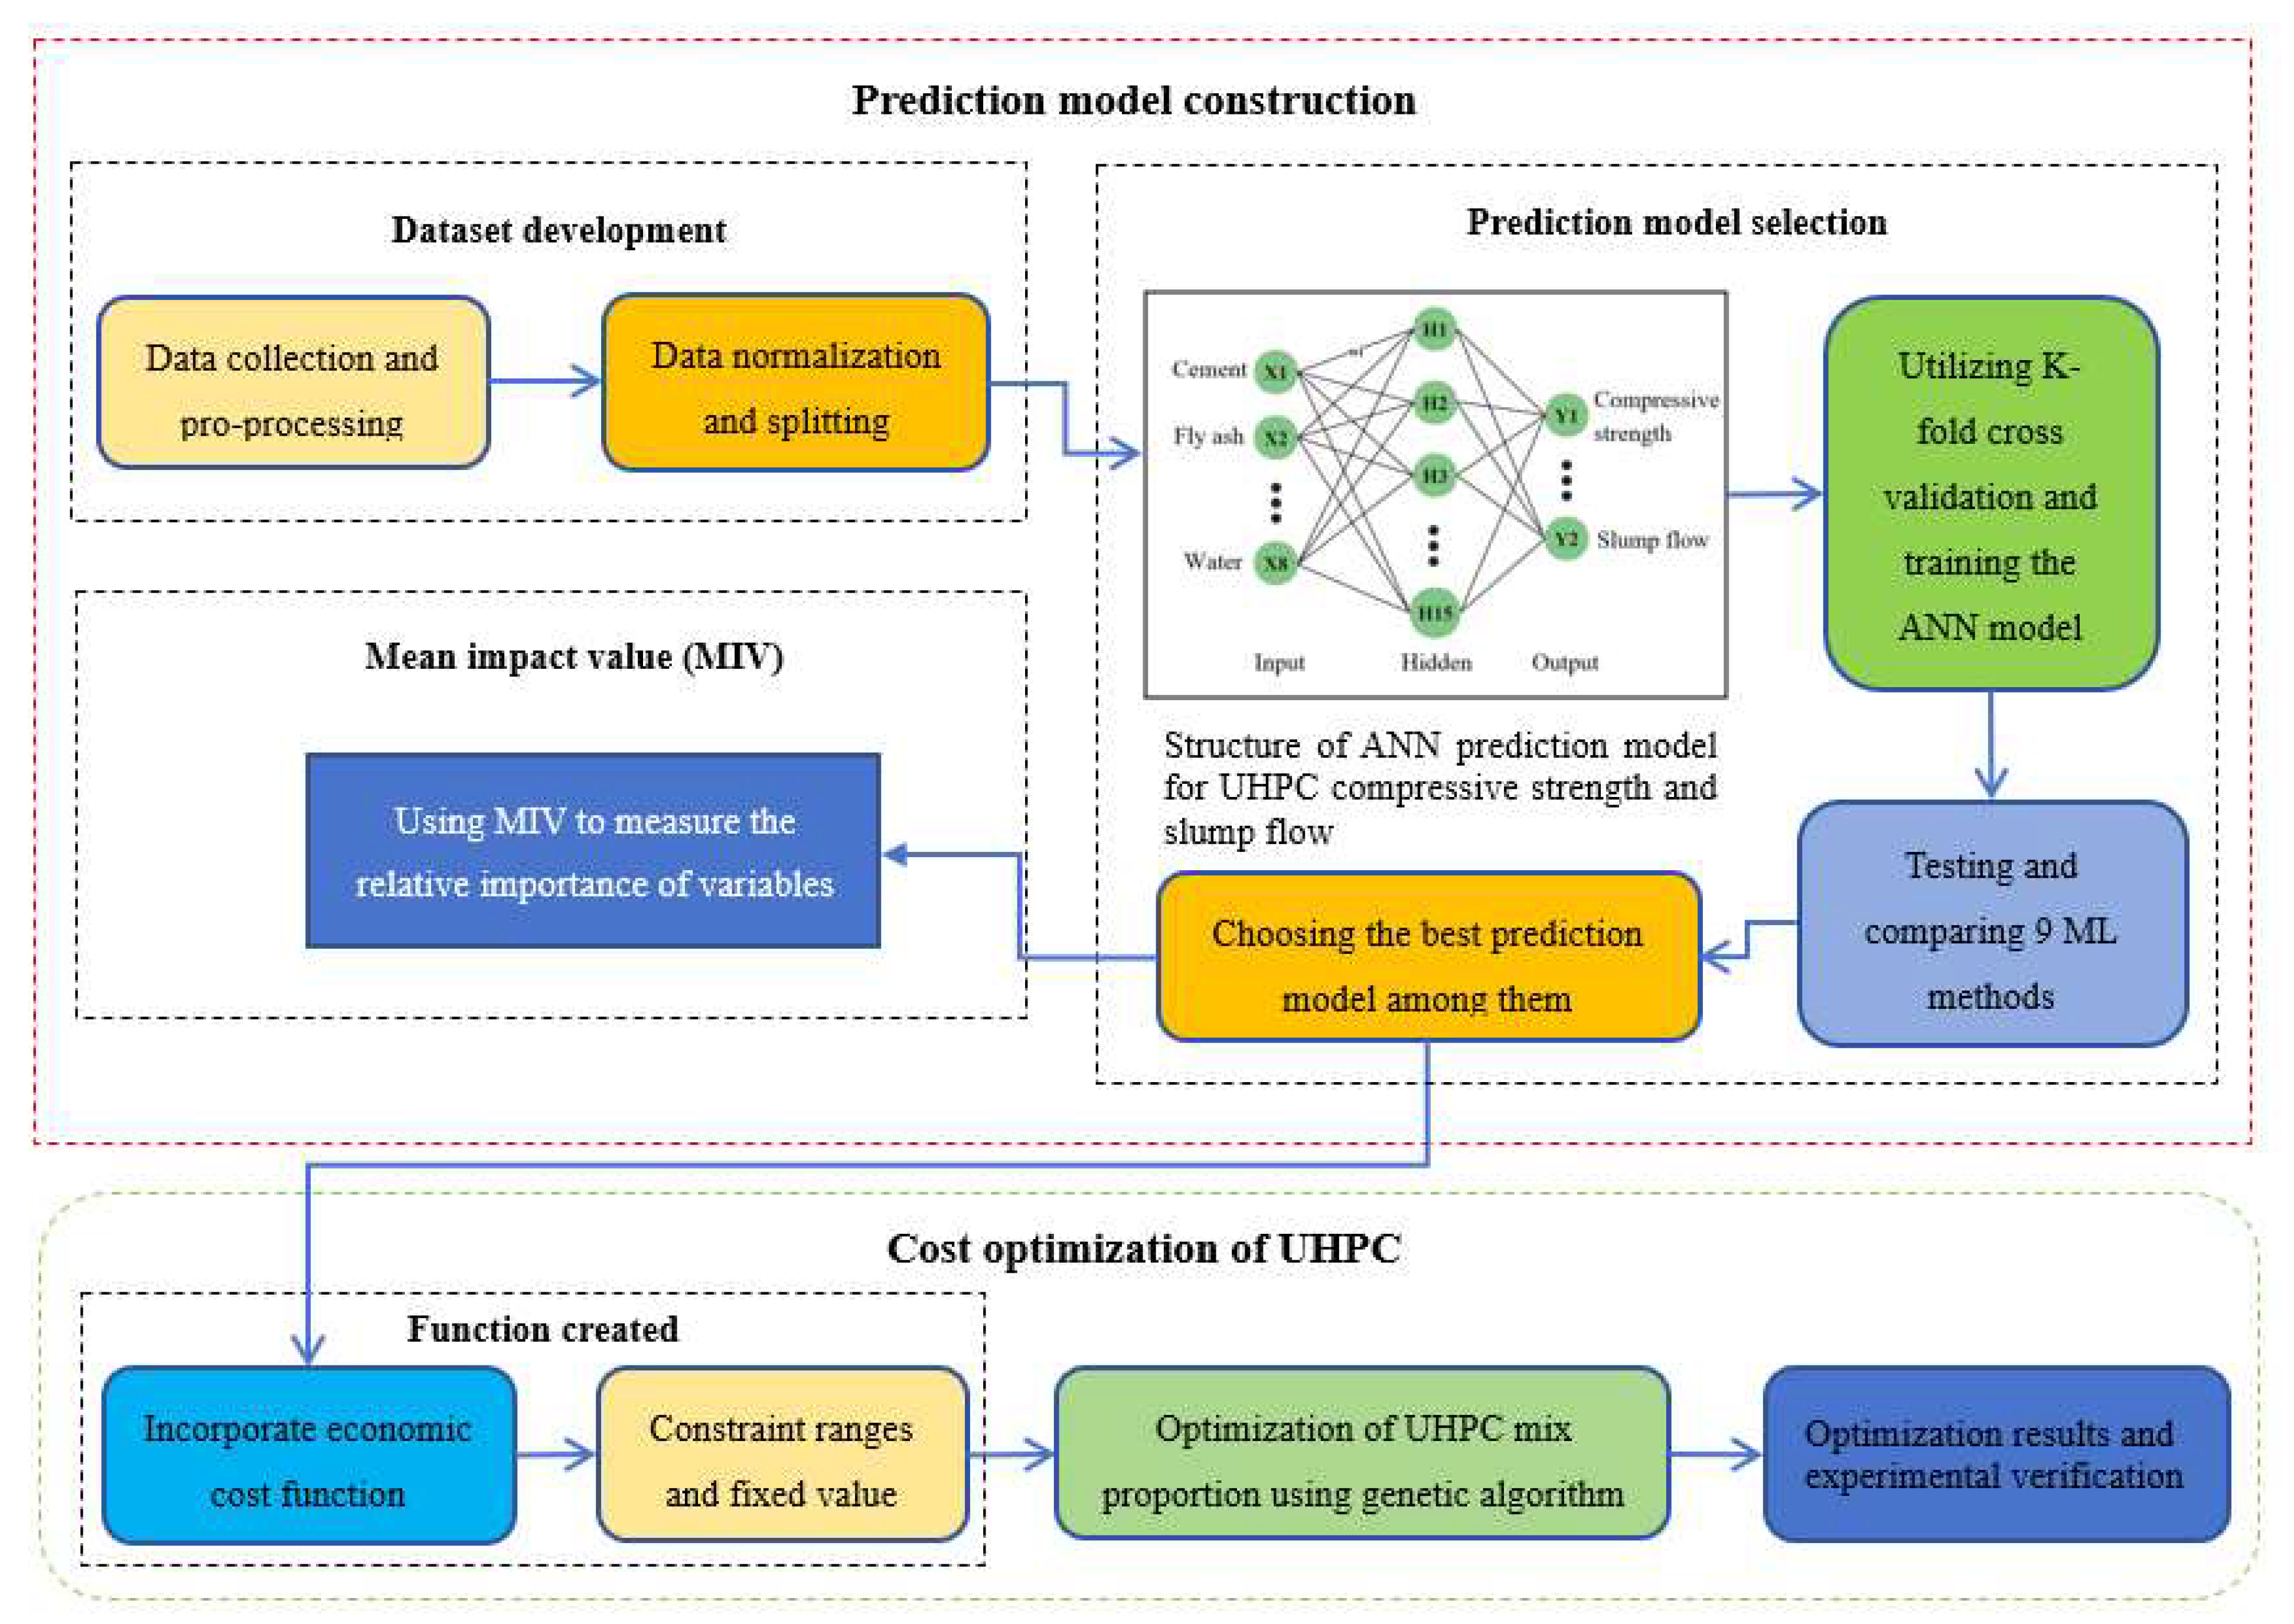
2. Modeling Methods
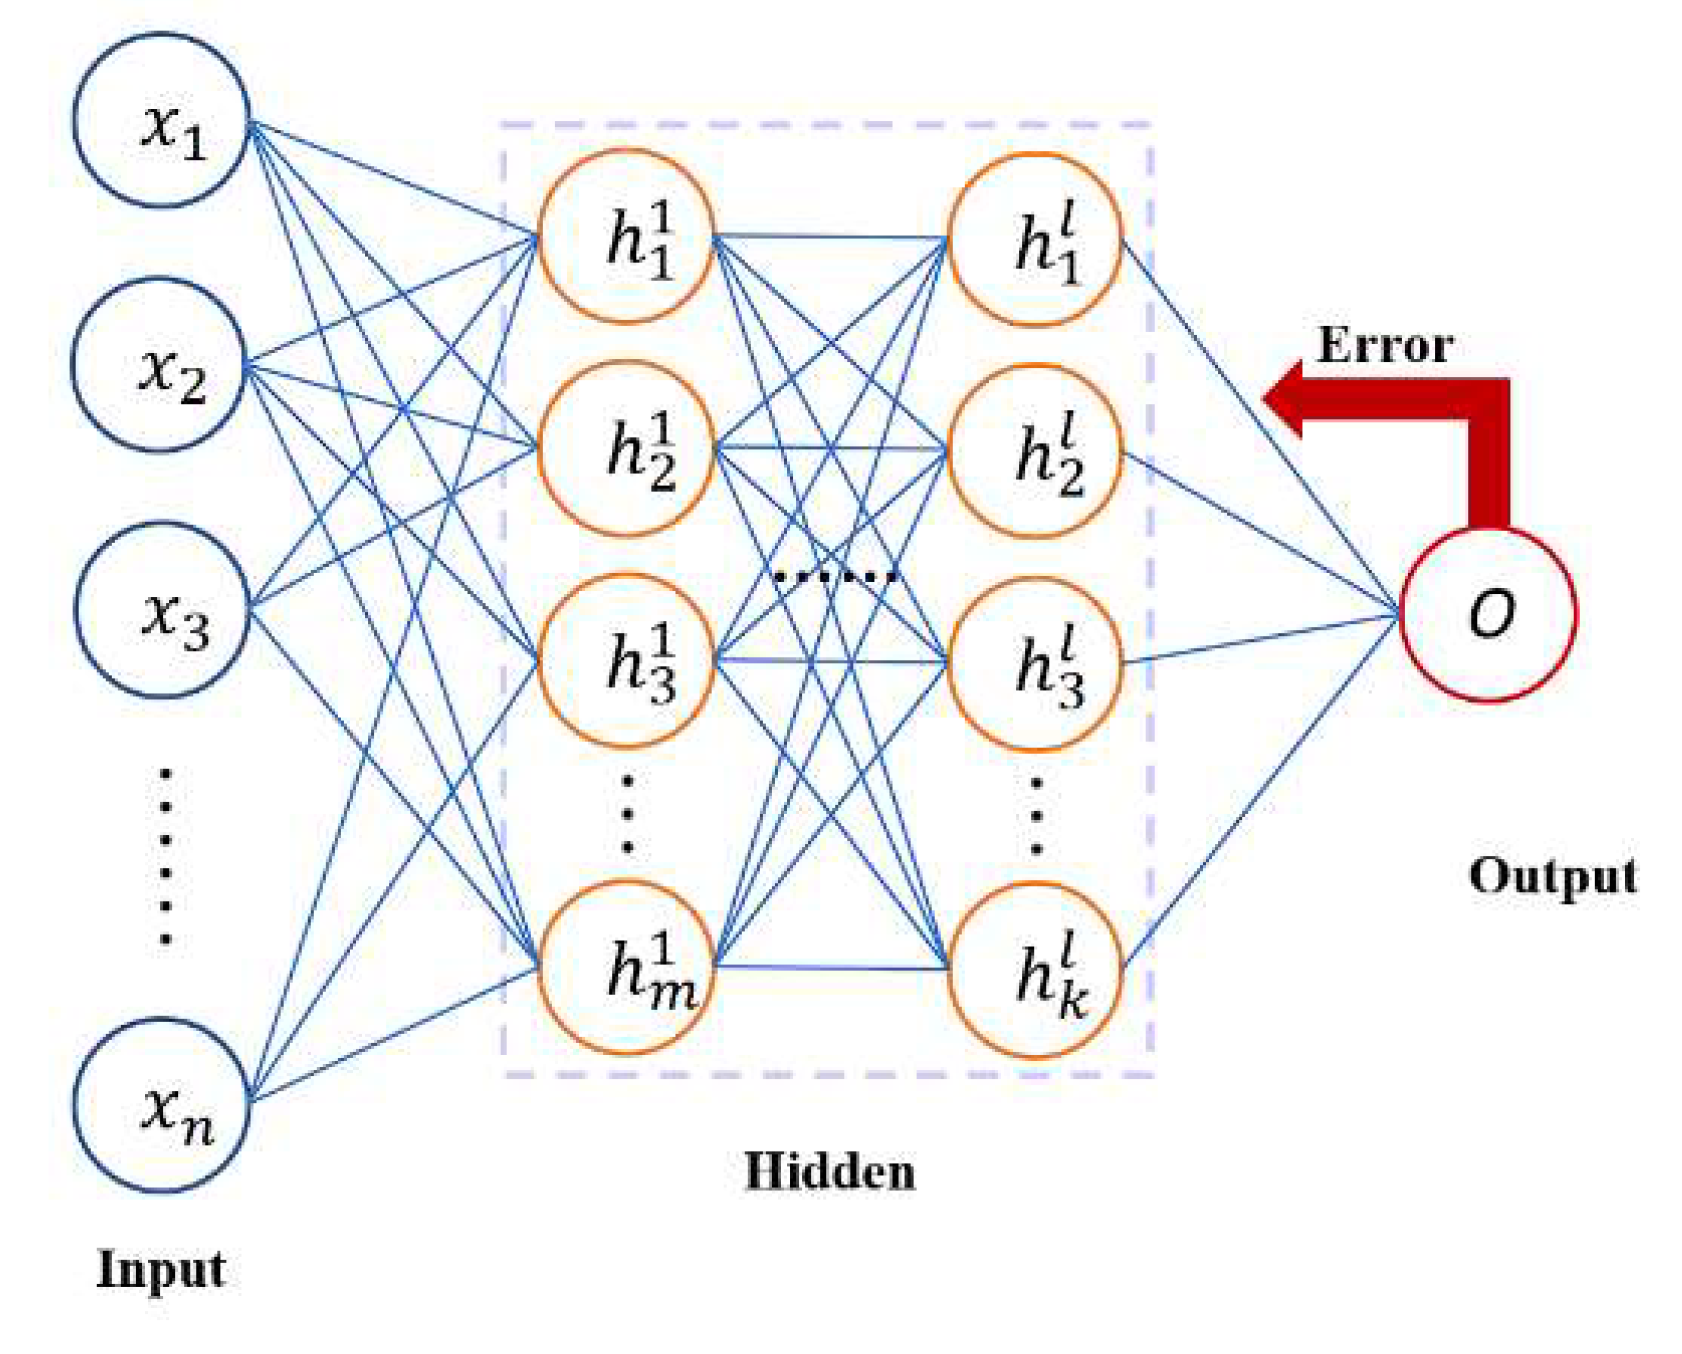
2.1. Artificial Neural Network
2.2. Genetic Algorithm
2.3. K-Fold Cross-Validation
2.4. Mean Impact Value
3. Raw Materials and Experiments
3.1. Raw Materials
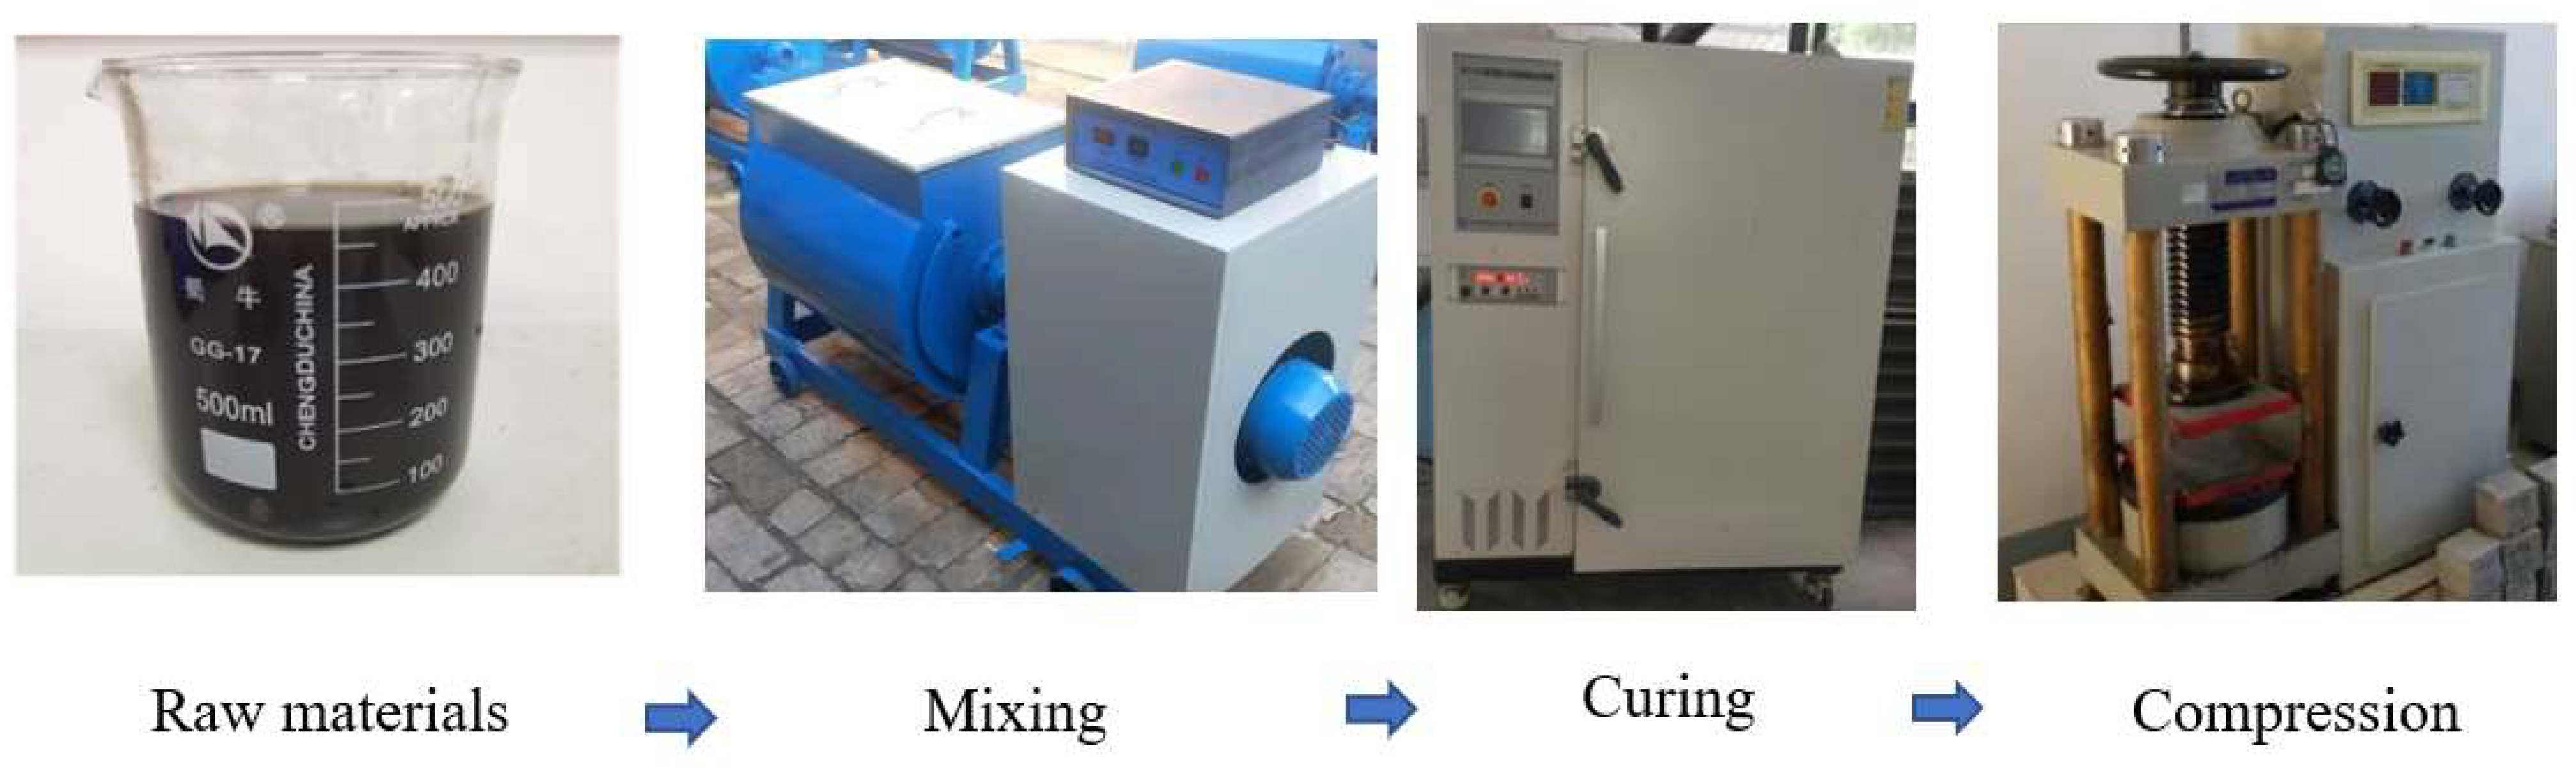
3.2. The Preparation and Testing of UHPC
4. Modeling Based on Machine Learning
4.1. Set Up the Database
4.1.1. Data Sources
4.1.2. Data Normalization Processing
4.2. The Prediction Model
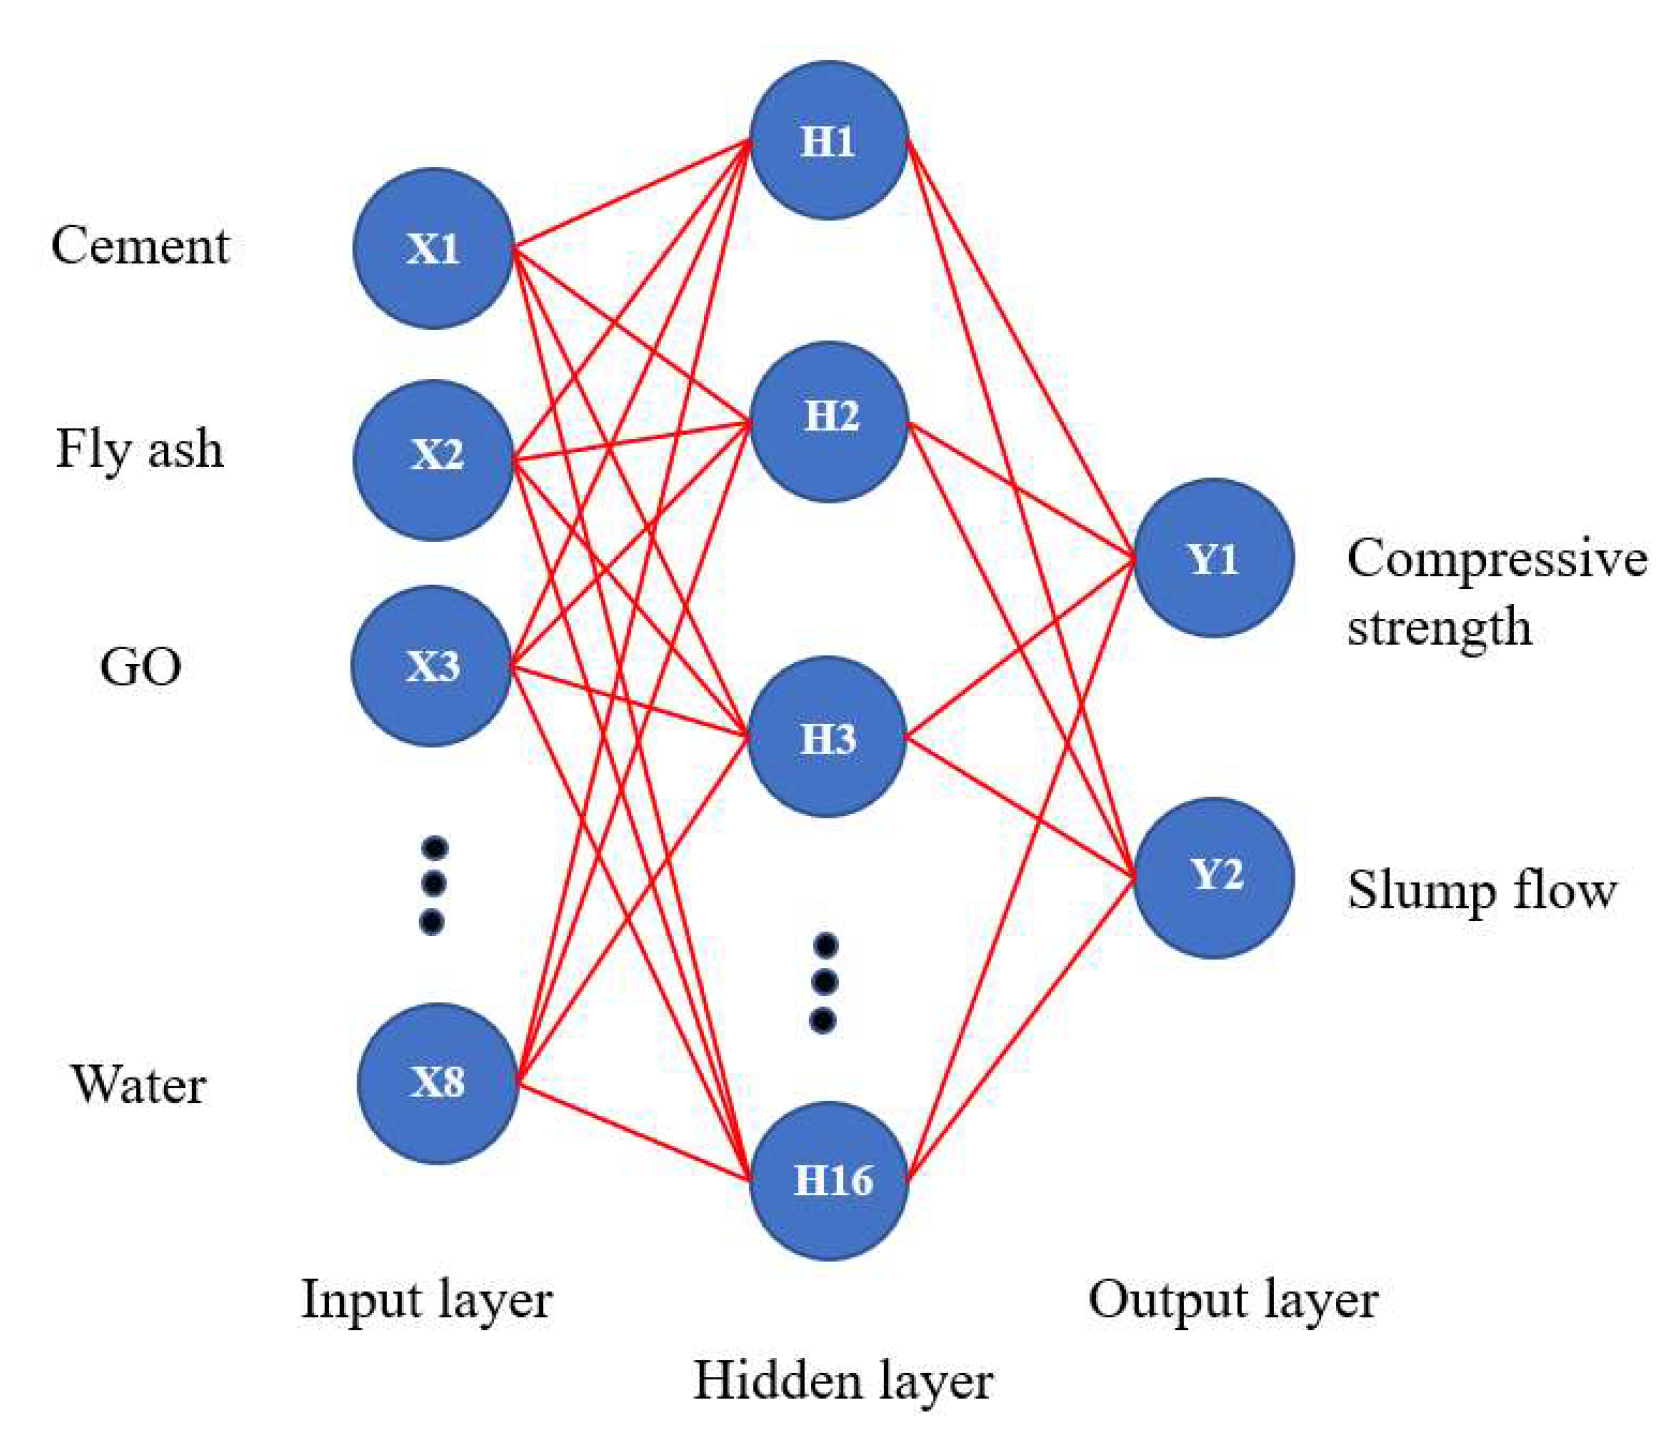
4.2.1. Determination of ANN Model Structure
4.2.2. Training of ANN Model
4.2.3. Comparison of ML Algorithms
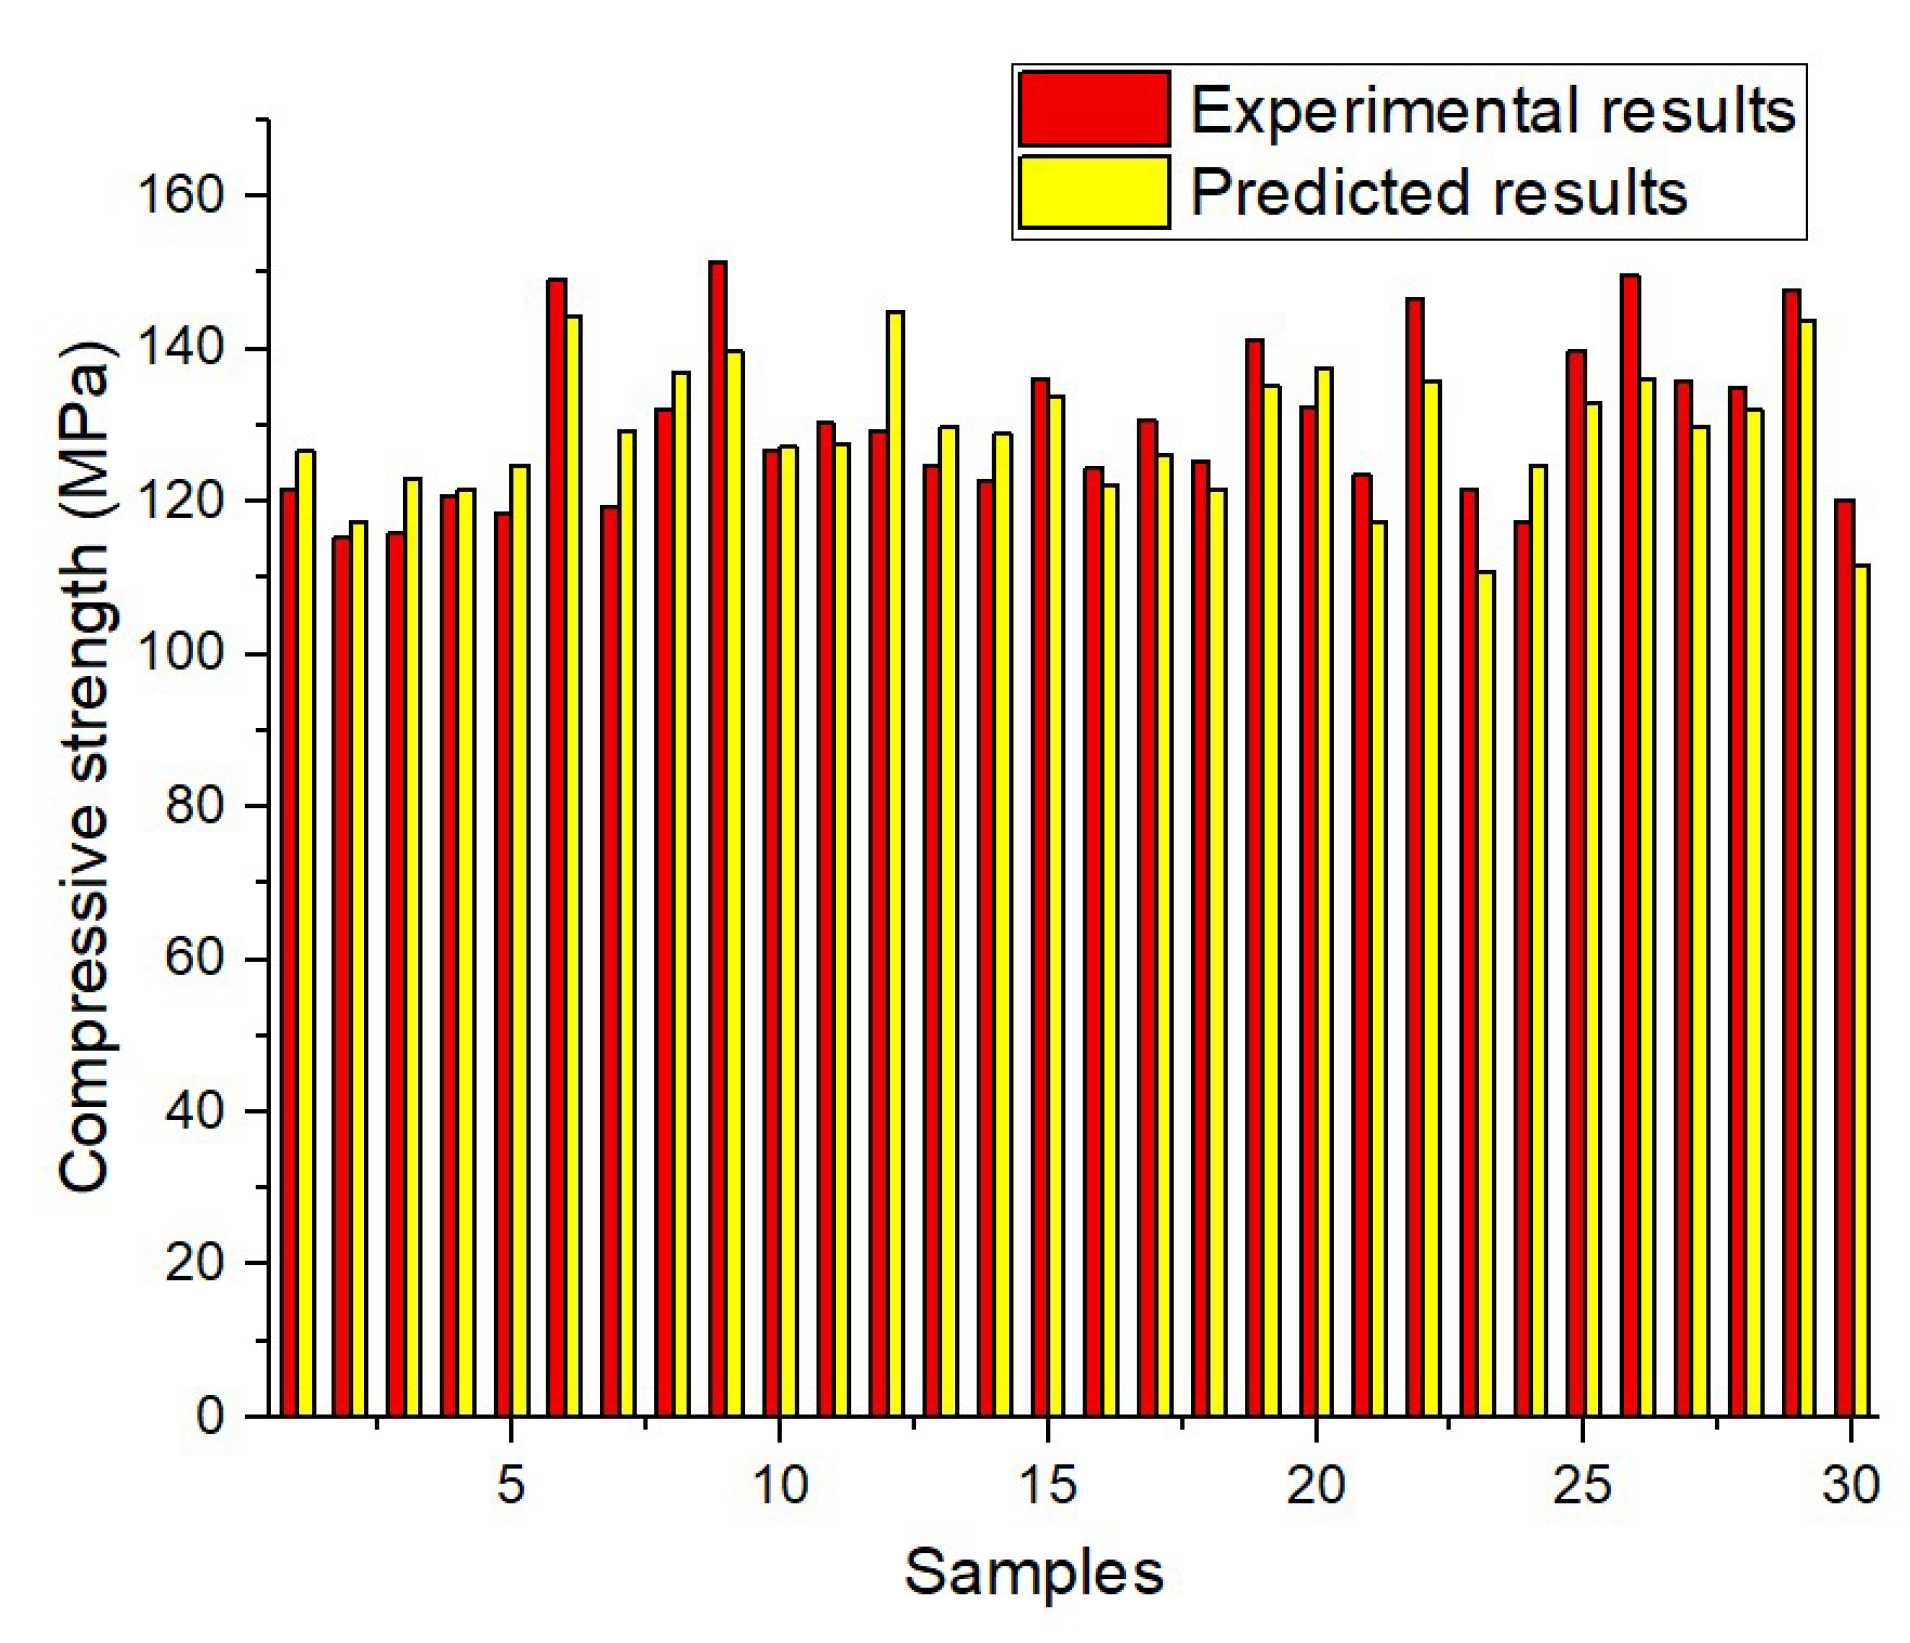
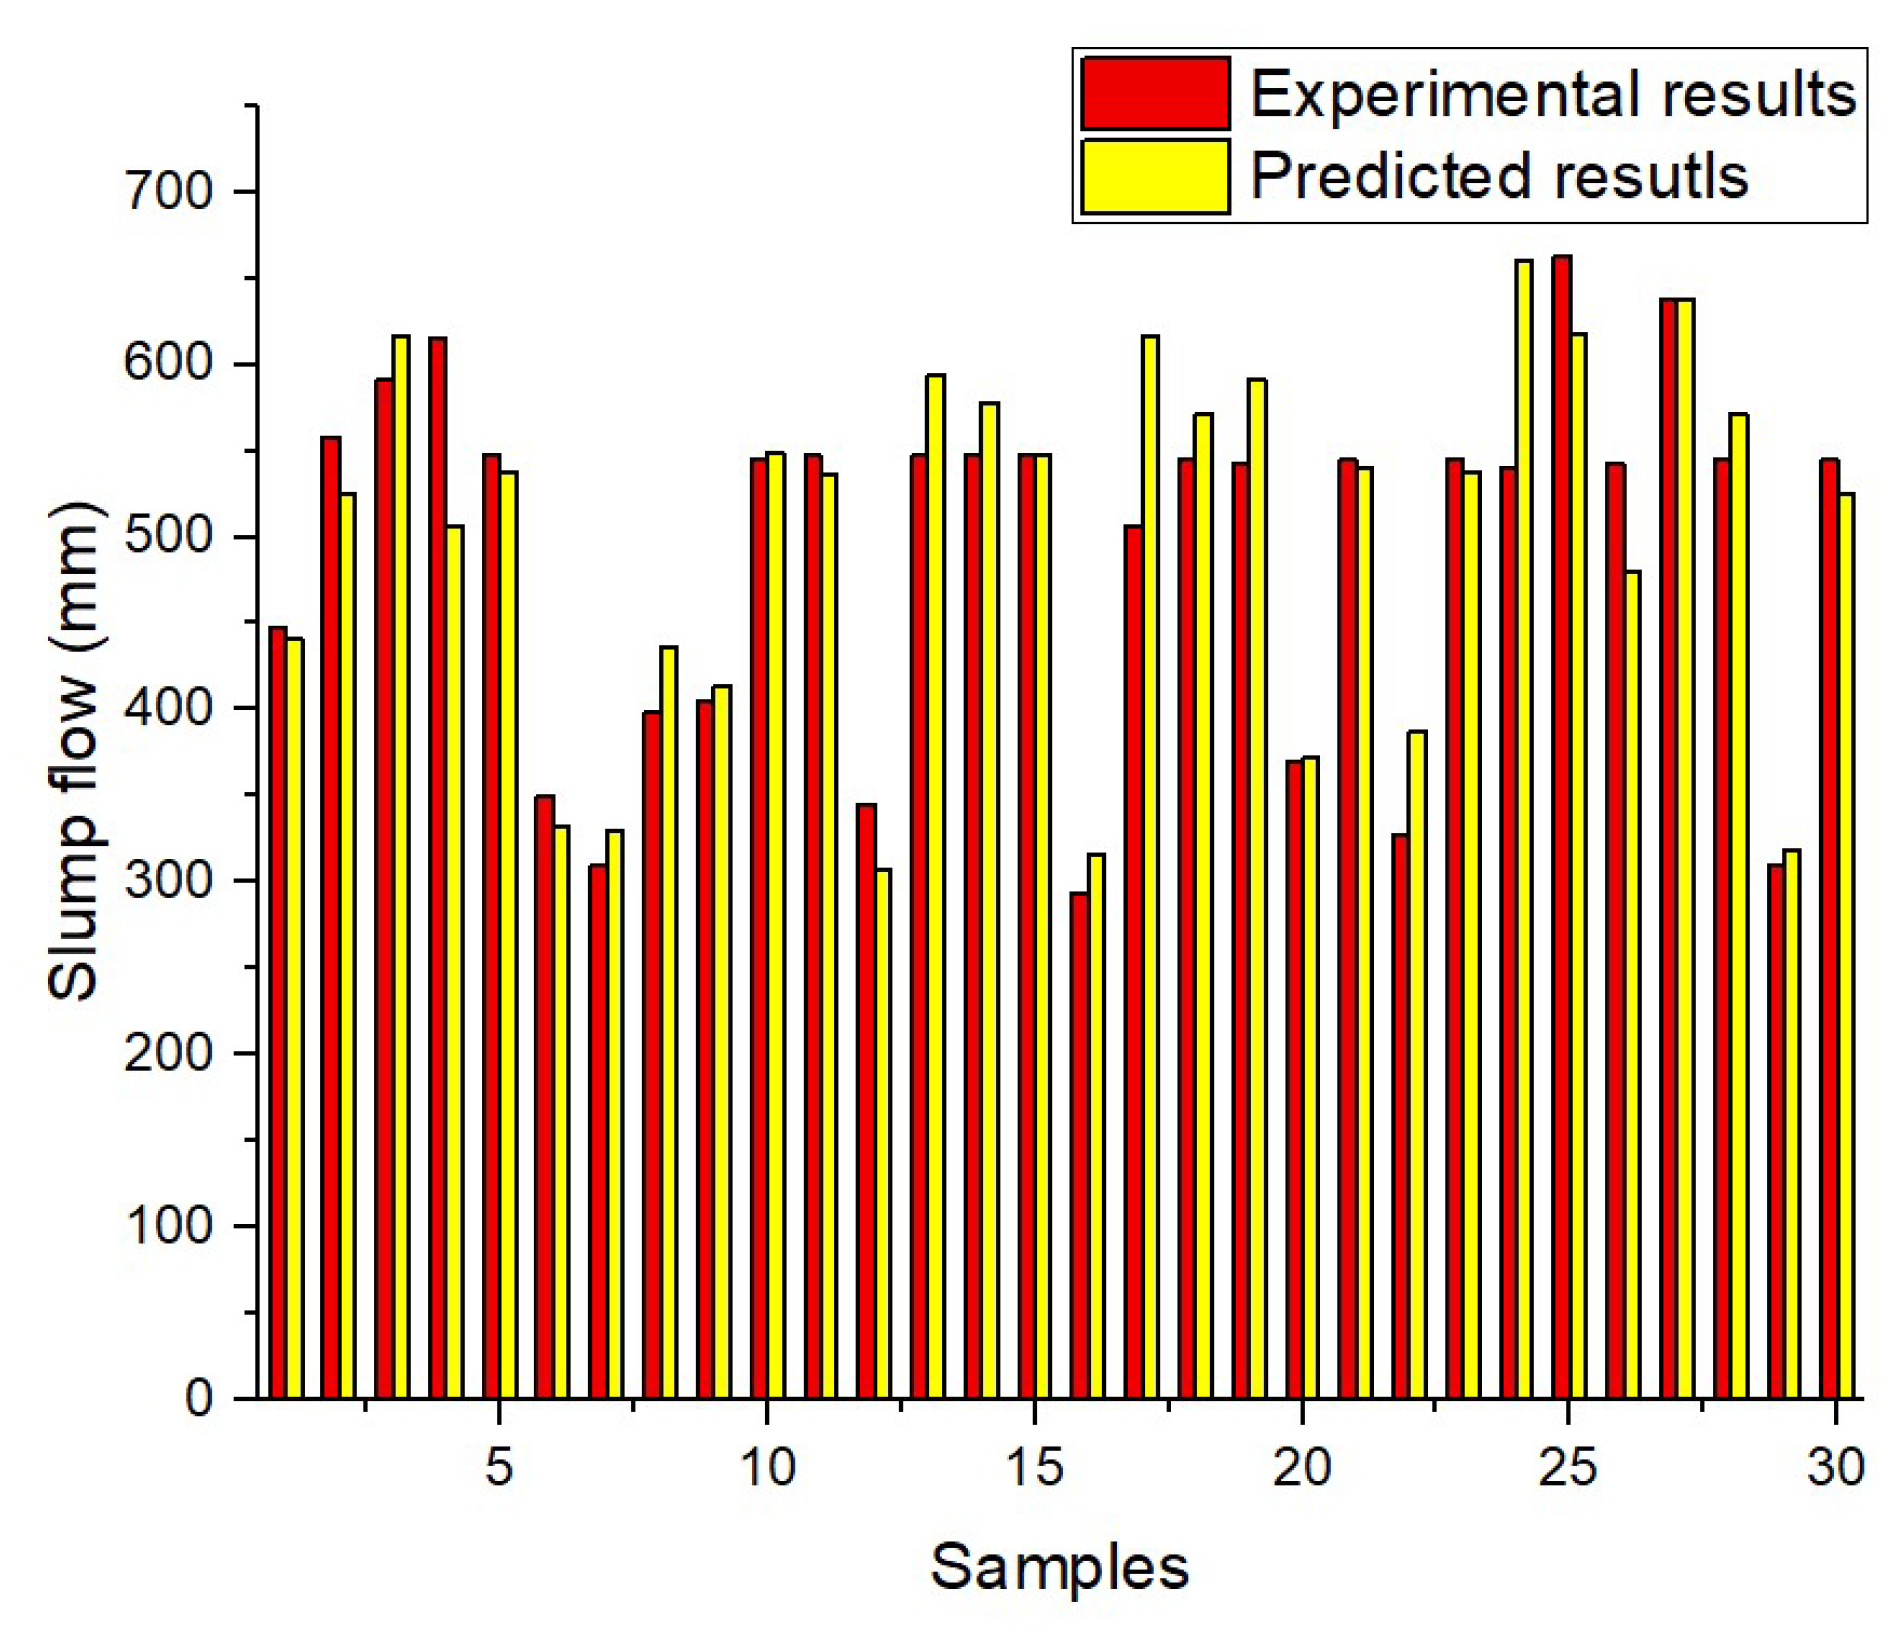
4.2.4. Experimental Verification of ANN Model
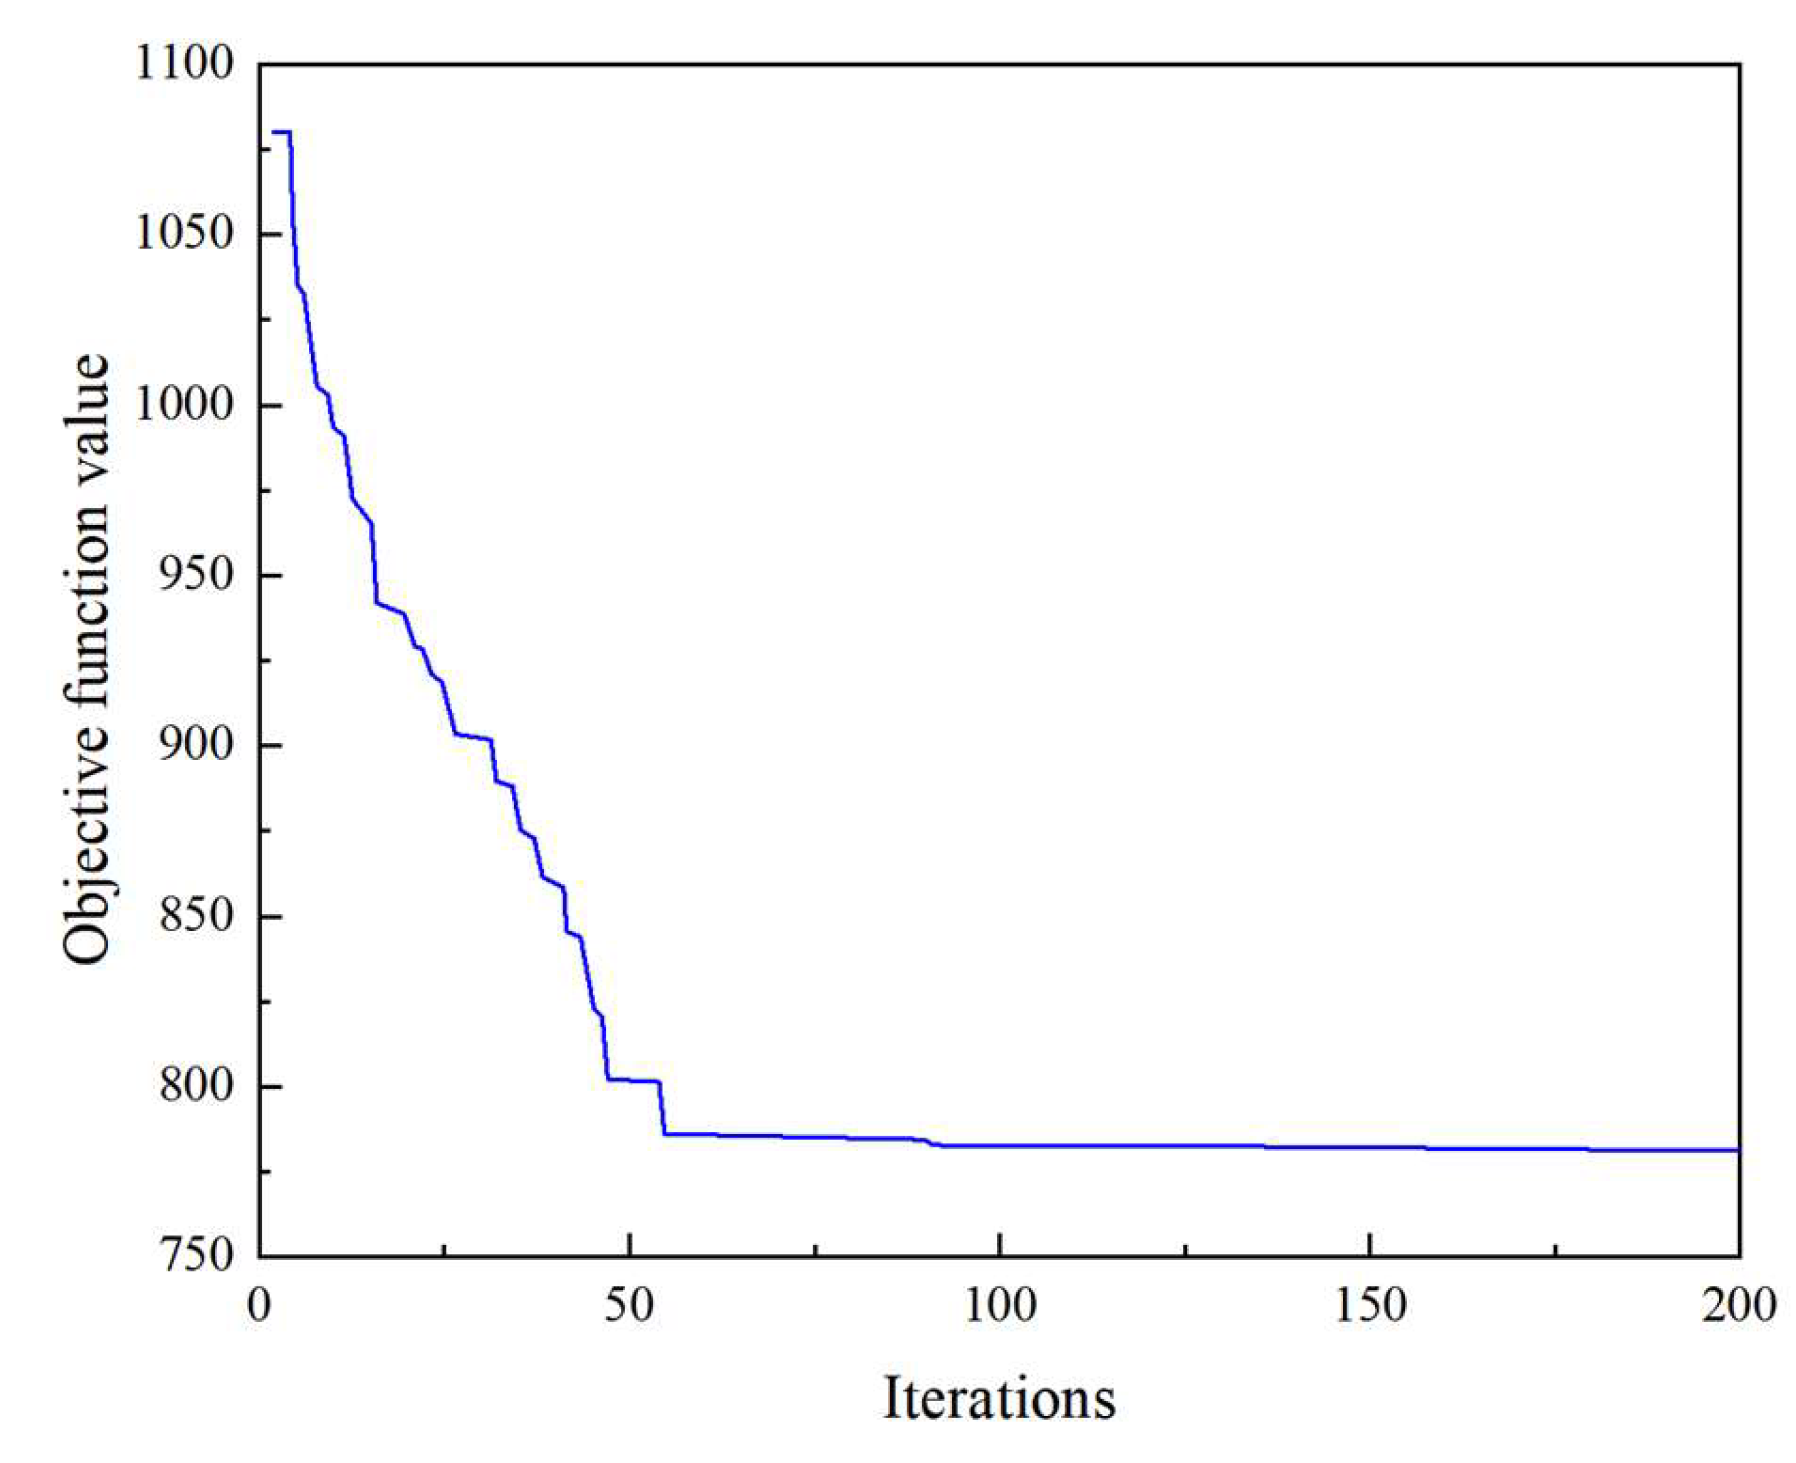
4.3. GA Optimization Process
4.3.1. Optimization Objective Function
4.3.2. Constraint Condition
- Strength constraint. The 28-day compressive strength of UHPC should have a predicted value from the ANN that is higher than the required strength. Equation (5) illustrates the strength restriction.
- 2.
- Slump flow constraint. The workability of fresh UHPC should be greater than the required workability. The workability constraint is displayed in Equation (6).
- 3.
- Component content constraint. This research employs the data range in the dataset as the component content constraint range, meaning that the optimized UHPC component content should fall within a suitable range. Table 6 displays the key statistical characteristics of the dataset, while Equation (7) shows the component content constraints.

| Minimum Value | Maximum Value | Range | |
|---|---|---|---|
| Cement (kg/m3) | 354 | 1000 | 646 |
| Fly ash (kg/m3) | 0 | 328 | 328 |
| GO (kg/m3) | 0 | 0.86 | 0.86 |
| Silica fume (kg/m3) | 0 | 305 | 305 |
| Fine aggregate (kg/m3) | 650 | 1718 | 1068 |
| Steel fiber (vol.-%) | 1.00 | 4.00 | 3.00 |
| Superplasticizer (wt.%) | 0.40 | 2.00 | 1.60 |
| Water (kg/m3) | 142 | 241 | 99 |
- 4.
- Component proportion constraint. There are several related components in UHPC; hence, there should be limits on the ratios between these components. The ratios of cement to sand, water to cement, and water to binder have all been constrained in this investigation. As a component percentage limitation, we continue to use the dataset’s proportion range. In Equations (8)–(10), the composition ratio constraints are illustrated. Table 7 lists the statistical parameters for the dataset’s cement/sand, water/cement, and water/binder ratios.
| Minimum Value | Maximum Value | Average Value | |
|---|---|---|---|
| 0.140 | 0.477 | 0.239 | |
| 0.120 | 0.300 | 0.171 | |
| 0.68 | 1.43 | 1.03 |
- 5.
- Absolute volume constraint. The volume of UHPC should be equal to the sum of the volumes of all components. The absolute volume constraint is illustrated in Equation (11).
4.3.3. Cost Optimization of UHPC
4.4. Optimization Results and Experimental Verification
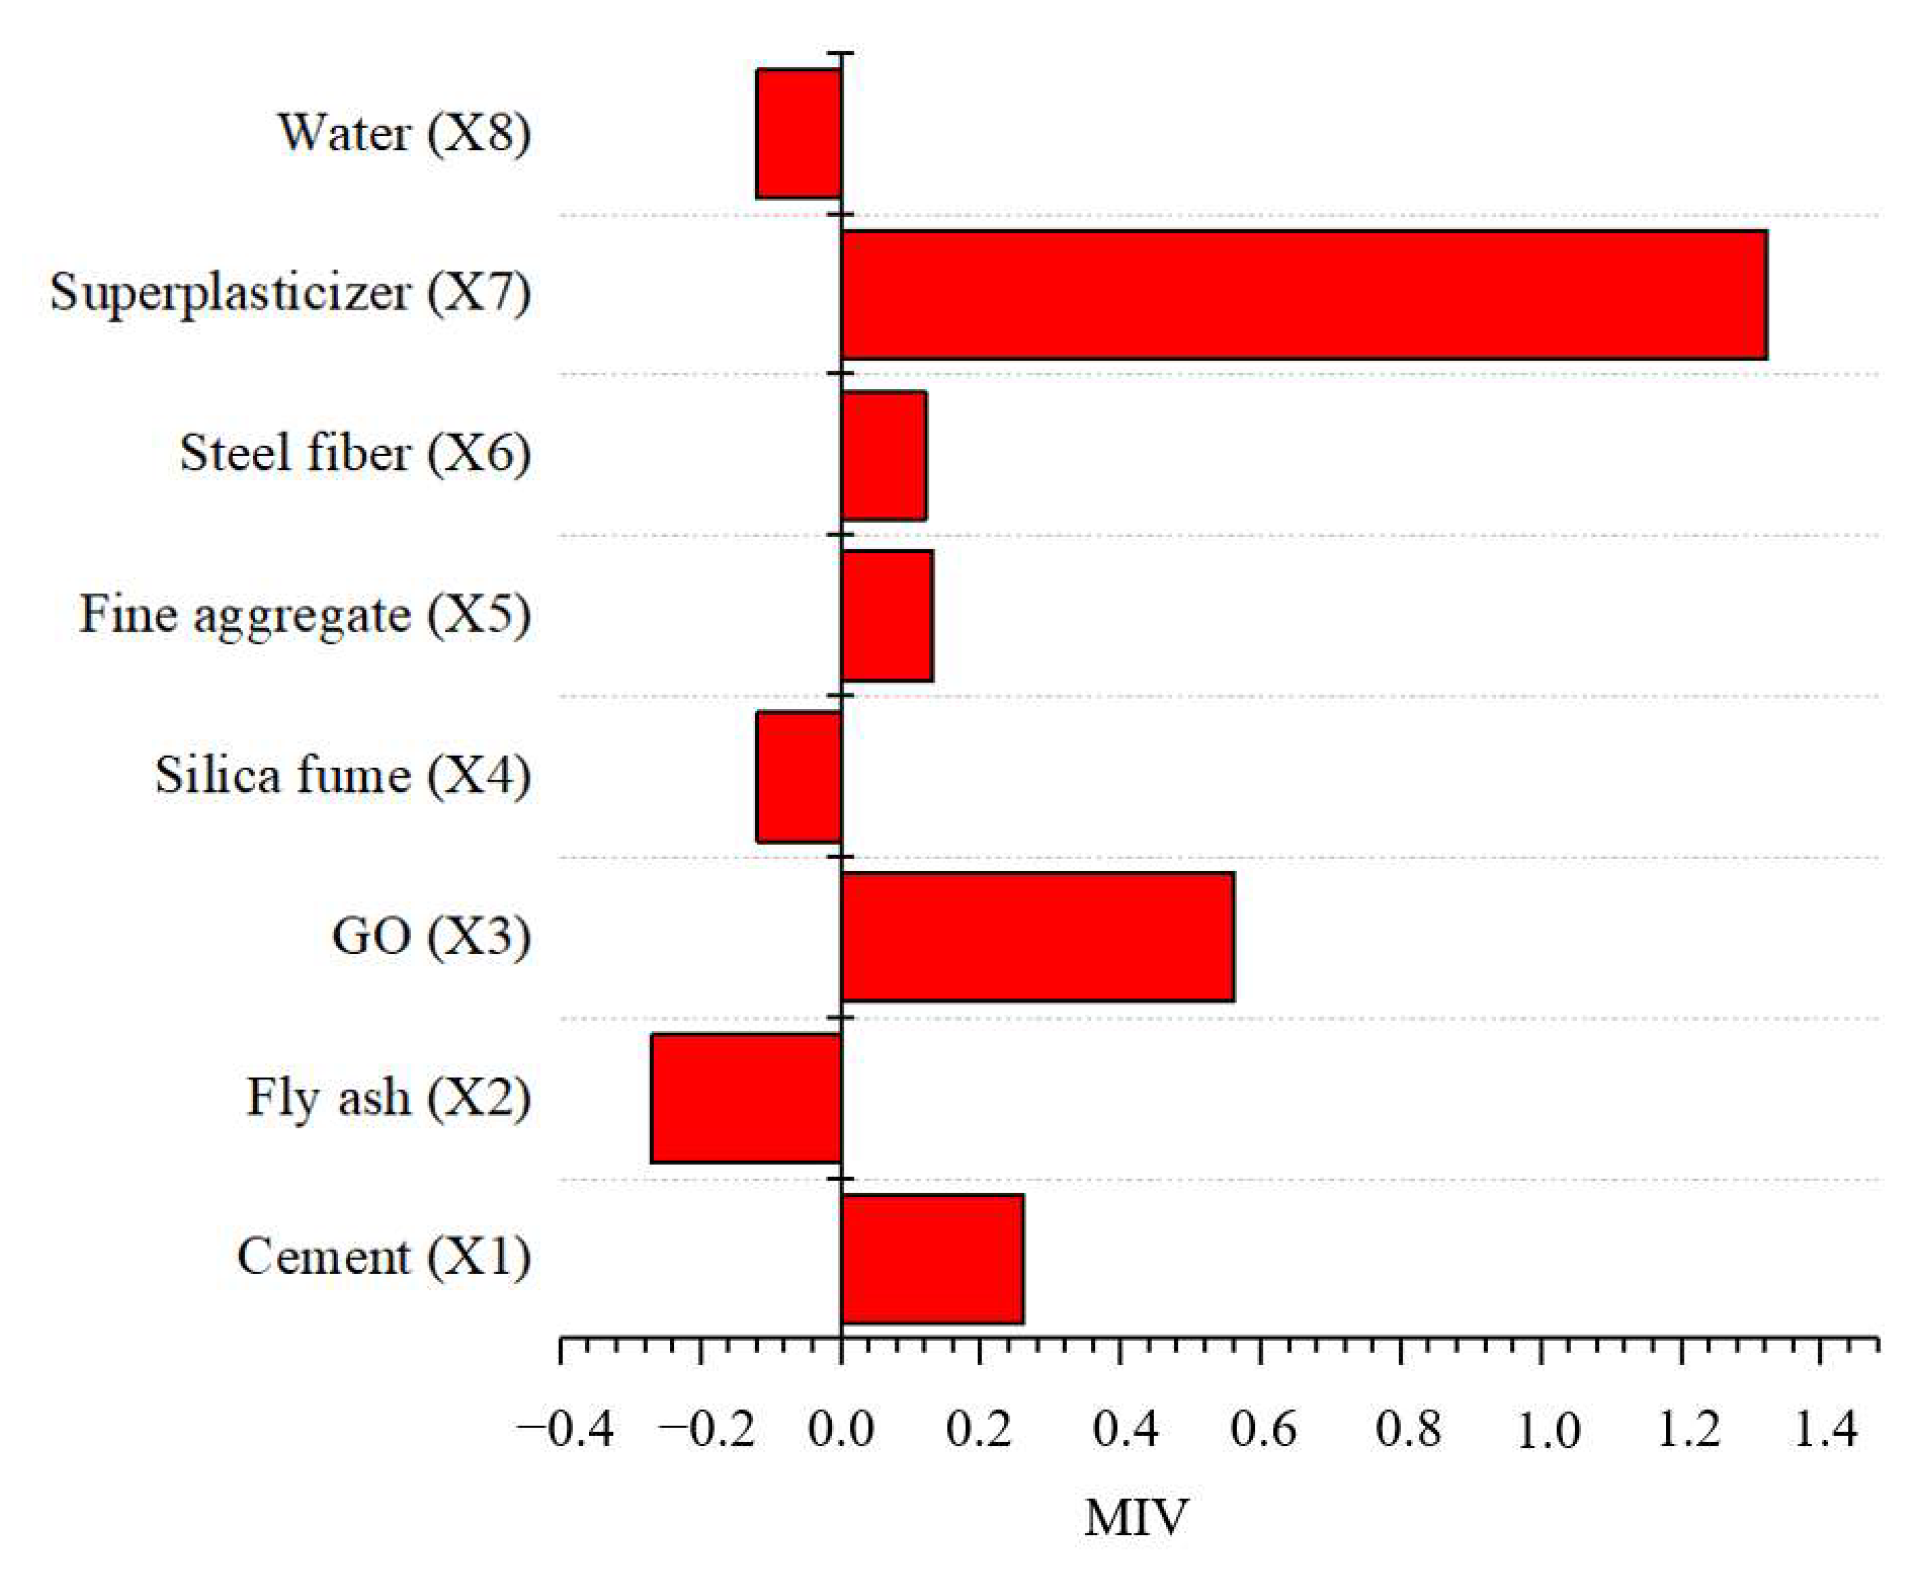
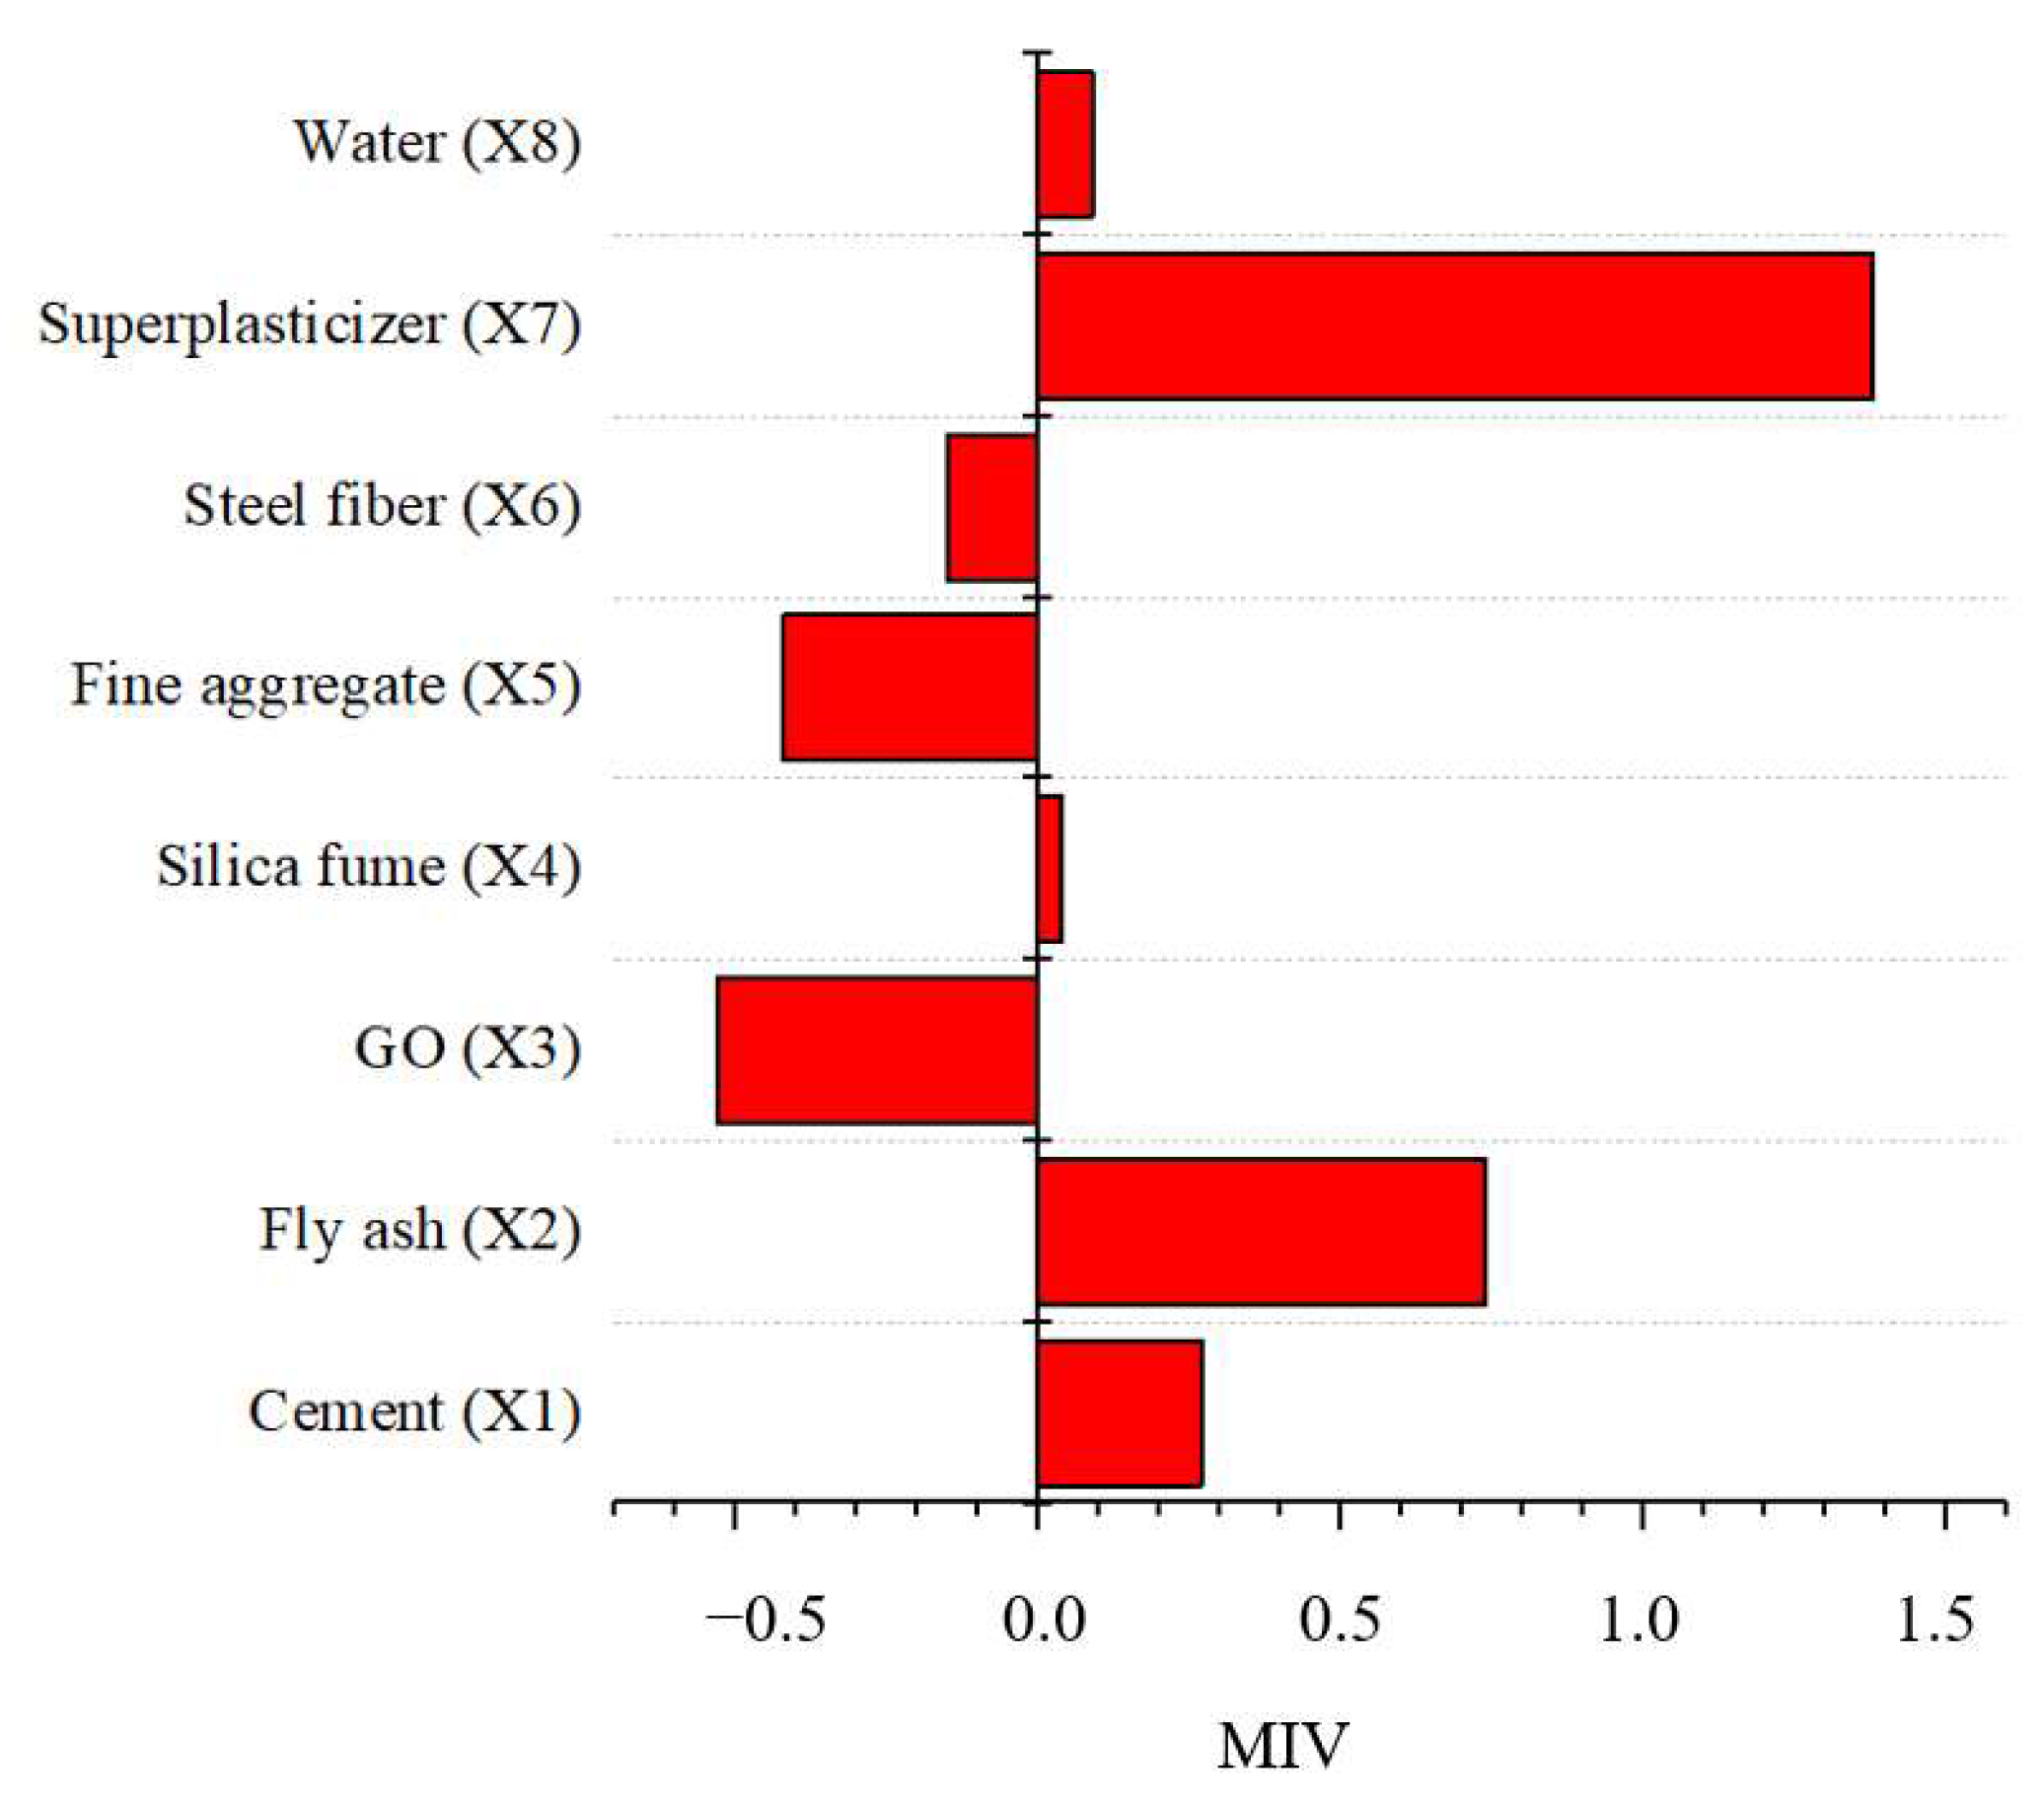
5. Sensitivity Analysis
6. Conclusions
Author Contributions
Funding
Data Availability Statement
Conflicts of Interest
References
- Amran, M.; Huang, S.S.; Onaizi, A.M.; Makul, N.; Abdelgader, H.S.; Ozbakkaloglu, T. Recent trends in ultra-high performance concrete (UHPC): Current status, challenges, and future prospects. Constr. Build. Mater. 2022, 352, 129029. [Google Scholar] [CrossRef]
- Zeyad, A.M.; Hakeem, I.Y.; Amin, M.; Tayeh, B.A.; Agwa, I.S. Effect of aggregate and fibre types on ultra-high-performance concrete designed for radiation shielding. J. Build. Eng. 2022, 58, 104960. [Google Scholar] [CrossRef]
- Yoo, D.Y.; Oh, T.; Banthia, N. Nanomaterials in ultra-high-performance concrete (UHPC)—A review. Cem. Concr. Compos. 2022, 134, 104730. [Google Scholar] [CrossRef]
- Zasypkina, A.; Ivanova, N.; Spasov, D.; Mensharapov, R.; Alekseeva, O.; Vorobyeva, E.; Kukueva, E.; Fateev, V. Electrode with a carbon nanotube array for a proton exchange membrane fuel cell. Inorganics 2023, 11, 219. [Google Scholar] [CrossRef]
- Alshahrie, A.; Alghamdi, A.; Hasan, P.; Ahmed, F.; Albalawi, H.; Umar, A.; Alsulami, A. Enhancement in the performance of dye sensitized solar cells (DSSCs) by incorporation of reduced graphene oxide (RGO) and carbon nanotubes (CNTs) in ZnO nanostructures. Inorganics 2023, 10, 204. [Google Scholar] [CrossRef]
- Chu, H.Y.; Jiang, J.Y.; Sun, W.; Zhang, M.Z. Mechanical and thermal properties of graphene sulfonate nanosheet reinforced sacrificial concrete at elevated temperatures. Constr. Build. Mater. 2017, 153, 682–694. [Google Scholar] [CrossRef]
- Newell, M.; Garcia-Taengua, E. Fresh and hardened state properties of hybrid graphene oxide/nanosilica cement composites. Constr. Build. Mater. 2019, 221, 433–442. [Google Scholar] [CrossRef]
- Wu, Y.Y.; Zhang, J.; Liu, C.J.; Zheng, Z.L.; Lambert, P. Effect of graphene oxide nanosheets on physical properties of ultra-high-performance concrete with high volume supplementary cementitious materials. Materials 2020, 13, 1929. [Google Scholar] [CrossRef]
- Alatawna, A.; Birenboim, M.; Nadiv, R.; Buzaglo, M.; Peretz-Damari, S.; Peled, A.; Regev, O.; Sripada, R. The effect of compatibility and dimensionality of carbon nanofillers on cement composites. Constr. Build. Mater. 2020, 232, 117141. [Google Scholar] [CrossRef]
- Chu, H.Y.; Zhang, Y.; Wang, F.J.; Feng, T.T.; Wang, L.G.; Wang, D.N. Effect of graphene oxide on mechanical properties and durability of ultra-high-performance concrete prepared from recycled sand. Nanomaterials 2020, 10, 1718. [Google Scholar] [CrossRef]
- Luo, Q.Z.; Wu, Y.Y.; Qiu, W.J.; Huang, H.L.; Pei, S.F.; Lambert, P.; Hui, D. Improving flexural strength of UHPC with sustainably synthesized graphene oxide. Nanotechnol. Rev. 2021, 10, 754–767. [Google Scholar] [CrossRef]
- Wang, M.; Du, M.F.; Jia, Y.; Chang, C.; Zhou, S. Carbon emission optimization of ultra-high-performance concrete using machine learning methods. Materials 2024, 17, 1670. [Google Scholar] [CrossRef]
- Zhou, S.; Li, Z.J.; Li, K.; Jia, Y.; Wang, C.; Zhuang, X.Y. Microcapsule-enabled self-healing concrete: A bibliometric analysis. Front. Struct. Civ. Eng. 2023, 17, 1611–1629. [Google Scholar] [CrossRef]
- Zhu, H.L.; Wu, X.; Luo, Y.L.; Jia, Y.; Wang, C.; Fang, Z.; Zhuang, X.Y.; Zhou, S. Prediction of early compressive strength of ultrahigh-performance concrete using machine learning methods. Int. J. Comput. Methods 2023, 20, 2141023. [Google Scholar] [CrossRef]
- Zhou, S.; Jia, Y.; Wang, C. Global sensitivity analysis for the polymeric microcapsules in self-healing cementitious composites. Polymers 2020, 12, 2990. [Google Scholar] [CrossRef]
- Sun, J.B.; Ma, Y.Z.; Li, J.X.; Zhang, J.F.; Ren, Z.H.; Wang, X.Y. Machine learning-aided design and prediction of cementitious composites containing graphite and slag powder. J. Build. Eng. 2021, 43, 102544. [Google Scholar] [CrossRef]
- Sun, J.B.; Wang, X.Y.; Zhang, J.F.; Xiao, F.; Sun, Y.T.; Ren, Z.H.; Zhang, G.B.; Liu, S.K.; Wang, Y.F. Multi-objective optimisation of a graphite-slag conductive composite applying a BAS-SVR based model. J. Build. Eng. 2021, 44, 103223. [Google Scholar] [CrossRef]
- Feng, W.H.; Wang, Y.F.; Sun, J.B.; Tang, Y.C.; Wu, D.X.; Jiang, Z.W.; Wang, J.Q.; Wang, X.Y. Prediction of thermo-mechanical properties of rubber-modified recycled aggregate concrete. Constr. Build. Mater. 2022, 318, 125970. [Google Scholar] [CrossRef]
- Zhang, J.F.; Sun, Y.T.; Li, G.C.; Wang, Y.H.; Sun, J.B.; Li, J.X. Machine-learning-assisted shear strength prediction of reinforced concrete beams with and without stirrups. Eng. Comput. 2022, 38, 1293–1307. [Google Scholar] [CrossRef]
- Sun, J.B.; Wang, J.Q.; Zhu, Z.Y.; He, R.; Peng, C.; Zhang, C.; Huang, J.Z.; Wang, Y.F.; Wang, X.Y. Mechanical performance prediction for sustainable high-strength concrete using bio-inspired neural network. Buildings 2022, 12, 65. [Google Scholar] [CrossRef]
- Sun, J.B.; Wang, Y.F.; Liu, S.K.; Dehghani, A.; Xiang, X.L.; Wei, J.J.; Wang, X.Y. Mechanical, chemical and hydrothermal activation for waste glass reinforced cement. Constr. Build. Mater. 2021, 301, 124361. [Google Scholar] [CrossRef]
- Farooq, F.; Amin, M.N.; Khan, K.; Sadiq, M.R.; Javed, M.F.; Aslam, F.; Alyousef, R. A comparative study of random forest and genetic engineering programming for the prediction of compressive strength of high strength concrete (HSC). Appl. Sci. 2020, 10, 7330. [Google Scholar] [CrossRef]
- Al-Shamiri, A.K.; Kim, J.H.; Yuan, T.F.; Yoon, Y.S. Modeling the compressive strength of high-strength concrete: An extreme learning approach. Constr. Build. Mater. 2019, 208, 204–219. [Google Scholar] [CrossRef]
- Lee, J.H.; Yoon, Y.S.; Kim, J.H. A new heuristic algorithm for mix design of high-performance concrete. KSCE J. Civ. Eng. 2012, 16, 974–979. [Google Scholar] [CrossRef]
- Cheng, M.Y.; Prayogo, D.; Wu, Y.W. Novel genetic algorithm-based evolutionary support vector machine for optimizing high-performance concrete mixture. J. Comput. Civ. Eng. 2014, 28, 06014003. [Google Scholar] [CrossRef]
- Hinton, G.E.; Williams, R.J. Learning representations by back-propagating errors. Nature 1986, 323, 533–536. [Google Scholar]
- Holland, J.H. Adaptation in Natural and Artificial Systems: An Introductory Analysis with Applications to Biology, Control, and Artificial Intelligence; University of Michigan Press: Ann Arbor, MI, USA, 1975. [Google Scholar]
- Türkeli, E.; Öztürk, H.T. Optimum design of partially prestressed concrete beams using Genetic Algorithms. Struct. Eng. Mech. 2017, 64, 579–589. [Google Scholar]
- Stone, M. Cross-validatory choice and assessment of statistical predictions. J. R. Stat. Soc. Ser. B-Stat. Methodol. 1974, 36, 111–147. [Google Scholar] [CrossRef]
- GB/T31387-2015; Reactive Power Concrete. Chinese National Standards: Beijing, China, 2015. (In Chinese)
- Wang, M.; Yao, H. Comparison study on the adsorption behavior of chemically functionalized graphene oxide and graphene oxide on cement. Materials 2020, 13, 3274. [Google Scholar] [CrossRef]
- Xiong, G.; Ren, Y.; Wang, C.; Zhang, Z.; Zhou, S.; Kuang, C.; Zhao, Y.; Guo, B.; Hong, S. Effect of power ultrasound assisted mixing on graphene oxide in cement paste: Dispersion, microstructure and mechanical properties. J. Build. Eng. 2023, 69, 106321. [Google Scholar] [CrossRef]
- Luo, Y.; Yu, Z.P. Effect of graphene oxide on mechanical properties of UHPC and analysis of micro-control mechanism. Mater. Res. Express 2021, 8, 095001. [Google Scholar]
- Xiong, G.Q.; Ren, Y.L.; Jia, X.L.; Fang, Z.; Sun, K.K.; Huang, Q.; Wang, C.; Zhou, S. Understanding the influence of ultrasonic power on the hydration of cement paste. J. Build. Eng. 2024, 87, 108996. [Google Scholar] [CrossRef]
- Xiong, G.; Wang, C.; Zhou, S.; Zhao, Y.; Li, Y.; Liu, Y.; Qiu, J. Effect of power ultrasound-assisted mixing on the hydration and microstructural development of cement paste, J. Sustain. Cem. Based 2023, 12, 1061–1072. [Google Scholar] [CrossRef]
- Xiong, G.Q.; Wang, C.; Zhou, S.; Zheng, Y.L.; Ren, Y.L.; Fang, Z.; Zhao, Y. Understanding the thermal effect of power ultrasound in cement paste. Appl. Therm. Eng. 2023, 232, 120946. [Google Scholar] [CrossRef]
- GB/T2419-2005; Test Method for Fluidity of Cement Mortar. Chinese National Standards: Beijing, China, 2005. (In Chinese)
- Esmaeili, J.; Romouzi, V.; Kasaei, J.; Andalibi, K. An investigation of durability and the mechanical properties of ultra-high performance concrete (UHPC) modified with economical graphene oxide nano-sheets. J. Build. Eng. 2023, 80, 107908. [Google Scholar] [CrossRef]
- Yang, K.; Long, G.C.; Tang, Z.; Wu, H.; Ma, G.; Cheng, Z.Q.; Xiang, Y.; Xie, Y.J. Enhancement in strength and toughness of ultra-high performance concrete (UHPC) from micron- and nano-scale. J. Build. Eng. 2023, 69, 106308. [Google Scholar] [CrossRef]
- Luo, Y.K.; Yu, Z.P. Effects of graphene oxide on durability of ultra high performance concrete. Funct. Mater. 2022, 29, 135–143. [Google Scholar]
- Yu, L.Z.; Wu, R.X. Using graphene oxide to improve the properties of ultra-high-performance concrete with fine recycled aggregate. Constr. Build. Mater. 2020, 259, 120657. [Google Scholar] [CrossRef]
- Paredes, J.A.; Gálvez, J.C.; Enfedaque, A.; Alberti, M.G. Matrix optimization of Ultra High Performance Concrete for improving strength and durability. Materials 2021, 14, 6944. [Google Scholar] [CrossRef] [PubMed]
- Regalla, S.; Kumar, N.S. Influence of graphene oxide in the hydration mechanism by reinforcing mechanical strength and microstructural characterization of ultra-high-performance concrete (UHPC). J. Dispers. Sci. Technol. 2023, 1, 1–18. [Google Scholar] [CrossRef]
- Chu, H.Y.; Qin, J.J.; Gao, L.; Jiang, J.Y.; Wang, F.J.; Wang, D.Q. Effects of graphene oxide on mechanical properties and microstructure of ultra-high-performance lightweight concrete. J. Sustain. Cem. Based Mater. 2023, 12, 647–660. [Google Scholar] [CrossRef]
- Cheng, S.K.; Chen, K.; Wu, Q.Y.; Chen, X.Y.; Zhao, C.; Wu, Z.Y. Influence of industrial-grade graphene oxide on macro and micro properties of ultra-high performance concrete incorporating recycled fine aggregate. Constr. Build. Mater. 2024, 417, 135427. [Google Scholar] [CrossRef]
- Yu, L.B.; Bai, S.; Guan, X.C. Effect of multi-scale reinforcement on fracture property of ultra-high performance concrete. Constr. Build. Mater. 2023, 397, 132383. [Google Scholar] [CrossRef]
- Mao, K.H.; Yu, J.M.; Yang, B.; Liu, H.X.; Shen, L.; Elchalakani, M.; Alqawzai, S. Mechanical properties of graphene oxide modified ultra-high-performance concrete containing coarse aggregate. J. Build. Eng. 2024, 86, 108754. [Google Scholar] [CrossRef]
- Lamastra, F.R.; Bavasso, I.; Bracciale, M.P.; Duranti, L.; Montesperelli, G.; Di Palma, L.; Bianco, A. Toward clima-resilient ultra-high performance concrete (UHPC): A survey on high-strength mortars engineered with extra-low dosage graphene-based materials (GBMs). Ceram. Int. 2023, 49, 38482–38498. [Google Scholar] [CrossRef]
- Deeb, R.; Karihaloo, B.L. Mix proportioning of self-compacting normal and high-strength concretes. Mag. Concr. Res. 2013, 65, 1200164. [Google Scholar] [CrossRef]
- Ayira, F.; John, O. Investigating the Properties of Reactive Powder Concrete (RPC)—Compressive and Flexural Strength. Ph.D. Thesis, Universiti Teknologi Petronas, Bandar Seri Iskandar, Malaysia, 2013. [Google Scholar]
- Amin, M.; Zeyad, A.M.; Tayeh, B.A.; Agwa, I.S. Effect of ferrosilicon and silica fume on mechanical, durability, and microstructure characteristics of ultra high-performance concrete. Constr. Build. Mater. 2022, 320, 126233. [Google Scholar] [CrossRef]
- Nie, J.; Li, C.; Qian, G.; Pan, R.; Fei, B.; Deng, S. Effect of shape and content of steel fiber on workability and mechanical properties of Ultra-High Performance Concrete (UHPC). Cailiao Daobao/Mater. Rep. 2021, 35, 04042–04052. [Google Scholar]
- Pyo, S.; Kim, H.K. Fresh and hardened properties of ultra-high performance concrete incorporating coal bottom ash and slag powder. Constr. Build. Mater. 2017, 131, 459–466. [Google Scholar] [CrossRef]
- Randl, N.; Steiner, T.; Ofner, S.; Baumgartner, E.; Mészöly, T. Development of UHPC mixtures from an ecological point of view. Constr. Build. Mater. 2014, 67, 373–378. [Google Scholar] [CrossRef]
- Ghafari, E.; Bandarabadi, M.; Costa, H.; Júlio, E. Prediction of fresh and hardened state properties of UHPC: Comparative study of statistical mixture design and an artificial neural network model. J. Mater. Civ. Eng. 2015, 27, 04015017. [Google Scholar] [CrossRef]
- Kim, T.; Tae, S.; Roh, S. Assessment of the CO2 emission and cost reduction performance of a low-carbon-emission concrete mix design using an optimal mix design system. Renew. Sust. Energ. Rev. 2013, 25, 729–741. [Google Scholar] [CrossRef]
- Wille, K.; Boisvert-Cotulio, C. Material efficiency in the design of ultra-high performance concrete. Constr. Build. Mater. 2015, 86, 33–43. [Google Scholar] [CrossRef]
- Shi, J.Y.; Tan, J.X.; Liu, B.J.; Chen, J.Z.; Dai, J.D.; He, Z.H. Experimental study on full-volume slag alkali-activated mortars: Air-cooled blast furnace slag versus machine-made sand as fine aggregates. J. Hazard Mater. 2021, 403, 123983. [Google Scholar] [CrossRef] [PubMed]
- Alsalman, A.; Dang, C.N.; Martí-Vargas, J.R.; Hale, W.M. Mixture-proportioning of economical UHPC mixtures. J. Build. Eng. 2020, 27, 100970. [Google Scholar] [CrossRef]
- Tucker, J.L. Laboratory Evaluation, Mechanistic Performance Prediction, and Life Cycle Cost Analysis (LCCA) of Graphene Oxide Modified Asphalt Binders. Master’s Thesis, University of Colorado at Boulder, Boulder, CO, USA, 2023. [Google Scholar]
- Roberti, F.; Cesari, V.F.; de Matos, P.R.; Pelisser, F.; Pilar, R. High- and ultra-high-performance concrete produced with sulfate-resisting cement and steel microfiber: Autogenous shrinkage, fresh-state, mechanical properties and microstructure characterization. Constr. Build. Mater. 2021, 268, 121092. [Google Scholar] [CrossRef]
- Shin, T.Y.; Kim, J.H.; Koh, K.T.; Ryu, G.S.; Wang, K.J. Placement of ultra-high performance concrete for inclined-surface pavement. Road Mater. Pavement Des. 2022, 23, 1667–1680. [Google Scholar] [CrossRef]
- Abuodeh, O.R.; Abdalla, J.A.; Hawileh, R.A. Assessment of compressive strength of Ultra-high Performance Concrete using deep machine learning techniques. Appl. Soft Comput. 2020, 95, 106552. [Google Scholar] [CrossRef]
- Chen, Y.; Liu, P.; Sha, F.; Yin, J.; He, S.S.; Li, Q.H.; Yu, Z.W.; Chen, H.L. Study on the mechanical and rheological properties of ultra-high performance concrete. J. Mater. Res. Technol-JMRT 2022, 17, 111–124. [Google Scholar] [CrossRef]
- Yu, R.; Spiesz, P.; Brouwers, H.J.H. Development of an eco-friendly Ultra-High Performance Concrete (UHPC) with efficient cement and mineral admixtures uses. Cem. Concr. Compos. 2015, 55, 383–394. [Google Scholar] [CrossRef]
- Wang, X.P.; Yu, R.; Song, Q.L.; Shui, Z.H.; Liu, Z.; Wu, S.; Hou, D.S. Optimized design of ultra-high performance concrete (UHPC) with a high wet packing density. Cem. Concr. Res. 2019, 126, 105921. [Google Scholar] [CrossRef]
- Cui, K.; Chang, J. Hydration, reinforcing mechanism, and macro performance of multi-layer graphene-modified cement composites. J. Build. Eng. 2022, 57, 104880. [Google Scholar] [CrossRef]
- Meng, W.N.; Khayat, K.H. Mechanical properties of ultra-high-performance concrete enhanced with graphite nanoplatelets and carbon nanofibers. Compos. Part B Eng. 2016, 107, 113–122. [Google Scholar] [CrossRef]


| Composition | SiO2 (%) | Al2O3 (%) | CaO (%) | MgO (%) | Na2O (%) | K2O (%) | Fe2O3 (%) | TiO2 (%) | SO3 (%) | P2O5 (%) | Density (kg/m3) |
|---|---|---|---|---|---|---|---|---|---|---|---|
| Cement | 21.39 | 5.15 | 61.04 | 2.82 | 0.64 | 0.62 | 3.86 | 0.85 | 3.1 | 0.10 | 3190 |
| Fly ash | 48.54 | 27.12 | 3.19 | 11.08 | 1.63 | 2270 | |||||
| Silica fume | 94.57 | 0.67 | 0.34 | 0.23 | 0.82 | 0.15 | 2.07 | 0.90 | 2310 |
| Thickness (nm) | Diameter (um) | Peelable (%) | Carbon (wt%) | Oxygen (wt%) | Sulfur (wt%) | Ash Content (wt%) | Tap Density (g/L) | Granularity |
|---|---|---|---|---|---|---|---|---|
| 2 | 10.4 | 96 | 46.9 | 55.8 | <3.6 | <2.8 | 600 | <85 |
| Cement (kg) | FA (kg) | GO (kg) | SF (kg) | Fine Aggregates (kg) | Steel Fibers (vol.%) | Superplasticizer (wt%) | Water (kg) |
|---|---|---|---|---|---|---|---|
| 632 | 0 | 0.063 | 158 | 1316 | 2.0 | 1.8 | 223 |
| 642 | 0 | 0.128 | 148 | 1185 | 2.0 | 1.8 | 158 |
| 653 | 201 | 0.196 | 151 | 1008 | 2.0 | 1.8 | 161 |
| 675 | 125 | 0.270 | 115 | 1179 | 0.0 | 2.0 | 180 |
| 690 | 212 | 0.345 | 159 | 1061 | 3.0 | 1.8 | 191 |
| 692 | 0 | 0.415 | 148 | 1185 | 2.0 | 1.8 | 158 |
| 703 | 151 | 0.070 | 151 | 1005 | 2.0 | 1.8 | 161 |
| 718 | 0 | 0.144 | 127 | 1352 | 2.0 | 1.8 | 152 |
| 736 | 0 | 0.221 | 156 | 1182 | 2.0 | 1.8 | 173 |
| 741 | 198 | 0.296 | 148 | 1185 | 2.0 | 1.8 | 158 |
| 750 | 125 | 0.375 | 115 | 1104 | 0.0 | 2.0 | 180 |
| 763 | 191 | 0.458 | 106 | 1079 | 2.0 | 1.8 | 173 |
| 776 | 48 | 0.078 | 145 | 1212 | 2.0 | 1.8 | 165 |
| 777 | 0 | 0.155 | 108 | 1079 | 2.0 | 1.8 | 173 |
| 800 | 176 | 0.240 | 150 | 650 | 2.0 | 1.8 | 165 |
| 808 | 0 | 0.323 | 143 | 1189 | 2.0 | 2.0 | 175 |
| 811 | 0 | 0.406 | 143 | 1192 | 2.0 | 1.8 | 191 |
| 817 | 0 | 0.490 | 144 | 1202 | 2.0 | 1.8 | 180 |
| 840 | 0 | 0.084 | 148 | 1185 | 2.0 | 1.8 | 158 |
| 847 | 0 | 0.169 | 150 | 997 | 1.0 | 1.8 | 179 |
| 850 | 176 | 0.255 | 150 | 650 | 2.0 | 1.8 | 165 |
| 857 | 0 | 0.343 | 151 | 1008 | 1.0 | 1.8 | 191 |
| 861 | 0 | 0.431 | 152 | 1125 | 2.0 | 1.8 | 202 |
| 868 | 0 | 0.521 | 153 | 1021 | 3.0 | 2.0 | 183 |
| 870 | 0 | 0.087 | 154 | 1024 | 3.0 | 2.0 | 189 |
| 875 | 0 | 0.175 | 154 | 1144 | 2.0 | 1.8 | 206 |
| 890 | 0 | 0.267 | 157 | 1047 | 3.0 | 1.8 | 209 |
| 900 | 0 | 0.360 | 100 | 1350 | 0.4 | 2.5 | 170 |
| 903 | 0 | 0.452 | 159 | 1062 | 2.0 | 1.8 | 204 |
| 1000 | 0 | 0.600 | 0 | 1350 | 0.4 | 2.5 | 170 |
| ML Method | Class | Dataset | MSE | R |
|---|---|---|---|---|
| XgBoost | Strength | Training | 1.034 | 0.93 |
| Testing | 3.213 | 0.89 | ||
| Slump flow | Training | 1.3 | 0.92 | |
| Testing | 3.7 | 0.87 | ||
| Extremely randomized tree | Strength | Training | 0.31 | 0.92 |
| Testing | 4.1 | 0.83 | ||
| Slump flow | Training | 0.2 | 0.9 | |
| Testing | 2.1 | 0.878 | ||
| Ridge | Strength | Training | 5.104 | 0.904 |
| Testing | 5.5 | 0.83 | ||
| Slump flow | Training | 3.8 | 0.9 | |
| Testing | 5.2 | 0.88 | ||
| Random Forest | Strength | Training | 0.44 | 0.95 |
| Testing | 2.77 | 0.91 | ||
| Slump flow | Training | 2.2 | 0.91 | |
| Testing | 8.3 | 0.82 | ||
| Decision Tree | Strength | Training | 0.01 | 0.94 |
| Testing | 5.4 | 0.91 | ||
| Slump flow | Training | 1.9 | 0.89 | |
| Testing | 3.4 | 0.878 | ||
| Gamma | Strength | Training | 11.1 | 0.817 |
| Testing | 11.9 | 0.79 | ||
| Slump flow | Training | 9.1 | 0.83 | |
| Testing | 12.5 | 0.781 | ||
| AdaBoost | Strength | Training | 4.2 | 0.91 |
| Testing | 5.5 | 0.84 | ||
| Slump flow | Training | 3.1 | 0.9 | |
| Testing | 4.5 | 0.89 | ||
| Gradient Boosting | Strength | Training | 1.5 | 0.93 |
| Testing | 5.5 | 0.88 | ||
| Slump flow | Training | 3.2 | 0.89 | |
| Testing | 8.2 | 0.85 | ||
| ANN | Strength | Training | 0.412 | 0.95 |
| Testing | 1.662 | 0.94 | ||
| Slump flow | Training | 0.342 | 0.94 | |
| Testing | 2.327 | 0.93 |
| Raw Material | Cost ($/ton) | References |
|---|---|---|
| Cement | 82 | [59] |
| Fly ash | 40 | [59] |
| GO | 67,000 | [60] |
| Silica fume | 800 | [59] |
| Fine aggregate | 23.57 | [58] |
| Steel fiber | 5000 | [59] |
| Superplasticizer | 3400 | [59] |
| Water | – | [57] |
| Cement (kg) | Fly Ash (kg) | GO (kg) | Silica Fume (kg) | Fine Aggregate (kg) | Steel Fiber (vol.%) | Superplasticizer (wt%) | Water (kg) |
|---|---|---|---|---|---|---|---|
| 675.1 | 185.7 | 0.300 | 137.3 | 950.6 | 1.36 | 1.36 | 190.4 |
Disclaimer/Publisher’s Note: The statements, opinions and data contained in all publications are solely those of the individual author(s) and contributor(s) and not of MDPI and/or the editor(s). MDPI and/or the editor(s) disclaim responsibility for any injury to people or property resulting from any ideas, methods, instructions or products referred to in the content. |
© 2024 by the authors. Licensee MDPI, Basel, Switzerland. This article is an open access article distributed under the terms and conditions of the Creative Commons Attribution (CC BY) license (https://creativecommons.org/licenses/by/4.0/).
Share and Cite
Lv, H.; Du, M.; Li, Z.; Xiao, L.; Zhou, S. Cost Optimization of Graphene Oxide-Modified Ultra-High-Performance Concrete Based on Machine Learning Methods. Inorganics 2024, 12, 181. https://doi.org/10.3390/inorganics12070181
Lv H, Du M, Li Z, Xiao L, Zhou S. Cost Optimization of Graphene Oxide-Modified Ultra-High-Performance Concrete Based on Machine Learning Methods. Inorganics. 2024; 12(7):181. https://doi.org/10.3390/inorganics12070181
Chicago/Turabian StyleLv, Hui, Mingfeng Du, Zijian Li, Li Xiao, and Shuai Zhou. 2024. "Cost Optimization of Graphene Oxide-Modified Ultra-High-Performance Concrete Based on Machine Learning Methods" Inorganics 12, no. 7: 181. https://doi.org/10.3390/inorganics12070181