Article

Effects of Improper Mechanical Force on the Production of Sonic Hedgehog, RANKL, and IL-6 in Human Periodontal Ligament Cells In Vitro

1
Department of Orthodontics, Nihon University of School at Matsudo, Matsudo 271-8587, Japan
2
Department of Microbiology and Immunology, Nihon University of School at Matsudo, Matsudo 271-8587, Japan
*
Author to whom correspondence should be addressed.
Dent. J. 2024, 12(4), 108; https://doi.org/10.3390/dj12040108
Submission received: 28 December 2023 / Revised: 28 February 2024 / Accepted: 8 April 2024 / Published: 15 April 2024

Abstract

:
Improper mechanical stress may induce side effects during orthodontic treatment. If the roots and alveolar bones are extensively resorbed following excess mechanical stress, unplanned tooth mobility and inflammation can occur. Although multiple factors are believed to contribute to the development of side effects, the cause is still unknown. Sonic hedgehog (Shh), one of the hedgehog signals significantly associated with cell growth and cancer development, promotes osteoclast formation in the jawbone. Shh may be associated with root and bone resorptions during orthodontic treatment. In this study, we investigated the relationships between Shh, RANKL, and IL-6 in human periodontal ligament (hPDL) cells exposed to improper mechanical force. Weights were placed on hPDL cells and human gingival fibroblasts (HGFs) for an optimal orthodontic force group (1.0 g/cm2) and a heavy orthodontic force group (4.0 g/cm2). A group with no orthodontic force was used as a control group. Real-time PCR, SDS-PAGE, and Western blotting were performed to examine the effects of orthodontic forces on the expression of Shh, RANKL, and IL-6 at 2, 4, 6, 8, 12, and 24 h after the addition of pressure. The protein expression of Shh was not clearly induced by orthodontic forces of 1.0 and 4.0 g/cm2 compared with the control in HGFs and hPDL cells. In contrast, RANKL and IL-6 gene and protein expression was significantly induced by 1.0 and 4.0 g/cm2 in hPDL cells for forces lasting 6~24 h. However, neither protein was expressed in HGFs. RANKL and IL-6 expressions in response to orthodontic forces and in the control were clearly inhibited by Shh inhibitor RU-SKI 43. Shh did not directly link to RANKL and IL-6 for root and bone resorptions by orthodontic force but was associated with cell activities to be finally guided by the production of cytokines in hPDL cells.

1. Introduction

The human periodontal ligament (hPDL) and the alveolar bone are parts of the periodontium, which is a complicated structure that supports a tooth. The alveolar bone and periodontal tissues formed in conjunction with a tooth are linked to the root surface by collagen fibers of the PDL [1,2]. Fibroblasts are the main cell type of the PDL, which additionally includes epithelial cells and undifferentiated mesenchymal stem cells [3]. PDL cells have been extensively studied in vitro for their differentiation into osteoblast-like cells and their supportive role in osteoclastogenesis. These cells can contribute to both osteogenesis and osteoclastogenesis [4]. Human PDL cells have the characteristic phenotype of osteoblast-like cells [5] and can initiate mineral-like nodules in vitro [6]. PDL fibroblasts (PDLFs) can attract osteoclast and odontoblast precursor cells, and these cells move to the bone and root surfaces and can cause bone and root resorption [7,8,9].
Orthodontic tooth movement (OTM) by orthodontic forces is based on the principle that a tooth moves into a bone. Excess mechanical stress may induce side effects during orthodontic treatment. If the roots and alveolar bones are extensively resorbed following excess mechanical stress, unplanned tooth mobility and inflammation can occur. Although multiple factors are thought to contribute to the development of side effects, the cause is still unknown.
The palmitoylation of the hedgehog (Hh) family of morphogens, named sonic hedgehog (Shh), desert hedgehog (Dhh), and Indian hedgehog (Ihh), is important for effective short-range and long-distance signal transmission. Hedgehog acyltransferase (Hhat) links palmitic acid molecules to Hh. Therefore, the variation in Hhat causes the expansion of the phenotype. Hh are members of the secretion signal transmission protein family mediating growth and pattern formation during embryo generation [10,11]. These proteins function as morphogens and form a signal transmission incline for long-distance and short-range interaction [12]. This phenomenon is developed by differentiation of intestinal epithelium cells, and Ihh and Shh send a signal to a patched (PTCH) receptor. The active form for the Hh ligand reduces the inhibition effect on the G-protein-coupled receptor Smoothened (SMO) when interacting with PTCH and activates the zinc finger glioma-associated oncogene transcription factor (GLI). The Hh signal transmission derives the maturity of the osteoclast indirectly and promotes bone resorption [13]. In another in vitro study, Shh upregulated the Osx expression in the osteoblastic stock [14] and increased the production of osteoblasts, and it raised the activity of the osteoclast indirectly. As a result, bone resorption increased, and it was shown that bone strength decreased [13,14,15]. The extreme expression of Hh and the Wnt/β- catenin signal transmission causes either ectopic ossification in insufficient osteoplasty or soft tissue in frame-like osteoporosis.
The osteoblasts promote differentiation of the osteoclast by producing receptor activator nuclear factor κB (RANK) and interacting nuclear factor κB receptor activation factor ligand (RANKL) on the surface of the osteoclast progenitor cell [16,17]. However, these cells express osteoprotegerin (OPG), which is the decoy receptor of the RANKL. OPG inhibits activation of NF-κB, which is a central and fast-acting transcription factor for differentiation to the osteoclast in immune stimulation, and the precursor cell by binding to RANKL [18]. It has been reported that cytokines, IL-6 in particular, affect the RANK-RANKL-OPG system to promote differentiation of the osteoclast [16].
Mammalian Hh with the broadest expression pattern including developing nervous system, limbs bud, skin, and the bowels has been studied in Shh. The Shh pathway plays an important role in activation with differentiation of the osteoclast [19]. The Ihh signal pathway is a development and an important adjustment factor of homeostasis [20], and it is necessary to strengthen Ihh signal transmission to promote bone formation [21]. The expression of Dhh is mainly found in the gonads and testes, and some expression is found in peripheral nerves and the pancreas. Among Hhs, Shh may be associated with root and bone resorptions in the development of side effects during orthodontic treatment. However, the relationships Shh has with the production of IL-6 and RANKL, which are involved in root resorption and bone resorption, have not been clearly demonstrated in previous studies. In this study, we investigated the stress responses of PDLF cells and the relationships between Shh, RANKL, and IL-6 in PDLFs exposed to weights corresponding to optimal and heavy orthodontic forces in vitro. As a control, human periodontal gingival fibroblast (HGF), which does not play a role in root resorption, was also used for the research of responses to mechanical stresses. The relationships were indicated by changes in cell morphology, cell activity, and expression of the RANKL and IL-6 genes and proteins. These results may be helpful for clarification of the mechanisms involved in the development of side effects caused by mechanical stress during orthodontic treatment. Therefore, it may be possible to identify targets for the prevention of the side effects of orthodontic treatment.

2. Materials and Methods

2.1. Cell Culture and Application of Compression Force

We purchased cells of human PDLFs (Number: 2630, Lot: 22328, ScienCell Research Laboratory, Carlsbad, CA, USA) and human periodontal gingival fibroblasts (HGFs, KF-4309, Kurabo, Osaka, Japan), as typical cells, which are isolated from human periodontal tissue. A cells were used as an another PDLF. The A cells were collected from the roots of premolars extracted from one young volunteer (21 years old) during course of orthodontic treatment after obtaining informed consent from the donor, and the PDLFs were used according to a protocol examined by the Ethical Review Board of Nihon University School of Dentistry at Matsudo (EC 20-036). Human gingival epithelial Ca9-22 cells were also obtained from the JCRB cell bank (RIKEN, Saitama, Japan) and used as a second control. Second- to fifth-passage human PDL cells were seeded in duplicate into a Petri dish (100-mm) and cultured to confluence prior to further experimental stimulation in α-MEM containing 10% fetal bovine serum and 1% antibiotics (diluted from a stock solution containing 10,000 U/mL of penicillin and 10,000 U/mL of streptomycin; Biochrom AG, Berlin, Germany) at 37 °C in an atmosphere of 100% humidity, 95% air, and 5% CO2 [22]. The culture medium was changed to 1% FBS α-MEM with penicillin and streptomycin, and a cover glass and weights were placed—for the optimal orthodontic force group (1.0 g/cm2) and the heavy orthodontic force group (4.0 g/cm2)—on the top of the PDLF and HGF cell layers for 2, 4, 6, 8, 12, and 24 h cultures [23,24]. A cover glass (0.052 g/cm2) was only placed for the control of the weight, and a combination of no glass and no weight was also used as a negative control. For clarification of the role played by Shh in the effect of weight on the production of RANKL and IL-6, 10 mM of Shh inhibitor (RU-SKI 43, Med Chem Express, Monmouth Junction, NJ, USA) was added in the culture of PDLFs with weight and the controls [25]. RU-SKI 43 is a potent and selective hedgehog acyltransferase (Hhat) inhibitor with an IC50 of 850 nM. RU-SKIs inhibit Shh palmitoylation in vitro [25]. RU-SKI 43 decreases proliferation and the Gli-1 activation of the cancer cells of the pancreas through noncanonical signal transmission not dependent on Smoothened [26]. Therefore, RU-SKI 43 was selected among the inhibitors because RU-SKI 43 is an inhibitor of the sonic hedgehog signal and inhibits the first signal of sonic hedgehog. After 24 h, 2.0 × 10⁶ of CA9-22 cells, 1.6 × 10⁶ of hPDLF cells, and 1 × 10⁶ of A cells and HGF cells were propagated on the dish.

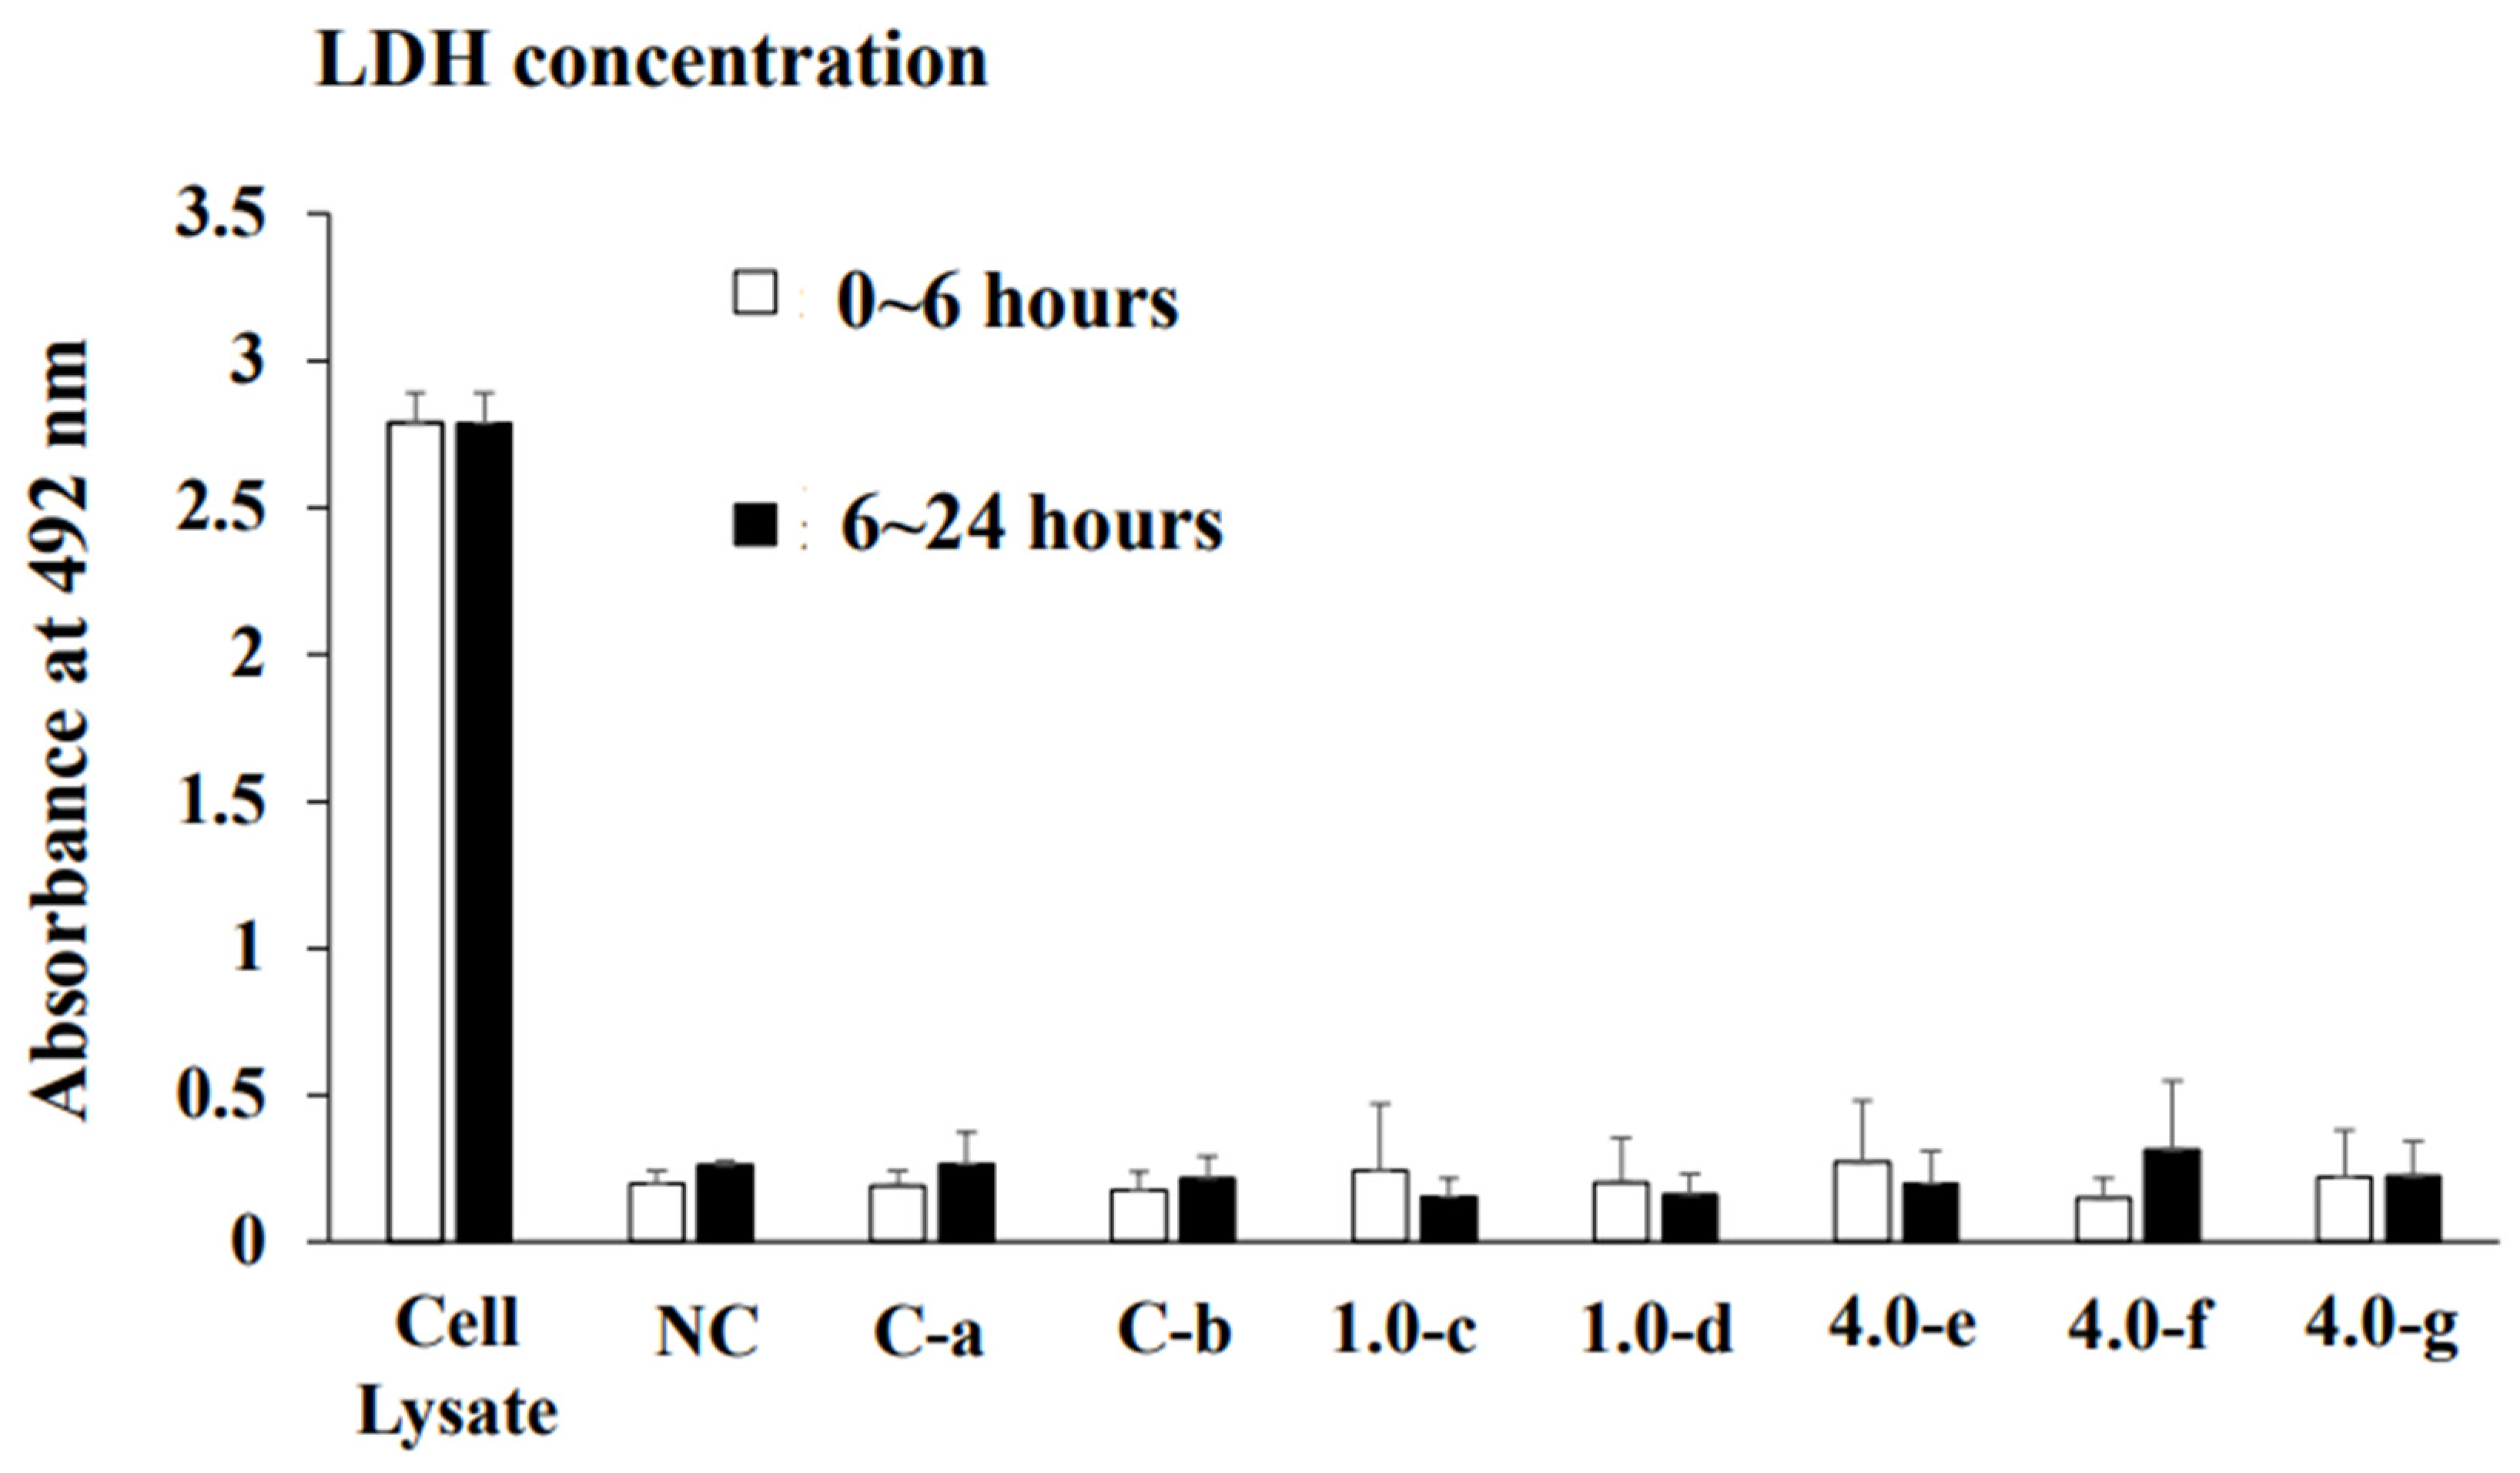
2.2. Measurement of Lactate Dehydrogenase (LDH)

LDH is widely used both in vivo and in vitro as a marker of cell death. The release of LDH to a tissue culture nutrient medium exactly reflects in vitro cell survival rate. We investigated the relationship between cell density and total LDH activity in cell culture supernatant samples. LDH was measured by the Cytotoxicity LDH Assay kit-WST (Dojindo Molecular Techbologies, Inc., Kumamoto, Japan).

2.3. Measurement of Cell Viability by MTT

Four ml of MTT (Sigma Chemical Co., Dorset, UK), 500 μg/mL in PBS were added to HGF, PDLF, A cells, and Ca9-22 cells in each Petri dish at 24 h after incubation. The cells were incubated for 3–4 h at 37 °C, under CO2. After 3–4 h, these cells turned a purple color from the formal form of the cells. MTT was discarded, two mL of dimethyl sulfoxide (Wako Pure Chemical Industries Ltd., Osaka, Japan) was added to each Petri dish. The plate was wrapped using aluminum foil, left for 24 h at room temperature, and then re-absorption of 492 nm was performed using a microplate absorbance meter (Corona Electronic, Ibaraki, Japan).

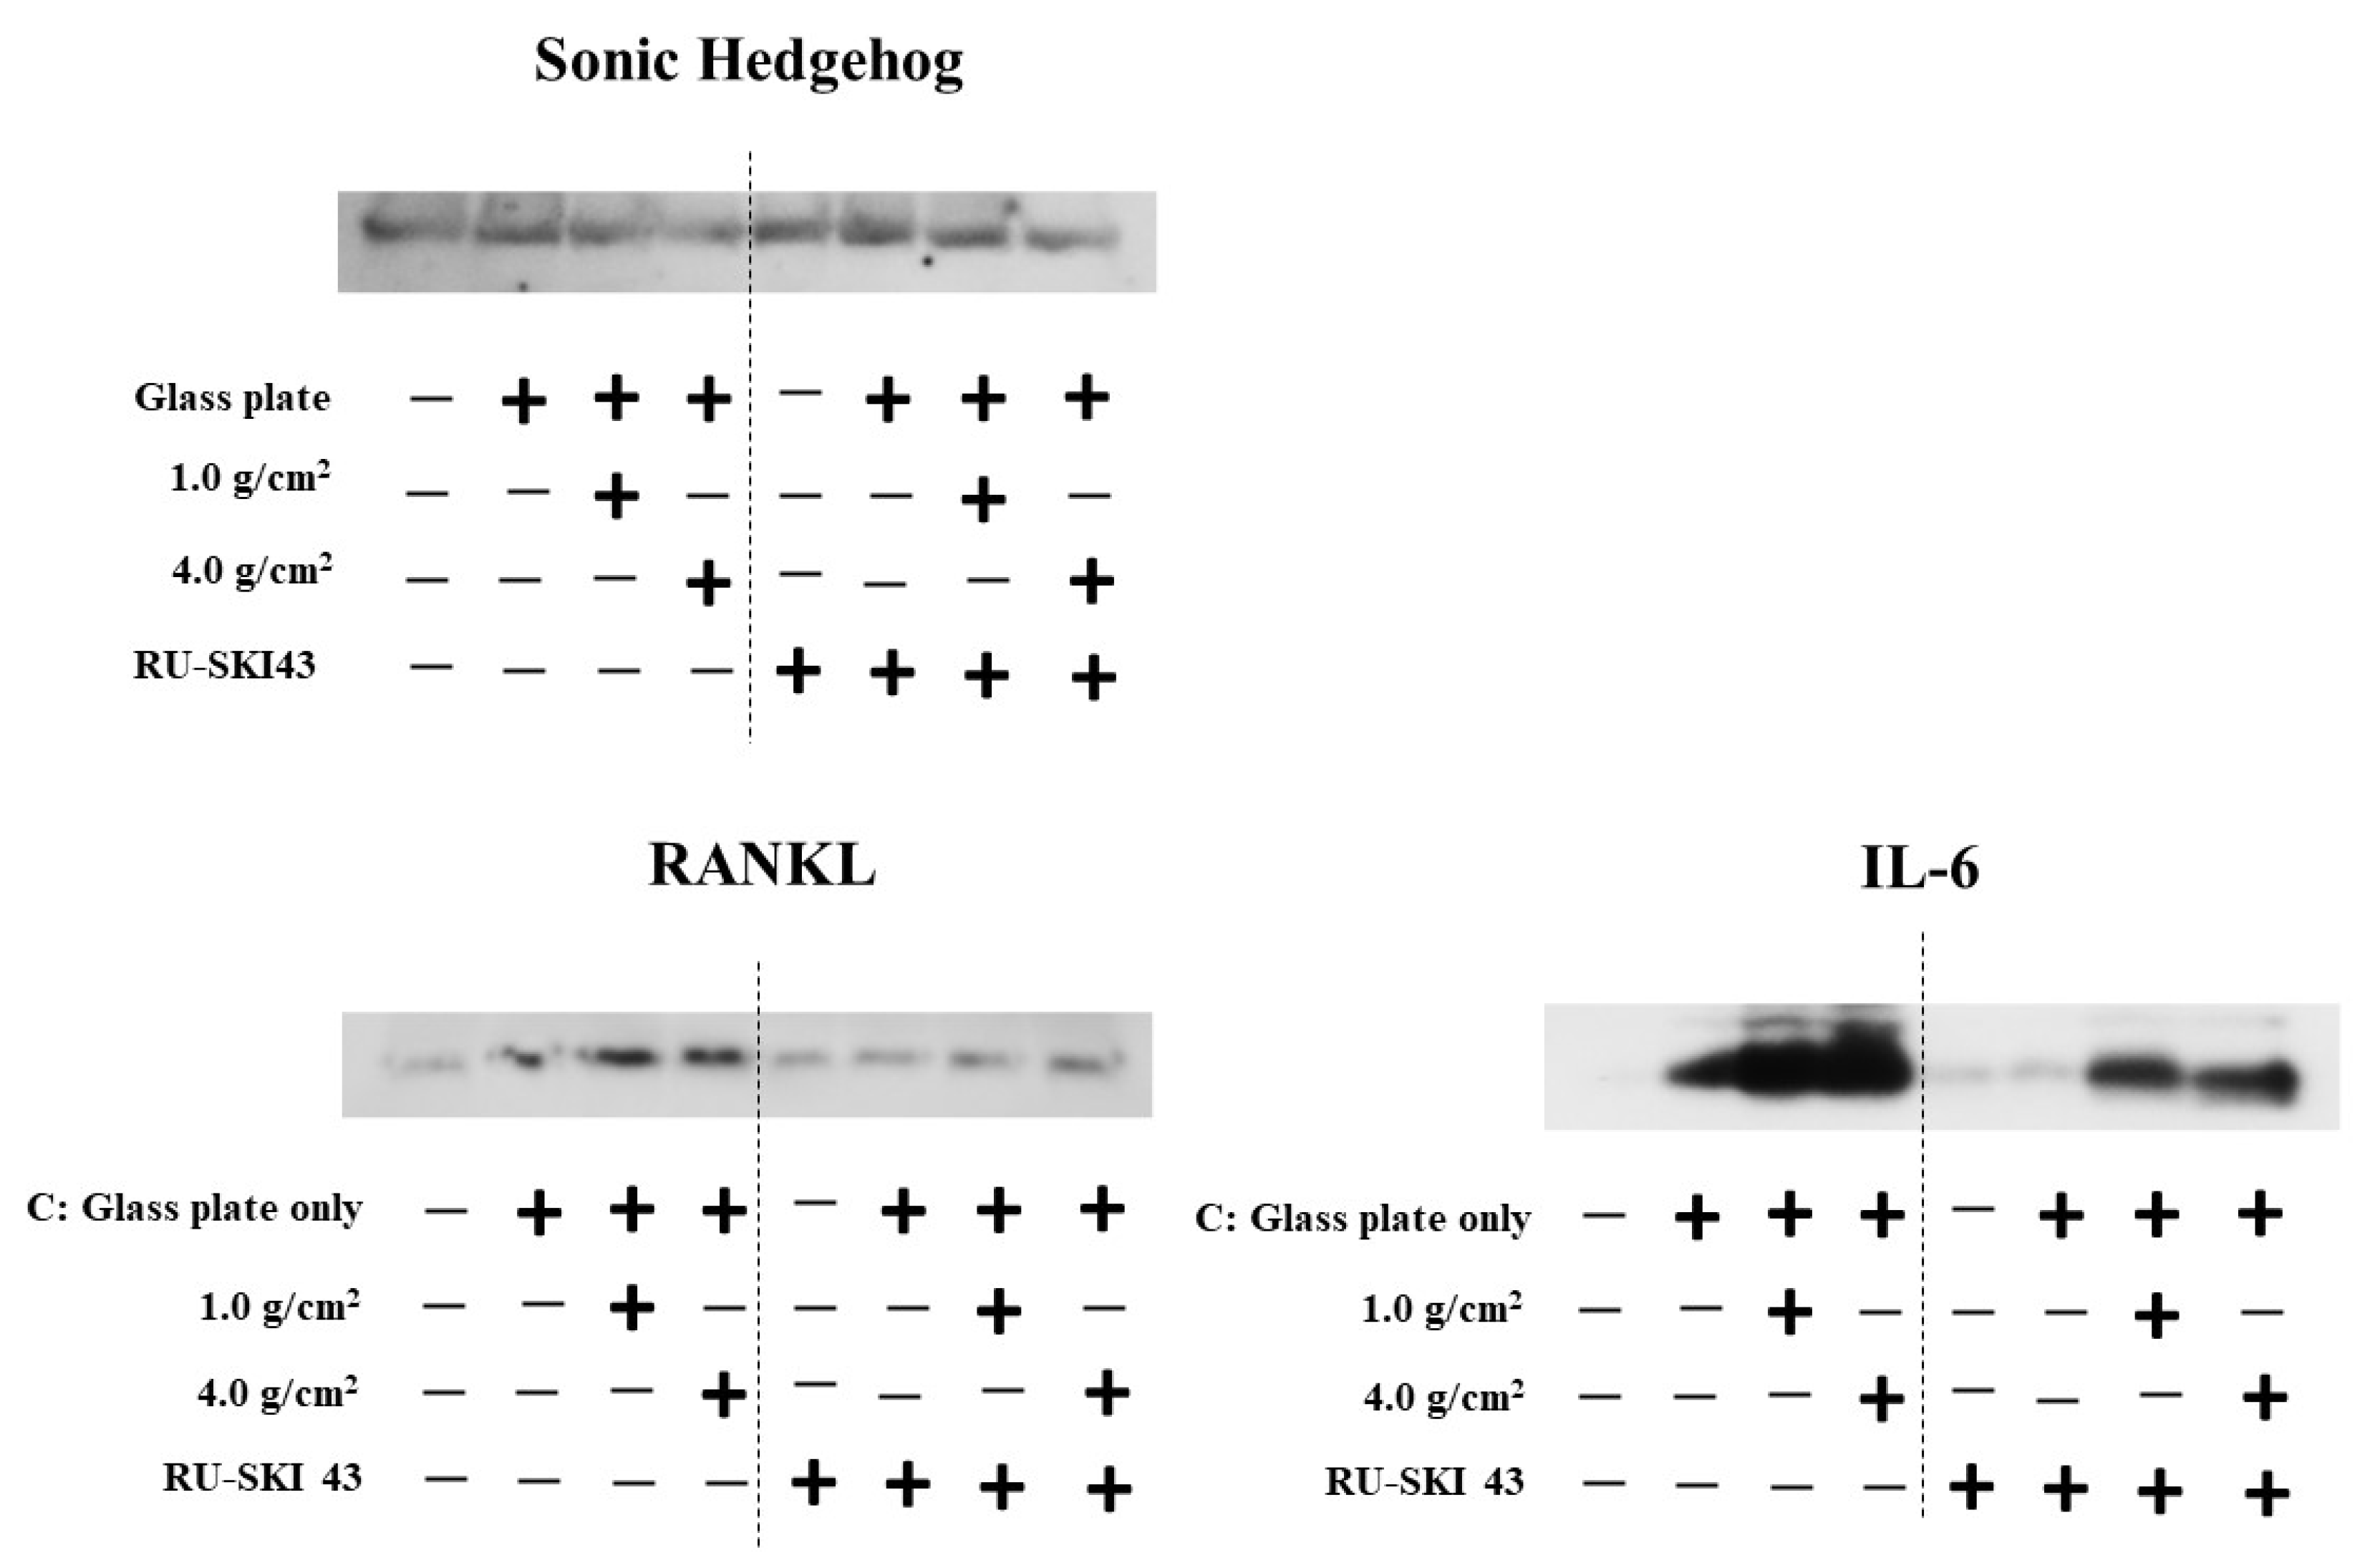
2.4. SDS-PAGE and Western Blotting

At 6 h after culture start, culture supernatants were extracted as a 0~6 h sample and fresh 10%FBS α-MEM were added, and the culture was continued. At 18 h after culture re-start, culture supernatants were extracted as a 6~24 h sample. Therefore, the 0~6 h sample included products from cell stimulation for 0~6 h. The 6~24 h sample included products from cell stimulation for 6~24 h. Before electrophoretic analysis, these culture supernatants were concentrated by a centrifugal filter (Amicon®Ultra-15, 50 kDa, Merk Millipore Ltd., Burlington, MA, USA) with more than 50 kDa and diluted to 100 μg in 10 μL with an equal volume of SDS-PAGE buffer {0.06 M Tris-HCl (Amersham Pharmacia Biotech, Buckinghamshire, UK), pH 6.8 of the UK, 20% glycerol (Wako), 1% (w/v) SDS (Wako), 1% 2-mercaptoethanol (2-ME, Merck kGaA, Darmstadt, Germany), and 0.0012% of bromophenol blue (Wako)}. The SDS-PAGE sample was heated to 100 °C for 5 min before it was loaded to a gel. The samples were then separated into 12.5% polyacrylamide gel (e-PAGEL, ATTO Corp., Tokyo, Japan) in 0.025 M Tris-HCl, 192 mM glycine (Wako) and 0 or 0.1% (w/v) SDS. The separation by electrophoresis of the protein was carried out at 25 mA for 80 min. The staining of the gels was performed with Coomassie Brilliant Blue (CBB, Wako).
After SDS-PAGE, the proteins in the gel were transferred to Immobilon PVDF membranes (Millipore, Bedford, MA, USA), and the membrane were blocked with 2.0% skimmed milk in TBST (50 mM Tris, 2.7 mM KCl, 0.138 M NaCl, 0.05% Tween 20, pH 7.6) for 1 h at room temperature. The membranes were applied with anti-Shh antisera (Bioss Antibodies, Woburn, MA, USA), anti-RANKL antisera (Bioss Antibodies), and anti-IL-6 antisera (Protein Tech Group Inc., Rosemont, IL, USA) from rabbit in 1.0% skimmed milk/TBST overnight at 4 °C. After washing with TBST, HRP-labeled anti-goat secondary antibodies to rabbit IgG (Merck kGaA) were also applied to react with the target proteins. Optical emission responses to the target proteins were identified by chemiluminescence (ECL Plus Western Blotting Substrate, Thermo Scientific, Southfield, MI, USA) and detected by exposure to X-ray film (FUJI FILM, Kanagawa, Japan) for different times. Protein bands were quantitatively measured by ImageJ, 1.53t (NIH, MD, USA). The measurement range of brightness was set according to the area of each Shh, RANKL, or IL-6 band, and various controls, weights, and time conditions were compared and examined.

2.5. Quantitative Measurement of RNAKL and IL-6

The productions of RNAKL and IL-6 in culture supernatants were detected by ELISA kit (RANKL: Abcam, Cambridge, UK and IL-6; Wako).

2.6. Total RNA Extraction and Real-Time PCR

PDLF cells were collected following force loading. After incubation for various times, total RNA was taken by an RNeasy Mini Kit (Qiagen, Hilden, Germany). Next, 0.5 µg of total RNA was reverse-transcribed using the Prime ScriptTM RT Reagent Kit (TaKaRa BioInc., Shiga, Japan) to obtain complementary DNA (cDNA).
Quantitative reverse transcription PCR (RT-qPCR) was performed using an ABI QuantStudio 7 Flex (Applied Biosystems, Warrington, UK) using the Power SYBR Green PCR master mix (Applied Biosystems), as previously described [27]. The expression levels of the genes were measured by the relative quantitative comparative threshold cycling method (ΔΔCT). The two kinds of cycling conditions were as follows: initial denaturation cycling conditions of 10 min at 95 °C, 40 cycles of 15 s at 95 °C, and 60 s at 60 °C for the gene of Shh; and 5 min at 95 °C, 45 cycles of 10 s at 95 °C, and 20 s at 60 °C for the genes of RANKL and IL-6. The expression levels were normalized to the GAPDH mRNA (endogenous control). The primers used for qPCR are listed in Table 1.

2.7. Statistical Analysis

Statistical analyses were performed using Statistical Package for Social Sciences (SPSS) statistics 24 (IBM Corporation, Armonk, NY, USA). The results are presented as the mean and standard deviation (SD). The statistical significance of differences between the negative control (no glass and no weigh), the control (glass only), and the 1.0 g/cm2 and 4.0 g/cm2 groups was determined in 2~24 h using one-way analysis of variance (ANOVA) and Bonferroni (IBM SPSS statistics 24) tests. The statistical significance was set at p < 0.05.

3. Results

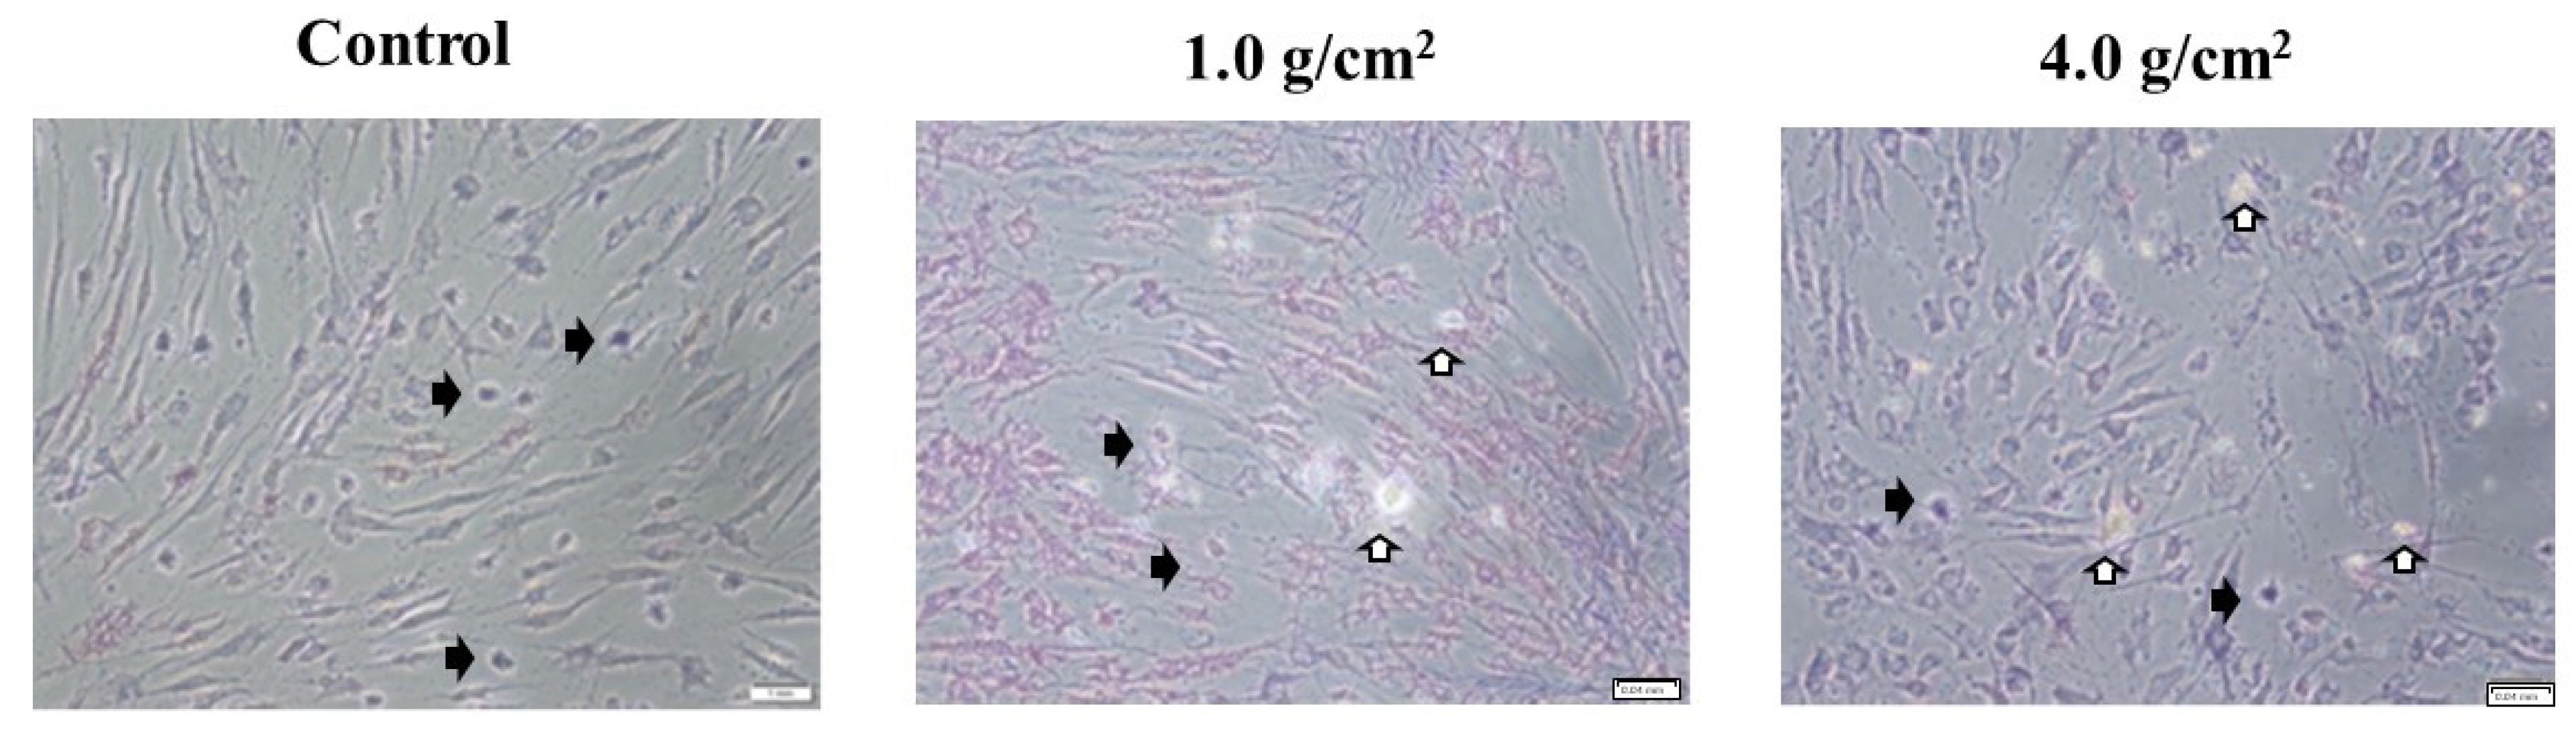
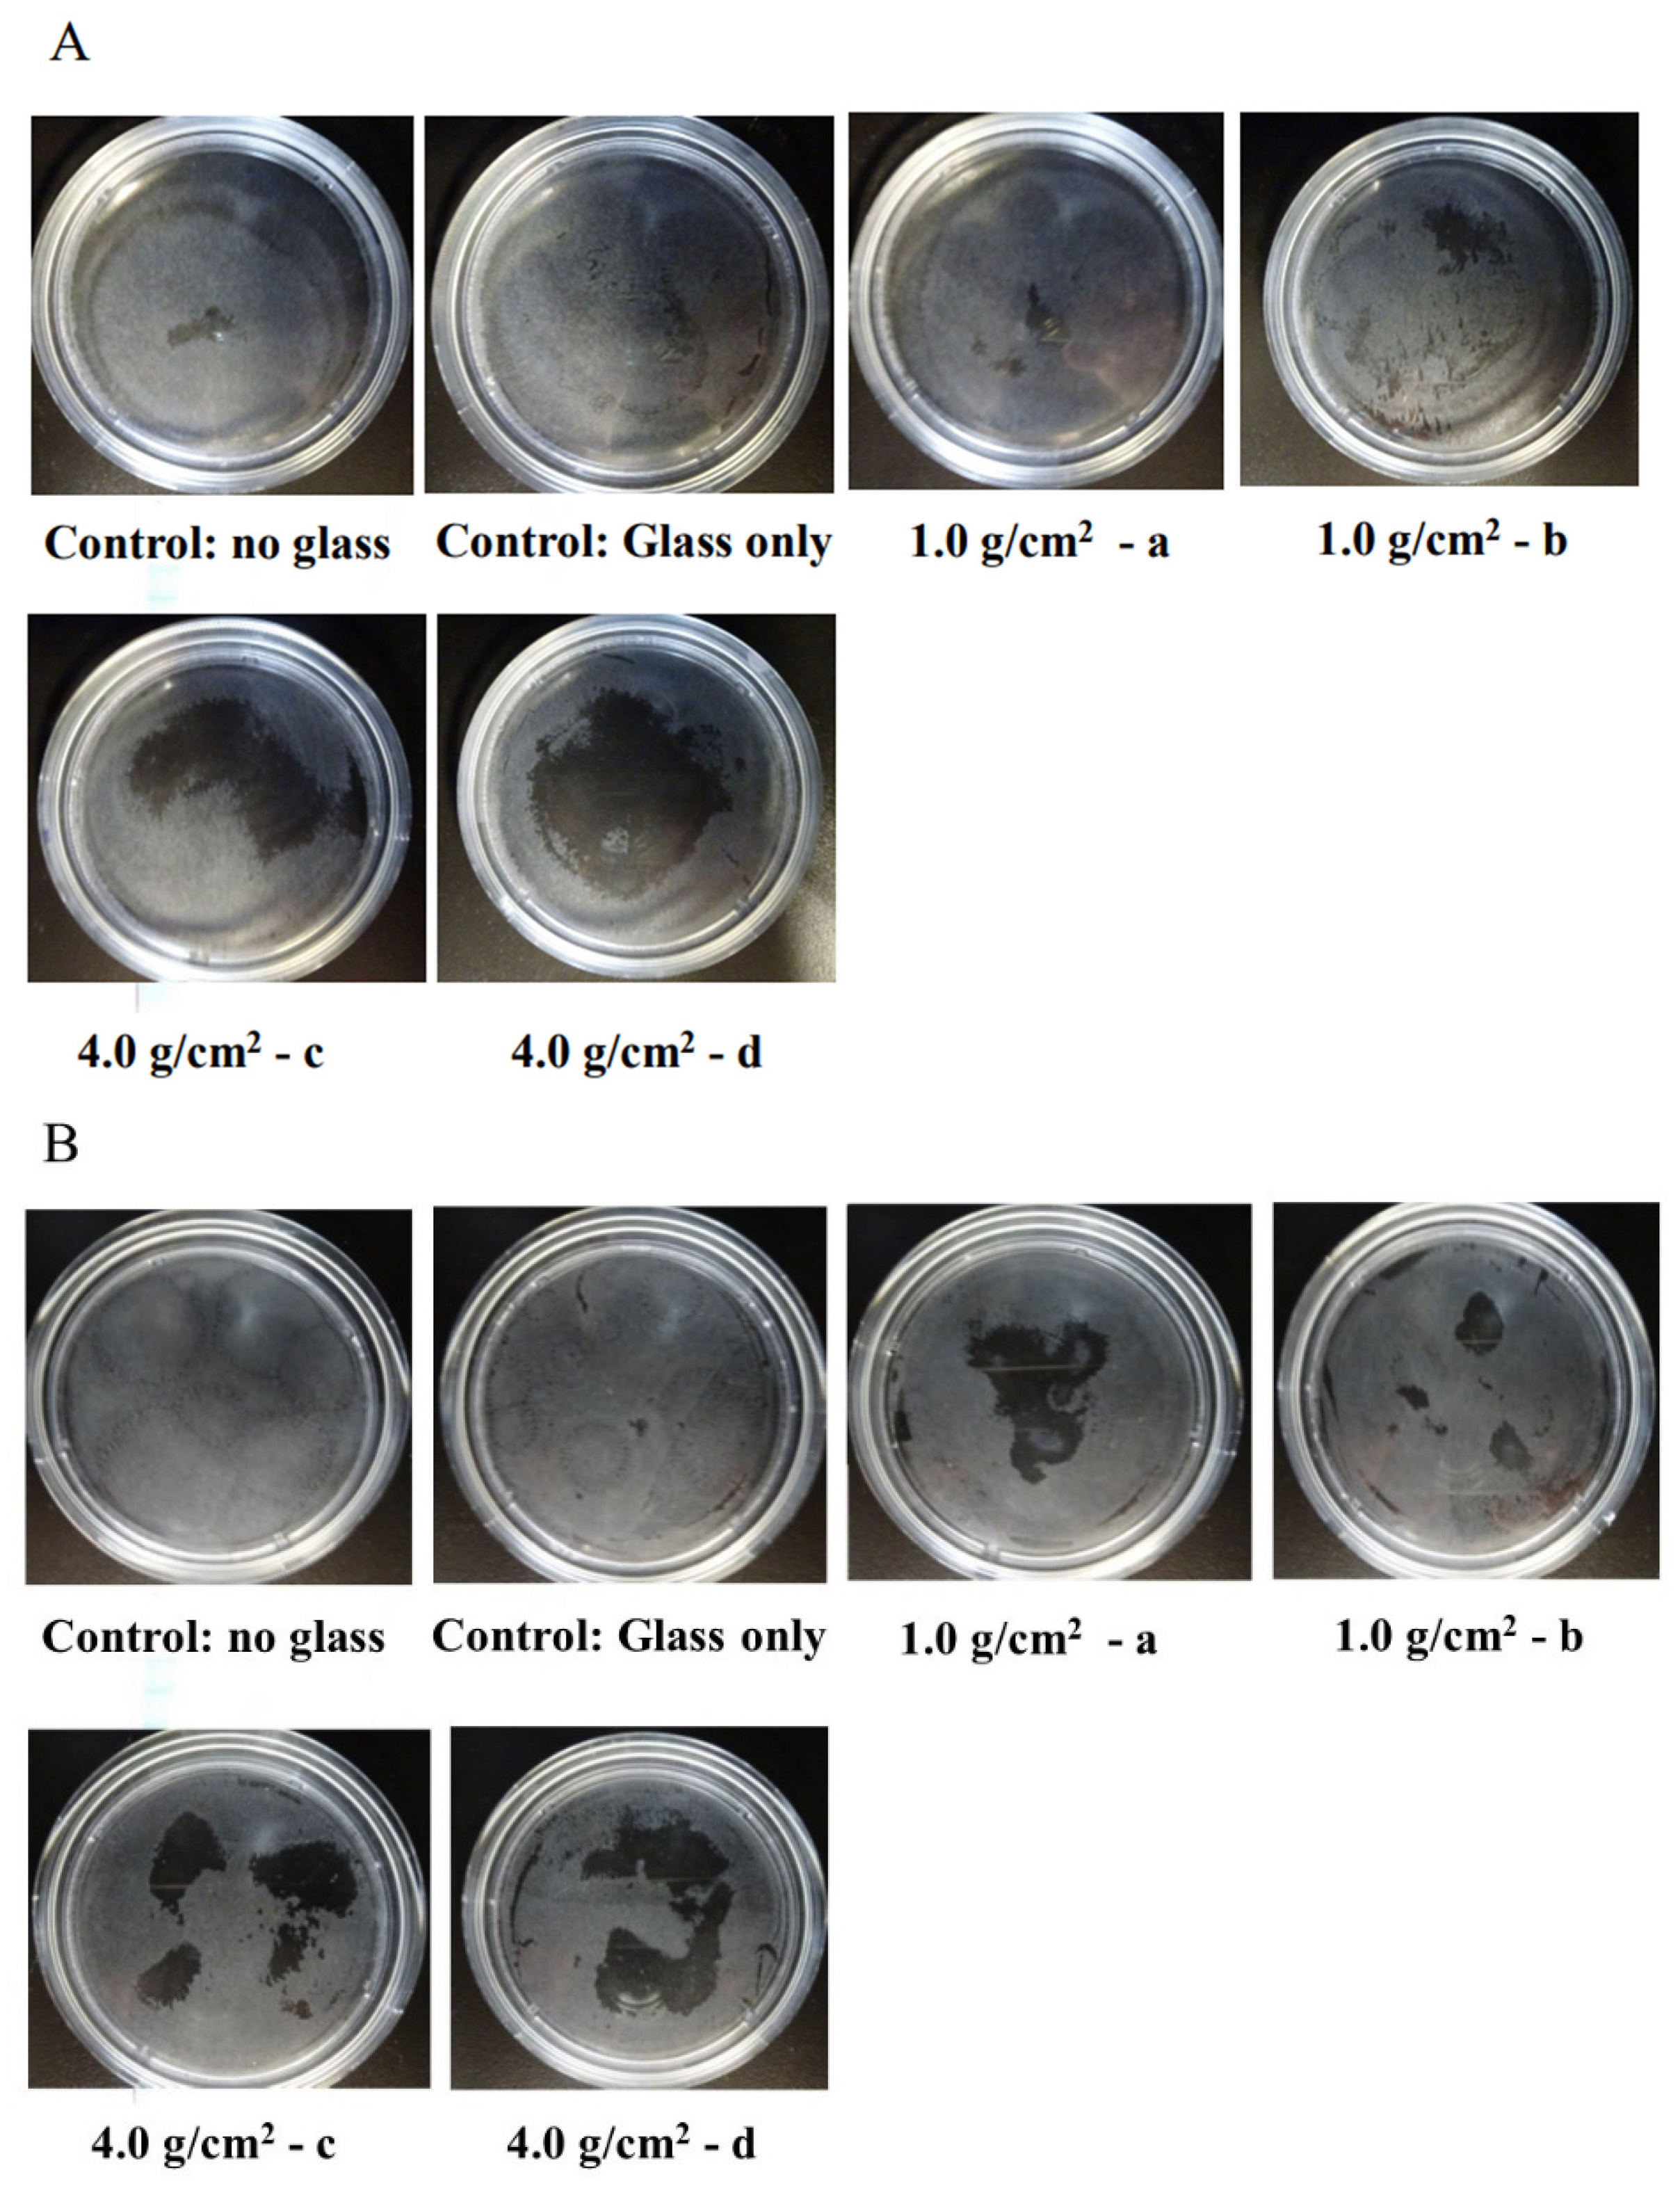
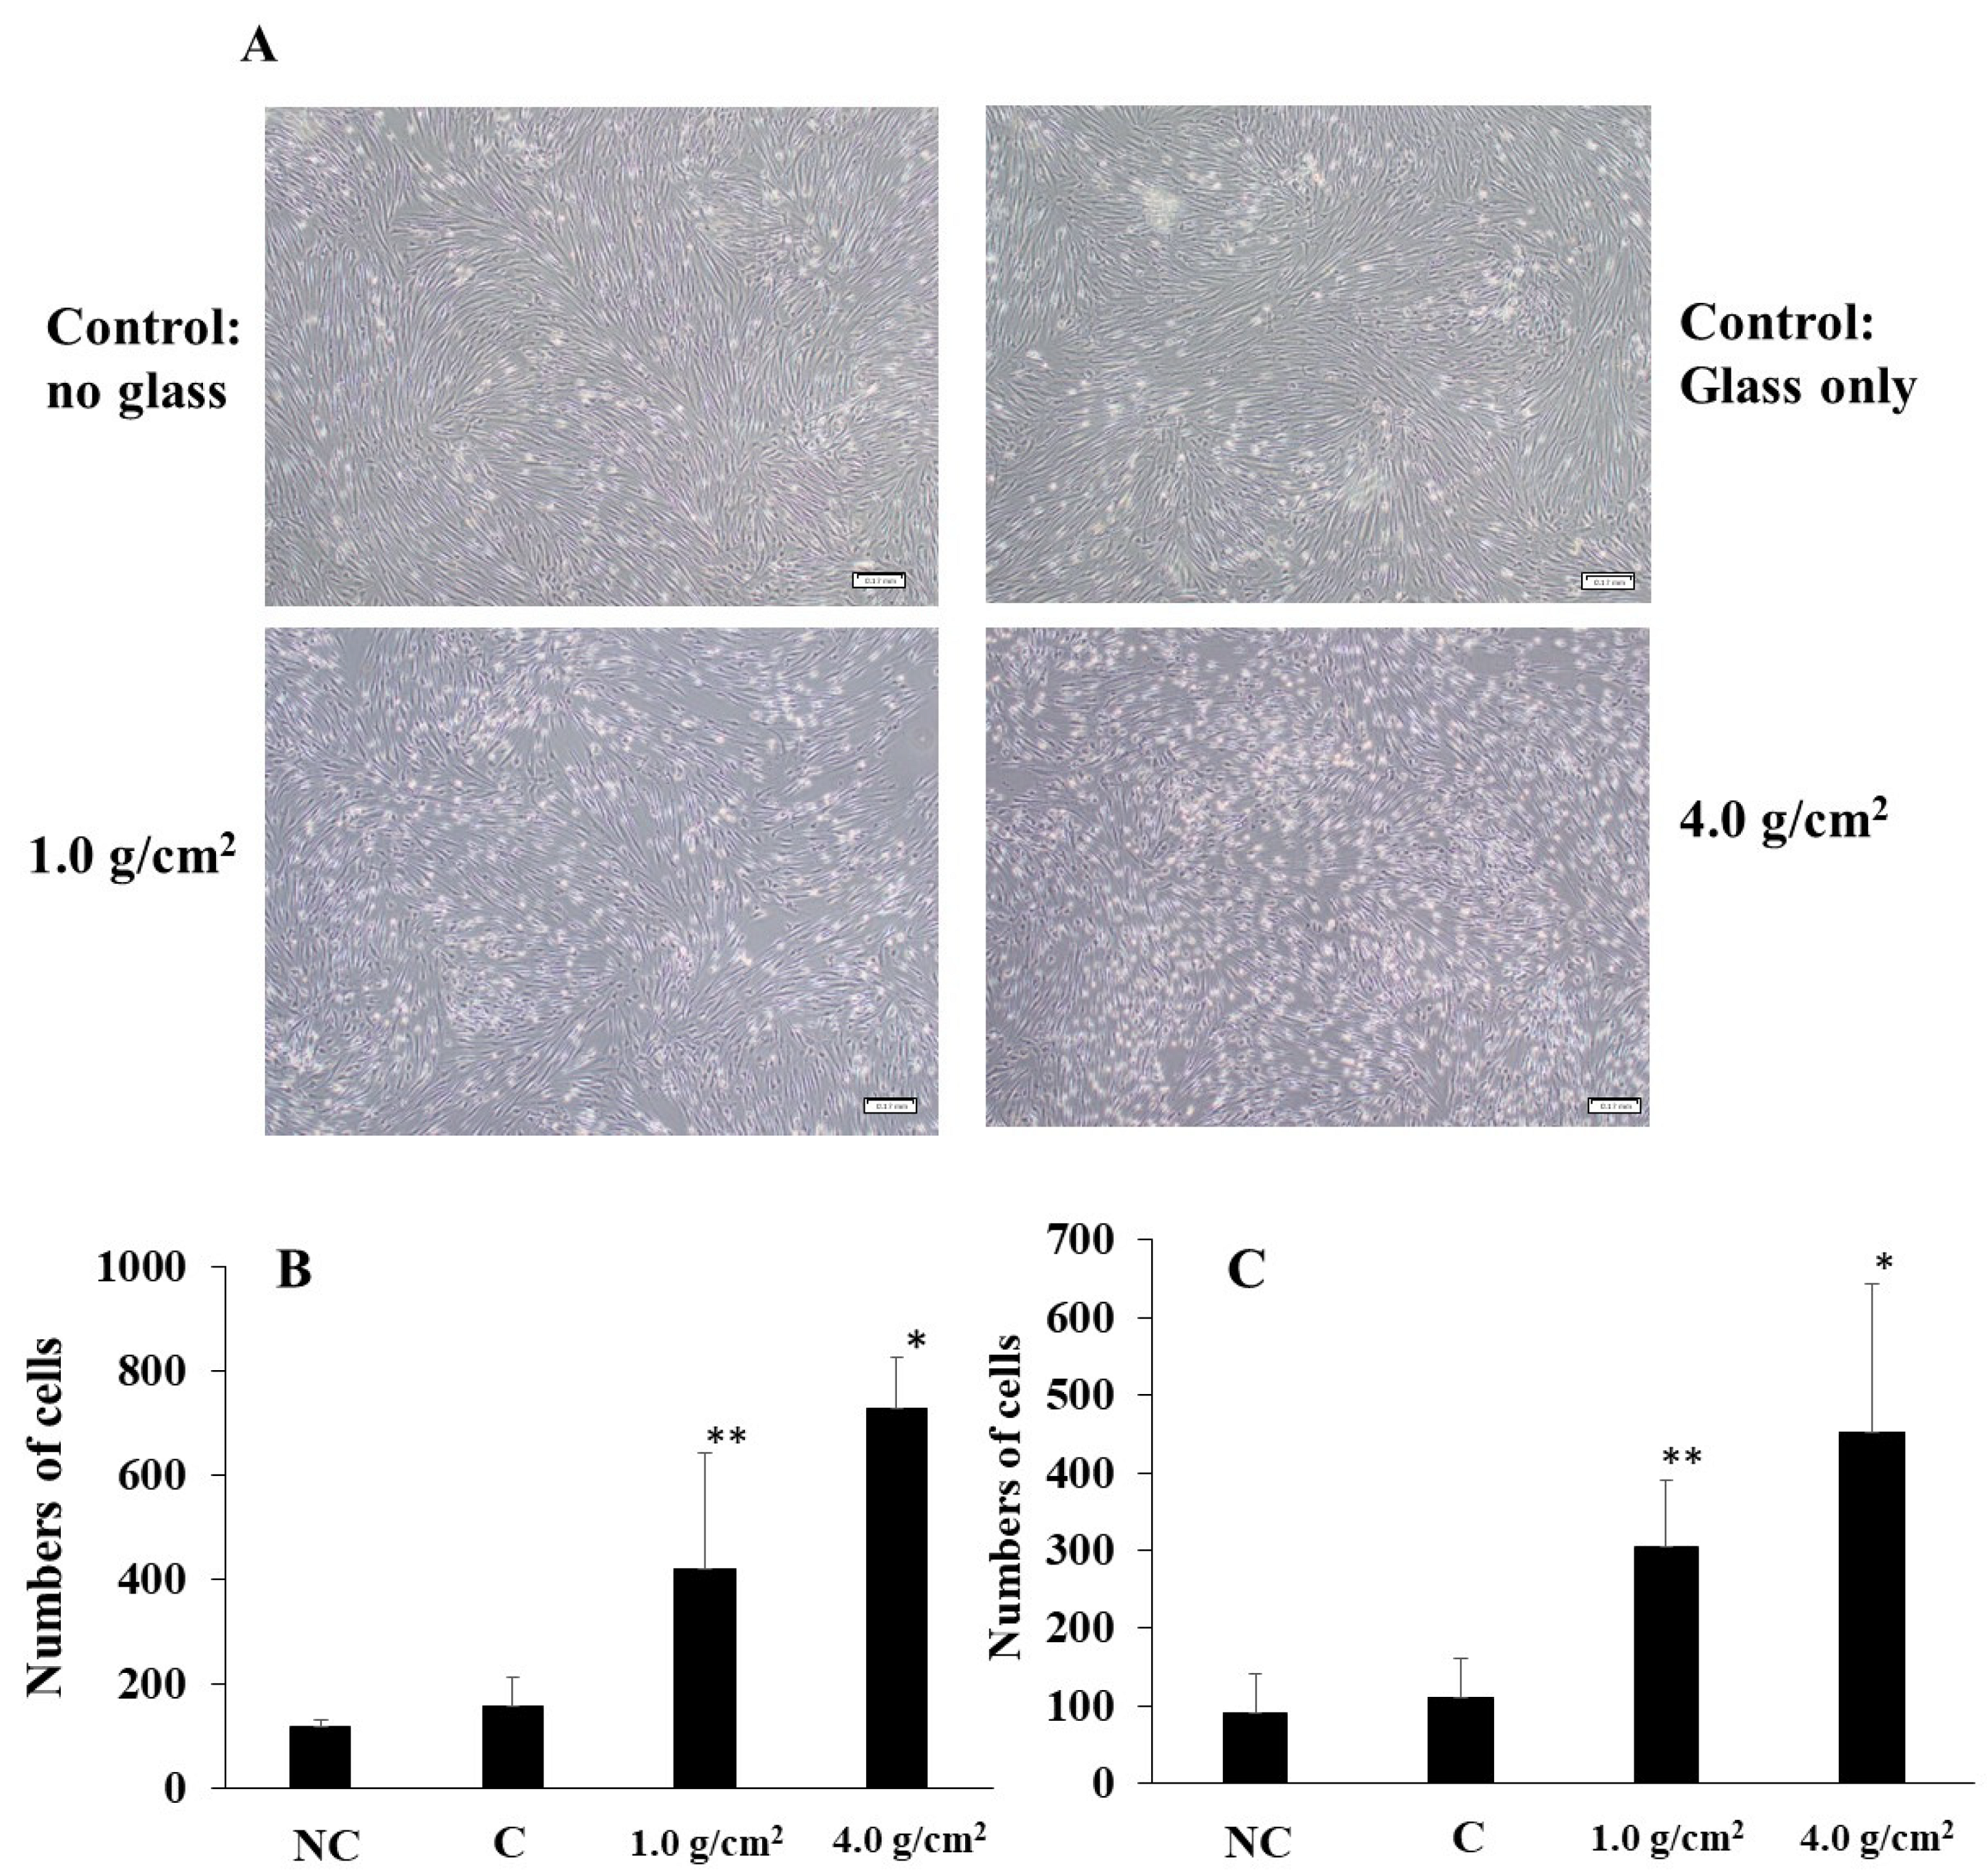
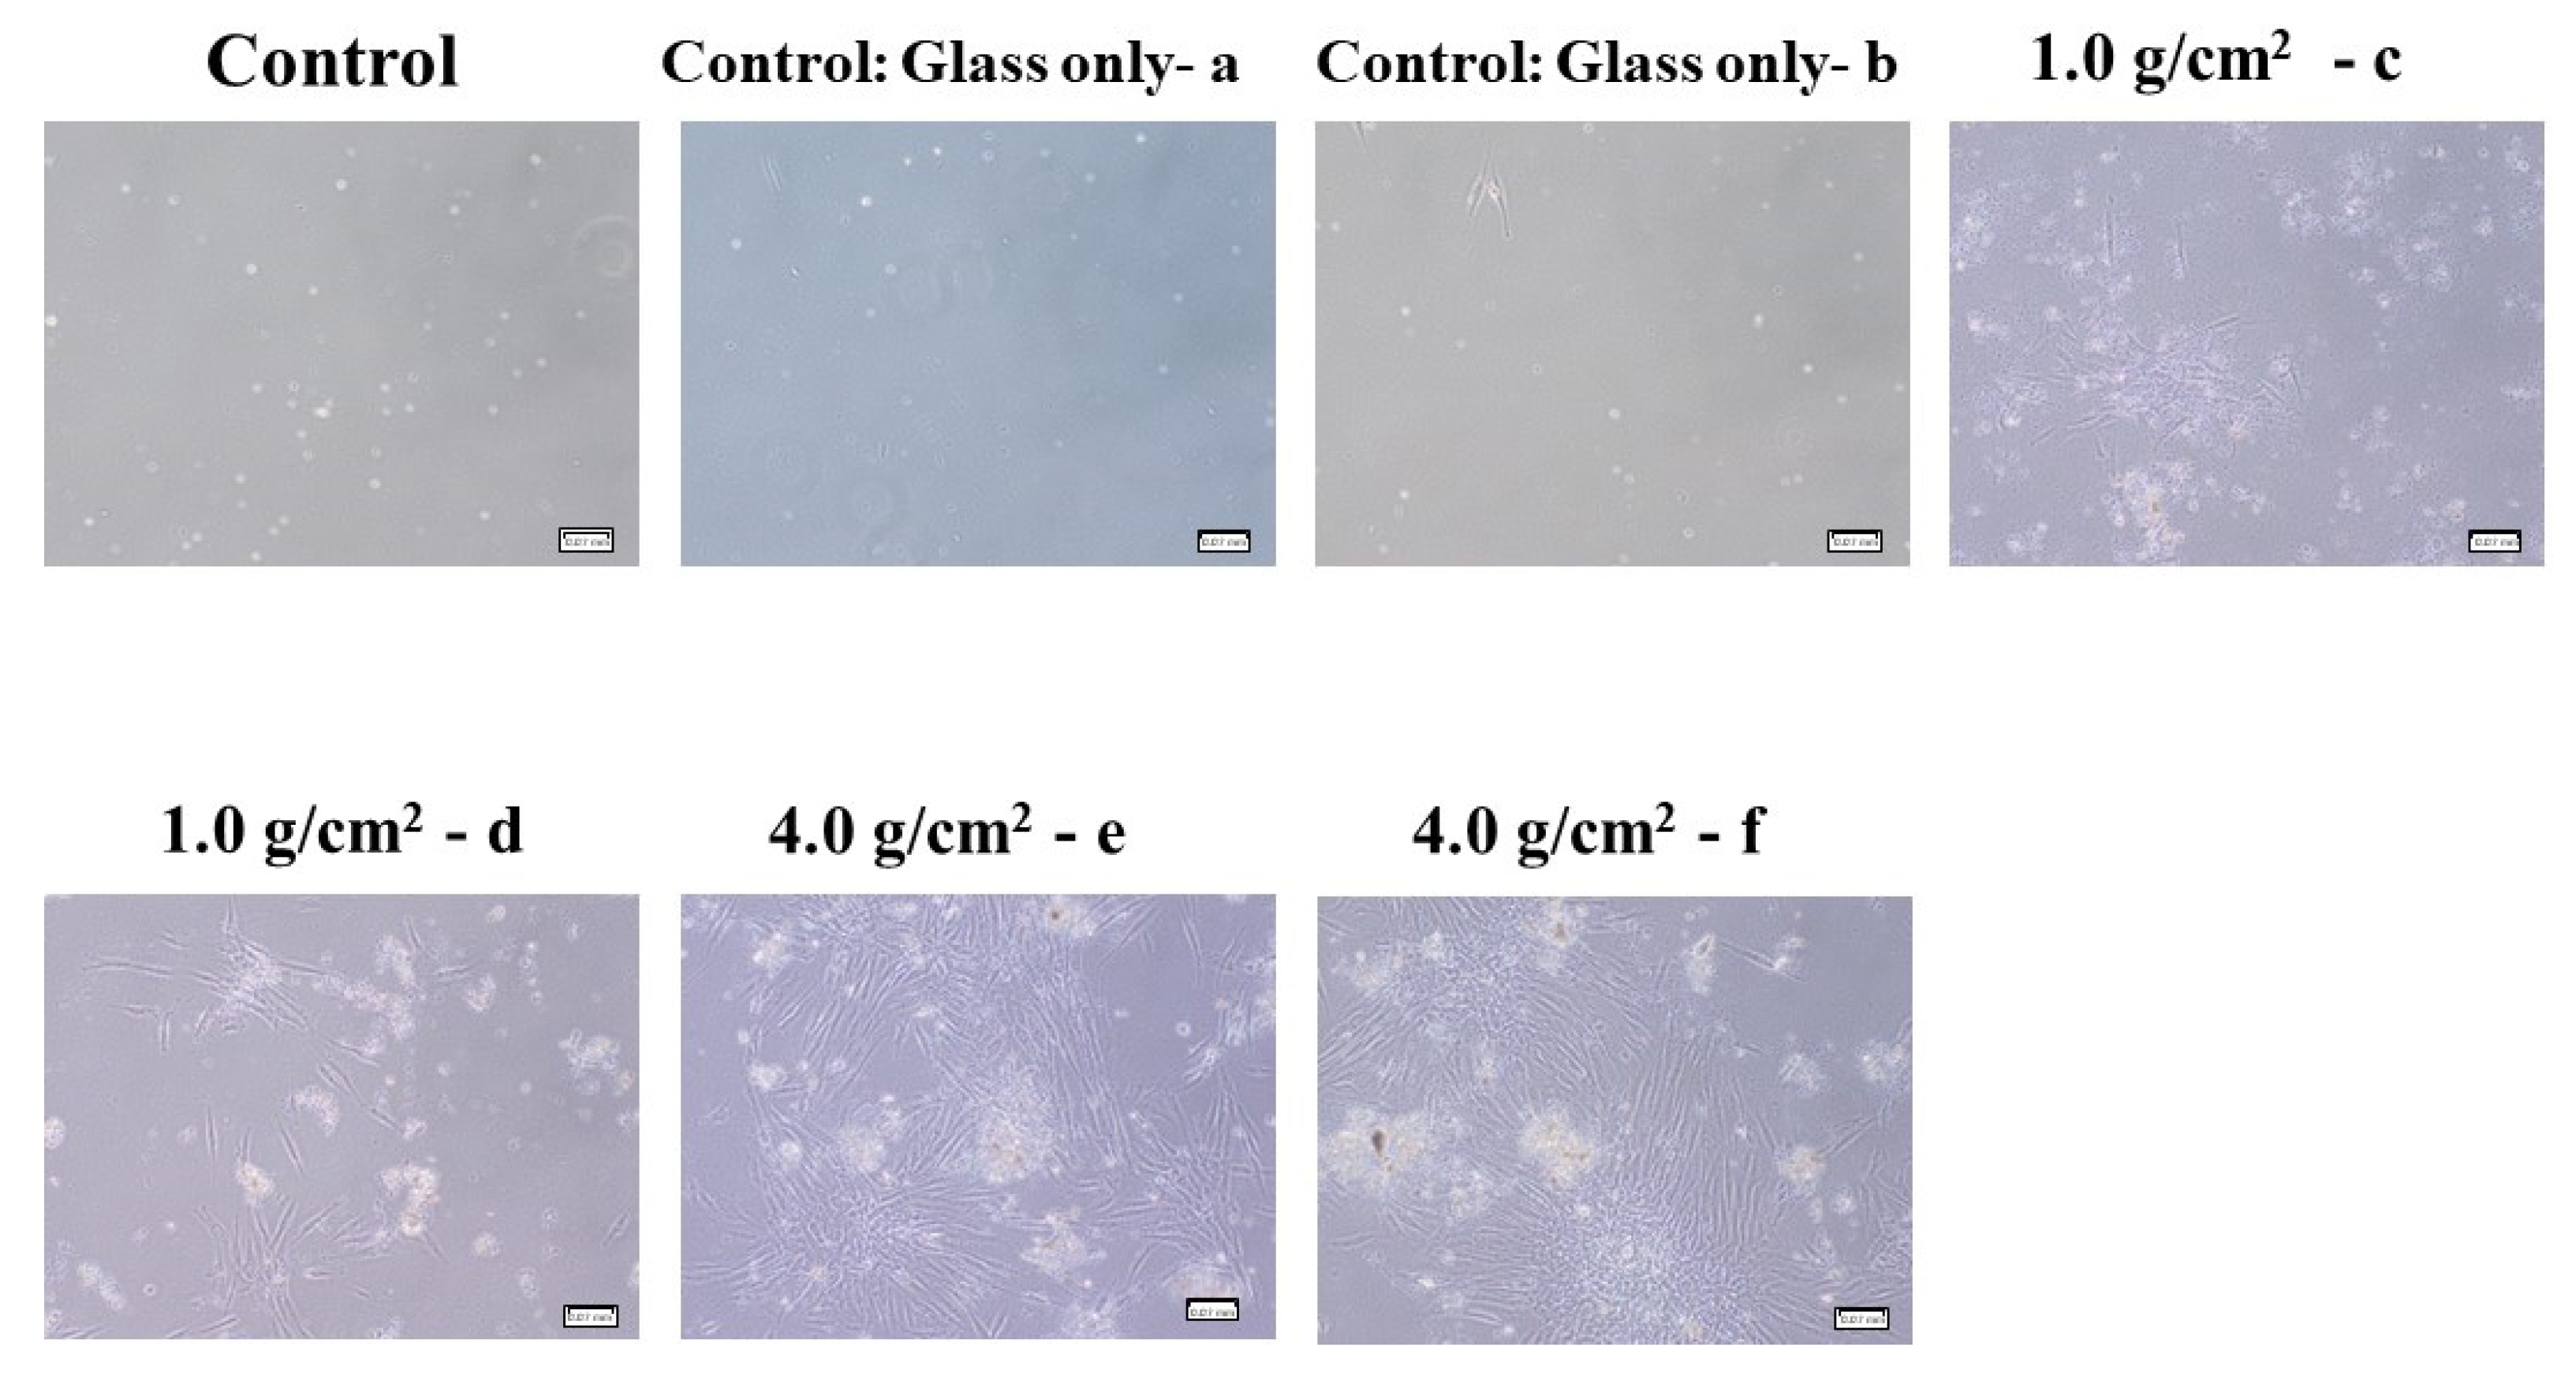
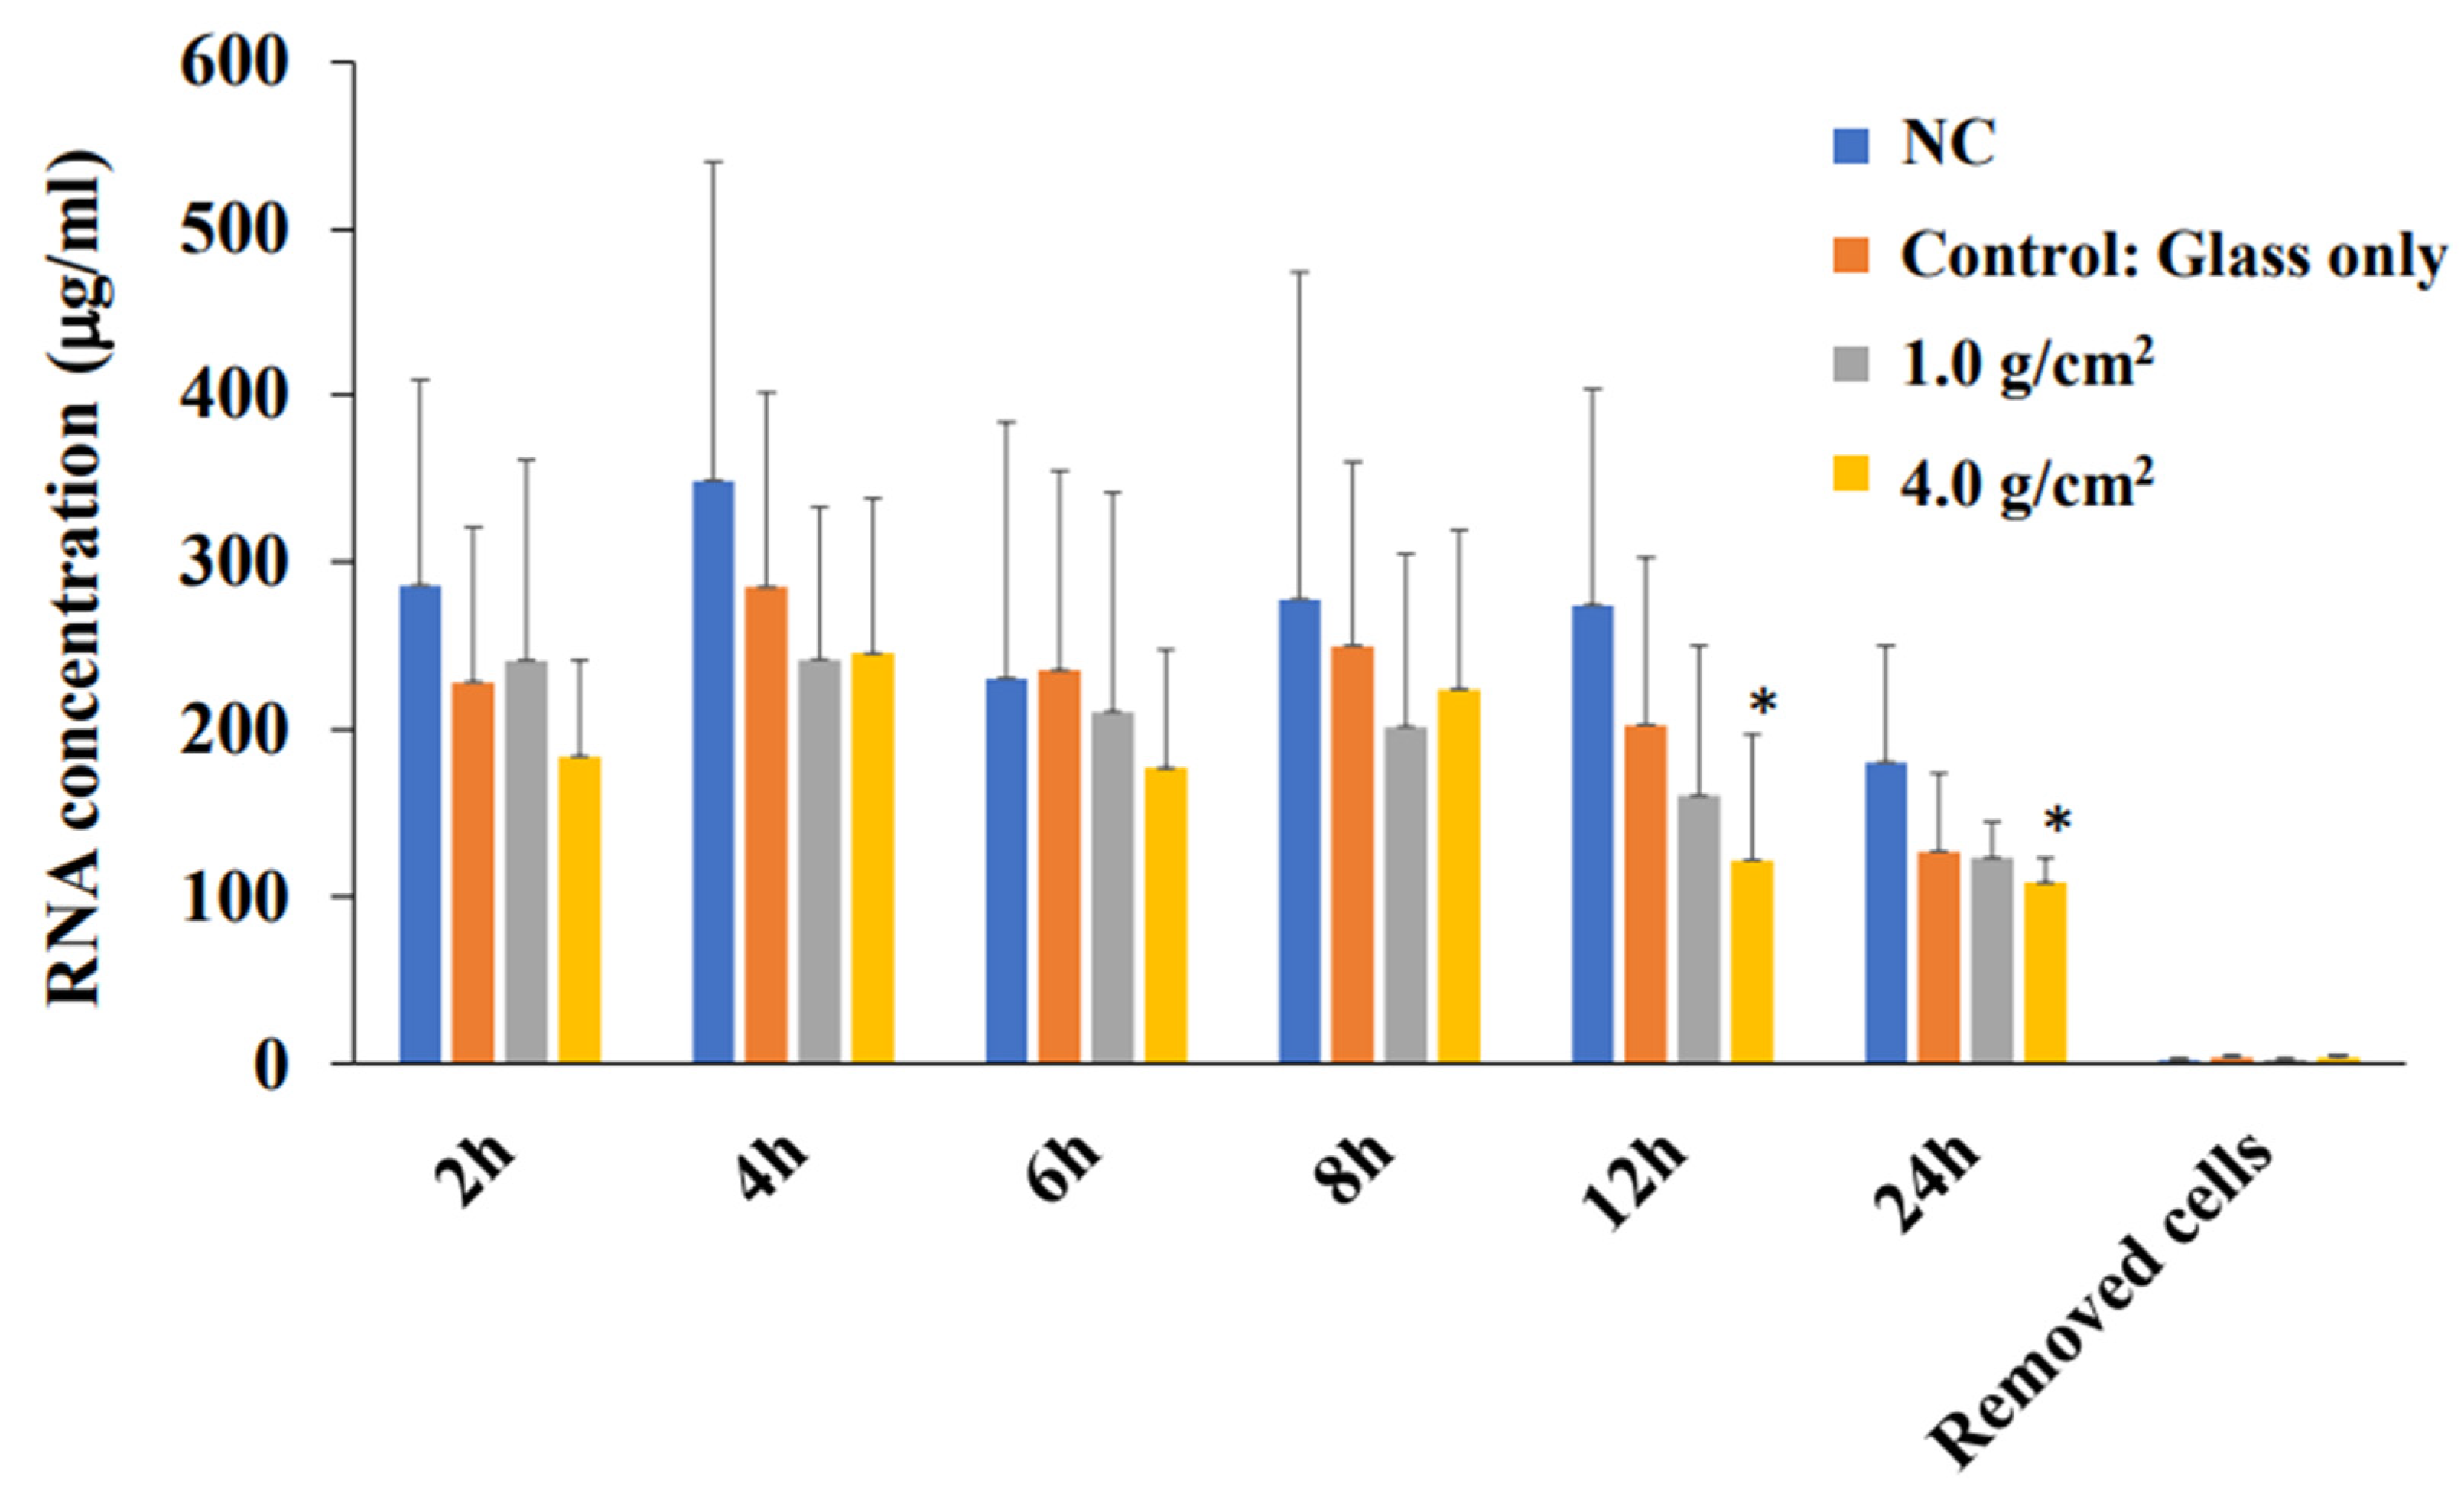
3.1. Effects of Orthodontic Force on the Cell Activities, Adherence, and Morphology

To clarify the effects of compressive force on the expression of Shh, RANKL, and IL-6 in HGF and PDLF, an optimal orthodontic force (1.0 g/cm2) and a strong orthodontic force (4.0 g/cm2) were placed on the fibrosed layers of HGF and the PDLF cells and incubated for 2, 4, 6, 8, 12, and 24 h. The heavy force may repress cell viability and increase the mortality rate of hPDL [24]. First, we observed whether these compression forces damage the cells. HGFs were slightly and strongly detached by 1.0 g/cm2 and 4.0 g/cm2 weights after 24 h of culture, respectively (Figure 1A). In particular, cells were widely removed from the surface of the Petri dish and principally around the center at 24 h. The PDLF cells were largely detached by 1.0 g/cm2 and 4.0 g/cm2 weights in various places and the areas of the detached cells were fused at 24 h of culture (Figure 1B). The levels of the detached areas were larger in the 4.0 g/cm2 weight group than in the 1.0 g/cm2 group. There were no detached cells at 2–12 h in all conditions after culture in either cell line. Therefore, the weight and the pressure time were associated with the removal of the HGF and the PDLF cell fibrosed layers on the surface of the Petri dishes. However, both cell types were not detached by controls (glass only weight and no glass and no weight) (Figure 1A,B). Next, to confirm whether cell morphology was associated with the detachment of cells by weights, we observed PDLFs using an optical microscope after 24 h culture. The cells attached to the Petri dish in the form of fibers, but we confirmed that the number of white round cells appeared to be dependent on the weight (Figure 2A–C). The number of white round cells was significantly higher when a 4.0 g/cm2 weight was placed on the cells than when a 1.0 g/cm2 weight was placed on the cells. The number of white round cells increased, and this change might be the trigger for the detachment of the cells (Supplemental Figures S1 and S2). Therefore, the detachment of the cells is not only due to the physical force when removing the glass but also because the cell shape changes from fibrous to spherical due to the weight. The change in cell morphology may be associated with cell damage induced by the pressure. To confirm whether the detached cells are living or dead cells, we recultured the detached cells in fresh 10%FBS α-MEM on a Petri dish. The cells removed from the 1.0 g/cm2 and 4.0 g/cm2 groups were largely reattached, increased, and showed a fibrous form on the Petri dish (Figure 3). This finding indicates that the detached cells were not dead. LDH, which is released when the cell membrane ruptures and the cells die, was measured in the culture supernatants from PDLF cultures placed with the controls and the 1.0 g/cm2 and 4.0 g/cm2 groups. LDH was not significantly produced in any of the cultures (Figure 4). Total RNA, as an indicator of the activity of the cells, was measured in the cells. However, total RNA was not found in the cells detached from the PDLFs with 1.0 g/cm2 and 4.0 g/cm2 weights (Figure 5). Therefore, the removed cells are in suspended animation and can be reverted to live cells when cultured in fresh medium. To measure cell viability in conditions with weights, an MTT assay was performed in gingival fibroblast (HGF), periodontal ligament fibroblasts (PDLFs and A cells), and epithelial cells (Ca9-22) at 24 h. Viability was significantly decreased by cover glass only (C) compared with NC in all cells, and decreased further still by placement of a 1.0 g/cm2 weight on the cover glass in Ca9-22 and by placement of a 4.0 g/cm2 weight in HGF, PDLF, A cells, and Ca9-22 cells (Supplemental Figure S3). Cell activity was significantly decreased by mechanical stress, including by a light weight such as the glass plate. The decreased levels compared with C were higher for the 4.0 g/cm2 weight than the 1.0 g/cm2 weight, and between C and the 4.0 g/cm2 weight were higher in HGF and Ca9-22 than PDLF and A cells. Cells removed after 24 h of culture with the 4.0 g/cm2 weight were slightly stained by MTT in Ca9-22 and HGF but not in PDLF and A cells. Therefore, the live cells were slightly removed by the weights in Ca9-22 and HGF. In contrast, the active cells remained after 24 h in PDLF and A cells with the 4.0 g/cm2 weight. To confirm the viabilities of white round cells stained by MTT in PDLF cells compressed by weights, the observation was performed using a strong magnification (×200) for the microscope. White round cells both stained and not stained by MTT were observed in the PDLF cells with the 1.0 g/cm2 and 4.0 g/cm2 weights but, white round cells that were not stained with MTT were not observed in the control (Figure 6).

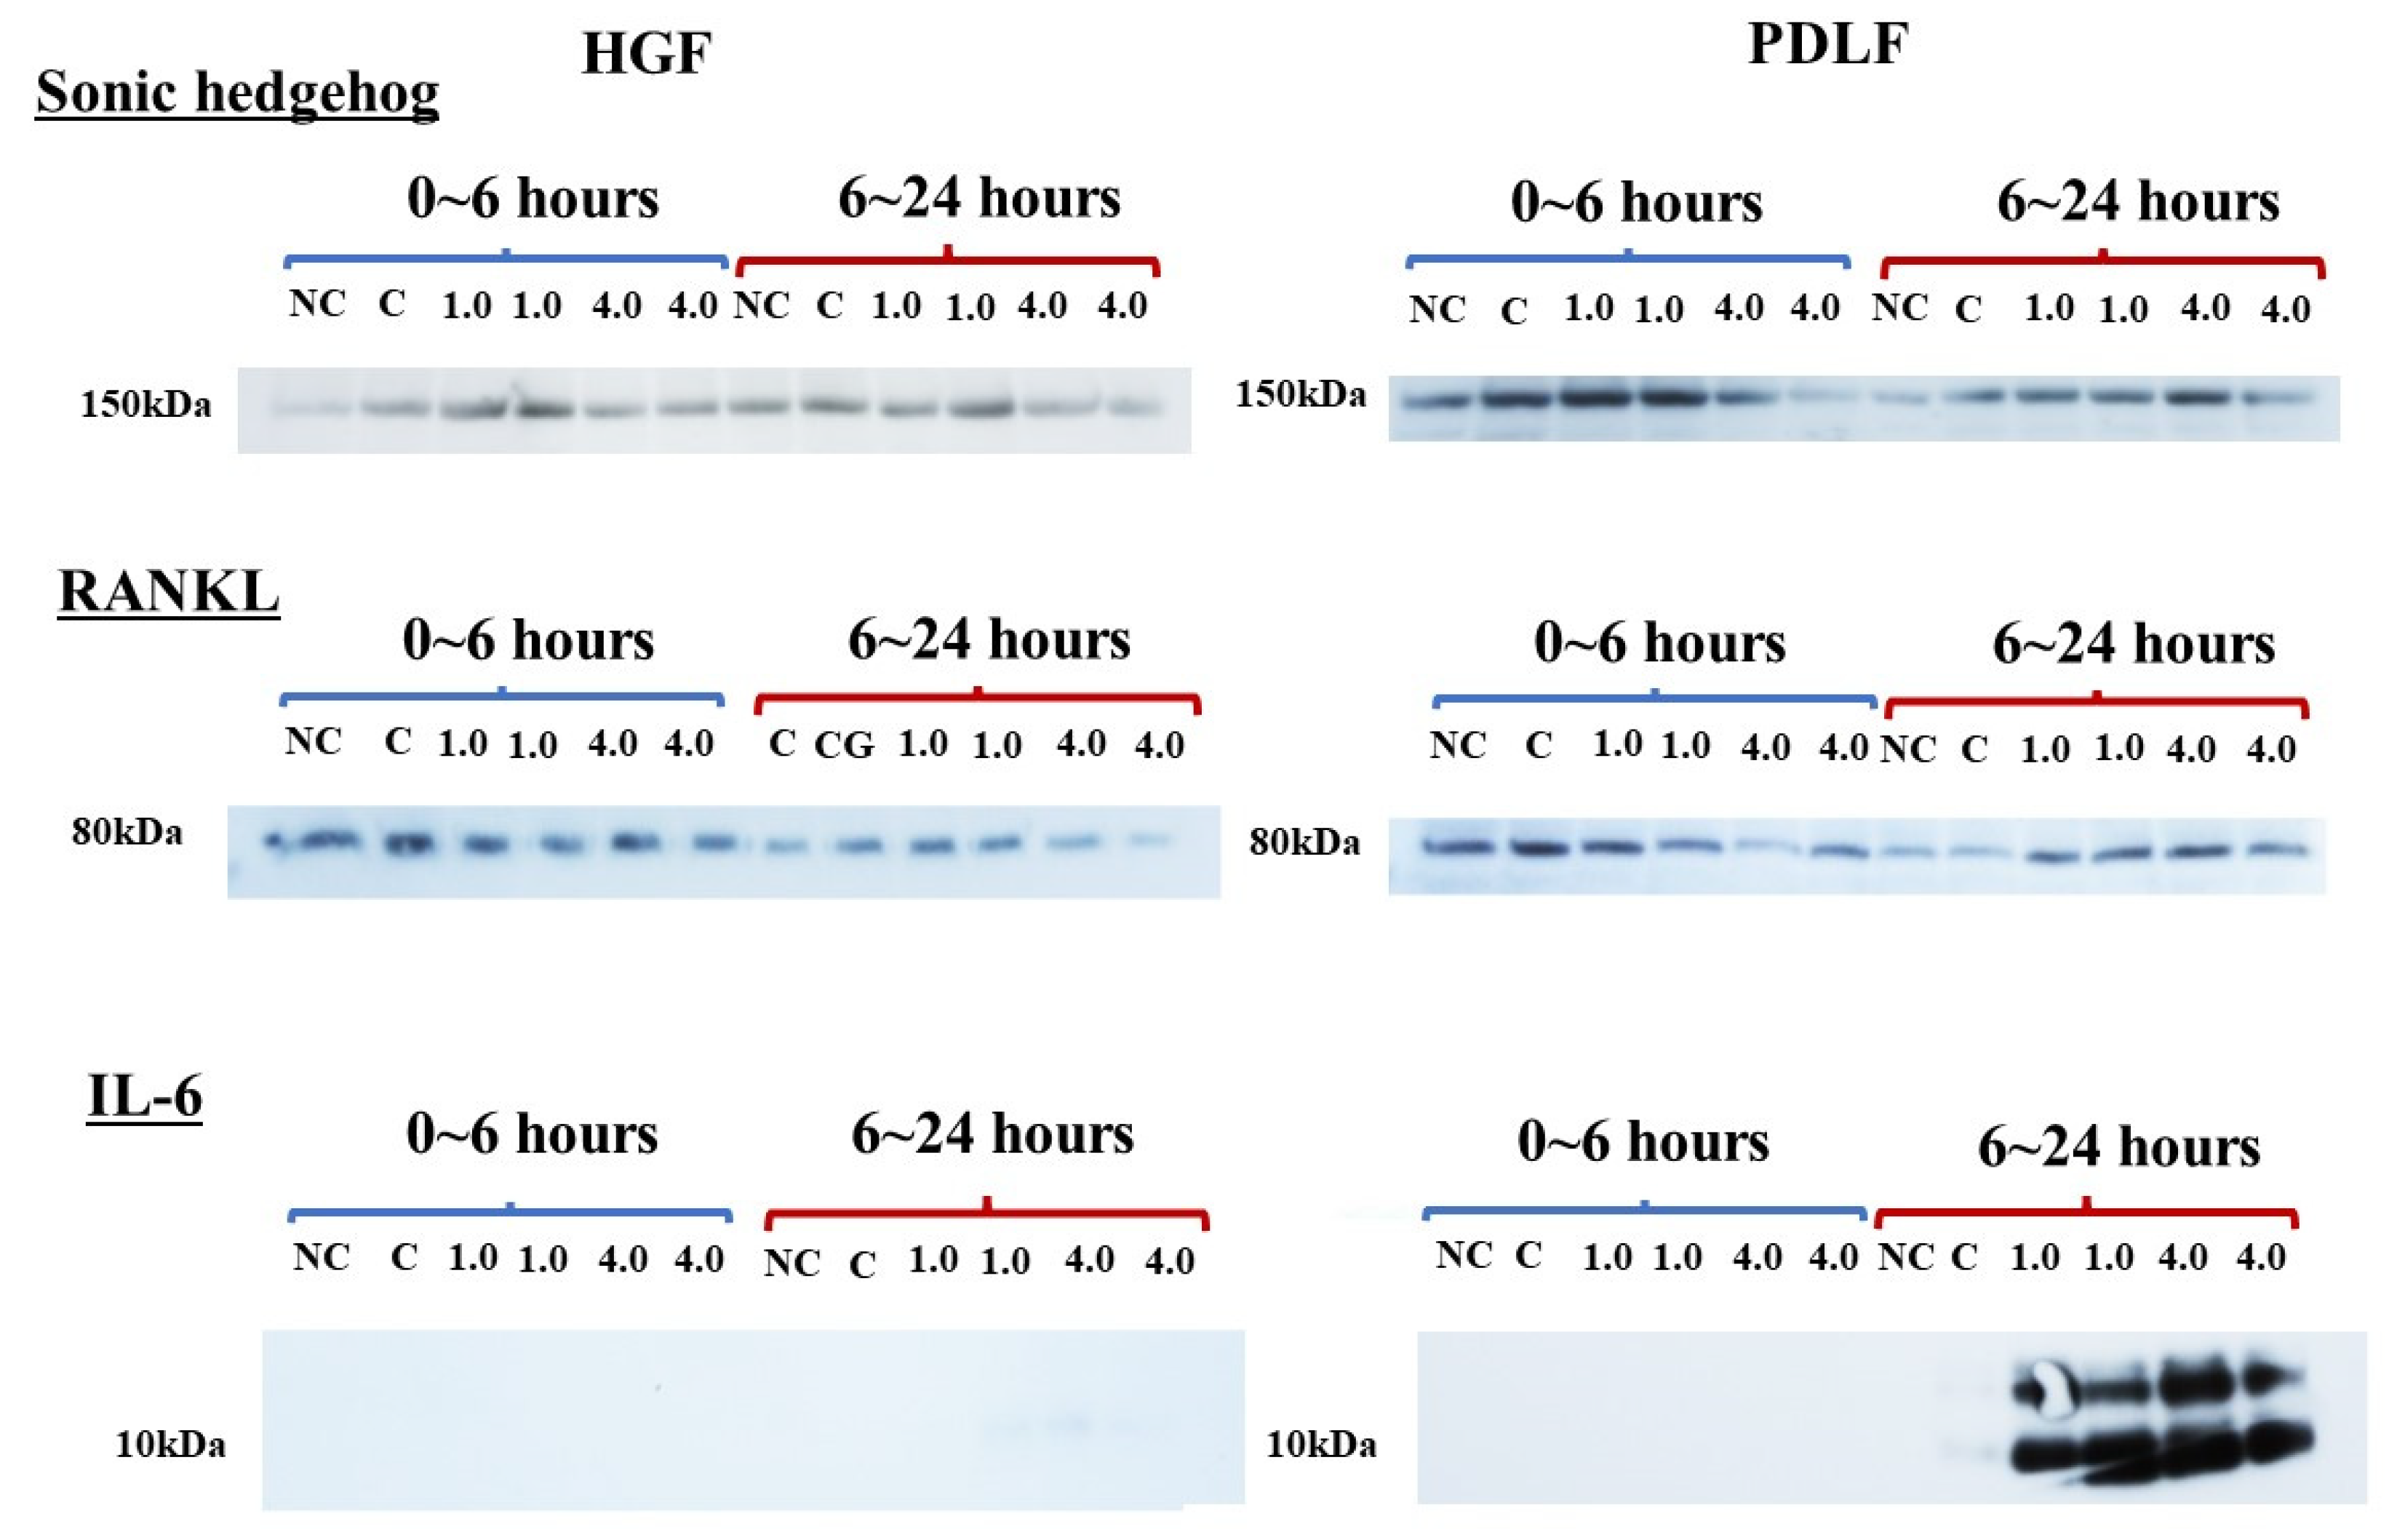
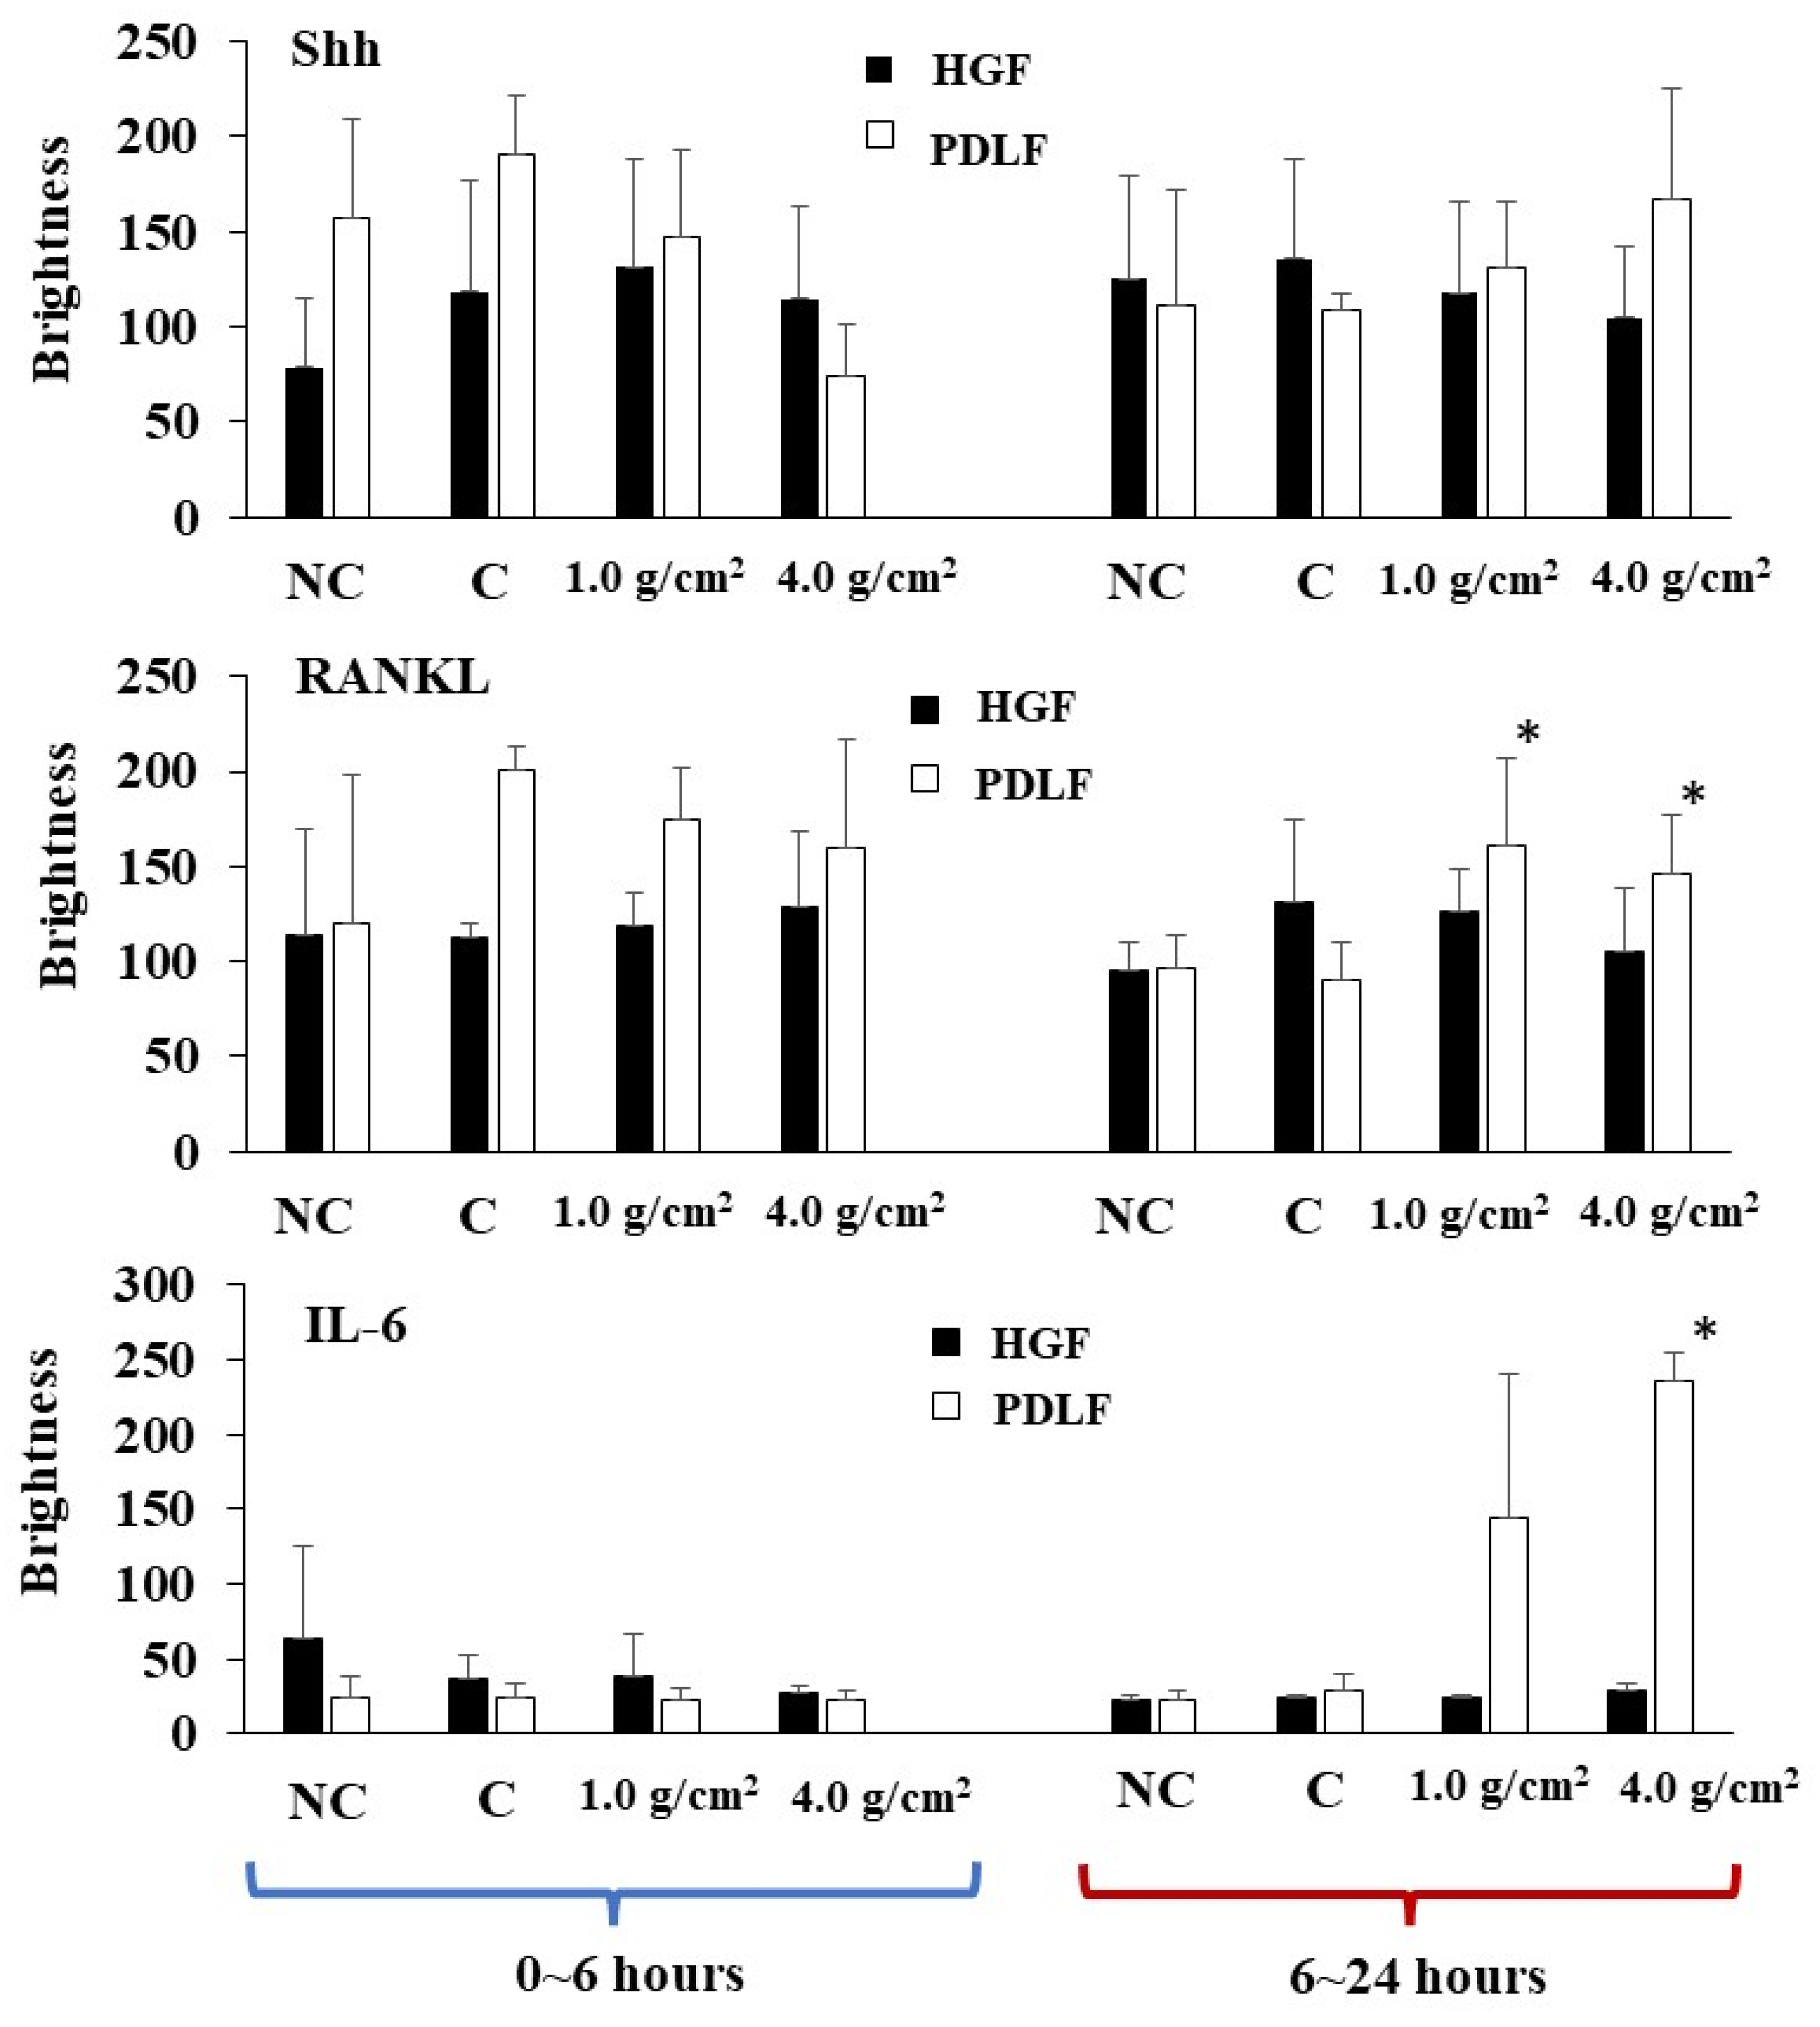
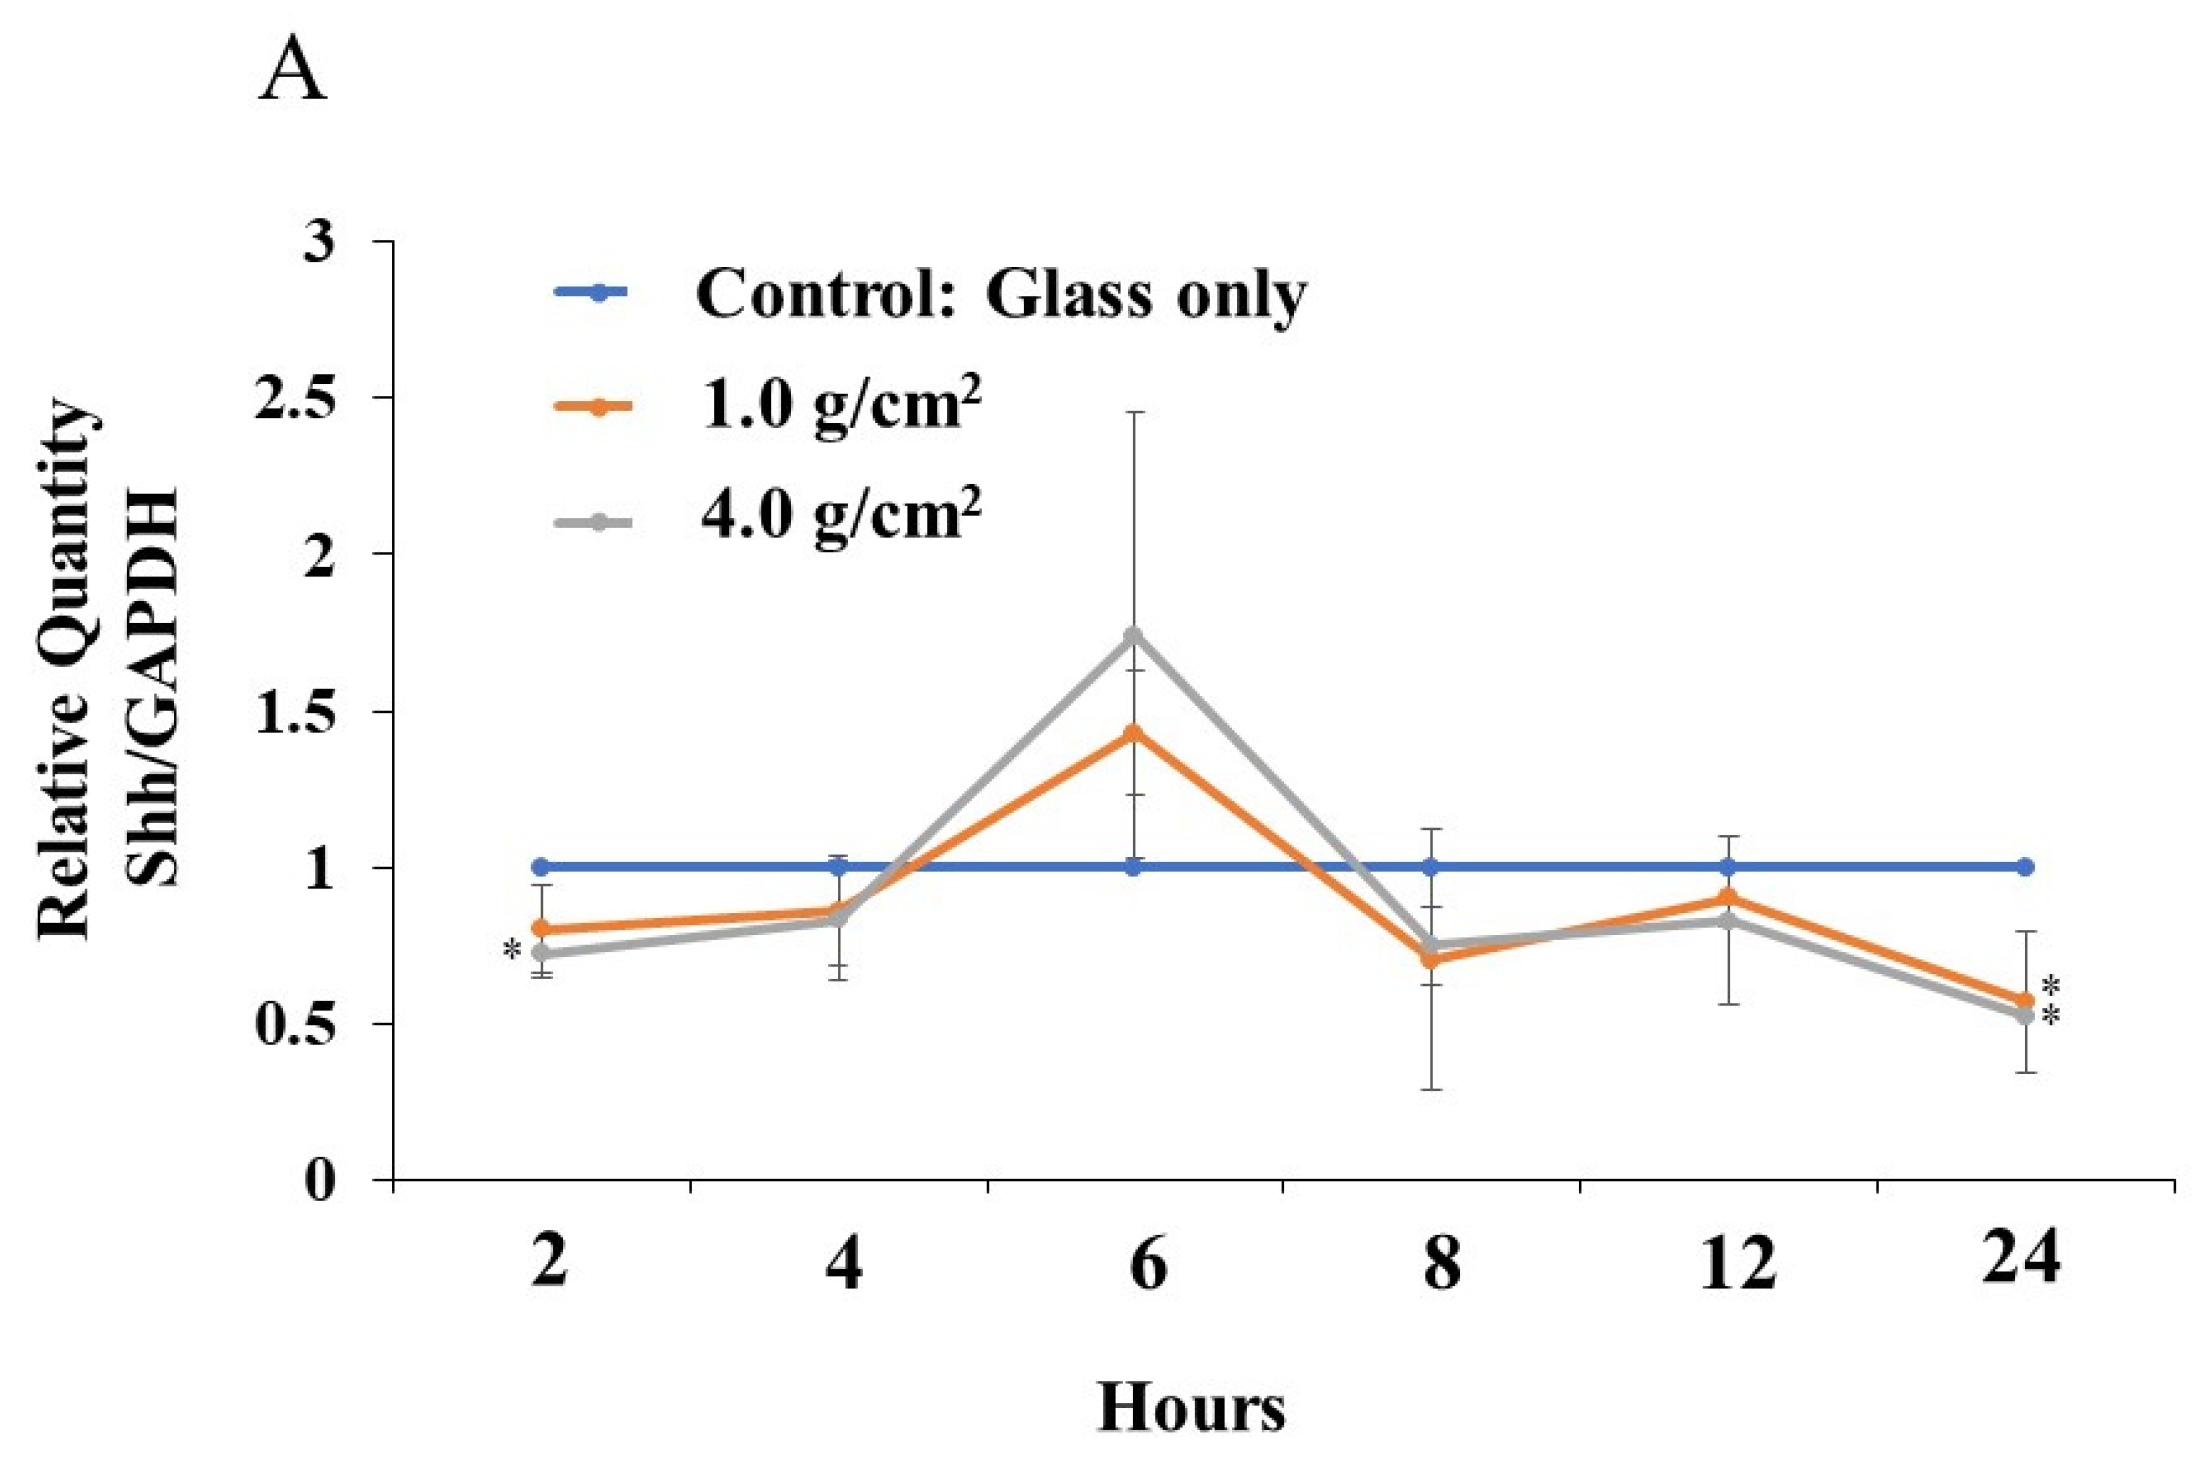
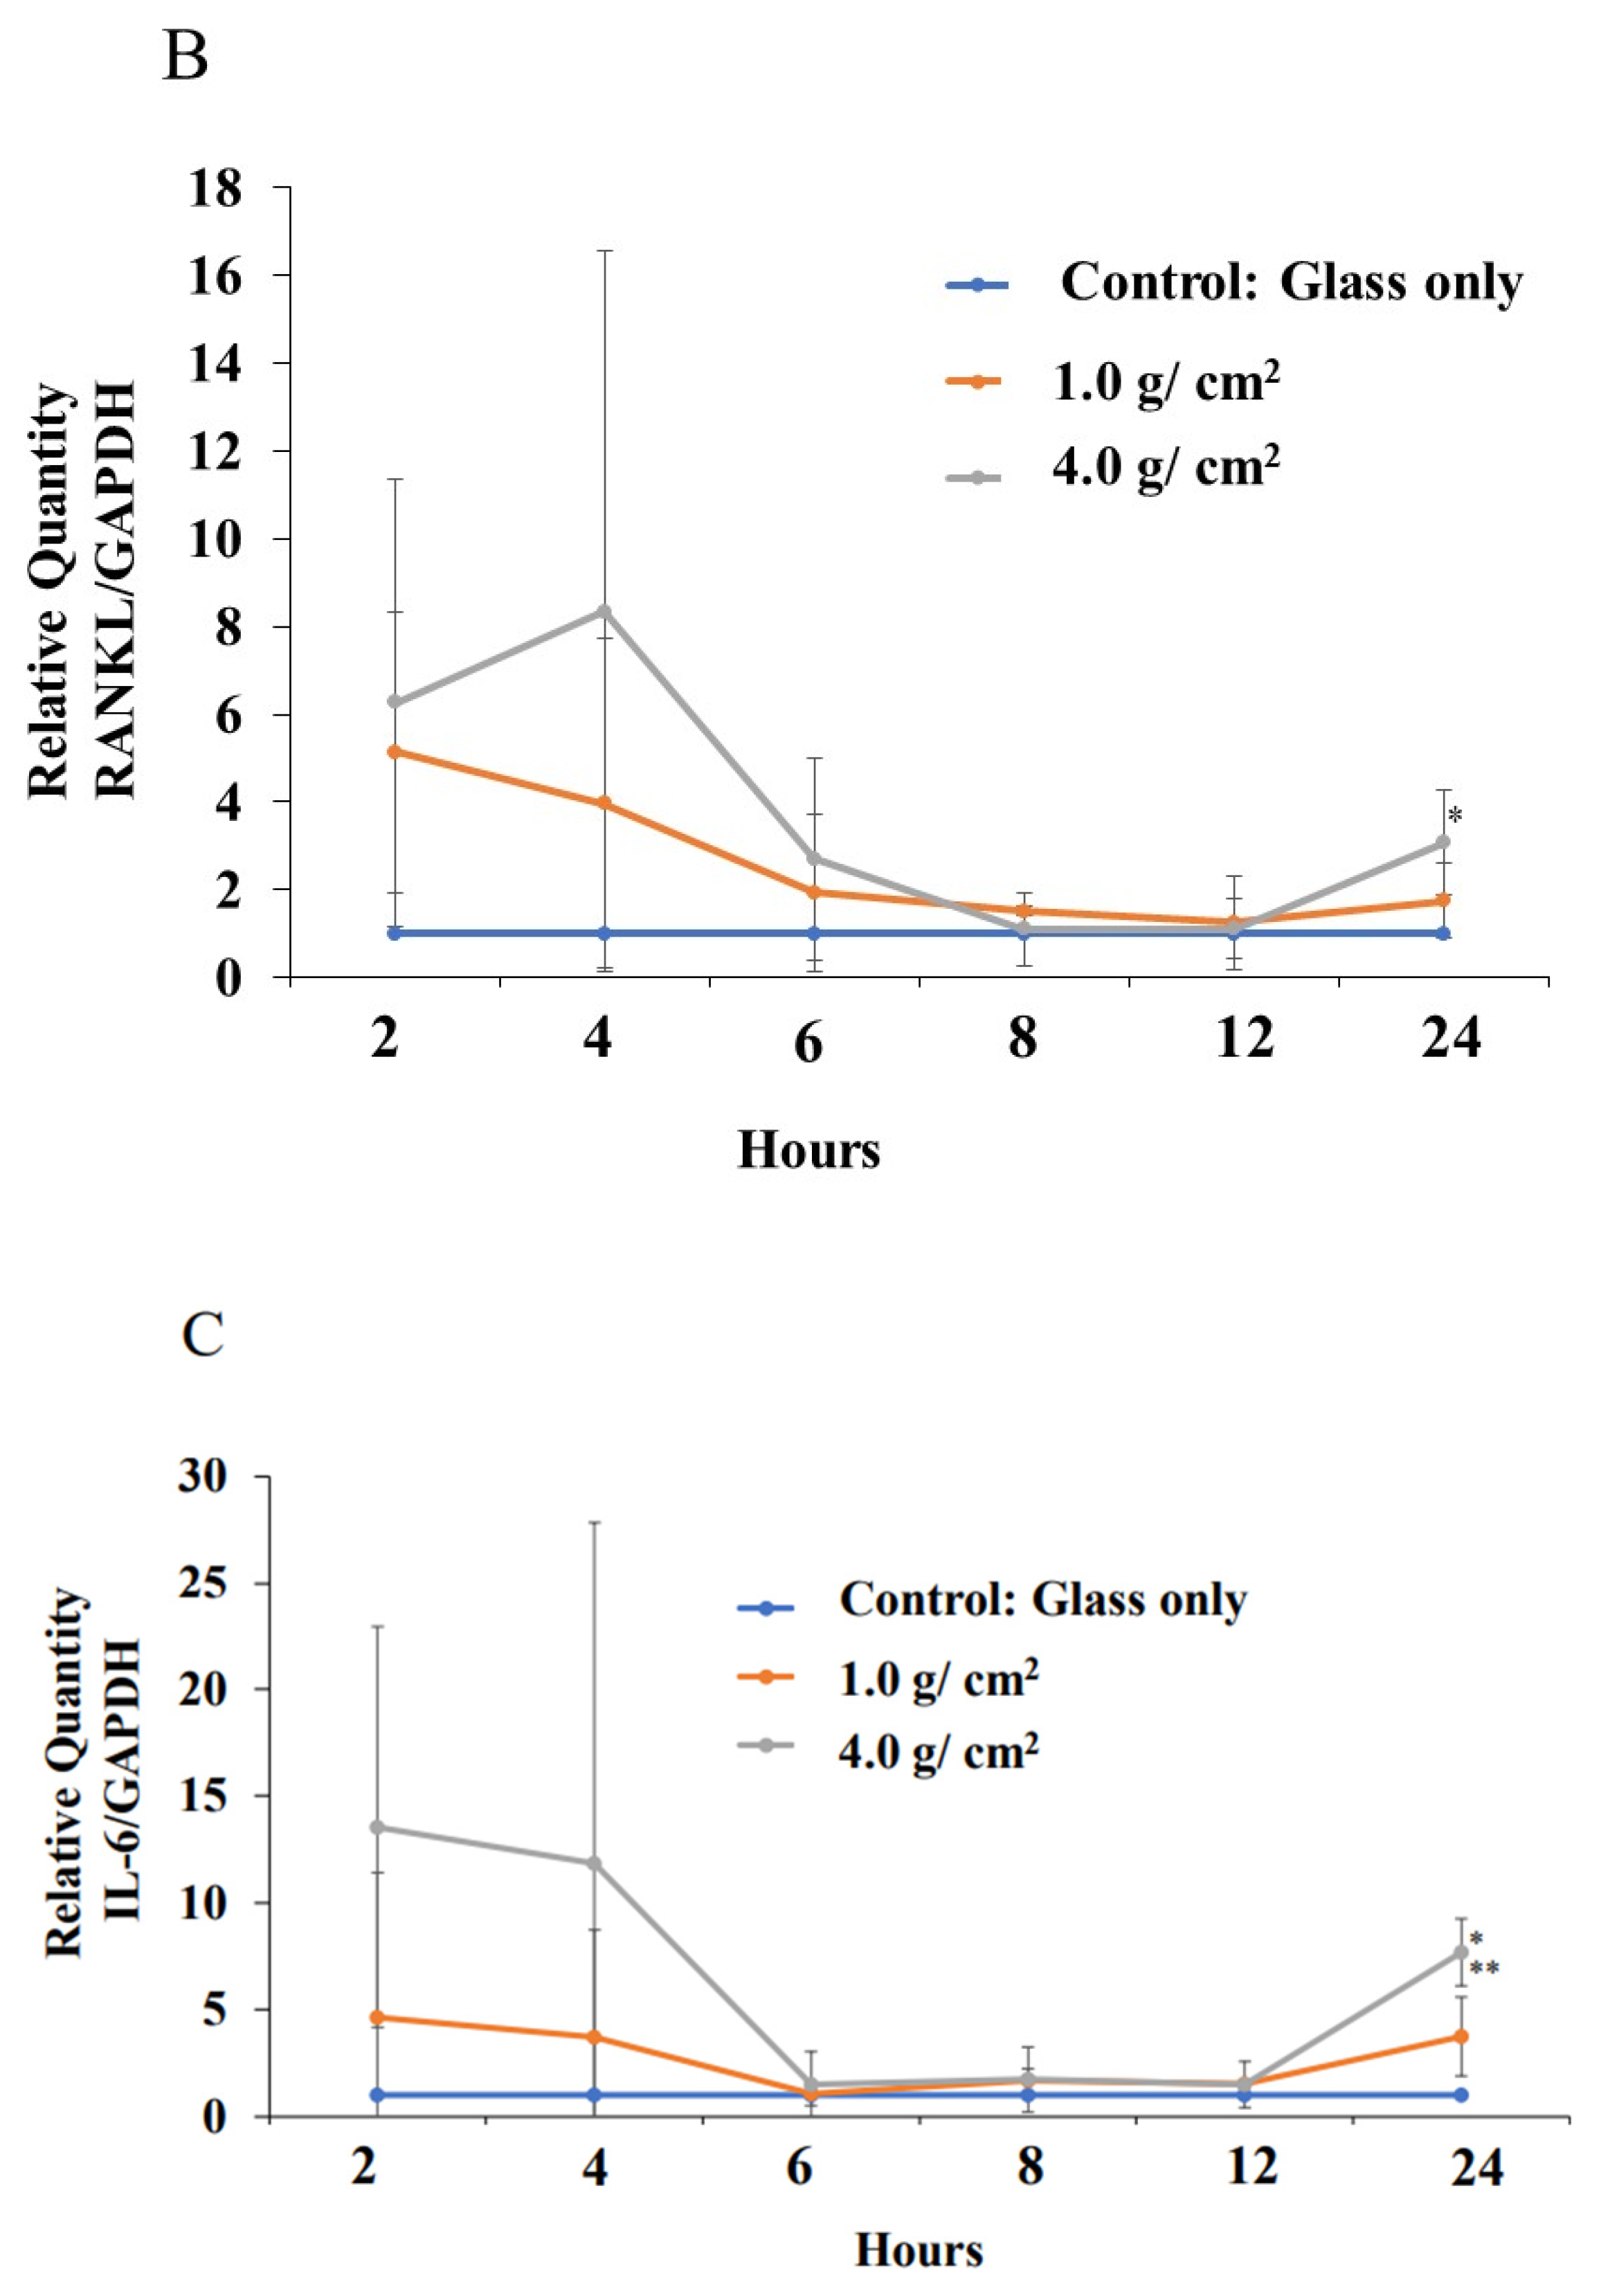
3.2. Effects of Orthodontic Force on the Expression of Shh, RANKL, and IL-6 from PDLF Cells

In the HGF and PDLF cell cultures with 1.0 g/cm2 and 4.0 g/cm2 weights, we examined how Shh, RANKL, and IL-6 are produced by weight stimulation. To measure the protein production of Shh, RANKL, and IL-6, we performed Western blotting of the culture supernatant samples from the PDLF culture with no weight, control (glass only weight) and the 1.0 g/cm2 and 4.0 g/cm2 groups. The culture supernatant samples were concentrated to 50 kDa by filtration and prepared for SDS-PAGE and Western blotting. Moreover, the samples below 50 kDa that passed through the filter were used to compare to the more than 50 kDa sample in experiments. A protein band of around 150 kDa was mainly detected by anti-hedgehog antibodies in the 1.0 g/cm2 weight group and was similar to that in the control (glass only) group in both cells (Figure 7). In contrast, the 150 kDa protein band was poorly expressed in the 4.0 g/cm2 group, except for one protein band of PDLFs at 6~24 h. In RANKL, approximately 80 kDa protein bands were mainly detected and protein expression levels were not higher in the 1.0 and 4.0 g/cm2 weight groups than in the control (glass only) weight group at 0~6 and 6~24 h after culture in HGF and at 0~6 h in PDLFs (Figure 7). The expression of RANKL proteins was higher in the 1.0 g/cm2 and 4.0 g/cm2 groups than in the control (glass only) weight group at 6~24 h after culture in PDLFs. For IL-6, approximately 10 kDa protein bands were mainly detected, and protein expression levels were significantly higher in the 1.0 and 4.0 g/cm2 weight groups than in the control (glass only) weight group at 6~24 h after culture in PDLF cells (Figure 7). There were no positive bands in HGF and PDLF cells at 0~6 h, and in HGF at 6~24 h after culture. Positive bands were not detected in the less than 50 kDa samples. To measure the proteins quantitatively, the expression levels of these protein bands in Figure 7 were analyzed by ImageJ. In HGF, there were no significant differences in any proteins in the various conditions (Figure 8). In contrast, the protein bands of RANKLs were significantly expressed in the 1.0 g/cm2 and 4.0 g/cm2 groups in the 6~24 h after culture samples. The protein band of IL-6 was significantly expressed in the 1.0 g/cm2 group at 6~24 h after culture. If the protein is expressed, the gene must also have previously been expressed. To measure the gene expression of Shh, RANKL, and IL-6 in PDLFs, we collected total RNA samples, and their concentrations were first measured in all conditions. The amounts of total RNA significantly decreased in a time-dependent manner, and lower levels were significantly detected at 12 and 24 h at the 4.0 g/cm2 weight (Figure 5). The amounts of RNA also decreased in a time-dependent manner at the 1.0 g/cm2 weight, but the decease was not significant. The amounts of RNA were not largely changed at 2~12 h and decreased at 24 h, whereas there were no significant changes in the controls. Next, the gene expression levels of Shh, RANKL, and IL-6 were quantitatively measured and compared between the 1.0 g/cm2 and 4.0 g/cm2 weight groups and the control (glass only) weight group. Data are shown as relative quantity (RQ) to GAPDH of the control (glass only) weight group. The gene expression of Shh was significantly lower at 2 h after incubation in the 4.0 g/cm2 group, increased and was significantly higher at 6 h, and then decreased at 8 h and was significantly lower in the 1.0 g/cm2 and 4.0 g/cm2 weight groups than in the control (glass only) weight group at 24 h after incubation (Figure 9A). The gene expression of RANKL was higher at 2 and 4 h with no significant differences, decreased at 6 h, and was significantly higher at 24 h after incubation with the 4.0 g/cm2 weights than with the control (glass only) group (Figure 9B). There was no significant difference in gene expression of RANKL between the 1.0 g/cm2 weight and the control at 24 h after incubation. The gene expression of IL-6 was higher at 2 and 4 h with no significant differences, decreased at 6 h, and was significantly higher at 24 h after incubation with the 4.0 g/cm2 weight than with the 1.0 g/cm2 weight and the control (glass only) weight (Figure 9C). There were no significant differences in the gene expression of IL-6 between the 1.0 g/cm2 weight and the control.

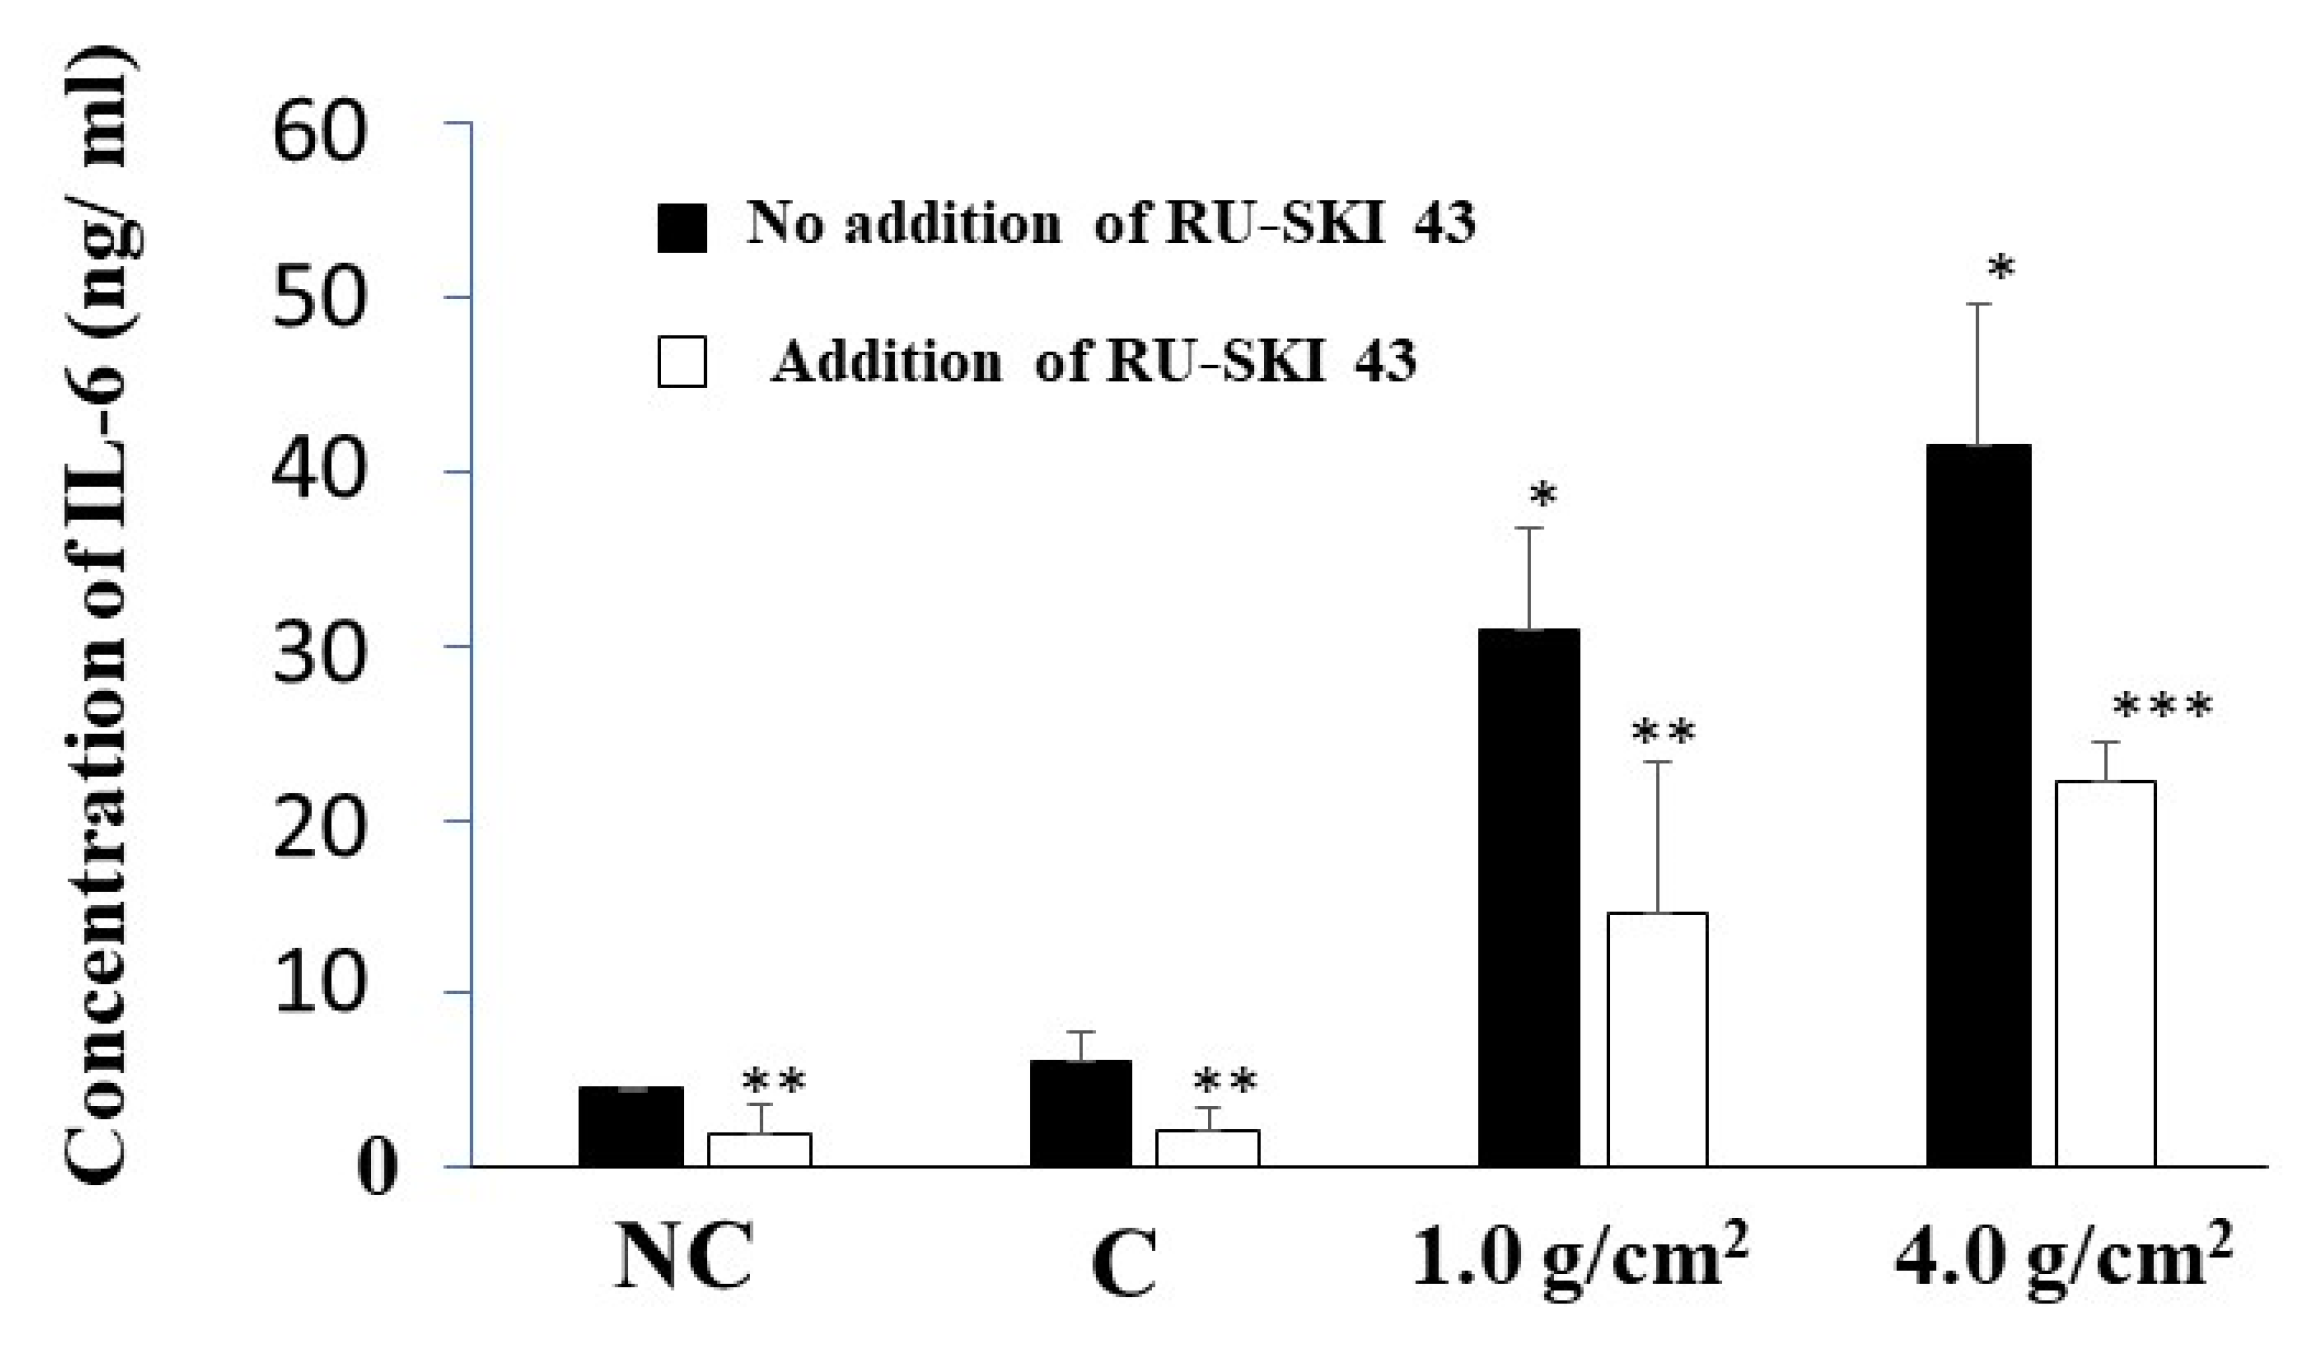
3.3. Effects of Shh on the Expression of RANKL and IL-6 from PDLF Cells
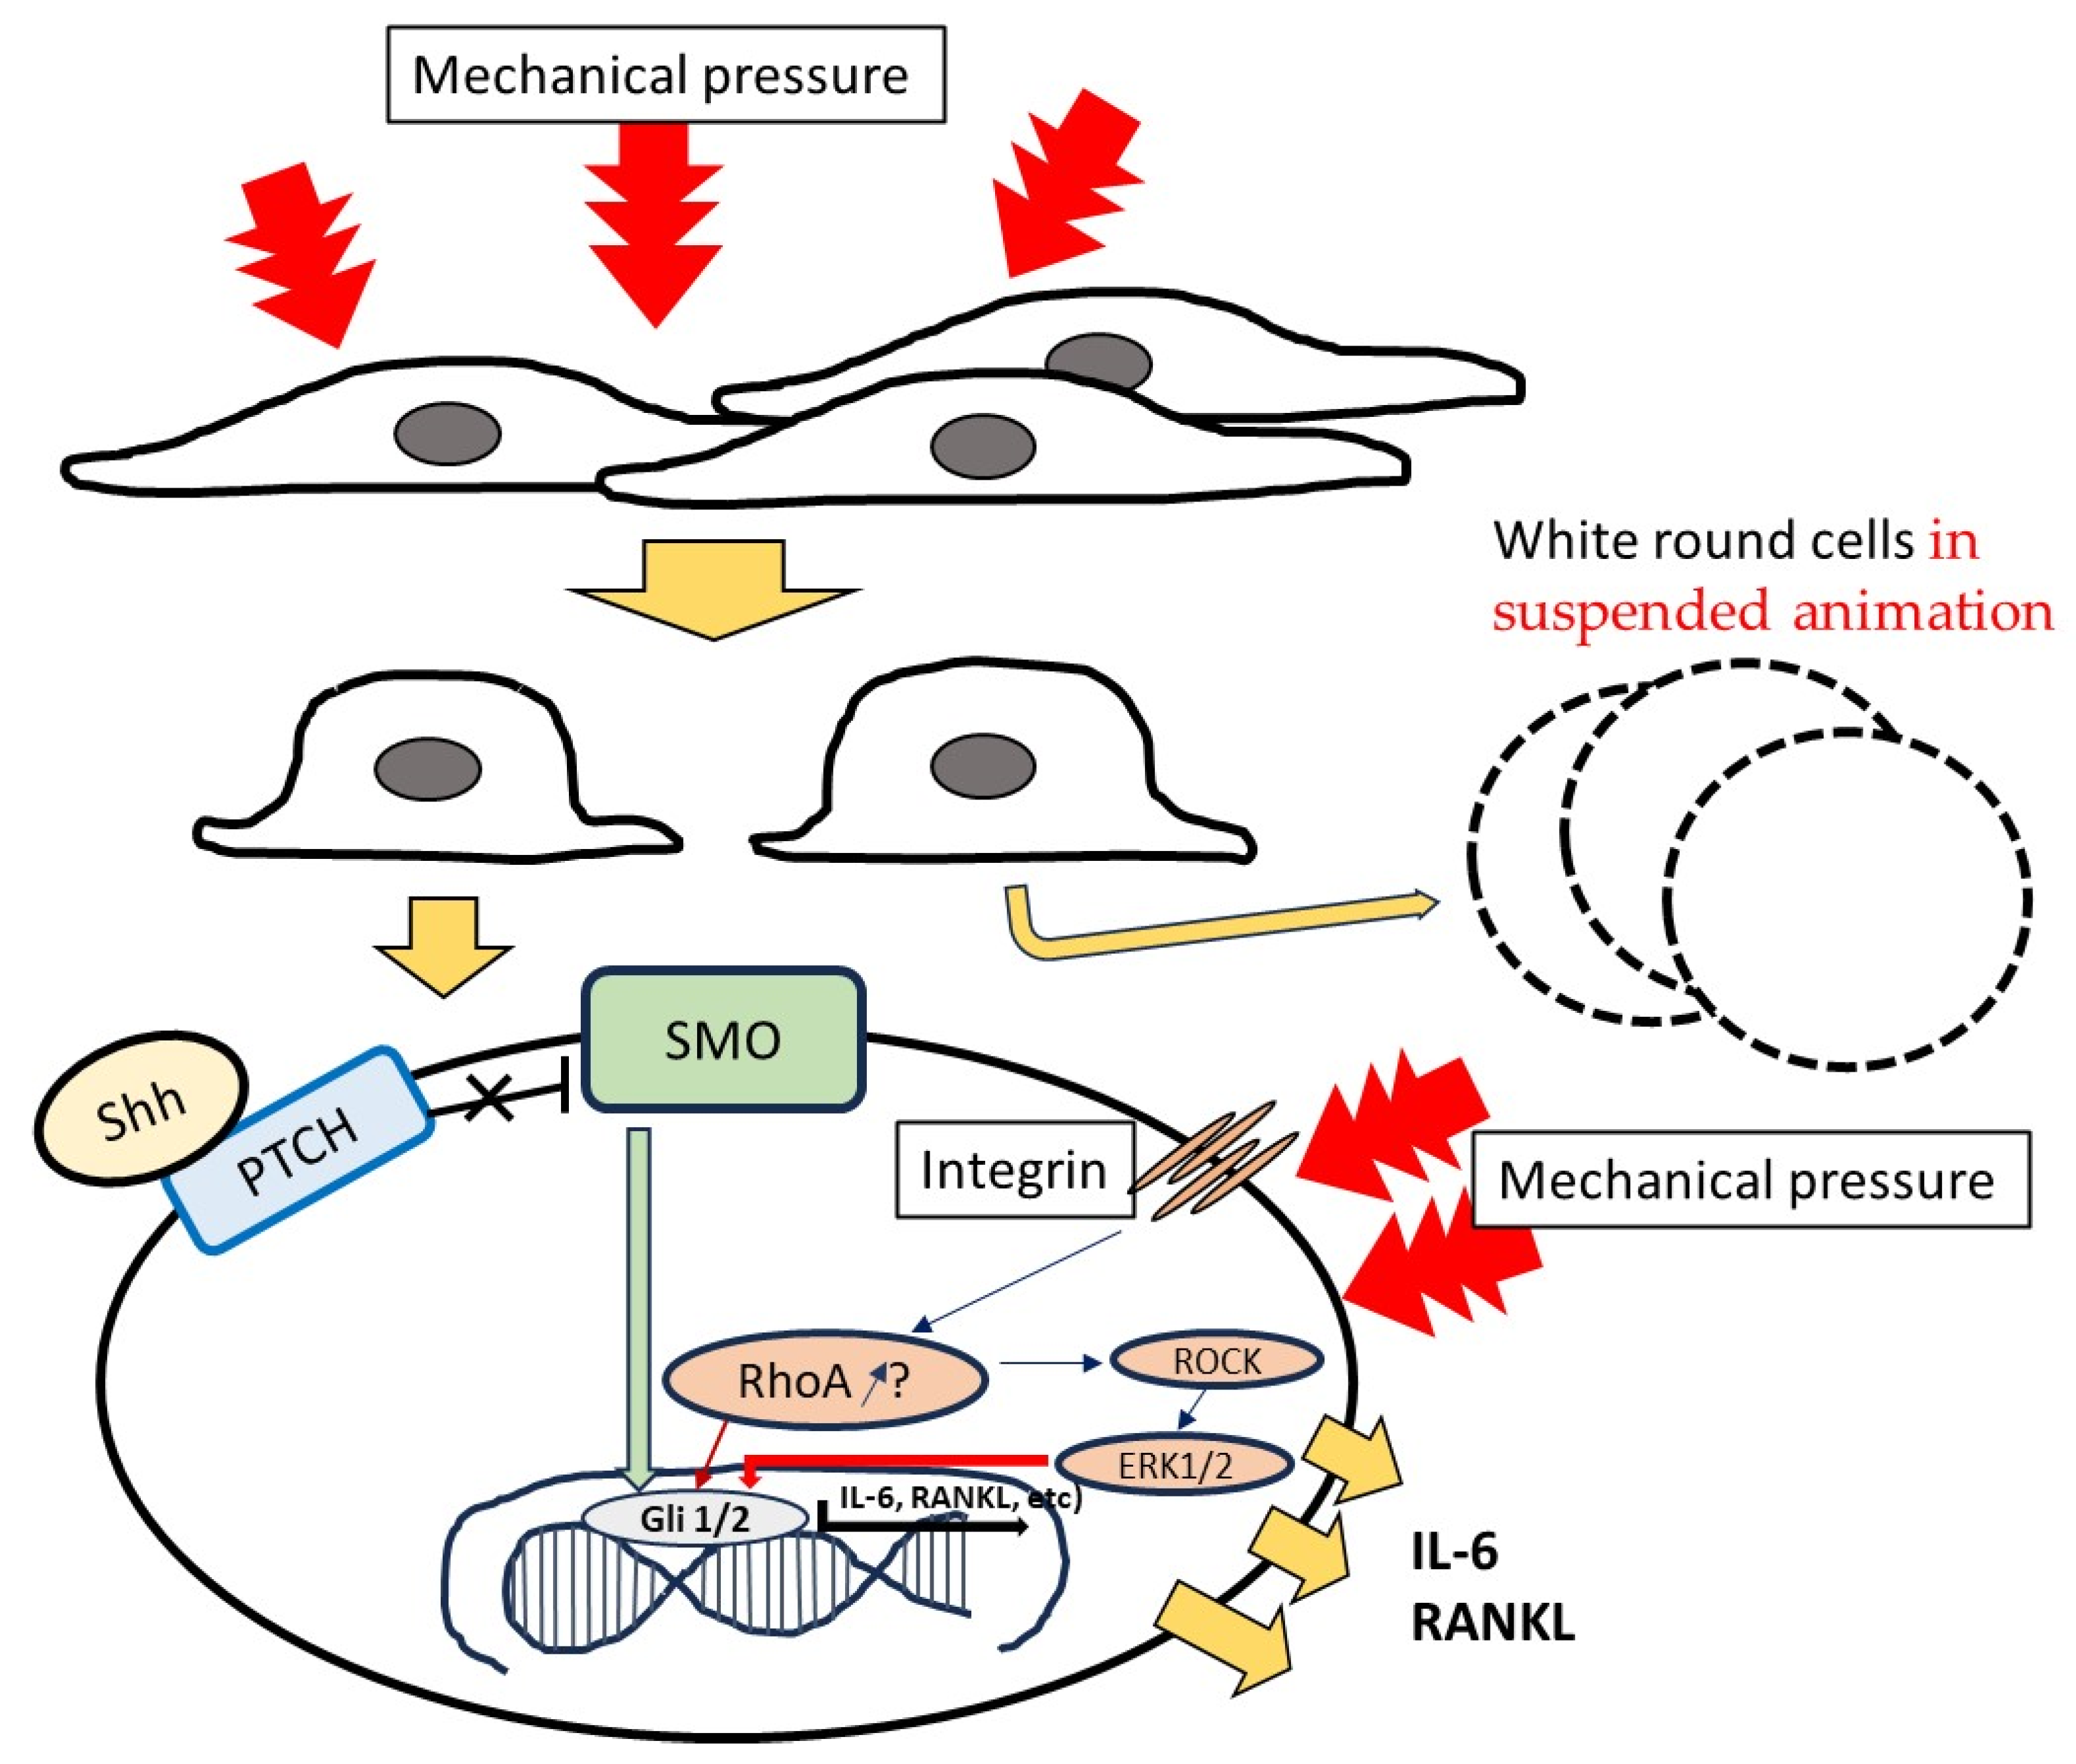
To clarify the relationship between Shh and the protein production of RANKL and IL-6, we added RU-SKI 43, an inhibitor of Shh signaling, to the culture of PDLFs with and without weights, and SDS-PAGE and Western blotting were performed. RU-SKI 43 did not inhibit the production of Shh but equally inhibited the production of RANKL and IL-6 in all conditions (Figure 10). The effects of RU-SKI 43 on the production of RANKL and IL-6 in the culture samples were quantitatively analyzed by ELISA. The inhibition by RU-SKI 43 on IL-6 production was significantly confirmed, but not for RANKL because the concentration of RANKL was too low to detect the protein in ELISA (Figure 11). RANKL was largely expressed on the cell surface and the production levels were low. The inhibition was not specific to responses to the production of RANKL and IL-6 elevated with the 1.0 g/cm2 and 4.0 g/cm2 weights.

4. Discussion

The various activities of cells in tissues are induced by light to heavy physiological pressures during orthodontic treatments. PDLFs are responsible for mechanical stress [28]. The tissue reactions are dependent on the amount of biomechanical load; whereas, moderate pressure is an integral part of periodontal tissue homeostasis, mechanical overload leads to cell damage associated with an increase in the PDLF death rate and dysregulation of bone remodeling [28,29,30]. According to various reports, the most favorable and efficient static compression magnitude is 2.0 g/cm2 (0.5 g/cm2 to 4.0 g/cm2) [31]. One point zero g/cm2 CF is within an optimal mechanical stress range for facilitating osteogenesis in osteoblasts by increasing type I collagen, bone sialoprotein, and bone morphogenetic protein expression levels; whereas, excessive mechanical stress (e.g., 4.0 g/cm2) attenuates these processes [32,33]. In this study, 1.0 g/cm2 and 4.0 g/cm2 weights were placed as an optimal orthodontic force and a strong orthodontic force on both PDLFs and HGFs with reference to previous research [23,24], respectively. The 1.0 g/cm2 and 4.0 g/cm2 weights did not lead to clear cell death and promoted suspended animation in PDLFs. In particular, the 4.0 g/cm2 weights resulted in greater quantities of detached cells than the 1.0 g/cm2 weights in both types of cells. We considered that weight would cause damage regardless of cell type. For the first 6 h after culture with weights in medium with 1% FBS, the effect of weight was less likely to be observed as a result of the influence of nutrient-rich medium with 10% FBS before the start of culture with weights.
Western blotting, a highly sensitive detection method using ECL Plus Western Blotting Substrate (Thermo Scientific) and X-ray film, was used to detect target substances. Production of soluble RANKL and IL-6 was clearly detected by Western blotting in the PDLF culture supernatant samples with weights. However, the production of RANKL was not measured due to the low production of soluble RANKL in the PDLF culture samples with weights. ELISA is a high-sensitivity immunoassay but has the limitation that samples need to fall within the range of the standard curve. Therefore, in these samples, Western blotting was more effective in measuring RANKL than ELISA. In the 6~24 h culture with weights, these cytokines were significantly expressed and produced compared to those of the control (glass plate only) group. In another report, under compression, the mRNA expression of IL-6 was upregulated in the first 24 h [23,24,34] and gradually decreased, with no significant differences from controls in the latter 24 h [35]. Therefore, the responses to sublethal stress depending on weight are common in PDLFs and involved in the production of RANKL and IL-6 in confluent PDLFs cultured for 6~24 h.
In periodontal tissue, PDLFs attach cement to neighboring alveolar bones, and fibrous connective tissue is involved in this process; 100s of collagen fibers, such as Sharpey’s and oxytalan fibers, are included [36]. PDLFs react sensitively to mechanical stimulation through interaction with the fiber-formed matrix [37,38,39]. In this study, HGFs, which were used as a control, reacted to mechanical stimulation, but the reactivities to weights for the production of RANKL and IL-6 were weaker than those of PDLFs. Therefore, the form, behavior, and function of PDLFs are strongly influenced by the structure of neighboring fibers and their location in PDLFs, including Sharpey’s or oxytalan fibers. The structure of PDL fibers is sensitively altered in response to a mechanical force, in which the crosslinks in collagen fibers and microfibrils are disrupted or condensed depending on compressive or tensile force application [36,40]. When PDLFs were exposed to compressive force on a tissue culture plate, some of the PDL collagen fibers showed a disrupted morphology. PDLF cultures under compressive mechanical force preferably induced morphological changes in cells and stimulated osteoclastic activity such as the production of RANKL and IL-6 rather than osteogenic differentiation. Hypofunctional periodontium is one of the major factors leading to dental root and bone resorption [8,9]. In this study, white round cells might have been induced by weight as a result of changes in fibrous morphology (Figure 12). White round cells are the shape of the cell when the PDLF is detached.
This shows the state in which fibroblasts return to their original form while floating when they detach and lose their ability to bind to the surface layer due to the force of physical weight. This may include cells with lost viability and cells having a high enough activity to produce cytokines for the induction of osteoclast. We considered that pressures such as those resulting from 1.0 g/cm2 and 4.0 g/cm2 weights would result in gene expression and produce cytokines for the induction of osteoclasts in sublethal responses, and, moreover, that the heavy force of a 4.0 g/cm2 weight might show more cell damage than the optimal force of a 1.0 g/cm2 weight. Then, PDLFs might be employed for their supportive role in osteoclastogenesis or odontoclastogenesis before induction in suspended animation because the white round cells that remained after 24 h of culture with 4.0 g/cm2 weights were stained by MTT and included active PDLF cells.
Hh signaling regulates several cellular processes that are critical to bone development [41]. The role of Hh signaling in regulating osteoclastogenesis is likely complicated in various tissues [42]. Shh is a key signaling molecule in the morphogenesis of various vertebrate organs, such as the limbs, the lower jaw, the heart tube, and the teeth [43,44,45,46]. Shh signaling has previously been shown to be involved in cell morphological changes and cell motility via Rho pathway-dependent myosin phosphorylation [47,48]. Myosin-dependent force generation not only increases Rac activity (the Rho family of GTPases) but also specifically increases lamellipodia along the sides and tail to decrease polarity [49]. Mechanical forces trigger multiple signaling pathways and result in the activation of the GTPase RhoA under the activity of integrins [50,51] (Figure 12). RhoA, a member of the Rho family, has been widely implicated in mechanosensitive signaling pathways [52,53]. The Shh signal transduction pathway downstream of SMO is mainly mediated by the activation of RhoA and is referred to as noncanonical type II signaling [54]. The RhoA protein plays a regulatory role in cytoskeletal components and contributes to osteoclast adhesion, podosome positioning, and differentiation [55]. Osteoclasts and odontoclasts are the most common mechanical sensors among these cells due to their structure and location in the bone and tooth matrix. Osteoclasts have been shown to sense damage-associated molecular patterns released by necrotic osteocytes [56]. Thus, mechanical loading RhoA-associated bone or root loss might be a result of crosstalk between PDLF and osteoclasts or odontoclasts.
The gene expression of Shh was not significantly associated with the gene expression of RANKL and IL-6 at time points after culture in PDLFs under weights. However, RU-SKI 43, which is an inhibitor of Shh signaling, inhibited the protein production of RANKL and IL-6, but not Shh itself, regardless of weight. For NKX6-1, a transcription factor that plays a critical role in pancreatic β cell function and proliferation, overexpression in LMS cells treated with RU-SKI43 resulted in cell growth inhibition [57]. The inhibition of Hh signaling in rats with arthritis using cyclopamine, another inhibitor of Shh, reduced the expression of TNFα, IL-1β, and IL-6 [41]. Shh indirectly increased osteoclast activity, resulting in increased bone resorption and decreased bone strength [11,12,13]. These reports support the indirect contribution of Shh to the effects of weight in the production of cytokines. The production of RANKL and IL-6 depending on weight might be mediated by RhoA in a mechanically sensitive signaling pathway; however, Shh is associated with cell growth and activity, ultimately guiding the production of cytokines in PDLFs.
Improper mechanical stress may induce morphological changes in PDLFs and the production of RANKL and IL-6 for bone and root resorption during orthodontic treatment. A heavy orthodontic force, such as the 4.0 g/cm2 weight, may cause more changes in morphology and root resorptions as a side effect, and induce unplanned tooth mobility and cause inflammation. However, Shh was not directly linked to signals for the weight-dependent production of cytokines. The study of Shh signal-independent systems, such as noncanonical type II signaling or the Shh signal transduction pathway downstream of SMO, is needed for the clarification of heavy weight-dependent cytokine production from PDLFs and side effects during orthodontic treatment. It is clear which signaling effects of noncanonical type II signaling or the Shh signal transduction pathway downstream of SMO are activated in response to weights, and targets may be identified to prevent side effects during orthodontic treatment.

5. Conclusions

PDLF cultures under compressive mechanical force preferably induced morphological changes in cells and stimulated osteoclastic activity. Shh did not directly link with signals for production of RANKL and IL-6 for root and bone resorptions by orthodontic force but was associated with cell activities that were finally guided by the production of cytokines in PDLFs.

Supplementary Materials

The following supporting information can be downloaded at: https://www.mdpi.com/article/10.3390/dj12040108/s1, Figure S1: Observation of white round cells and removed area. Figure S2: Observation of white round cells and removed area in different magnifications. Figure S3: Observation of cell viability.

Author Contributions

Conceptualization, H.S. and J.K.; methodology, H.S., M.S. and J.K.; writing—original draft preparation, H.S. and E.Y.; funding acquisition, H.S., J.K. and M.S.; writing—review and editing, H.S., E.Y., J.K. and M.S.; visualization, H.S. and E.Y.; supervision, H.S. and S.N.; project administration, H.S. and E.Y. All authors have read and agreed to the published version of the manuscript.

Funding

This work was supported in part by a grant-in-aid for the Development of Scientific Research (20K18467 and 20K10286) from the Ministry of Education, Science, and Culture of Japan and the Nihon University Research Grant for 2022 to H.S.

Institutional Review Board Statement

The study protocol was approved by the Research Ethics Committee at the National Institute of Infectious Diseases, Japan (No. 580 and 683), and all participants gave their written informed consent. All methods were performed in accordance with the relevant guidelines and regulations.

Informed Consent Statement

Informed consent was obtained from all subjects involved in the study.

Data Availability Statement

All data generated or analyzed during this study are included in this published article.

Acknowledgments

The authors thank Tomomi Takizawa and Takehiro Iwane for their technical support, helpful discussions, and advice.

Conflicts of Interest

The authors declare no conflict of interest.

References

  1. Saffar, J.L.; Lasfargues, J.J.; Cherruau, M. Alveolar Bone and the Alveolar Process: The Socket that is Never Stable. Periodontol. 2000 1997, 13, 76–90. [Google Scholar] [CrossRef]
  2. Sodek, J.; McKee, M.D. Molecular and Cellular Biology of Alveolar Bone. Periodontol. 2000 2000, 24, 99–126. [Google Scholar] [CrossRef] [PubMed]
  3. Beertsen, W.; McCulloch, C.A.; Sodek, J. The Periodontal Ligament: A Unique, Multifunctional Connective Tissue. Periodontol. 2000 1997, 13, 20–40. [Google Scholar] [CrossRef]
  4. de Vries, T.J.; Schoenmaker, T.; Micha, D.; Hogervorst, J.; Bouskla, S.; Forouzanfar, T.; Pals, G.; Netelenbos, C.; Eekhoff, E.M.W.; Bravenboer, N. Periodontal Ligament Fibroblasts as a Cell Model to Study Osteogenesis and Osteoclastogenesis in Fibrodysplasia Ossificans Progressive. Bone 2018, 23, 168–177. [Google Scholar] [CrossRef] [PubMed]
  5. Basdra, E.K.; Komposch, G. Osteoblast-like Properties of Human Periodontal Ligament Cells: An In Vitro Analysis. Eur. J. Orthod. 1997, 19, 615–621. [Google Scholar] [CrossRef]
  6. Arceo, N.; Sauk, J.J.; Moehring, J.; Foster, R.A.; Somerman, M.J. Human Periodontal Cells Initiate Mineral-like Nodules in vitro. J. Periodontol. 1991, 62, 499–503. [Google Scholar] [CrossRef] [PubMed]
  7. Bloemen, V.; Schoenmaker, T.; de Vries, T.J.; Everts, V. Direct Cell-Cell Contact Between Periodontal Ligament Fibroblasts and Osteoclast Precursors Synergistically Increases the Expression of Genes Related to Osteoclastogenesis. J. Cell. Physiol. 2010, 222, 565–573. [Google Scholar] [CrossRef]
  8. Sringkarnboriboon, S.; Matsumoto, Y.; Soma, K. Root Resorption Related to Hypofunctional Periodontium in Experimental Tooth Movement. J. Dent. Res. 2003, 82, 486–490. [Google Scholar] [CrossRef]
  9. Hayashi, A.; Hayashi, H.; Kawata, T. Prevention of Root Resorption in Hypofunctional Teeth by Occlusal Function Recovery. Angle Orthod. 2016, 86, 214–220. [Google Scholar] [CrossRef]
  10. Kahane, N.; Kalcheim, C. From Bipotent Neuromesodermal Progenitors to Neural-Mesodermal Interactions During Embryonic Development. Int. J. Mol Sci. 2021, 22, 9141. [Google Scholar] [CrossRef]
  11. Ehlen, H.W.A.; Buelens, L.A.; Vortkamp, A. Hedgehog Signaling in Skeletal Development. Birth Defects Res. Part C Embryo Today 2006, 78, 267–279. [Google Scholar] [CrossRef] [PubMed]
  12. Ayers, K.L.; Gallet, A.; Staccini-Lavenant, L.; Thérond, P.P. The Long-Range Activity of Hedgehog is Regulated in the Apical Extracellular Space by the Glypican Dally and the Hydrolase Notum. Dev. Cell 2010, 18, 605–620. [Google Scholar] [CrossRef] [PubMed]
  13. Mak, K.K.; Bi, Y.; Wan, C.; Chuang, P.-T.; Clemens, T.; Young, M.; Yang, Y. Hedgehog Signaling in Mature Osteoblasts Regulates Bone Formation and Resorption by Controlling PTHrP and RANKL expression. Dev. Cell 2008, 14, 674–688. [Google Scholar] [CrossRef]
  14. Tian, Y.; Xu, Y.; Fu, Q.; Dong, Y. Osterix is Required for Sonic Hedgehog-Induced Osteoblastic MC3T3-E1 Cell Differentiation. Cell Biochem. Biophys. 2012, 64, 169–176. [Google Scholar] [CrossRef] [PubMed]
  15. Kiuru, M.; Solomon, J.; Ghali, B.; van der Meulen, M.; Crystal, R.G.; Hidaka, C. Transient Overexpression of Sonic Hedgehog Alters the Architecture and Mechanical Properties of Trabecular Bone. J. Bone Miner. Res. 2009, 24, 1598–1607. [Google Scholar] [CrossRef] [PubMed]
  16. Udagawa, N.; Takahashi, N.; Katagiri, T.; Wada, S.; Findlay, D.M.; Martin, T.J.; Hirota, H.; Taga, T.; Kishimoto, T.; Suda, T. Interleukin (IL)-6 Induction of Osteoclast Differentiation Depends on IL-6 Receptors Expressed on Osteoblastic Cells but not on Osteoclast Progenitors. J. Exp. Med. 1995, 182, 1461–1468. [Google Scholar] [CrossRef] [PubMed]
  17. Palmqvist, P.; Persson, E.; Conaway, H.H.; Lerner, U.H. IL-6, Leukemia Inhibitory Factor, and Oncostatin M Stimulate Bone Resorption and Regulate the Expression of Receptor Activator of NF-kappa B Ligand, Osteoprotegerin, and Receptor Activator of NF-kappa B in Mouse Calvariae. J. Immunol. 2002, 169, 3353–3362. [Google Scholar] [CrossRef] [PubMed]
  18. Wittrant, Y.; Théoleyre, S.; Chipoy, C.; Padrines, M.; Blanchard, F.; Heymann, D.; Rédini, F. RANKL/RANK/OPG: New Therapeutic Targets in Bone Tumours and Associated Osteolysis. Biochim. Biophys. Acta 2004, 1704, 49–57. [Google Scholar] [CrossRef]
  19. Shimo, T.; Matsumoto, K.; Takabatake, K.; Aoyama, E.; Takebe, Y.; Ibaragi, S.; Okui, T.; Kurio, K.; Takada, H.; Obata, K.; et al. The Role of Sonic Hedgehog Signaling in Osteoclastogenesis and Jaw Bone Destruction. PLoS ONE 2016, 11, e0151731. [Google Scholar] [CrossRef] [PubMed]
  20. Day, T.F.; Yang, Y. Wnt and hedgehog signaling pathways in bone development. J. Bone Jt. Surg. Am. 2008, 90 (Suppl. S1), S19–S24. [Google Scholar] [CrossRef]
  21. Cai, H.; Liu, A. Spop promotes skeletal development and homeostasis by positively regulating Ihh signaling. Proc. Natl. Acad. Sci. USA 2016, 113, 14751–14756. [Google Scholar] [CrossRef] [PubMed]
  22. Ge, S.; Zhao, N.; Wang, L.; Yu, M.; Liu, H.; Song, A.; Huang, J.; Wang, G.; Yang, P. Bone Repair by Periodontal Ligament Stem Cell Seeded Nanohydroxyapatite-Chitosan Scaffold. Int. J. Nanomed. 2012, 7, 5405–5414. [Google Scholar] [CrossRef] [PubMed]
  23. Kunii, R.; Yamaguchi, M.; Tanimoto, Y.; Asano, M.; Yamada, K.; Goseki, T.; Kasai, T. Role of Interleukin-6 in Orthodontically Induced Inflammatory Root Resorption in Humans. Korean J. Orthod. 2013, 43, 294–301. [Google Scholar] [CrossRef] [PubMed]
  24. Iwane, T.; Kikuta, J. Notch Signaling Response to Heavy Compression Force Induces Orthodontic Root Resorption via RNAKL and IL-6 from Cementoblasts. Int. J. Oral-Med. Sci. 2020, 18, 287–295. [Google Scholar] [CrossRef]
  25. Petrova, E.; Rios-Esteves, J.; Ouerfelli, O.; Glickman, J.F.; Resh, M.D. Inhibitors of Hedgehog Acyltransferase Block Sonic Hedgehog Signaling. Nat. Chem. Biol. 2013, 9, 247–249. [Google Scholar] [CrossRef] [PubMed]
  26. Honselmann, K.C.; Pross, M.; Jung, C.M.F.; Wellner, U.F.; Deichmann, S.; Keck, T.; Bausch, D. Regulation Mechanisms of the Hedgehog Pathway in Pancreatic Cancer: A Review. J. Pancreas 2015, 16, 25–32. [Google Scholar]
  27. Ponchel, F.; Toomes, C.; Bransfield, K.; Leong, F.T.; Douglas, S.H.; Sarah, L.; Field, S.L.; Bell, S.M.; Combaret, V.; Puisieux, A.; et al. Real-time PCR Based on SYBR-Green I Fluorescence: An Alternative to the TaqMan Assay for a Relative Quantification of Gene Rearrangements, Gene Amplifications and Micro Gene Deletions. BMC Biotechnol. 2003, 3, 18. [Google Scholar] [CrossRef] [PubMed]
  28. Han, Y.; Yang, Q.; Huang, Y.; Li, X.; Zhu, Y.; Jia, L.; Zheng, Y.; Li, W. Mechanical Force Inhibited hPDLSCs Proliferation with the Downregulation of MIR31HG via DNA Methylation. Oral Dis. 2021, 27, 1268–1282. [Google Scholar] [CrossRef] [PubMed]
  29. Tang, L.L.; Xian, C.Y.; Wang, Y.L. The mgf Expression of Osteoblasts in Response to Mechanical Overload. Arch. Oral Biol. 2006, 51, 1080–1085. [Google Scholar] [CrossRef]
  30. Marchesan, J.T.; Scanlon, C.S.; Soehren, S.; Matsuo, M.; Kapila, Y.L. Implications of Cultured Periodontal Ligament Cells for the Clinical and Experimental Setting: A Review. Arch. Oral Biol. 2011, 56, 933–943. [Google Scholar] [CrossRef]
  31. Li, M.; Zhang, C.; Yang, Y. Effects of Mechanical Forces on Osteogenesis and Osteoclastogenesis in Human Periodontal Ligament Fibroblasts. Bone Jt. Res. 2019, 8, 19–31. [Google Scholar] [CrossRef] [PubMed]
  32. Mitsui, N.; Suzuki, N.; Maeno, M.; Mayahara, K.; Yanagisawa, M.; Otsuka, K.; Shimizu, N. Optimal Compressive Force Induces Bone Formation via Increasing Bone Sialoprotein and Prostaglandin E2 Production Appropriately. Life Sci. 2005, 77, 3168–3182. [Google Scholar] [CrossRef] [PubMed]
  33. Mitsui, N.; Suzuki, N.; Maeno, M.; Yanagisawa, M.; Koyama, Y.; Otsuka, K.; Shimizu, N. Optimal Compressive Force Induces Bone Formation via Increasing Bone Morphogenetic Proteins Production and Decreasing Their Antagonists Production by Saos-2 Cells. Life Sci. 2006, 78, 2697–2706. [Google Scholar] [CrossRef] [PubMed]
  34. Blawat, K.; Mayr, A.; Hardt, M.; Kirschneck, C.; Nokhbehsaim, M.; Behl, C.; Deschner, J.; Jäger, A.; Memmert, S. Regulation of Autophagic Signaling by Mechanical Loading and Inflammation in Human PDL Fibroblasts. Int. J. Mol. Sci. 2020, 21, 9446. [Google Scholar] [CrossRef] [PubMed]
  35. Kikuta, J.; Yamaguchi, M.; Shimizu, M.; Yoshino, T.; Kasai, K. Notch Signaling Induces Root Resorption via RANKL and IL-6 from hPDL Cells. J. Dent. Res. 2015, 94, 140–147. [Google Scholar] [CrossRef] [PubMed]
  36. Schroder, A.; Bauer, K.; Apanier, G.; Proff, P.; Wolf, M.; Kirschneck, C. Expression Kinetics of Human Periodontal Ligament Fibroblasts in the Early Phases of Orthodontic Tooth Movement. J. Orofac. Orthop. 2018, 79, 337–351. [Google Scholar] [CrossRef] [PubMed]
  37. Kim, J.I.; Kim, J.Y.; Bhattarai, G.; So, H.S.; Kook, S.H.; Lee, J.C. Periodontal Ligament-Mimetic Fibrous Scaffolds Regulate YAP-Associated Fibroblast Behaviors and Promote Regeneration of Periodontal Defect in Relation to the Scaffold Topography. ACS Appl. Mater. Interfaces 2023, 15, 599–616. [Google Scholar] [CrossRef]
  38. Kaku, M.; Yamauchi, M. Mechano-regulation of Collagen Biosynthesis in Periodontal Ligament. J. Prosthodont. Res. 2014, 58, 193–207. [Google Scholar] [CrossRef] [PubMed]
  39. Zhu, W.; Liang, M. Periodontal Ligament Stem Cells: Current Status, Concerns, and Future Prospects. Stem Cells Int. 2015, 2015, 972313. [Google Scholar] [CrossRef]
  40. Lim, S.-S.; Kook, S.-H.; Lee, J.-C. COMP-Ang1 Enhances DNA Synthesis and Cell Cycle Progression in Human Periodontal Ligament Cells via Tie2-Mediated Phosphorylation of PI3K/Akt and MAPKs. Mol. Cell. Biochem. 2016, 416, 157–168. [Google Scholar] [CrossRef]
  41. Nan, D.N.; Everts, V.; Ferreira, J.N.; Trachoo, V.; Osathanon, T.; Klincumhom, N.; Pavasant, P. Alteration of Extracellular Matrix Proteins in Atrophic Periodontal Ligament of Hypofunctional Rat Molars. BDJ Open 2023, 9, 31. [Google Scholar] [CrossRef] [PubMed]
  42. Yang, J.; Andre, P.; Ye, L.; Yang, Y.-Z. The Hedgehog Signaling Pathway in Bone Formation. Int. J. Oral Sci. 2015, 7, 73–79. [Google Scholar] [CrossRef] [PubMed]
  43. Zhang, L.; Yang, Y.; Liao, Z.; Liu, Q.; Lei, X.; Li, M.; Zhang, S.; Hong, D.; Zhu, M.; Li, B.; et al. Genetic and Pharmacological Activation of Hedgehog Signaling Inhibits Osteoclastogenesis and Attenuates Titanium Particle-Induced Osteolysis Partly Through Suppressing the JNK/c-Fos-NFATc1 Cascade. Theranostics 2020, 10, 6638–6660. [Google Scholar] [CrossRef] [PubMed]
  44. Kawahira, N.; Ohtsuka, D.; Kida, N.; Ken-Ichi Hironaka, K.-I.; Morishita, Y. Quantitative Analysis of 3D Tissue Deformation Reveals Key Cellular Mechanism Associated with Initial Heart Looping. Cell Rep. 2020, 30, 3889–3903. [Google Scholar] [CrossRef] [PubMed]
  45. Morishita, Y.; Kuroiwa, A.; Suzuki, T. Quantitative Analysis of Tissue Deformation Dynamics Reveals Three Characteristic Growth Modes and Globally Aligned Anisotropic Tissue Deformation During Chick Limb Development. Development 2015, 142, 1672–1683. [Google Scholar] [CrossRef] [PubMed]
  46. Dworkin, S.; Yeliz Boglev, Y.; Owens, H.; Goldie, S.J. The Role of Sonic Hedgehog in Craniofacial Patterning, Morphogenesis and Cranial Neural Crest Survival. J. Dev. Biol. 2016, 4, 24. [Google Scholar] [CrossRef] [PubMed]
  47. Morita, R.; Miho Kihira, M.; Nakatsu, Y.; Nomoto, Y.; Ogawa, M.; Ohashi, K.; Mizuno, K.; Tachikawa, T.; Ishimoto, Y.; Morishita, Y.; et al. Coordination of Cellular Dynamics Contributes to Tooth Epithelium Deformations. PLoS ONE 2016, 11, e0161336. [Google Scholar] [CrossRef] [PubMed]
  48. Corrigall, D.; Walther, R.F.; Rodriguez, L.; Pierre Fichelson, P.; Pichaud, F. Hedgehog Signaling is a Principal Inducer of Myosin-II-driven Cell Ingression in Drosophila Epithelia. Dev. Cell 2007, 13, 730–742. [Google Scholar] [CrossRef] [PubMed]
  49. Polizio, A.H.; Chinchilla, P.; Chen, X.; Manning, D.R.; Riobo, N.A. Sonic Hedgehog Activates the GTPases Rac1 and RhoA in a Gli-Independent Manner Through Coupling of Smoothened to GI proteins. Sci. Signal 2011, 4, pt7. [Google Scholar]
  50. Katsumi, A.; Milanini, J.; Kiosses, W.B.; Miguel, A.; del Pozo, M.A.; Kaunas, R.; Chien, S.; Hahn, K.M.; Schwartz, M.A. Effects of Cell Tension on the Small GTPase Rac. J. Cell Biol. 2002, 158, 153–164. [Google Scholar] [CrossRef]
  51. Shyy, J.Y.; Chien, S. Role of integrins in cellular responses to mechanical stress and adhesion. Curr. Opin. Cell Biol. 1997, 9, 707–713. [Google Scholar] [CrossRef] [PubMed]
  52. Lessey, E.C.; Guilluy, C.; Burridge, K. From Mechanical Force to RhoA Activation. Biochemistry 2012, 51, 7420–7432. [Google Scholar] [CrossRef] [PubMed]
  53. Khatiwala, C.B.; Kim, P.D.; Peyton, S.R.; Putnam, A.J. ECM Compliance Regulates Osteogenesis by Influencing MAPK Signaling Downstream of RhoA and ROCK. J. Bone Min. Res. 2009, 24, 886–898. [Google Scholar] [CrossRef]
  54. Hamamura, K.; Swarnkar, G.; Tanjung, N.; Cho, E.; Li, J.; Na, S.; Yokota, H. RhoA-mediated signaling in mechanotransduction of osteoblasts. Connect. Tissue Res. 2012, 53, 398–406. [Google Scholar] [CrossRef] [PubMed]
  55. Wang, J.; Xu, C.; Zhang, J.; Bao, Y.; Tang, Y.; Lv, X.; Ma, B.; Wu, X.; Mao, G. RhoA promotes osteoclastogenesis and regulates bone remodeling through mTOR-NFATc1 signaling. Mol. Med. 2023, 29, 102. [Google Scholar] [CrossRef] [PubMed]
  56. Dutzmann, J.; Koch, A.; Weisheit, S.; Sonnenschein, K.; Korte, L.; Haertlé, M.; Thum, T.; Bauersachs, J.; Sedding, D.G.; Daniel, J.-M. Sonic Hedgehog-Dependent Activation of Adventitial Fibroblasts Promotes Neointima Formation. Cardiovasc. Res. 2017, 113, 1653–1663. [Google Scholar] [CrossRef]
  57. Su, P.H.; Huang, R.L.; Lai, H.C.; Chen, L.Y.; Weng, Y.C.; Wang, C.C.; Wu, C.C. NKX6-1 Mediates Cancer Stem-Like Properties and Regulates Sonic Hedgehog Signaling in Leiomyosarcoma. J. Biomed. Sci. 2021, 28, 32. [Google Scholar] [CrossRef]
Figure 1. Effects of compression force on the fibrosed layers of HGF and the PDLF cells. The optimal orthodontic force (1.0 g/cm2, a and b) and the strong orthodontic force (4.0 g/cm2, c and d) were, in duplicate, placed on HGF (A) and PDLF (B) confluent cells in Petri dishes. Glass was only used as a control. No glass and no weights was also used as a negative control. After 24 h, the HGF and PDLF cells were photographed and observed using a camera. The white area shows the cells that remained and the black area shows the PDLF cells that were removed from the Petri dish. Representative data from more than three independent experiments are presented in the form of pictures.
Dentistry 12 00108 g001
Figure 2. Observation of white round cells under a compression force on the fibrosed layers of PDLF cells. An optimal orthodontic force (1.0 g/cm2) and a strong orthodontic force (4.0 g/cm2) were placed on PDLF-confluent cells in Petri dish. No glass and no weights was also used as a negative control (NC). Glass was only placed as a control (C). After 24 h, the PDLF cells were observed and pictures were taken using a microscope (A). Representative data from more than three independent experiments are presented in the pictures. White round cells in the HGF (B) and PDLF (C) cells were counted in 2.16 × 1.6 mm2 pictures. The scale bar indicates 0.17 mm. At least five pictures were taken in each experiment. The data indicate the mean ± SD of three independent experiments. The asterisks indicate a significant difference at 24 h after the culture in the NC, C, 1.0 g/cm2 group, and 4.0 g/cm2 group (NC, C, and 1.0 g/cm2 vs. 4.0 g/cm2 group, *: p < 0.05, NC and C vs. 1.0 g/cm2, **: p < 0.05).
Dentistry 12 00108 g002
Figure 3. Observation of PDLF cells removed by compression force on the fibrosed layers of PDLF cells. The optimal orthodontic force (1.0 g/cm2, c and d), the strong orthodontic force (4.0 g/cm2, e and f), and control (glass only (a and b)) were placed on PDLF-confluent cells in a Petri dish. No glass and no weights was also used as a negative control. After 24 h, the PDLF cells were detached when removing the glass and washing with fresh medium. The detached cells were re-incubated on the Petri dish in fresh 10%FBS α-MEM. Some of the grown cells were attached and observed by microscope. The scale bar indicates 0.07 mm. Representative data from more than three independent experiments are presented in the pictures.
Dentistry 12 00108 g003
Figure 4. Quantitative analysis of LDH in the culture supernatant of PDLF cells with 1.0 g/cm2 and 4.0 g/cm2 weights. The optimal orthodontic force (1.0 g/cm2, c and d) and the strong orthodontic force (4.0 g/cm2, e, f and g) were placed on PDLF-confluent cells in Petri dishes. Glass only was used as a control (a and b). No glass and no weight was also used as a negative control. At 6 h after the start of the culture, culture supernatants were extracted as a 0~6 h sample and fresh 10%FBS α-MEM was added and the culture was continued. At 18 h after culture re-start, culture supernatants were extracted as a 6~24 h sample. The cells were lysed by lysis buffer and the lysed cells were used as a positive control. LDH was measured in all samples. The data indicate the mean ± SD of triplicate experiments. The independent experiments were performed three times, with similar results obtained in each experiment.
Dentistry 12 00108 g004
Figure 5. RNA concentration at various times after culture in PDLF cells with weights. The optimal orthodontic force (1.0 g/cm2) and the strong orthodontic force (4.0 g/cm2) were placed on PDLF-confluent cells in Petri dishes. Glass only was used as a control. No glass and no weights was also used as a negative control (NC). At 2, 4, 6, 8, 12, and 24 h after culture start, total RNA was extracted from the attached PDLF cells and the removed cells at 24 h. The data indicate the mean ± SD of three independent experiments. The asterisks indicate a significant difference between RNA concentrations at various times in the 4.0 g/cm2 group (one way ANOVA analysis, *: p < 0.05).
Dentistry 12 00108 g005
Figure 6. Observation of white round cells in PDLF cells stained by MTT. Cell viabilities were observed using the MTT method. The optimal orthodontic force (1.0 g/cm2) and the strong orthodontic force (4.0 g/cm2) were placed on various cells in Petri dishes. The glass plate only was only used as a control. After 24 h, the cells were observed and pictures were taken using a microscope (×200 magnification). White round cells stained (black arrow) and not stained (white arrow) by MTT were observed in PDLF cells under 1.0 g/cm2 and 4.0 g/cm2 weights. The scale bar indicates 0.04 mm. At least five pictures were taken in each experiment. Representative data from two independent experiments were presented in the pictures.
Dentistry 12 00108 g006
Figure 7. Observation of protein bands for Shh, RANKL, and IL-6 in culture supernatants of the HGF and the PDLF cells under different weights. The optimal orthodontic force (1.0 g/cm2) and the strong orthodontic force (4.0 g/cm2) were, in duplicate, placed on HGF and PDLF-confluent cells in Petri dishes. Glass only was used as a control (C). No glass and no weights was also used as a negative control (NC). At 6 h after culture start, culture supernatants were extracted as a 0~6 h sample and fresh 10%FBS α-MEM was added and the culture was continued. At 18 h after culture re-start, culture supernatants were extracted as a 6~24 h sample. SDS-PAGE and Western blotting using antibodies for Shh, RNAKL, and IL-6 were performed for the 0~6 h and 6~24 h samples, and positive bands were presented and compared each other. Representative data from more than three independent experiments are presented in the pictures.
Dentistry 12 00108 g007
Figure 8. Quantitative analysis of protein bands for Shh, RANKL, and IL-6 in culture supernatants of the HGF (black bar) and the PDLF (white bar) cells under different weights. Protein bands in Figure 7 were quantitatively measured by ImageJ. Glass only was used as a control (C). No glass and no weights was also used as a negative control (NC). The results of brightness were expressed as the means ± SD of three independent experiments. The asterisks indicate a significant difference in brightness of the 1.0 g/cm2 group or the 4.0 g/cm2 group (vs. NC and C, *: p < 0.05).
Dentistry 12 00108 g008
Figure 9. The gene expression of Shh, RANKL, and IL-6 at various times after culture in PDLF cells under different weights. The optimal orthodontic force (1.0 g/cm2) and the strong orthodontic force (4.0 g/cm2) were placed on PDLF-confluent cells in Petri dishes. Glass only was used as a control. After extraction of total RNA, real-time PCR was performed to detect the gene expression of Shh (A), RANKL (B), and IL-6 (C). The results are expressed as the means ± SD of three independent experiments. The asterisks indicate a significant difference among RNA concentration at various times (control vs. 1.0 g/cm2 or 4.0 g/cm2 group, *: p < 0.05, 1.0 g/cm2 vs. 4.0 g/cm2 group, **: p < 0.05).
Dentistry 12 00108 g009aDentistry 12 00108 g009b
Figure 10. Observation of the relationship between Shh and RANKL or IL-6 in culture supernatants of the PDLF cells under different weights. The optimal orthodontic force (1.0 g/cm2) and the strong orthodontic force (4.0 g/cm2) were placed on PDLF-confluent cells. The cultures were performed with and without RU-SKI 43, an Shh signal inhibitor. Glass only was used as a control. At 6~24 h after culture, culture supernatants were extracted, and SDS-PAGE and Western blotting using antibodies to Shh, RNAKL, and IL-6 were performed in the 6~24 h samples. Positive bands were presented and compared to each other. Representative data from more than three independent experiments are presented in the pictures.
Dentistry 12 00108 g010
Figure 11. Quantitative measurement of IL-6 in culture supernatants of the PDLF cells under different weights. The optimal orthodontic force (1.0 g/cm2) and the strong orthodontic force (4.0 g/cm2) were placed on PDLF-confluent cells. The culture samples with and without RU-SKI 43, an Shh signal inhibitor, in Figure 10 were quantitatively measured by ELISA. Glass only was used as a control (C). No glass and no weights was also used as a negative control (NC). The results of IL-6 concentration were expressed as the means ± SD of three independent experiments. The asterisks indicate a significant difference in 1.0 g/cm2 group or 4.0 g/cm2 group (vs NC and C, *: p < 0.05, **: p < 0.05, addition of RU-SKI 43 vs. no addition of RU-SKI 43 and ***: p < 0.01, addition of RU-SKI 43 vs. no addition of RU-SKI 43).
Dentistry 12 00108 g011
Figure 12. The summary schema of mechanical force- and Shh-dependent production of cytokines.
Dentistry 12 00108 g012
Table 1. Primers of target genes.
GeneForward (5′-3′)Reverse (5′-3′)
ShhGGACAGGCTGATGACTCAGAGCCCTCGTAGTGCAGAGACT
RANKLGCCTTTCAAGGAGCTGTGCAAAAGAGCAAAAGGCTGAGCTTCAAGC
IL-6AGACAGCCACTCACCTCTTCAGTTCTGCCAGTGCCTCTTTGC
GAPDHGTCAGTGGTGGACCTGACCTTGCTGTAGCCAAATTCGTTG
Disclaimer/Publisher’s Note: The statements, opinions and data contained in all publications are solely those of the individual author(s) and contributor(s) and not of MDPI and/or the editor(s). MDPI and/or the editor(s) disclaim responsibility for any injury to people or property resulting from any ideas, methods, instructions or products referred to in the content.

