

Evaluation of Biomarkers of Bone Metabolism on Salivary Matrix in the Remodeling of Periodontal Tissue during Orthodontic Treatment
 , , ,
, , , 
Abstract
:1. Introduction
2. Materials and Methods
2.1. General Exclusion Criteria
2.1.1. Periodontal Exclusion Criteria
2.1.2. Orthodontic Evaluation
2.2. Salivary Sample Collection
2.3. Verification of Blood Contamination on the Salivary Samples
2.4. Analysis of Bone Metabolic Biomarkers (BMTs)
2.5. Statistic Analysis
3. Results
Subject Clinic
4. Discussion
5. Conclusions
Author Contributions
Funding
Institutional Review Board Statement
Informed Consent Statement
Data Availability Statement
Acknowledgments
Conflicts of Interest
References
- Beckwith, F.R.; Ackerman, R.J., Jr.; Cobb, C.M.; Tira, D.E. An evaluation of factors affecting duration of orthodontic treatment. Am. J. Orthod. Dentofac. Orthop. 1999, 115, 439–447. [Google Scholar] [CrossRef]
- Cattaneo, P.; Dalstra, M.; Melsen, B. Strains in periodontal ligament and alveolar bone associated with orthodontic tooth movement analyzed by finite element. Orthod. Craniofacial Res. 2009, 12, 120–128. [Google Scholar] [CrossRef]
- Kloukos, D.; Mavrogonatou, E.; Kletsas, D.; Makras, P.; Koukos, G.; Stavropoulos, A.; Katsaros, C. Bone turnover markers in gingival crevicular fluid and blood serum of patients with fixed orthodontic appliances. Eur. J. Orthod. 2022, 44, 412–419. [Google Scholar] [CrossRef]
- Krishnan, V.; Davidovitch, Z. Cellular, molecular, and tissue-level reactions to orthodontic force. Am. J. Orthod. Dentofac. Orthop. 2006, 129, 469.e1–469.e32. [Google Scholar] [CrossRef]
- Kumar, A.A.; Saravanan, K.; Kohila, K.; Kumar, S.S. Biomarkers in orthodontic tooth movement. J. Pharm. Bioallied Sci. 2015, 7 (Suppl. 2), S325. [Google Scholar] [CrossRef]
- Xu, H.; Zhang, S.; Sathe, A.A.; Jin, Z.; Guan, J.; Sun, W.; Xing, C.; Zhang, H.; Yan, B. CCR2+ Macrophages Promote Orthodontic Tooth Movement and Alveolar Bone Remodeling. Front. Immunol. 2022, 13, 835986. [Google Scholar] [CrossRef]
- Zhang, M.; Yu, Y.; He, D.; Liu, D.; Zhou, Y. Neural regulation of alveolar bone remodeling and periodontal ligament metabolism during orthodontic tooth movement in response to therapeutic loading. J. World Fed. Orthod. 2022, 139, 139–145. [Google Scholar] [CrossRef]
- Vandevska-Radunovic, V.; Kvinnsland, I.H.; Kvinnsland, S.; Jonsson, R. Immunocompetent cells in rat periodontal ligament and their recruitment incident to experimental orthodontic tooth movement. Eur. J. Oral Sci. 1997, 105, 36–44. [Google Scholar] [CrossRef]
- Alhashimi, N.; Frithiof, L.; Brudvik, P.; Bakhiet, M. Orthodontic tooth movement and de novo synthesis of proinflammatory cytokines. Am. J. Orthod. Dentofac. Orthop. 2001, 119, 307–312. [Google Scholar] [CrossRef]
- Davidovitch, Z.; Nicolay, O.F.; Ngan, P.W.; Shanfeld, J.L. Neurotransmitters, cytokines, and the control of alveolar bone remodeling in orthodontics. Dent. Clin. N. Am. 1988, 32, 411–435. [Google Scholar] [CrossRef]
- Baba, S.; Kuroda, N.; Arai, C.; Nakamura, Y.; Sato, T. Immunocompetent cells and cytokine expression in the rat periodontal ligament at the initial stage of orthodontic tooth movement. Arch. Oral Biol. 2011, 56, 466–473. [Google Scholar] [CrossRef]
- Tuncer, B.B.; Özmeriç, N.; Tuncer, C.; Teoman, I.; Cakilci, B.; Yücel, A.; Alpar, R.; Baloş, K. Levels of interleukin-8 during tooth movement. Angle Orthod. 2005, 75, 631–636. [Google Scholar]
- Lee, W. Experimental study of the effect of prostaglandin administration on tooth movement—With particular emphasis on the relationship to the method of PGE1 administration. Am. J. Orthod. Dentofac. Orthop. 1990, 98, 231–241. [Google Scholar] [CrossRef]
- Buczko, P.; Knaś, M.; Grycz, M.; Szarmach, I.; Zalewska, A. Orthodontic treatment modifies the oxidant–antioxidant balance in saliva of clinically healthy subjects. Adv. Med. Sci. 2017, 62, 129–135. [Google Scholar] [CrossRef]
- Kovac, V.; Poljsak, B.; Perinetti, G.; Primozic, J. Systemic level of oxidative stress during orthodontic treatment with fixed appliances. BioMed Res. Int. 2019, 2019, 1–6. [Google Scholar] [CrossRef]
- Menéndez López-Mateos, C.; Menéndez López-Mateos, M.L.; Aguilar-Salvatierra, A.; Gómez-Moreno, G.; Carreño, J.C.; Khaldy, H.; Menéndez-Núñez, M. Salivary Markers of Oxidative Stress in Patients Undergoing Orthodontic Treatment with Clear Aligners versus Self-Ligating Brackets: A Non-Randomized Clinical Trial. J. Clin. Med. 2022, 11, 3531. [Google Scholar] [CrossRef]
- Tóthová, L.; Kamodyova, N.; Červenka, T.; Celec, P. Salivary markers of oxidative stress in oral diseases. Front. Cell. Infect. Microbiol. 2015, 5, 73. [Google Scholar] [CrossRef]
- Chelărescu, S.; Șurlin, P.; Decusară, M.; Oprică, M.; Bud, E.; Teodorescu, E.; Elsaafin, M.N.; Păcurar, M. Evaluation of IL1β and IL6 gingival crevicular fluid levels during the early phase of orthodontic tooth movement in adolescents and young adults. Appl. Sci. 2021, 11, 521. [Google Scholar] [CrossRef]
- Nunes, L.; Quintanilha, L.; Perinetti, G.; Junior, J.C. Effect of orthodontic force on expression levels of ten cytokines in gingival crevicular fluid. Arch. Oral Biol. 2017, 76, 70–75. [Google Scholar] [CrossRef]
- d’Apuzzo, F.; Cappabianca, S.; Ciavarella, D.; Monsurrò, A.; Silvestrini-Biavati, A.; Perillo, L. Biomarkers of periodontal tissue remodeling during orthodontic tooth movement in mice and men: Overview and clinical relevance. Sci. World J. 2013, 2013, 105873. [Google Scholar] [CrossRef]
- Domínguez Camacho, A.; Velásquez Cujar, S.A. Reevaluation of the Strain Pressure Theory. Toward a better understanding the biology of tooth movement. Int. J. Odontostomatol. 2017, 11, 133–140. [Google Scholar] [CrossRef]
- Smith, R.J.; Burstone, C.J. Mechanics of tooth movement. Am. J. Orthod. 1984, 85, 294–307. [Google Scholar] [CrossRef]
- Bartzela, T.; Türp, J.C.; Motschall, E.; Maltha, J.C. Medication effects on the rate of orthodontic tooth movement: A systematic literature review. Am. J. Orthod. Dentofac. Orthop. 2009, 135, 16–26. [Google Scholar] [CrossRef]
- Pilon, J.J.; Kuijpers-Jagtman, A.M.; Maltha, J.C. Magnitude of orthodontic forces and rate of bodily tooth movement. An experimental study. Am. J. Orthod. Dentofac. Orthop. 1996, 110, 16–23. [Google Scholar] [CrossRef]
- Dolce, C.; Malone, J.S.; Wheeler, T.T. Current concepts in the biology of orthodontic tooth movement. Semin. Orthod. 2002, 8, 6–12. [Google Scholar] [CrossRef]
- Duvina, M.; Barbato, L.; Brancato, L.; Delle Rose, G.; Amunni, F.; Tonelli, P. Biochemical markers as predictors of bone remodelling in dental disorders: A narrative description of literature. Clin. Cases Miner. Bone Metab. 2012, 9, 100. [Google Scholar]
- Agrawal, P.; Goel, D. Biomarkers in Orthodontics: An Overview. Exec. Educ. 2020, 11, 687. [Google Scholar]
- Polizzi, A.; Quinzi, V.; Lo Giudice, A.; Marzo, G.; Leonardi, R.; Isola, G. Accuracy of Artificial Intelligence Models in the Prediction of Periodontitis: A Systematic Review. JDR Clin. Trans. Res. 2024, 23800844241232318. [Google Scholar] [CrossRef] [PubMed]
- Gaur, A.; Maheshwari, S.; Verma, S.K. Detection of molecular biomarkers as a diagnostic tool in the planning and progression of orthodontic treatment. J. Orofac. Sci. 2017, 9, 80–84. [Google Scholar] [CrossRef]
- Dipalma, G.; Inchingolo, A.D.; Inchingolo, F.; Charitos, I.A.; Di Cosola, M.; Cazzolla, A.P. Focus on the cariogenic process: Microbial and biochemical interactions with teeth and oral environment. J. Biol. Regul. Homeost. Agents 2021, 35, 20–747. [Google Scholar] [CrossRef] [PubMed]
- Pappa, E.; Vougas, K.; Zoidakis, J.; Vastardis, H. Proteomic advances in salivary diagnostics. Biochim. Biophys. Acta Proteins Proteom. 2020, 1868, 140494. [Google Scholar] [CrossRef] [PubMed]
- D’Amario, M.; Barone, A.; Marzo, G.; Giannoni, M. Caries-risk assessment: The role of salivary tests. Minerva Stomatol. 2006, 55, 449–463. [Google Scholar]
- Jasim, H.; Carlsson, A.; Hedenberg-Magnusson, B.; Ghafouri, B.; Ernberg, M. Saliva as a medium to detect and measure biomarkers related to pain. Sci. Rep. 2018, 8, 3220. [Google Scholar] [CrossRef]
- Lima, D.P.; Diniz, D.G.; Moimaz, S.A.S.; Sumida, D.H.; Okamoto, A.C. Saliva: Reflection of the body. Int. J. Infect. Dis. 2010, 14, e184–e188. [Google Scholar] [CrossRef] [PubMed]
- Kapoor, P.; Chowdhry, A.; Bagga, D.K.; Bhargava, D.; Aishwarya, S. MicroRNAs in oral fluids (saliva and gingival crevicular fluid) as biomarkers in orthodontics: Systematic review and integrated bioinformatic analysis. Prog. Orthod. 2021, 22, 31. [Google Scholar] [CrossRef] [PubMed] [PubMed Central]
- Olteanu, C.; Muresan, A.; Daicoviciu, D.; Tarmure, V.; Olteanu, I.; Keularts, I.M. Variations of Some Saliva Markers of The Oxidative Stress in Patients with Orthodontic Appliances. Physiol./Fiziol. 2019, 19, 26. [Google Scholar]
- Sreebny, L.M.; Schwartz, S.S. A reference guide to drugs and dry mouth–2nd edition. Gerodontology 1997, 14, 33–47. [Google Scholar] [CrossRef]
- Gug, I.T.; Tertis, M.; Hosu, O.; Cristea, C. Salivary biomarkers detection: Analytical and immunological methods overview. TrAC Trends Anal. Chem. 2019, 113, 301–316. [Google Scholar] [CrossRef]
- Pappa, E.; Kousvelari, E.; Vastardis, H. Saliva in the “Omics” era: A promising tool in paediatrics. Oral Dis. 2019, 25, 16–25. [Google Scholar] [CrossRef]
- Spielmann, N.; Wong, D.T. Saliva: Diagnostics and therapeutic perspectives. Oral Dis. 2011, 17, 345–354. [Google Scholar] [CrossRef]
- George, A.K.; Nisha, K.; Malaiappan, S.; George, V.T. Methodological Considerations in Salivary Proteomics for Periodontal Research-A Review. J. Pharm. Bioallied Sci. 2023, 15 (Suppl. 1), S22–S26. [Google Scholar] [CrossRef] [PubMed]
- Schipper, R.G.; Silletti, E.; Vingerhoeds, M.H. Saliva as research material: Biochemical, physicochemical and practical aspects. Arch. Oral Biol. 2007, 52, 1114–1135. [Google Scholar] [CrossRef] [PubMed]
- Roi, A.; Rusu, L.C.; Roi, C.I.; Luca, R.E.; Boia, S.; Munteanu, R.I. A New Approach for the Diagnosis of Systemic and Oral Diseases Based on Salivary Biomolecules. Dis. Markers 2019, 2019, 8761860. [Google Scholar] [CrossRef] [PubMed] [PubMed Central]
- Greenblatt, M.B.; Tsai, J.N.; Wein, M.N. Bone Turnover Markers in the Diagnosis and Monitoring of Metabolic Bone Disease. Clin. Chem. 2017, 63, 464–474. [Google Scholar] [CrossRef] [PubMed]
- Morris, H.A.; Eastell, R.; Jorgensen, N.R.; Cavalier, E.; Vasikaran, S.; Chubb, S.; Kanis, J.; Cooper, C.; Makris, K. Clinical usefulness of bone turnover marker concentrations in osteoporosis. Clin. Chim. Acta 2017, 467, 34–41. [Google Scholar] [CrossRef]
- Cosman, F.; de Beur, S.J.; LeBoff, M.S.; Lewiecki, E.M.; Tanner, B.; Randall, S.; Lindsay, R.; National Osteoporosis Foundation. Clinician’s Guide to Prevention and Treatment of Osteoporosis. Osteoporos. Int. 2014, 25, 2359–2381. [Google Scholar] [CrossRef]
- Compston, J.; The National Osteoporosis Guideline Group (NOGG); Cooper, A.; Cooper, C.; Gittoes, N.; Gregson, C.; Harvey, N.; Hope, S.; Kanis, J.A.; McCloskey, E.V.; et al. UK clinical guideline for the prevention and treatment of osteoporosis. Arch. Osteoporos. 2017, 12, 43. [Google Scholar] [CrossRef]
- Kanis, J.A.; Burlet, N.; Cooper, C.; Delmas, P.D.; Reginster, J.-Y.; Borgstrom, F.; Rizzoli, R. European guidance for the diagnosis and management of osteoporosis in postmenopausal women. Osteoporos. Int. 2008, 19, 399–428. [Google Scholar] [CrossRef] [PubMed]
- Vasikaran, S.; Cooper, C.; Eastell, R.; Griesmacher, A.; Morris, H.A.; Trenti, T.; Kanis, J.A. International Osteoporosis Foundation and International Federation of Clinical Chemistry and Laboratory Medicine position on bone marker standards in osteoporosis. Clin. Chem. Lab. Med. 2011, 49, 1271–1274. [Google Scholar] [CrossRef]
- Szulc, P.; Naylor, K.; Hoyle, N.R.; Eastell, R.; Leary, E.T. Use of CTX-I and PINP as bone turnover markers: National Bone Health Alliance recommendations to standardize sample handling and patient preparation to reduce pre-analytical variability. Osteoporos. Int. 2017, 28, 2541–2556. [Google Scholar] [CrossRef]
- Lorentzon, M.; Branco, J.; Brandi, M.L.; Bruyère, O.; Chapurlat, R.; Cooper, C.; Cortet, B.; Diez-Perez, A.; Ferrari, S.; Gasparik, A.; et al. Algorithm for the Use of Biochemical Markers of Bone Turnover in the Diagnosis, Assessment and Follow-Up of Treatment for Osteoporosis. Adv. Ther. 2019, 36, 2811–2824. [Google Scholar] [CrossRef] [PubMed]
- Brown, J.P.; Don-Wauchope, A.; Douville, P.; Albert, C.; Vasikaran, S.D. Current use of bone turnover markers in the management of osteoporosis. Clin. Biochem. 2022, 109–110, 1–10. [Google Scholar] [CrossRef] [PubMed]
- Halleen, J.M.; Ylipahkala, H.; Alatalo, S.L.; Janckila, A.; Heikkinen, J.; Suominen, H.; Cheng, S.; Väänänen, H. Serum tartrate-resistant acid phosphatase 5b, but not 5a, correlates with other markers of bone turnover and bone mineral density. Calcif. Tissue Int. 2002, 71, 20–25. [Google Scholar] [CrossRef] [PubMed]
- Janckila, A.J.; Yam, L.T. Biology and clinical significance of tartrate-resistant acid phosphatases: New perspectives on an old enzyme. Calcif. Tissue Int. 2009, 85, 465–483. [Google Scholar] [CrossRef] [PubMed]
- Vääräniemi, J.; Halleen, J.M.; Kaarlonen, K.; Ylipahkala, H.; Alatalo, S.L.; Andersson, G.; Kaija, H.; Vihko, P.; Väänänen, H.K. Intracellular machinery for matrix degradation in bone-resorbing osteoclasts. J. Bone Miner. Res. 2004, 19, 1432–1440. [Google Scholar] [CrossRef] [PubMed]
- Chu, P.; Chao, T.Y.; Lin, Y.F.; Janckila, A.J.; Yam, L.T. Correlation between histomorphometric parameters of bone resorption and serum type 5b tartrate-resistant acid phosphatase in uremic patients on maintenance hemodialysis. Am. J. Kidney Dis. Off. J. Natl. Kidney Found. 2003, 41, 1052–1059. [Google Scholar] [CrossRef] [PubMed]
- Halleen, J.M.; Tiitinen, S.L.; Ylipahkala, H.; Fagerlund, K.M.; Vaananen, H.K. Tartrate-resistant acid phosphatase 5b (TRACP 5b) as a marker of bone resorption. Clin. Lab. 2006, 52, 499–510. [Google Scholar] [PubMed]
- Martin, T.J. Parathyroid Hormone-Related Protein, Its Regulation of Cartilage and Bone Development, and Role in Treating Bone Diseases. Physiol. Rev. 2016, 96, 831–871. [Google Scholar] [CrossRef] [PubMed]
- Calvi, L.M.; Shin, H.I.; Knight, M.C.; Weber, J.; Young, M.; Giovannetti, A.; Schipani, E. Constitutively active PTH/PTHrP receptor in odontoblasts alters odontoblast and ameloblast function and maturation. Mech. Dev. 2004, 121, 397–408. [Google Scholar] [CrossRef]
- Boabaid, F.; Berry, J.E.; Koh, A.J.; Somerman, M.J.; McCcauley, L.K. The role of parathyroid hormone-related protein in the regulation of osteoclastogenesis by cementoblasts. J. Periodontol. 2004, 75, 1247–1254. [Google Scholar] [CrossRef]
- Philbrick, W.M.; Dreyer, B.E.; Nakchbandi, I.A.; Karaplis, A.C. Parathyroid hormone-related protein is required for tooth eruption. Proc. Natl. Acad. Sci. USA 1998, 95, 11846–11851. [Google Scholar] [CrossRef] [PubMed]
- Brescia, V.; Fontana, A.; Lovero, R.; Capobianco, C.; Marsico, S.V.; De Chirico, T.; Pinto, C.; Mascolo, E.; Cazzolla, A.P.; Faienza, M.F.; et al. Parathyroid Hormone-Related Peptide (PTHrP): Evaluation of Pediatric, Covariate-Stratified Reference Intervals. Children 2022, 9, 896. [Google Scholar] [CrossRef] [PubMed] [PubMed Central]
- Wise, G.E.; Que, B.G.; Huang, H.; Lumpkin, S.J. Enhancement of gene expression in rat dental follicle cells by parathyroid hormone-related protein. Arch. Oral Biol. 2000, 45, 903–909. [Google Scholar] [CrossRef] [PubMed]
- Bishara, S.E.; Jakobsen, J.R.; Treder, J.E.; Stasl, M.J. Changes in the maxillary and mandibular tooth size-arch length relationship from early adolescence to early adulthood: A longitudinal study. Am. J. Orthod. Dentofac. Orthop. 1989, 95, 46–59. [Google Scholar] [CrossRef] [PubMed]
- Bishara, S.E.; Ortho, D.; Jakobsen, J.R.; Treder, J.; Nowak, A. Arch width changes from 6 weeks to 45 years of age. Am. J. Orthod. Dentofac. Orthop. 1997, 111, 401–409. [Google Scholar] [CrossRef] [PubMed]
- Papapanou, P.N.; Sanz, M.; Buduneli, N.; Dietrich, T.; Feres, M.; Fine, D.H.; Flemmig, T.F.; Garcia, R.; Giannobile, W.V.; Graziani, F.; et al. Periodontitis: Consensus report of workgroup 2 of the 2017 World Workshop on the Classification of Periodontal and Peri-Implant Diseases and Conditions. J. Periodontol. 2018, 89 (Suppl. 1), S173–S182. [Google Scholar] [CrossRef] [PubMed]
- Jaber, S.T.; Hajeer, M.Y.; Alkhouli, K.W.; Al-Shamak, R.M.; Darwich, K.M.; Aljabban, O.; Alam, M.K.; Kara-Boulad, J.M. Evaluation of Three-Dimensional Digital Models Formulated from Direct Intra-oral Scanning of Dental Arches in Comparison With Extra-oral Scanning of Poured Dental Models in Terms of Dimensional Accuracy and Reliability. Cureus 2024, 16, e54869. [Google Scholar] [CrossRef] [PubMed]
- Yun, D.; Choi, D.S.; Jang, I.; Cha, B.K. Clinical application of an intraoral scanner for serial evaluation of orthodontic tooth movement: A preliminary study. Korean J. Orthod. 2018, 48, 262–267. [Google Scholar] [CrossRef] [PubMed]
- Bellagambi, F.G.; Lomonaco, T.; Salvo, P.; Vivaldi, F.; Hangouët, M.; Ghimenti, S.; Biagini, D.; Di Francesco, F.; Fuoco, R.; Errachid, A. Saliva sampling: Methods and devices. An overview. TrAC Trends Anal. Chem. 2020, 124, 115781. [Google Scholar] [CrossRef]
- Brescia, V.; Cazzolla, A.P.; Fontana, A.; Varraso, L.; Capobianco, C.; Lovero, R.; Muzio, L.L.; Dioguardi, M.; Faienza, M.F.; Crincoli, V.; et al. Bone Biomarkers Measured on Salivary Matrix: Study of Biological Variability in a Cohort of Young Subjects. Appl. Sci. 2023, 13, 10234. [Google Scholar] [CrossRef]
- Cohen, J. Statistical power analysis current directions. Psychol. Sci. 1992, 1, 98–101. [Google Scholar]
- Masella, R.S.; Chung, P.-L. Thinking beyond the wire: Emerging biologic relationships in orthodontics and periodontology. Semin. Orthod. 2008, 14, 290–304. [Google Scholar] [CrossRef]
- Meikle, M.C. The tissue, cellular, and molecular regulation of orthodontic tooth movement: 100 years after Carl Sandstedt. Eur. J. Orthod. 2006, 28, 221–240. [Google Scholar] [CrossRef] [PubMed]
- Proffit, W.R.; Fields, H.W.; Larson, B.; Sarver, D.M. Contemporary Orthodontics-e-Book; Elsevier Health Sciences: Amsterdam, The Netherlands, 2018. [Google Scholar]
- Li, Y.; Zhan, Q.; Bao, M.; Yi, J.; Li, Y. Biomechanical and biological responses of periodontium in orthodontic tooth movement: Up-date in a new decade. Int. J. Oral Sci. 2021, 13, 20. [Google Scholar] [CrossRef]
- Kakali, L.; Giantikidis, I.; Sifakakis, I.; Kalimeri, E.; Karamani, I.; Mavrogonatou, E.; Kloukos, D. Fluctuation of bone turnover markers’ levels in samples of gingival crevicular fluid after orthodontic stimulus: A systematic review. Syst. Rev. 2022, 11, 3. [Google Scholar] [CrossRef] [PubMed]
- Mah, J.; Prasad, N. Dentine phosphoproteins in gingival crevicular fluid during root resorption. Eur. J. Orthod. 2004, 26, 25–30. [Google Scholar] [CrossRef] [PubMed]
- Kaczor-Urbanowicz, K.E.; Deutsch, O.; Zaks, B.; Krief, G.; Chaushu, S.; Palmon, A. Identification of salivary protein biomarkers for orthodontically induced inflammatory root resorption. Proteom. Clin. Appl. 2017, 11, 1600119. [Google Scholar] [CrossRef] [PubMed]
- Borciani, G.; Montalbano, G.; Baldini, N.; Cerqueni, G.; Vitale-Brovarone, C.; Ciapetti, G. Co–culture systems of osteoblasts and osteoclasts: Simulating in vitro bone remodeling in regenerative approaches. Acta Biomater. 2020, 108, 22–45. [Google Scholar] [CrossRef] [PubMed]
- Marigo, L.; Migliaccio, S.; Monego, G.; La Torre, G.; Somma, F.; Ranelletti, F.O. Expression of parathyroid hormone-related protein in human inflamed dental pulp. Eur. Rev. Med. Pharmacol. Sci. 2010, 14, 471–475. [Google Scholar]
- Cui, Y.; Yang, M.; Zhu, J.; Zhang, H.; Duan, Z.; Wang, S.; Liao, Z.; Liu, W. Developments in diagnostic applications of saliva in human organ diseases. Med. Nov. Technol. Devices 2022, 13, 100115. [Google Scholar] [CrossRef]
- Brescia, V.; Tampoia, M. Biological variation of Cartilage Oligomeric Matrix Protein (COMP): A proposal to interpret laboratory serial testing. Clin. Chim. Acta Int. J. Clin. Chem. 2007, 380, 248–249. [Google Scholar] [CrossRef] [PubMed]
- Fraser, C.G. Inherent biological variation and reference values. Clin. Chem. Lab. Med. 2004, 42, 758–764. [Google Scholar] [CrossRef] [PubMed]
- Harris, E.K.; Yasaka, T. On the calculation of a “reference change” for comparing two consecutive measurements. Clin. Chem. 1983, 29, 25–30. [Google Scholar] [CrossRef] [PubMed]
- Castroflorio, T.; Gamerro, E.F.; Caviglia, G.P.; Deregibus, A. Biochemical markers of bone metabolism during early orthodontic tooth movement with aligners. Angle Orthod. 2017, 87, 74–81. [Google Scholar] [CrossRef] [PubMed]
- Kamodyová, N.; Celec, P. Salivary markers of oxidative stress and Salivette collection systems. Clin. Chem. Lab. Med. 2011, 49, 1887–1890. [Google Scholar] [CrossRef]
- Shetty, S.; Kapoor, N.; Bondu, J.D.; Thomas, N.; Paul, T.V. Bone turnover markers: Emerging tool in the management of osteoporosis. Indian J. Endocrinol. Metab. 2016, 20, 846. [Google Scholar] [PubMed]
- Sandberg, S.; Fraser, C.G.; Horvath, A.R.; Jansen, R.; Jones, G.; Oosterhuis, W.; Petersen, P.H.; Schimmel, H.; Sikaris, K.; Panteghini, M. Defining analytical performance specifications: Consensus Statement from the 1st Strategic Conference of the European Federation of Clinical Chemistry and Laboratory Medicine. Clin. Chem. Lab. Med. 2015, 53, 833–835. [Google Scholar] [CrossRef] [PubMed]
- Lv, Y.; Wang, G.; Xu, W.; Tao, P.; Lv, X.; Wang, Y. Tartrate-resistant acid phosphatase 5b is a marker of osteoclast number and volume in RAW 264.7 cells treated with receptor-activated nuclear κB ligand. Exp. Ther. Med. 2015, 9, 143–146. [Google Scholar] [CrossRef]
- Wahab, R.; Kasim, N.A.; Senafi, S.; Jemain, A.A.; Abidin, I.Z.Z.; Shahidan, M.; Ariffin, S.H.Z. Enzyme activity profiles and ELISA analysis of biomarkers from human saliva and gingival crevicular fluid during orthodontic tooth movement using self-ligating brackets. Oral Health Dent. Manag. 2014, 13, 194–199. [Google Scholar]
- Khan, R.S.; Khurshid, Z.; Yahya Ibrahim Asiri, F. Advancing Point-of-Care (PoC) Testing Using Human Saliva as Liquid Biopsy. Diagnostics 2017, 7, 39. [Google Scholar] [CrossRef]
- Cortes, A.R.G.; Agius, A.-M.; No-Cortes, J. Factors Affecting Trueness of Intraoral Scans: An Update. Appl. Sci. 2022, 12, 6675. [Google Scholar] [CrossRef]
- Gillett, M.J.; Vasikaran, S.D.; Inderjeeth, C.A. The role of PINP in diagnosis and management of metabolic bone disease. Clin. Biochem. Rev. 2021, 42, 3. [Google Scholar] [CrossRef] [PubMed]
- Koivula, M.-K.; Risteli, L.; Risteli, J. Measurement of aminoterminal propeptide of type I procollagen (PINP) in serum. Clin. Biochem. 2012, 45, 920–927. [Google Scholar] [CrossRef] [PubMed]
- Chavassieux, P.; Portero-Muzy, N.; Roux, J.-P.; Garnero, P.; Chapurlat, R. Are biochemical markers of bone turnover representative of bone histomorphometry in 370 postmenopausal women? J. Clin. Endocrinol. Metab. 2015, 100, 4662–4668. [Google Scholar] [CrossRef]
- Jeon, H.H.; Teixeira, H.; Tsai, A. Mechanistic insight into orthodontic tooth movement based on animal studies: A critical review. J. Clin. Med. 2021, 10, 1733. [Google Scholar] [CrossRef]


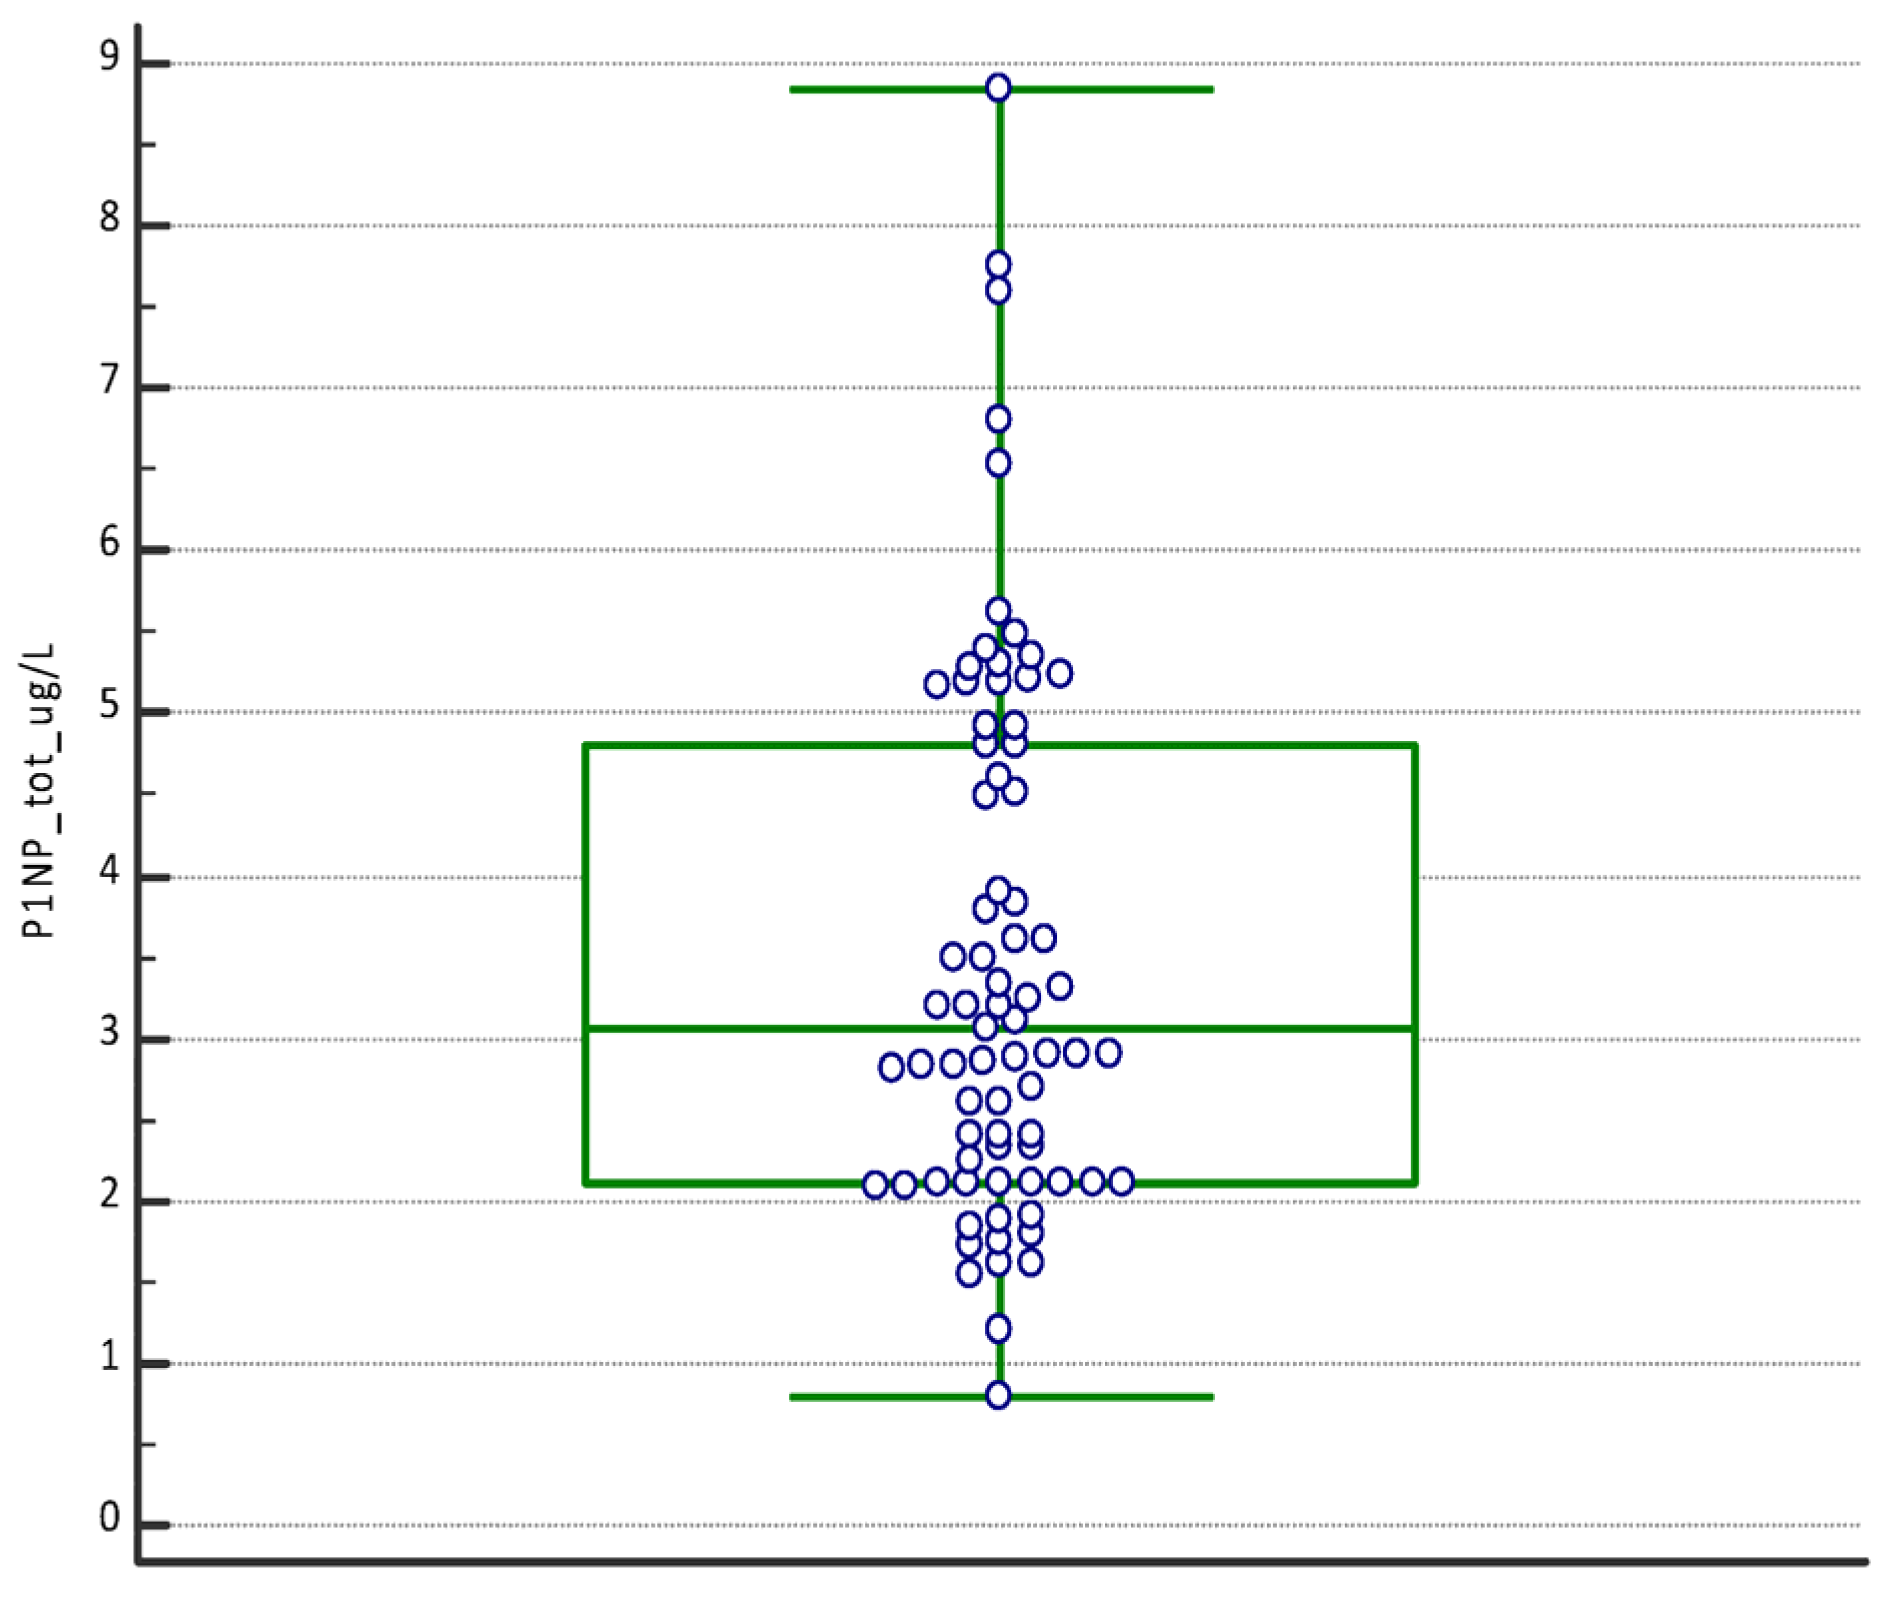
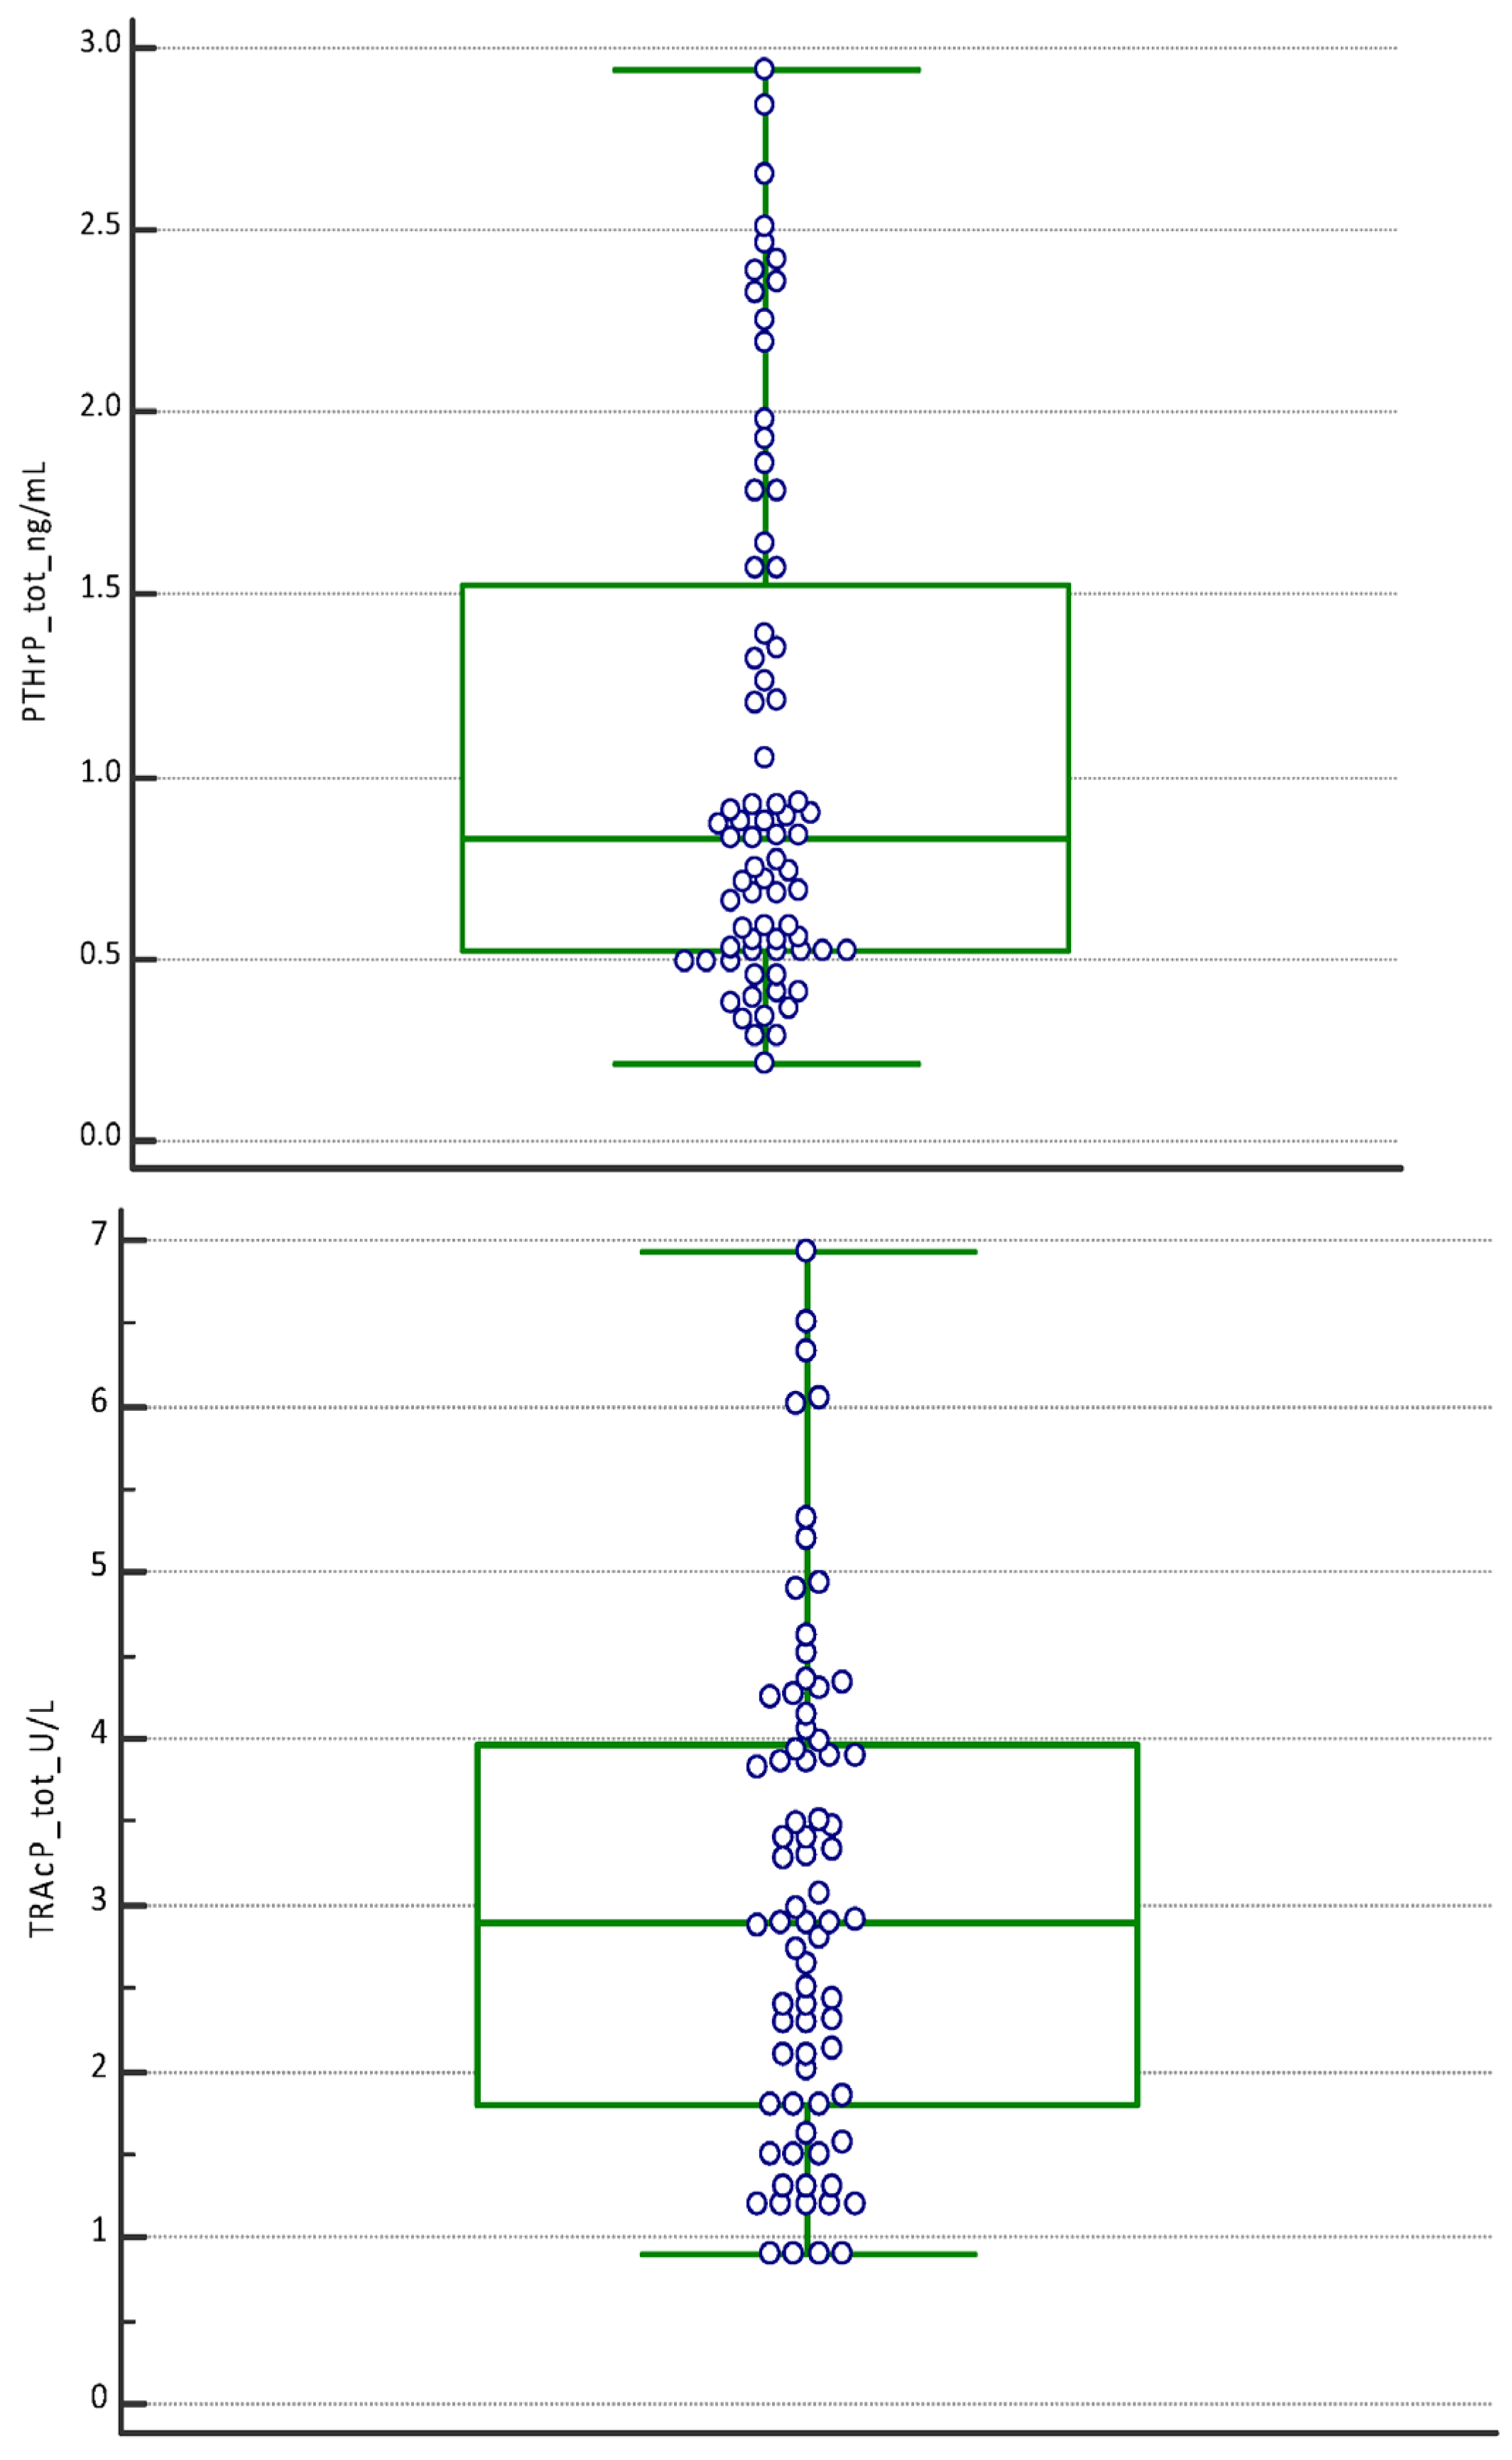
| P1NP (µg/L) | PTHrP (ng/mL) | TRAcP (U/L) | |
|---|---|---|---|
| Number values | 75 | 75 | 75 |
| Mean | 3.49 | 1.07 | 3.03 |
| 95% CI | 3.10–3.87 | 0.90–1.24 | 2.69–3.38 |
| Median | 3.05 | 0.83 | 2.90 |
| 95% CI | 2.75–3.50 | 0.68–0.91 | 2.40–3.40 |
| Minimum | 0.80 | 0.21 | 0.90 |
| Maximum | 8.84 | 2.94 | 6.93 |
| D’Agostino–Pearson test for Normal distribution | reject Normality (p = 0.0019) | reject Normality (p = 0.0028) | reject Normality (p = 0.0092) |
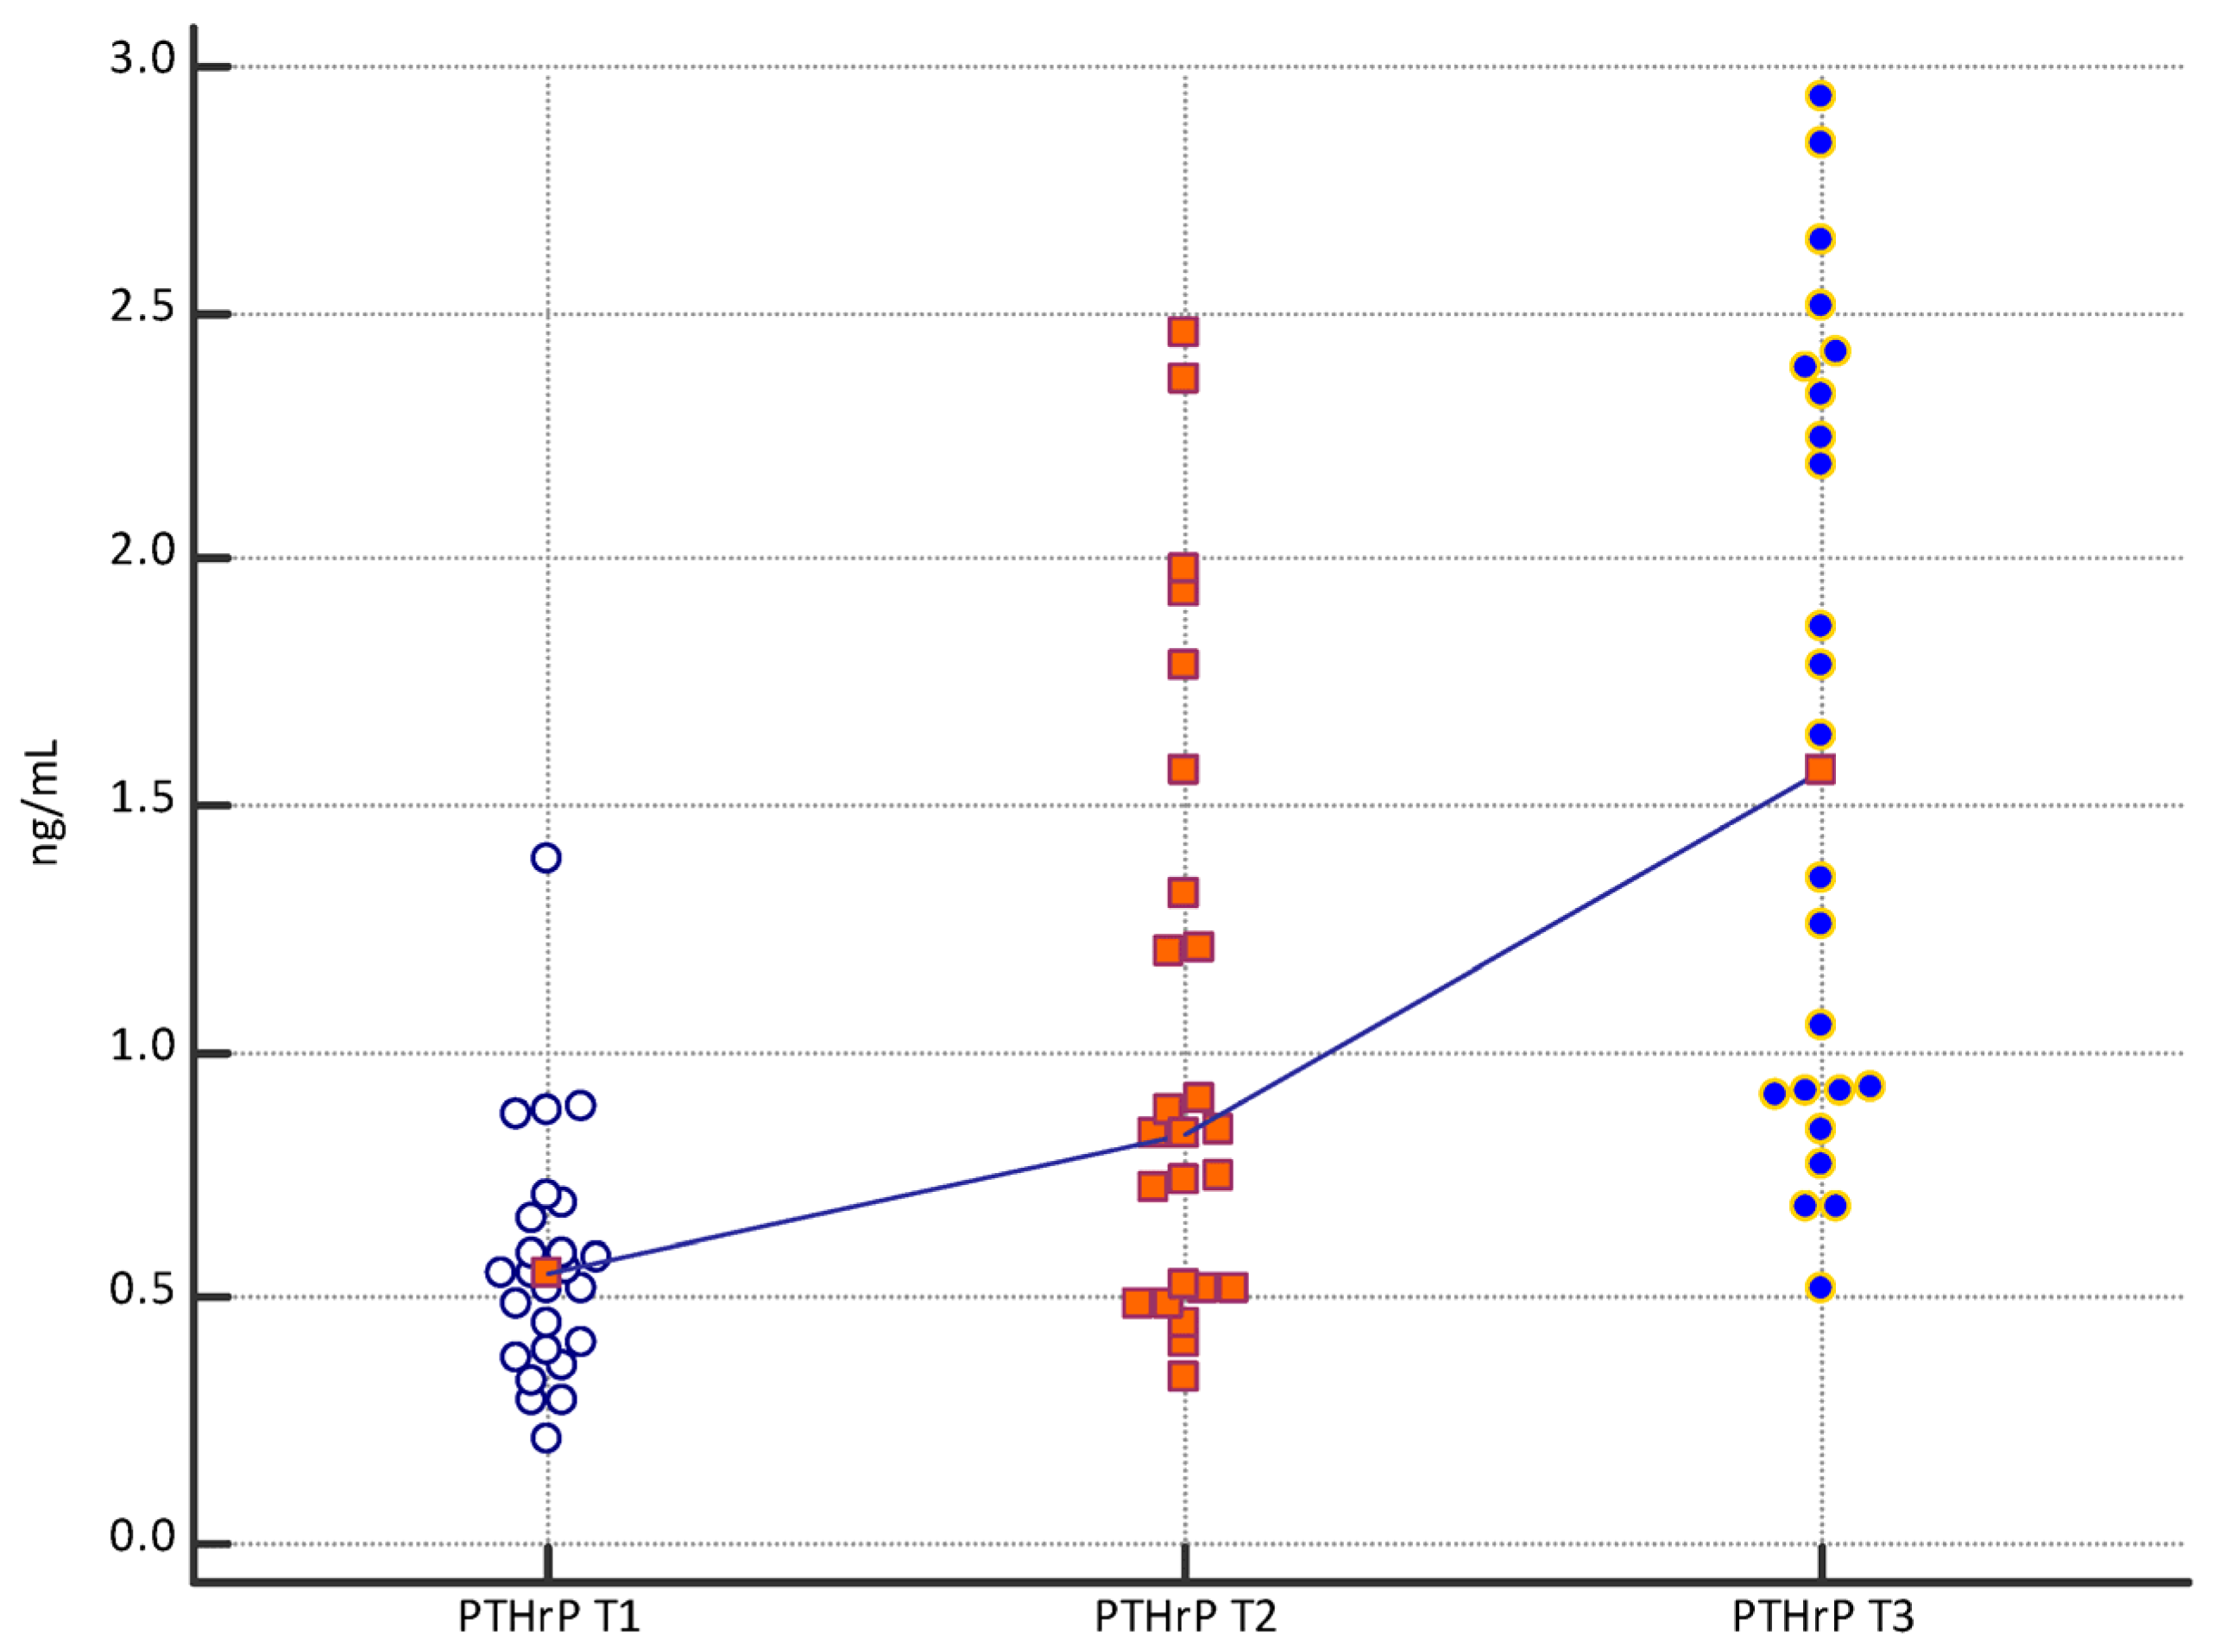
| PINP (µg/L) | PTHrP (ng/mL) | TRAcP (U/L) | |||||||
|---|---|---|---|---|---|---|---|---|---|
| T1 | T2 | T3 | T1 | T2 | T3 | T1 | T2 | T3 | |
| Number | 25 | 25 | 25 | 25 | 25 | 25 | 25 | 25 | 25 |
| Mean | 2.13 | 3.13 | 5.22 | 0.57 | 1.04 | 1.61 | 1.76 | 3.30 | 4.05 |
| 95% CI | 1.86–2.38 | 2.705–3.55 | 4.66–5.78 | 0.46–0.67 | 0.78–1.30 | 1.29–1.93 | 1.41–2.10 | 2.78–3.81 | 3.52–4.58 |
| Median | 2.10 | 2.90 | 5.20 | 0.55 | 0.83 | 1.57 | 1.50 | 3.29 | 3.90 |
| 95% CI | 1.85–2.10 | 2.60–3.24 | 4.81–5.33 | 0.42–0.59 | 0.56–1.21 | 0.92–2.24 | 1.21–2.06 | 2.55–3.84 | 3.41–4.30 |
| Minimum | 0.80 | 1.54 | 2.90 | 0.21 | 0.34 | 0.52 | 0.90 | 1.20 | 2.01 |
| Maximum | 3.78 | 6.81 | 8.84 | 1.39 | 2.46 | 2.94 | 4.52 | 6.51 | 6.93 |
| D’Agostino–Pearson test for Normal distribution | reject Normality (p = 0.1474) | accept Normality (p ≤ 0.0001) | reject Normality (p = 0.0537) | accept Normality (p = 0.0005) | reject Normality (p = 0.1027) | accept Normality (p = 0.016) | accept Normality (p = 0.0004) | reject Normality (p = 0.2756) | reject Normality (p = 0.4642) |
| Variable | Mann–Whitney U Two-Tailed Probability |
|---|---|
| PINP T1 vs. PINP T2 | p < 0.0001 |
| PINP T2 vs. PINP T3 | p < 0.0001 |
| PINP T1 vs. PINP T3 | p < 0.0001 |
| PTHrP T1 vs. PTHrP T2 | p = 0.0039 |
| PTHrP T2 vs. PTHrP T3 | p = 0.0091 |
| PTHrP T1 vs. PTHrP T3 | p < 0.0001 |
| TRAcP T1 vs. TRAcP T2 | p < 0.0001 |
| TRAcP T2 vs. TRAcP T3 | p = 0.0416 |
| TRAcP T1 vs. TRAcP T3 | p < 0.0001 |
| Subjects | P1NP Variation % | PTHrP Variation % | TRAcP Variation % | ||||||
|---|---|---|---|---|---|---|---|---|---|
| T1 vs. T2 | T2 vs. T3 | T1 vs. T3 | T1 vs. T2 | T2 vs. T3 | T1 vs. T3 | T1 vs. T2 | T2 vs. T3 | T1 vs. T3 | |
| a | 13.38 | 73.11 | 96.28 | 125.00 | 17.68 | 164.77 | 123.08 | 20.69 | 169.23 |
| b | 53.19 | 81.60 | 178.19 | 182.76 | 15.45 | 226.44 | 45.30 | 46.19 | 112.42 |
| c | 36.05 | 64.10 | 123.26 | 69.78 | 24.58 | 111.51 | 125.54 | 15.55 | 160.61 |
| d | 10.71 | 67.74 | 85.71 | 81.82 | 101.67 | 266.67 | 184.17 | 24.93 | 255.00 |
| e | 92.50 | 116.88 | 317.50 | 61.90 | 126.47 | 266.67 | 91.33 | 6.62 | 104.00 |
| f | 118.75 | 51.43 | 231.25 | 68.97 | 38.78 | 134.48 | 100.00 | 21.25 | 142.50 |
| g | 38.10 | 79.31 | 147.62 | 29.27 | 73.58 | 124.39 | 45.22 | 15.87 | 68.26 |
| h | 14.29 | 216.67 | 261.90 | 6.12 | 201.92 | 220.41 | 74.44 | 55.41 | 171.11 |
| i | 40.00 | 97.32 | 176.25 | 35.96 | 97.52 | 168.54 | 55.36 | 13.56 | 76.43 |
| l | 53.85 | 50.00 | 130.77 | 61.54 | 50.00 | 142.31 | 203.08 | 5.33 | 219.23 |
| m | 61.71 | 130.39 | 272.57 | 118.42 | 62.65 | 255.26 | 119.33 | 20.97 | 165.33 |
| n | 53.85 | 61.25 | 148.08 | 25.42 | 41.89 | 77.97 | 76.09 | 14.07 | 100.87 |
| o | 14.29 | 20.83 | 38.10 | 201.92 | 4.46 | 215.38 | 100.00 | 11.67 | 123.33 |
| p | 23.81 | 107.69 | 157.14 | 130.56 | 12.05 | 158.33 | 116.67 | 8.97 | 136.11 |
| q | 118.75 | 37.14 | 200.00 | 68.97 | 6.12 | 79.31 | 75.00 | 38.10 | 141.67 |
| r | 36.84 | 100.77 | 174.74 | 36.36 | 86.67 | 154.55 | 132.00 | 11.21 | 158.00 |
| s | 27.17 | 109.83 | 166.85 | 85.92 | 90.15 | 253.52 | 101.89 | 13.32 | 128.79 |
| t | 33.33 | 91.67 | 155.56 | 244.64 | 16.58 | 301.79 | 17.93 | 6.45 | 58.00 |
| u | 13.64 | 64.31 | 86.71 | 51.72 | 201.14 | 356.90 | 38.89 | 56.00 | 116.67 |
| v | 87.50 | 60.00 | 200.00 | 5.13 | 56.10 | 74.10 | 33.33 | 308.33 | 444.44 |
| z | 139.79 | 13.95 | 173.24 | 15.56 | 75.00 | 102.22 | 66.19 | 23.50 | 105.24 |
| y | 3.44 | 40.15 | 44.97 | 4.35 | 27.78 | 33.33 | 105.56 | 15.68 | 137.78 |
| w | 114.29 | 24.89 | 167.62 | 52.54 | 106.67 | 215.25 | 141.67 | 17.24 | 183.33 |
| ab | 57.14 | 49.39 | 134.76 | 223.64 | 23.03 | 298.18 | 152.31 | 16.77 | 194.62 |
| ac | 38.10 | 38.10 | 71.43 | 36.36 | 137.33 | 223.64 | 48.15 | 13.75 | 68.52 |
Disclaimer/Publisher’s Note: The statements, opinions and data contained in all publications are solely those of the individual author(s) and contributor(s) and not of MDPI and/or the editor(s). MDPI and/or the editor(s) disclaim responsibility for any injury to people or property resulting from any ideas, methods, instructions or products referred to in the content. |
© 2024 by the authors. Licensee MDPI, Basel, Switzerland. This article is an open access article distributed under the terms and conditions of the Creative Commons Attribution (CC BY) license (https://creativecommons.org/licenses/by/4.0/).
Share and Cite
Cazzolla, A.P.; Brescia, V.; Lovero, R.; Fontana, A.; Giustino, A.; Dioguardi, M.; Di Comite, M.S.; Di Serio, F.; Ciavarella, D.; Crincoli, V. Evaluation of Biomarkers of Bone Metabolism on Salivary Matrix in the Remodeling of Periodontal Tissue during Orthodontic Treatment. Dent. J. 2024, 12, 209. https://doi.org/10.3390/dj12070209
Cazzolla AP, Brescia V, Lovero R, Fontana A, Giustino A, Dioguardi M, Di Comite MS, Di Serio F, Ciavarella D, Crincoli V. Evaluation of Biomarkers of Bone Metabolism on Salivary Matrix in the Remodeling of Periodontal Tissue during Orthodontic Treatment. Dentistry Journal. 2024; 12(7):209. https://doi.org/10.3390/dj12070209
Chicago/Turabian StyleCazzolla, Angela Pia, Vincenzo Brescia, Roberto Lovero, Antonietta Fontana, Arcangela Giustino, Mario Dioguardi, Maria Severa Di Comite, Francesca Di Serio, Domenico Ciavarella, and Vito Crincoli. 2024. "Evaluation of Biomarkers of Bone Metabolism on Salivary Matrix in the Remodeling of Periodontal Tissue during Orthodontic Treatment" Dentistry Journal 12, no. 7: 209. https://doi.org/10.3390/dj12070209