Preliminary Techno-Economic Assessment of Animal Cell-Based Meat

 , , ,
, , ,
Abstract
:
1. Introduction
2. Materials and Methods
2.1. Capital Expenditures of an ACBM Plant
2.2. Operating Costs of an ACBM Plant
2.2.1. Ingredients and Raw Materials
2.2.2. Utility Related Expenses
2.2.3. Labor Related Expenses
2.2.4. Finance Related Expenses
2.2.5. Sensitivity Analysis
3. Results
4. Discussion
5. Conclusions
Supplementary Materials
Author Contributions
Funding
Acknowledgments
Conflicts of Interest
Appendix A. Model Limitations
Appendix B. Additional Sensitivity Analysis Information
Appendix C. Variables and Equations
- = time of batch (h)
- = Time growth phase ends (h)
- = Time of maturation phase (h)
- = Final concentration of cells in bioreactor (cells L−1)
- = Bioreactor working volume (L)
- = Total number of cells in bioreactor (cells)
- = Volume of single cell (m3 cell−1)
- = Volume (m3)
- = Density of muscle cell (kg m3)
- = mass of ACBM produced per batch (kg batch−1)
- = Number of batches a single bioreactor can produce in year (batches year−1)
- = Mass of ACBM a bioreactor can produce in a year (kg year−1)
- = Desired annual mass of ABCM (kg)
- = Total number of bioreactors required to annual production goal
- = Total equipment costs (USD)
- = Fixed equipment cost (USD)
- = Adjusted value factor for equipment j
- = Unit costs for equipment j
- = Base unit for equipment j
- = Actual unit for equipment j
- = Scale factor for equipment j
- = Lang factor
- = Fixed manufacturing cost factor
- = Fixed manufacturing costs (USD)
- = Annual operating costs (USD)
- = Total annual costs of media (USD)
- = Total annual costs of oxygen (USD)
- = Minimum energy required to heat media (kWh)
- = Minimum energy required bioreactor heat removal (kWh)
- = Minimum annual energy required for ACBM heat removal (kWh)
- = Estimated annual labor costs (USD)
- = Cost of energy (cents kWh−1)
- = Annual process water and wastewater costs (USD)
- = Total number of cells at time (t)
- = Total number of cells present in inoculum (cells)
- Doubling time (h)
- = Time (h)
- = Glucose consumption rate within the bioreactor (mol h−1)
- = Glucose consumption rate per cell (mol h−1 cell−1)
- = Total moles of glucose required for growth phase (mol)
- = Total moles of glucose required for maturation phase (mol)
- = Total moles of glucose required per batch (mol)
- = Total media charges per batch (charge)
- = Moles of glucose per charge (g)
- = Total volume of media required per batch (L)
- = Volume of charge or bioreactor (L)
- = Total media volume per year (L year−1)
- = Batches per year
- = Cost of media per liter (USD L−1)
- = Oxygen uptake rate in bioreactor (mol s−1)
- = Oxygen transfer rate in bioreactor (mol s−1)
- = mass transfer coefficient (m s−1)
- = mean bubble specific interfacial surface area (m2)
- = equilibrium concentration (mol m−3)
- = actual dissolved oxygen concentration (mol m−3)
- = Initial oxygen in required in the system (mol)
- = Density of media (kg L−1)
- = Percentage of oxygen (O2) in media by weight (%)
- = molar mass of O2 (kg mol−1)
- = rate of oxygen consumption per cell mol cell−1 h−1
- = Total oxygen required for growth phase per batch (mol)
- = Total oxygen required for maturation phase per batch (mol)
- = Total oxygen used per ACBM batch (mol)
- = Total amount of oxygen required per year (mol)
- = Total annual costs of oxygen (USD)
- = Cost of oxygen (USD mol−1)
- = Mass of media used per year (kg)
- = Temperature difference (°C)
- = Specific heat of water at constant volume (kWh kg−1 °C−1)
- = Energy efficiency of heating system (%)
- = Oxygen required annually (mol)
- = Heat released per mol of oxygen consumed (kWh mol−1)
- = Energy efficiency of bioreactor cooling system (%)
- = Specific heat of ACBM (kWh kg−1 °C−1)
- = Energy efficiency of ACBM cooling system (%)
- = Cost of electricity from a public supplier (USD kWh−1)
- = Cost of natural gas (USD 1000 ft−3)
- = Cost of energy from onsite boiler–turbine system (USD kWh−1)
- = natural gas price (USD kWh−1)
- = boiler–turbine system efficiency (%)
- = percentage of electricity produced by from a public supplier (%)
- = percentage of energy produced by on site boiler–turbine system (%)
- = Process water costs (USD m−3)
- = Wastewater filtration costs (USD m−3)
- = Biological oxidation of wastewater costs (USD m−3)
- = required manpower (production workers)
- = production worker required for single piece of equipment
- = Individual piece of equipment
- = All downstream equipment used in downstream ACBM production
- = Labor cost correction factor
- = Country effect
- = Supervising and clerical assistance
- = Advanced technological and automating
- = Skilled and qualified level of the personnel
- = Social benefits
- = Overtime work
- = Estimated annual labor costs (USD)
- = Annual operating time (h)
- = Production worker hourly rate (USD h−1)
- = Equity ratio
- = Total debt costs (USD)
- = debt ratio (%)
- = Total equity costs (USD)
- = Capital recovery factor for debt
- = Capital recovery factor for equity
- = Annual debt payment (USD)
- = Annual equity recovery (USD)
- = Minimum annual cost of capital expenditures (USD)
- = Total minimum annual costs (USD)
Appendix D. Additional Tables and Figures


| Scenarios | Inoculum Concentration (Cells/Ml) | Inoculum Bioreactor Volume (L) | Seed Bioreactor Volume (L) | Seed Bioreactor (Cell/Ml) | Bioreactor Volume (M3) | Desired and Achievable Cell Concentration (Cell/Ml) | Desired Mass of Meat Produced (Kg) |
| 1 | 1.00 × 10⁷ | 2.00 | 2.00 × 10² | 1.00 × 10⁷ | 2.00 × 101 | 1.00 × 10⁷ | 1.21 × 10⁸ |
| 2 | 9.50 × 10⁷ | 2.00 | 2.00 × 10² | 9.50 × 10⁷ | 2.00 × 101 | 9.50 × 10⁷ | 1.21 × 10⁸ |
| 3 | 9.50 × 10⁷ | 2.00 | 2.00 × 10² | 9.50 × 10⁷ | 2.00 × 101 | 9.50 × 10⁷ | 1.21 × 10⁸ |
| 4 | 2.00 × 10⁸ | 2.00 | 2.00 × 10² | 2.00 × 10⁸ | 2.00 × 101 | 2.00 × 10⁸ | 1.21 × 10⁸ |
| Scenarios | Adjusted Value Factor for Bioreactor | Lang Factor | Maturation Time (H) | Annual Operating Time (H) | Bioreactor Scale Factor | Fixed Manufacturing Costs Factor | Bioreactor Unit Costs (USD/M3) |
| 1 | 1.29 | 2.00 | 240.00 | 8760.00 | 0.60 | 0.15 | 5.00 × 10⁴ |
| 2 | 1.29 | 2.00 | 156.00 | 8760.00 | 0.60 | 0.15 | 5.00 × 10⁴ |
| 3 | 1.29 | 2.00 | 156.00 | 8760.00 | 0.60 | 0.15 | 5.00 × 10⁴ |
| 4 | 1.29 | 2.00 | 24.00 | 8760.00 | 0.60 | 0.15 | 5.00 × 10⁴ |
| Scenarios | Average Single Cell Volume (M3/Cell) | Average Single Cell Density (Kg/M3) | Hours Per Doubling (H) | Glucose Consumption Rate Per Cell (Mol/H Cell) | Rate of Oxygen Consumption Per Cell (Mol/H Cell) |
|---|---|---|---|---|---|
| 1 | 5.00 × 10⁻¹⁵ | 1.06 × 10³ | 24 | 4.13 × 10⁻¹³ | 1.80 × 10⁻¹⁴ |
| 2 | 5.00 × 10⁻¹⁵ | 1.06 × 10³ | 16 | 2.07 × 10⁻¹³ | 1.80 × 10⁻¹⁴ |
| 3 | 5.00 × 10⁻¹⁵ | 1.06 × 10³ | 16 | 2.07 × 10⁻¹³ | 1.80 × 10⁻¹⁴ |
| 4 | 5.00 × 10⁻¹⁵ | 1.06 × 10³ | 8 | 4.13 × 10⁻¹⁴ | 1.80 × 10⁻¹⁴ |
| Scenarios | Basal Media (USD/L) | Ascorbic Acid 2-Phosphate (G/L) | Ascorbic Acid 2-Phosphate (USD/G) | NAHCO3 (G/L) | NAHCO3 (USD/G) | Sodium Selenite (G/L) | Sodium Selenite (USD/G) | |
| 1 | 3.12 | 6.40 × 10⁻² | 7.84 | 5.43 × 10⁻¹ | 0.01 | 1.40 × 10⁻⁵ | 0.10 | |
| 2 | 3.12 | 6.40 × 10⁻² | 7.84 | 5.43 × 10⁻¹ | 0.01 | 1.40 × 10⁻⁵ | 0.10 | |
| 3 | 3.12 | 6.40 × 10⁻² | 7.84 | 5.43 × 10⁻¹ | 0.01 | 1.40 × 10⁻⁵ | 0.10 | |
| 4 | 0.24 | 6.40 × 10⁻² | 0.00 | 5.43 × 10⁻¹ | 0.00 | 1.40 × 10⁻⁵ | 0.00 | |
| Scenarios | Insulin (g/L) | Insulin (USD/g) | Transferrin (g/L) | Transferrin (USD/g) | FGF-2 (g/L) | FGF-2 (USD/g) | TGF-b§ (g/L) | TGF-b§ (USD/g) |
| 1 | 1.94 × 10² | 340.00 | 1.07 × 10² | 400.00 | 1.00 × 10⁻⁴ | 2.01 × 10⁶ | 2.00 × 10⁻⁶ | 8.09 × 10⁷ |
| 2 | 1.94 × 10² | 340.00 | 1.07 × 10² | 400.00 | 5.00 × 10⁻⁵ | 1.00 × 10⁶ | 2.00 × 10⁻⁶ | 8.09 × 10⁷ |
| 3 | 1.94 × 10² | 340.00 | 1.07 × 10² | 400.00 | 5.00 × 10⁻⁵ | 0.00 | 2.00 × 10⁻⁶ | 8.09 × 10⁷ |
| 4 | 1.94 × 10² | 0.00 | 1.07 × 10² | 0.00 | 0.00 | 0.00 | 2.00 × 10⁻⁶ | USD 0.00 |
| Scenarios | Percentage of Oxygen in Initial Charge (W/W) | Oxygen (USD/Ton) | Glucose (Mol/L) | Density of Media (Kg/L) |
|---|---|---|---|---|
| 1 | 2.00 | 4.00 × 101 | 1.78 × 10⁻² | 1.00 |
| 2 | 2.00 | 4.00 × 101 | 2.67 × 10⁻² | 1.00 |
| 3 | 2.00 | 4.00 × 101 | 2.67 × 10⁻² | 1.00 |
| 4 | 2.00 | 4.00 × 101 | 3.56 × 10⁻² | 1.00 |
| Scenarios | Boiler Energy Efficiency (%) | Percentage of Electricity Self-Generated (%) | Temperature of Water/Media Entering Facility (°C) | Desired Temperature of Media Entering Bioreactor (°C) | Specific Heat of Water (Kwh/Kg (°C)) | Energy Efficiency of Media Heating System (%) | Heat Released Per Mol of Oxygen Consumed (Kwh) | Energy Efficiency of Bioreactor Cooling System (%) | |
| 1 | 85 | 50 | 20 | 37 | 1.16 × 10⁻³ | 100 | 1.30 × 10⁻¹ | 100 | |
| 2 | 85 | 50 | 20 | 37 | 1.16 × 10⁻³ | 100 | 1.30 × 10⁻¹ | 100 | |
| 3 | 85 | 50 | 20 | 37 | 1.16 × 10⁻³ | 100 | 1.30 × 10⁻¹ | 100 | |
| 4 | 85 | 50 | 20 | 37 | 1.16 × 10⁻³ | 100 | 1.30 × 10⁻¹ | 100 | |
| Scenarios | Specific Heat of ACBM (Kwh/Kg °C) | Temperature of ACBM In Bioreactor (°C) | Temperature of Cooled ACBM (°C) | Energy Efficiency of ACBM Cooling System (%) | Natural Gas Cost (U.S. Dollars Per 1000 Ft3) | Natural Gas (U.S. Dollars Per Kwh) | Process Water Cost (USD/M3) | Wastewater Filtration Treatment Costs (USD/M3) | Biological Oxidation of Wastewater Costs (USD/M3) |
| 1 | 6.22 × 10⁻⁴ | 37 | 4 | 100 | 4.17 | 0.0142 | 0.63 | 0.51 | 0.57 |
| 2 | 6.22 × 10⁻⁴ | 37 | 4 | 100 | 4.17 | 0.0142 | 0.63 | 0.51 | 0.57 |
| 3 | 6.22 × 10⁻⁴ | 37 | 4 | 100 | 4.17 | 0.0142 | 0.63 | 0.51 | 0.57 |
| 4 | 6.22 × 10⁻⁴ | 37 | 4 | 100 | 4.17 | 0.0142 | 0.63 | 0.51 | 0.57 |
| Scenarios | Production Worker Hourly Rate (USD/H) | Country Effect | Supervising and Clerical Assistance | Advanced Technology and Automating | Skilled and Qualified Level of The Personnel | Social Benefits | Overtime Work | Bioreactors Labor Factor |
|---|---|---|---|---|---|---|---|---|
| 1 | 13.68 | 1.00 | 1.20 | 0.80 | 1.50 | 1.40 | 1.25 | 1.00 |
| 2 | 13.68 | 1.00 | 1.20 | 0.80 | 1.50 | 1.40 | 1.25 | 1.00 |
| 3 | 13.68 | 1.00 | 1.20 | 0.80 | 1.50 | 1.40 | 1.25 | 1.00 |
| 4 | 13.68 | 1.00 | 1.20 | 0.80 | 1.50 | 1.40 | 1.25 | 1.00 |
| Scenarios | Debt Ratio (%) | Interest Rate on Debt (%/Y) | Economic Life (Y) | Interest Cost of Equity (%/Y) |
|---|---|---|---|---|
| 1 | 90 | 5 | 20.00 | 15 |
| 2 | 90 | 5 | 20.00 | 15 |
| 3 | 90 | 5 | 20.00 | 15 |
| 4 | 90 | 5 | 20.00 | 15 |
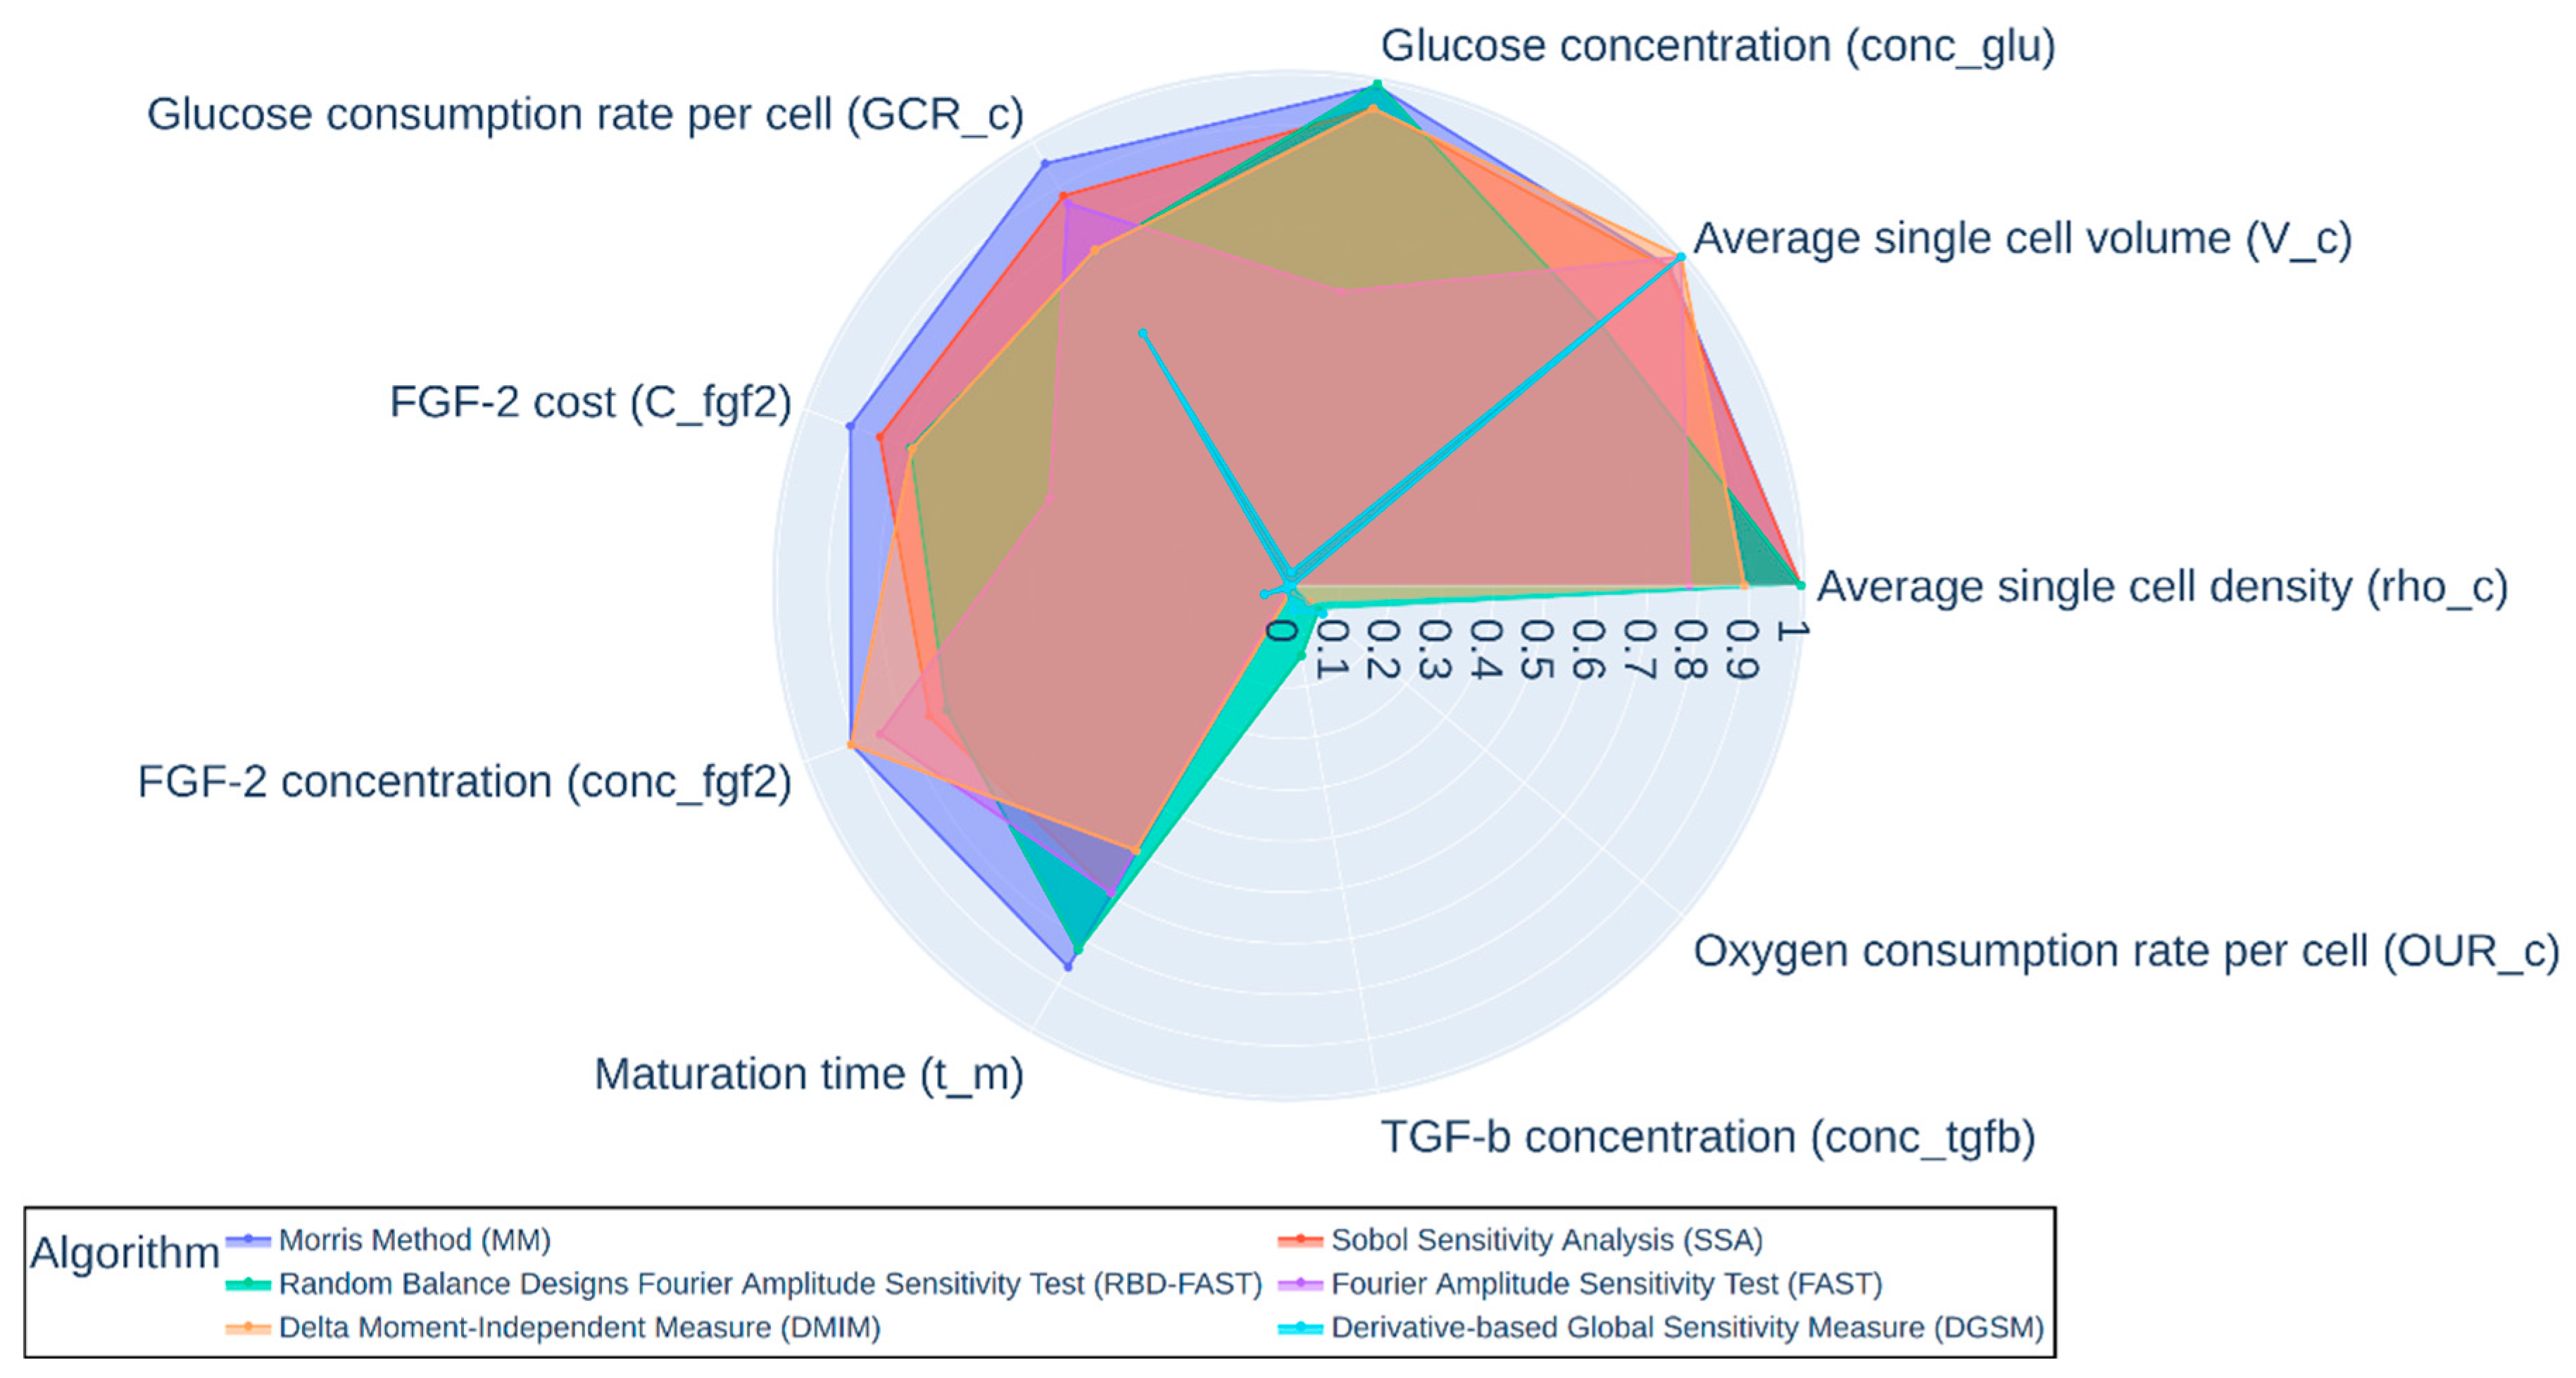
| Algorithm | Average Single Cell Density (rho_c) | Average Single Cell Volume (V_c) | Glucose Conc. (conc_glu) | Glucose Consumption Rate Per Cell (GCR_c) | FGF-2 Cost (C_fgf2) | FGF-2 Conc. (conc_fgf2) | Maturation Time (t_m) | TGF-β Conc. (conc_tgfb) | Oxygen Consumption Rate Per Cell (OUR_c) |
|---|---|---|---|---|---|---|---|---|---|
| DGSM | 6.83 × 10³ | 1.00 × 100 | 2.70 × 10⁻² | 5.70 × 10⁻¹ | 2.40 × 10⁻³ | 5.07 × 10⁻² | 8.03 × 10⁻³ | 4.93 × 10⁻² | 8.68 × 10⁻² |
| SSA | 1.00 × 100 | 9.66 × 10⁻¹ | 9.48 × 10⁻¹ | 8.80 × 10⁻¹ | 8.50 × 10⁻¹ | 7.47 × 10⁻¹ | 6.95 × 10⁻¹ | 2.16 × 10⁻³ | 1.69 × 10⁻³ |
| DMIM | 8.90 × 10⁻¹ | 1.00 × 100 | 9.47 × 10⁻¹ | 7.58 × 10⁻¹ | 7.83 × 10⁻¹ | 9.10 × 10⁻¹ | 5.98 × 10⁻¹ | 1.37 × 10⁻² | 5.13 × 10⁻² |
| FAST | 7.82 × 10⁻¹ | 1.00 × 100 | 5.83 × 10⁻¹ | 8.63 × 10⁻¹ | 4.97 × 10⁻¹ | 8.50 × 10⁻¹ | 6.94 × 10⁻¹ | 1.59 × 10⁻⁴ | 1.93 × 10⁻⁶ |
| MM | 1.00 × 100 | 9.70 × 10⁻¹ | 9.91 × 10⁻¹ | 9.53 × 10⁻¹ | 9.11 × 10⁻¹ | 9.09 × 10⁻¹ | 8.62 × 10⁻¹ | 1.44 × 10⁻² | 1.44 × 10⁻⁸ |
| RBD-FAST | 1.00 × 100 | 7.94 × 10⁻¹ | 9.96 × 10⁻¹ | 7.54 × 10⁻¹ | 7.86 × 10⁻¹ | 7.11 × 10⁻¹ | 8.22 × 10⁻¹ | 1.39 × 10⁻¹ | 7.48 × 10⁻² |
| Equipment | Unit | Unit Costs (USD 1000’s) | Scale Index | Production Operators Required (P) | Adjusted Value Factor (Faj) | Accounted for in Equipment Cost Analysis |
|---|---|---|---|---|---|---|
| Centrifugal pumps | Power (kW) | 5 | 0.60 | 0.1 | 1.42 | - |
| Plate filters | Area (m2) | 3 | 0.75 | 1.0 | 1.64 | - |
| Media holding vessel | Volume (m3) | 10 | 0.50 | 0.2 | 1.29 | - |
| Heat exchanger | Area (m2) | 3 | 0.65 | 0.5 | 1.29 | - |
| Inoculum bioreactor | Volume (m3) | 50 | 0.60 | 1.0 | 1.29 | - |
| Seed bioreactor | Volume (m3) | 50 | 0.60 | 1.0 | 1.29 | - |
| Bioreactors | Volume (m3) | 50 | 0.60 | 1.0 | 1.29 | + |
| Positive displacement pump | Power (kW) | 5 | 0.60 | 0.1 | 1.42 | - |
| Year | Average Nominal Consumer Cost Per Year (Cents Kwh−1) | Inflation Adjusted Cost (Cents Kwh−1) |
|---|---|---|
| 1999 | 4.42 | 6.77 |
| 2000 | 4.63 | 6.9 |
| 2001 | 5.04 | 7.25 |
| 2002 | 4.88 | 6.94 |
| 2003 | 5.11 | 7.08 |
| 2004 | 5.25 | 7.14 |
| 2005 | 5.72 | 7.59 |
| 2006 | 6.15 | 7.81 |
| 2007 | 6.39 | 7.95 |
| 2008 | 6.95 | 8.29 |
| 2009 | 6.83 | 8.14 |
| 2010 | 6.76 | 7.85 |
| 2011 | 6.81 | 7.78 |
| 2012 | 6.66 | 7.4 |
| 2013 | 6.88 | 7.52 |
| 2014 | 7.09 | 7.63 |
| 2015 | 6.90 | 7.43 |
| 2016 | 6.75 | 7.17 |
| 2017 | 6.87 | 7.12 |
| 2018 | 6.92 | 7.03 |
| Year | Average Nominal Cost Per Year (USD Thousand Cubic Feet−1) | Inflation Adjusted Cost (Cents Kwh−1) |
|---|---|---|
| 1999 | 3.08 | 1.55 |
| 2000 | 4.45 | 2.19 |
| 2001 | 5.08 | 2.40 |
| 2002 | 4.02 | 1.88 |
| 2003 | 5.91 | 2.70 |
| 2004 | 6.51 | 2.92 |
| 2005 | 8.67 | 3.77 |
| 2006 | 7.82 | 2.58 |
| 2007 | 7.65 | 3.13 |
| 2008 | 9.66 | 3.79 |
| 2009 | 5.23 | 2.05 |
| 2010 | 5.44 | 2.08 |
| 2011 | 5.12 | 1.93 |
| 2012 | 3.85 | 1.41 |
| 2013 | 4.64 | 1.67 |
| 2014 | 5.58 | 1.98 |
| 2015 | 3.91 | 1.39 |
| 2016 | 3.49 | 1.22 |
| 2017 | 4.08 | 1.39 |
| 2018 | 4.17 | 1.42 |
| Utility | Cost (USD m−3) |
|---|---|
| Process water | 0.63 |
| Wastewater filtration treatment | 0.51 |
| Biological oxidation of wastewater | 0.57 |
References
- Food and Agriculture Organization of the United Nation (FAO). Animal Production and Health: Meat & Meat Products; FAO: Rome, Italy, 2019. [Google Scholar]
- Food and Agriculture Organization of the United Nation (FAO). Global Livestock Environmental Assessment Model (GLEAM) 2.0; FAO: Rome, Italy, 2018. [Google Scholar]
- Olivier, J.G.J.; Peters, J.A.H.W. Trends in Global CO2 and Total Greenhouse Gas Emissions; Netherland Environmental Assessment Agency: The Hague, The Netherlands, 2020. [Google Scholar]
- Stackhouse-Lawson, K.R.; Rotz, C.A.; Oltjen, J.W.; Mitloehner, F.M. Carbon footprint and ammonia emissions of California beef production systems 1. J. Anim. Sci. 2012, 90, 4641–4655. [Google Scholar] [CrossRef] [PubMed] [Green Version]
- Post, M.J. Cultured meat from stem cells: Challenges and prospects. Meat Sci. 2012, 92, 297–301. [Google Scholar] [CrossRef]
- Specht, E.A.; Welch, D.R.; Rees Clayton, E.M.; Lagally, C.D. Opportunities for applying biomedical production and manufacturing methods to the development of the clean meat industry. Biochem. Eng. J. 2018, 132, 161–168. [Google Scholar] [CrossRef]
- Tubb, C.; Seba, T. Rethinking Food and Agriculture 2020-2030: The Second Domestication of Plants and Animals, the Disruption of the Cow, and the Collaspe of Industrial Livestock Farming; RethinkX: San Francisco, CA, USA; London, UK, 2019. [Google Scholar]
- Suhlmann, G.; Ziemben, F.; Donnan, D.; Gerhardt, C.; Warschun, M. When Consumers Go Vegan, How Much Meat Will Be Left on the Table for Agribusiness? Kearney: Chicago, IL, USA, 2019. [Google Scholar]
- Chriki, S.; Hocquette, J.-F. The Myth of Cultured Meat: A Review. Front. Nutr. 2020, 7, 7. [Google Scholar] [CrossRef] [PubMed] [Green Version]
- Alexander, P.; Brown, C.; Arneth, A.; Dias, C.; Finnigan, J.; Moran, D.; Rounsevell, M.D.A. Could consumption of insects, cultured meat or imitation meat reduce global agricultural land use? Glob. Food Sec. 2017, 15, 22–32. [Google Scholar] [CrossRef]
- Stephens, N.; Di Silvio, L.; Dunsford, I.; Ellis, M.; Glencross, A.; Sexton, A. Bringing cultured meat to market: Technical, socio-political, and regulatory challenges in cellular agriculture. Trends Food Sci. Technol. 2018, 78, 155–166. [Google Scholar] [CrossRef]
- Tuomisto, H.L.; Ellis, M.J.; Haastrup, P. Environmental impacts of cultured meat: Alternative production scenarios. In Proceedings of the 9th International Conference on Life Cycle Assessment in the Agri-Food Sector, San Francisco, CA, USA, 8–10 October 2014; Schenck, R., Huizenga, D., Eds.; American Center for Life Cycle Assessment: San Francisco, CA, USA, 2014; pp. 1360–1366. [Google Scholar]
- Carus, M.; Scharf, A.; Breitmayer, E. Review and Gap-Analysis of LCA-Studies of Cultured Meat for the Good Food Institute; Nova Institute: Huerth, Germany, 2019. [Google Scholar]
- Lynch, J.; Pierrehumbert, R. Climate Impacts of Cultured Meat and Beef Cattle. Front. Sustain. Food Syst. 2019, 3, 5. [Google Scholar] [CrossRef] [Green Version]
- United States Department of Agriculture (USDA)- Economic Research Services (ERS) Staistics and Information. Available online: https://www.ers.usda.gov/topics/animal-products/cattle-beef/statistics-information/ (accessed on 14 April 2020).
- Van Eenennaam, A.L. Alternative meats and alternative statistics: What do the data say? In Proceedings of the Range Beef Cow Symposium XXVI, Mitchell, NE, USA, 18–20 November 2019; pp. 37–49. [Google Scholar]
- Paramasivam, P. Lab-Grown Meat Producer Memphis Meats Raises $161 Million in Funding Led by SoftBank. Available online: https://www.reuters.com/article/us-memphis-meats-funding/lab-grown-meat-producer-memphis-meats-raises-161-million-in-funding-led-by-softbank-idUSKBN1ZL2OO (accessed on 28 January 2020).
- Specht, L. An Analysis of Culture Medium Costs and Production Volumes for Cell-Based Meat; The Good Food Institute: Washington, DC, USA, 2019. [Google Scholar]
- Chal, J.; Pourquié1, O. Making muscle: Skeletal myogenesis in vivo and in vitro. Development 2017, 144, 2104–2122. [Google Scholar] [CrossRef] [Green Version]
- Thorrez, L.; Vandenburgh, H. Challenges in the quest for ‘clean meat. Nat. Biotechnol. 2019, 37, 215–216. [Google Scholar] [CrossRef]
- Listrat, A.; Lebret, B.; Louveau, I.; Astruc, T.; Bonnet, M.; Lefaucheur, L.; Picard, B.; Bugeon, J. How muscle structure and composition influence meat and flesh quality. Sci. World J. 2016, 2016, 1–14. [Google Scholar] [CrossRef] [Green Version]
- Kupferschmidt, K. Lab burger adds sizzle to bid for research funds. Science 2013, 341, 602–603. [Google Scholar] [CrossRef] [PubMed]
- Allan, S.J.; De Bank, P.A.; Ellis, M.J. Bioprocess design considerations for cultured meat production with a focus on the expansion bioreactor. Front. Sustain. Food Syst. 2019, 3, 44. [Google Scholar] [CrossRef] [Green Version]
- Suthers, P.F.; Maranas, C.D. Challenges of cultivated meat production and applications of genome-scale metabolic modeling. AIChE J. 2020, 66. [Google Scholar] [CrossRef]
- Zhu, M.M.; Mollet, M.; Hubert, R.S.; Kyung, Y.S.; Zhang, G.G. Industrial production of therapeutic proteins: Cell lines, cell culture, and purification. In Handbook of Industrial Chemistry and Biotechnology; Springer International Publishing: Cham, Germany, 2017; pp. 1639–1669. [Google Scholar]
- Verbruggen, S.; Luining, D.; van Essen, A.; Post, M.J. Bovine myoblast cell production in a microcarriers-based system. Cytotechnology 2018, 70, 503–512. [Google Scholar] [CrossRef] [PubMed] [Green Version]
- Cha, J.M.; Lee, M.-Y.; Hong, J. Bioreactor systems are essentially required for stem cell bioprocessing. Precis. Futur. Med. 2019, 3, 19–23. [Google Scholar] [CrossRef] [Green Version]
- Pigeau, G.M.; Csaszar, E.; Dulgar-Tulloch, A. Commercial scale manufacturing of allogeneic cell therapy. Front. Med. 2018, 5, 233. [Google Scholar] [CrossRef]
- Urbanchek, M.G.; Picken, E.B.; Kalliainen, L.K.; Kuzon, W.M. Specific force deficit in skeletal muscles of old rats is partially explained by the existence of denervated muscle fibers. J. Gerontol. Ser. A Biol. Sci. Med. Sci. 2001, 56, B191–B197. [Google Scholar] [CrossRef] [Green Version]
- Maroulis, Z.B.; Saravacos, G. Capital costs of food plants. In Food Plant Economics; CRC Press: Boca Raton, FL, USA, 2007; pp. 83–133. [Google Scholar]
- Chemical engineering Economic indicators. Chem. Eng. 2005, 9, 100.
- Chemical engineering Economic Indicators. Chem. Eng. 2019, 126, 72–73.
- Maroulis, Z.B.; Saravacos, G.D. Process engineering economics. In Food Plant Economics; CRC Press: Boca Raton, FL, USA, 2007; pp. 65–100. [Google Scholar]
- Teslaa, T.; Teitell, M.A. Pluripotent stem cell energy metabolism: An update. EMBO J. 2015, 34, 138–153. [Google Scholar] [CrossRef]
- Gu, W.; Gaeta, X.; Sahakyan, A.; Plath, K.; Lowry, W.E.; Christofk, H.R. Glycolytic metabolism plays a functional role in regulating human pluripotent stem cell state. Cell Stem Cell 2016, 19, 476–490. [Google Scholar] [CrossRef] [PubMed] [Green Version]
- Grayson, W.L.; Zhao, F.; Izadpanah, R.; Bunnell, B.; Ma, T. Effects of hypoxia on human mesenchymal stem cell expansion and plasticity in 3D constructs. J. Cell. Physiol. 2006, 207, 331–339. [Google Scholar] [CrossRef] [PubMed]
- Humbird, D.; Davis, R.; McMillan, J.D. Aeration costs in stirred-tank and bubble column bioreactors. Biochem. Eng. J. 2017, 127, 161–166. [Google Scholar] [CrossRef]
- Cano-Muñoz, G. Manual on Meat Cold Store Operation and Management; Food and Agriculture Organization of the United Nations: Rome, Italy, 1991; ISBN 9251027889. [Google Scholar]
- Heller, M.C.; Keoleian, G.A. Beyond Meat’s Beyond Burger Life Cycle Assessment: A Detailed Comparison between a Plant-Based and an Animal-Based Protein Source; University of Michigan Center for Sustainable Systems: Ann Arbor, MI, USA, 2018. [Google Scholar]
- U.S. Energy Information Administration (EIA). Monthly Energy Review; EIA: Washington, DC, USA, 2019.
- U.S. Energy Information Administration (EIA). What Are Ccf, Mcf, Btu, and Therms? How Do I Convert Natural Gas Prices in Dollars Per Ccf or Mcf to Dollars per Btu or Therm? Available online: https://www.eia.gov/tools/faqs/faq.php?id=45&t=8 (accessed on 14 November 2019).
- US Labor Statistics CPI Inflation Calculator. Available online: https://data.bls.gov/cgi-bin/cpicalc.pl (accessed on 11 October 2019).
- U.S. Energy Information Administration (EIA). What Is U.S. Electricity Generation by Energy Source? Available online: https://www.eia.gov/tools/faqs/faq.php?id=427&t=3 (accessed on 5 December 2019).
- Maroulis, Z.B.; Saravacos, G.D. Operating cost of food plants. In Food Plant Economics; CRC Press: Boca Raton, FL, USA, 2007; pp. 135–174. [Google Scholar]
- United States Department of Energy. Combined Heat and Power Technolgy Fact Series: Steam Turbines; DOE/EE-1334; United States Department of Energy: Washington, DC, USA, 2016.
- United States of America. Federal Pollution Control Act; United States Environmental Protection Agency: Washington, DC, USA, 2002.
- Bureau of Labor Statistics Occupational Employment and Wages Slaughters and Meat Packers. Available online: https://www.bls.gov/oes/current/oes513023.htm (accessed on 14 October 2019).
- California Biomass Collabortive Generic Biomass Power Plant Model. Available online: https://biomass.ucdavis.edu/tools/energy-cost-calculator/ (accessed on 14 May 2020).
- Herman, J.; Usher, W. SALib: An open-source Python library for sensitivity analysis. J. Open Source Softw. 2017, 2, 97. [Google Scholar] [CrossRef]
- Parulekar, S.; Birol, G.; Cinar, A.; Undey, C. Introduction. In Batch Fermentation Modeling: Monitoring and Control; CRC Press: Boca Raton, FL, USA, 2003; Volume 93, pp. 1–19. ISBN 978-0-8247-4034-4. [Google Scholar]
- Zhu, J.; Thompson, C.B. Metabolic regulation of cell growth and proliferation. Nat. Rev. Mol. Cell Biol. 2019, 20, 436–450. [Google Scholar] [CrossRef]
- Zhang, J.; Nuebel, E.; Daley, G.Q.; Koehler, C.M.; Teitell, M.A. Metabolic regulation in pluripotent stem cells during reprogramming and self-renewal. Cell Stem Cell 2012, 11, 589–595. [Google Scholar] [CrossRef] [PubMed] [Green Version]
- Nies, V.J.M.; Sancar, G.; Liu, W.; Van Zutphen, T.; Struik, D.; Yu, R.T.; Atkins, A.R.; Evans, R.M.; Jonker, J.W.; Downes, M.R. Fibroblast growth factor signaling in metabolic regulation. Front. Endocrinol. 2016, 6, 193. [Google Scholar] [CrossRef] [Green Version]
- Willkomm, L.; Schubert, S.; Jung, R.; Elsen, M.; Borde, J.; Gehlert, S.; Suhr, F.; Bloch, W. Lactate regulates myogenesis in C2C12 myoblasts in vitro. Stem Cell Res. 2014, 12, 742–753. [Google Scholar] [CrossRef] [Green Version]
- Tsukamoto, S.; Shibasaki, A.; Naka, A.; Saito, H.; Iida, K. Lactate promotes myoblast differentiation and myotube hypertrophy via a pathway involving MyoD in vitro and enhances muscle regeneration in vivo. Int. J. Mol. Sci. 2018, 19, 3649. [Google Scholar] [CrossRef] [Green Version]
- Clincke, M.-F.; Mölleryd, C.; Zhang, Y.; Lindskog, E.; Walsh, K.; Chotteau, V. Very high density of CHO cells in perfusion by ATF or TFF in WAVE bioreactor™. Part I. Effect of the cell density on the process. Biotechnol. Prog. 2013, 29, 754–767. [Google Scholar] [CrossRef] [Green Version]
- Lovefood.com. These Are the World’s Most Expensive Foods. Available online: https://www.lovefood.com/gallerylist/52001/the-worlds-most-expensive-ingredients-foods-2020 (accessed on 30 June 2020).
- Lu, V.; Dahan, P.; Ahsan, F.M.; Patananan, A.N.; Roy, I.J.; Torres, A.; Nguyen, R.M.T.; Huang, D.; Braas, D.; Teitell, M.A. Mitochondrial metabolism and glutamine are essential for mesoderm differentiation of human pluripotent stem cells. Cell Res. 2019, 29, 596–598. [Google Scholar] [CrossRef] [PubMed]
- Zhang, J.; Khvorostov, I.; Hong, J.S.; Oktay, Y.; Vergnes, L.; Nuebel, E.; Wahjudi, P.N.; Setoguchi, K.; Wang, G.; Do, A.; et al. UCP2 regulates energy metabolism and differentiation potential of human pluripotent stem cells. EMBO J. 2011, 30, 4860–4873. [Google Scholar] [CrossRef] [PubMed] [Green Version]
- Sin, J.; Andres, A.M.; Taylo, D.J.R.; Weston, T.; Hiraumi, Y.; Stotland, A.; Kim, B.J.; Huang, C.; Doran, K.S.; Gottlieb, R.A. Mitophagy is required for mitochondrial biogenesis and myogenic differentiation of C2C12 myoblasts. Autophagy 2016, 12, 369–380. [Google Scholar] [CrossRef] [Green Version]
- Leary, S.C.; Battersby, B.J.; Hansford, R.G.; Moyes, C.D. Interactions between bioenergetics and mitochondrial biogenesis. Biochim. Biophys. Acta Bioenerg. 1998, 1365, 522–530. [Google Scholar] [CrossRef] [Green Version]
- Schiaffino, S.; Rossi, A.C.; Smerdu, V.; Leinwand, L.A.; Reggiani, C. Developmental myosins: Expression patterns and functional significance. Skelet. Muscle 2015, 5, 22. [Google Scholar] [CrossRef] [Green Version]
- Shyh-Chang, N.; Ng, H.H. The metabolic programming of stem cells. Genes Dev. 2017, 31, 336–346. [Google Scholar] [CrossRef] [Green Version]
- Najafzadeh, V.; Henderson, H.; Martinus, R.; Oback, B. Bovine blastocyst development depends on threonine catabolism. bioRxiv 2018, 397562. [Google Scholar] [CrossRef]
- Wang, J.; Alexander, P.; Wu, L.; Hammer, R.; Cleaver, O.; McKnight, S.L. Dependence of mouse embryonic stem cells on threonine catabolism. Science 2009, 325, 435–439. [Google Scholar] [CrossRef] [Green Version]
- Shiraki, N.; Shiraki, Y.; Tsuyama, T.; Obata, F.; Miura, M.; Nagae, G.; Aburatani, H.; Kume, K.; Endo, F.; Kume, S. Methionine metabolism regulates maintenance and differentiation of human pluripotent stem cells. Cell Metab. 2014, 19, 780–794. [Google Scholar] [CrossRef] [Green Version]
- Meister, A. Enzymology of glutamine. In Glutamine Metabolism in Mammalian Tissue; Springer-Verlag: Berlin, Germany, 1984; Volume 1, pp. 3–15. [Google Scholar]
- Krajcova, A.; Ziak, J.; Jiroutkova, K.; Patkova, J.; Elkalaf, M.; Dzupa, V.; Trnka, J.; Duska, F. Normalizing glutamine concentration causes mitochondrial uncoupling in an in vitro model of human skeletal muscle. J. Parenter. Enteral Nutr. 2015, 39, 180–189. [Google Scholar] [CrossRef]
- Hosios, A.M.; Hecht, V.C.; Danai, L.V.; Johnson, M.O.; Rathmell, J.C.; Steinhauser, M.L.; Manalis, S.R.; Vander Heiden, M.G. Amino acids rather than glucose account for the majority of cell mass in proliferating mammalian cells. Dev. Cell 2016, 36, 540–549. [Google Scholar] [CrossRef] [Green Version]
- Milo, R.; Phillips, R. Cell Biology by the Numbers; Garland Science: New York City, NY, USA, 2015. [Google Scholar]
- Simsa, R.; Yuen, J.; Stout, A.; Rubio, N.; Fogelstrand, P.; Kaplan, D.L. Extracellular heme proteins influence bovine myosatellite cell proliferation and the color of cell-based eat. Foods 2019, 8, 521. [Google Scholar] [CrossRef] [PubMed] [Green Version]
- Borgonovo, E. A new uncertainty importance measure. Reliab. Eng. Syst. Saf. 2007, 92, 771–784. [Google Scholar] [CrossRef]
- Plischke, E.; Borgonovo, E.; Smith, C.L. Global sensitivity measures from given data. Eur. J. Oper. Res. 2013, 226, 536–550. [Google Scholar] [CrossRef]
- Tarantola, S.; Gatelli, D.; Mara, T.A. Random balance designs for the estimation of first order global sensitivity indices. Reliab. Eng. Syst. Saf. 2006, 91, 717–727. [Google Scholar] [CrossRef] [Green Version]
- Plischke, E. An effective algorithm for computing global sensitivity indices (EASI). Reliab. Eng. Syst. Saf. 2010, 95, 354–360. [Google Scholar] [CrossRef]
- Tissot, J.Y.; Prieur, C. Bias correction for the estimation of sensitivity indices based on random balance designs. Reliab. Eng. Syst. Saf. 2012, 107, 205–213. [Google Scholar] [CrossRef] [Green Version]
- McKay, M.D.; Beckman, R.J.; Conover, W.J. A comparison of three methods for selecting values of input variables in the analysis of output from a computer code. Technometrics 1979, 21, 239. [Google Scholar] [CrossRef]
- Sobol, I.M. Global sensitivity indices for nonlinear mathematical models and their Monte Carlo estimates. Math. Comput. Simul. 2001, 55, 271–280. [Google Scholar] [CrossRef]
- Saltelli, A.; Annoni, P.; Azzini, I.; Campolongo, F.; Ratto, M.; Tarantola, S. Variance based sensitivity analysis of model output. Design and estimator for the total sensitivity index. Comput. Phys. Commun. 2010, 181, 259–270. [Google Scholar] [CrossRef]
- Saltelli, A. Making best use of model evaluations to compute sensitivity indices. Comput. Phys. Commun. 2002, 145, 280–297. [Google Scholar] [CrossRef]
- Morris, M.D. Factorial sampling plans for preliminary computational experiments. Technometrics 1991, 33, 161. [Google Scholar] [CrossRef]
- Cukier, R.I.; Fortuin, C.M.; Shuler, K.E.; Petschek, A.G.; Schaibly, J.H. Study of the sensitivity of coupled reaction systems to uncertainties in rate coefficients. I Theory. J. Chem. Phys. 1973, 59, 3873–3878. [Google Scholar] [CrossRef]
- Sobol’, I.M.; Kucherenko, S. Derivative based global sensitivity measures and their link with global sensitivity indices. Math. Comput. Simul. 2009, 79, 3009–3017. [Google Scholar] [CrossRef]


| Scenario | Achievable Cell Concentration (Cells/Ml) | FGF-2 1 Conc. (G/L) | FGF-2 Cost (USD/G) | Glucose Conc. in Basal Media (Mol/L) | Glucose Consumption Rate Per Cell (Mol/H Cell) | Hours Per Doubling (H) | Maturation Time (H) |
|---|---|---|---|---|---|---|---|
| 1 | 1.00 × 10⁷ | 1.00 × 10⁻⁴ | 2.05 × 10⁶ | 1.78 × 10⁻² | 4.13 × 10⁻¹³ | 24.0 | 240 |
| 2 | 9.5 × 10⁷ | 5.00 × 10⁻⁵ | 1.00 × 10⁶ | 2.67 × 10⁻² | 2.07 × 10⁻¹³ | 16 | 156 |
| 3 | 9.5 × 10⁷ | 5.00 × 10⁻⁵ | 0 | 2.67 × 10⁻² | 2.07 × 10⁻¹³ | 16 | 156 |
| 4 | 2.00 × 10⁸ | 0 | 0 | 3.56 × 10⁻² | 4.13 × 10⁻¹⁴ | 8 | 24 |
| Scenario | Total Required Bioreactors | Volume of Media Needed for Annual Production (L) | Minimum Price of ACBM 1 To Meet Annual Capital and Operating Expenses (USD/Kg) |
|---|---|---|---|
| 1 | 5205 | 1.40 × 10¹¹ | 4.37 × 10⁵ |
| 2 | 360 | 3.06 × 10¹⁰ | 5.72 × 10⁴ |
| 3 | 360 | 3.06 × 10¹⁰ | 4.46 × 10⁴ |
| 4 | 50 | 8.56 × 10⁸ | 1.95 |
Publisher’s Note: MDPI stays neutral with regard to jurisdictional claims in published maps and institutional affiliations. |
© 2020 by the authors. Licensee MDPI, Basel, Switzerland. This article is an open access article distributed under the terms and conditions of the Creative Commons Attribution (CC BY) license (http://creativecommons.org/licenses/by/4.0/).
Share and Cite
Risner, D.; Li, F.; Fell, J.S.; Pace, S.A.; Siegel, J.B.; Tagkopoulos, I.; Spang, E.S. Preliminary Techno-Economic Assessment of Animal Cell-Based Meat. Foods 2021, 10, 3. https://doi.org/10.3390/foods10010003
Risner D, Li F, Fell JS, Pace SA, Siegel JB, Tagkopoulos I, Spang ES. Preliminary Techno-Economic Assessment of Animal Cell-Based Meat. Foods. 2021; 10(1):3. https://doi.org/10.3390/foods10010003
Chicago/Turabian StyleRisner, Derrick, Fangzhou Li, Jason S. Fell, Sara A. Pace, Justin B. Siegel, Ilias Tagkopoulos, and Edward S. Spang. 2021. "Preliminary Techno-Economic Assessment of Animal Cell-Based Meat" Foods 10, no. 1: 3. https://doi.org/10.3390/foods10010003