
Nutritional Quality of the Most Consumed Varieties of Raw and Cooked Rice in Spain Submitted to an In Vitro Digestion Model

 ,
,  , and
, and
Abstract
:
1. Introduction
2. Materials and Methods
2.1. Reagents and Materials
2.2. Samples, Pretreatments and Treatment
2.3. Bioaccessibility
2.4. Physic-Chemical Characterization
2.5. Metal Determination
2.5.1. Sample Treatment
2.5.2. Analytical Method
2.6. Calculations
2.6.1. Estimated Daily Intake of Metallic and Metalloid Elements
2.6.2. Non-Carcinogenic Risk Assessment
2.6.3. Carcinogenic Risk Assessment (CRA)
2.7. Statistical Analyses
3. Result and Discussion
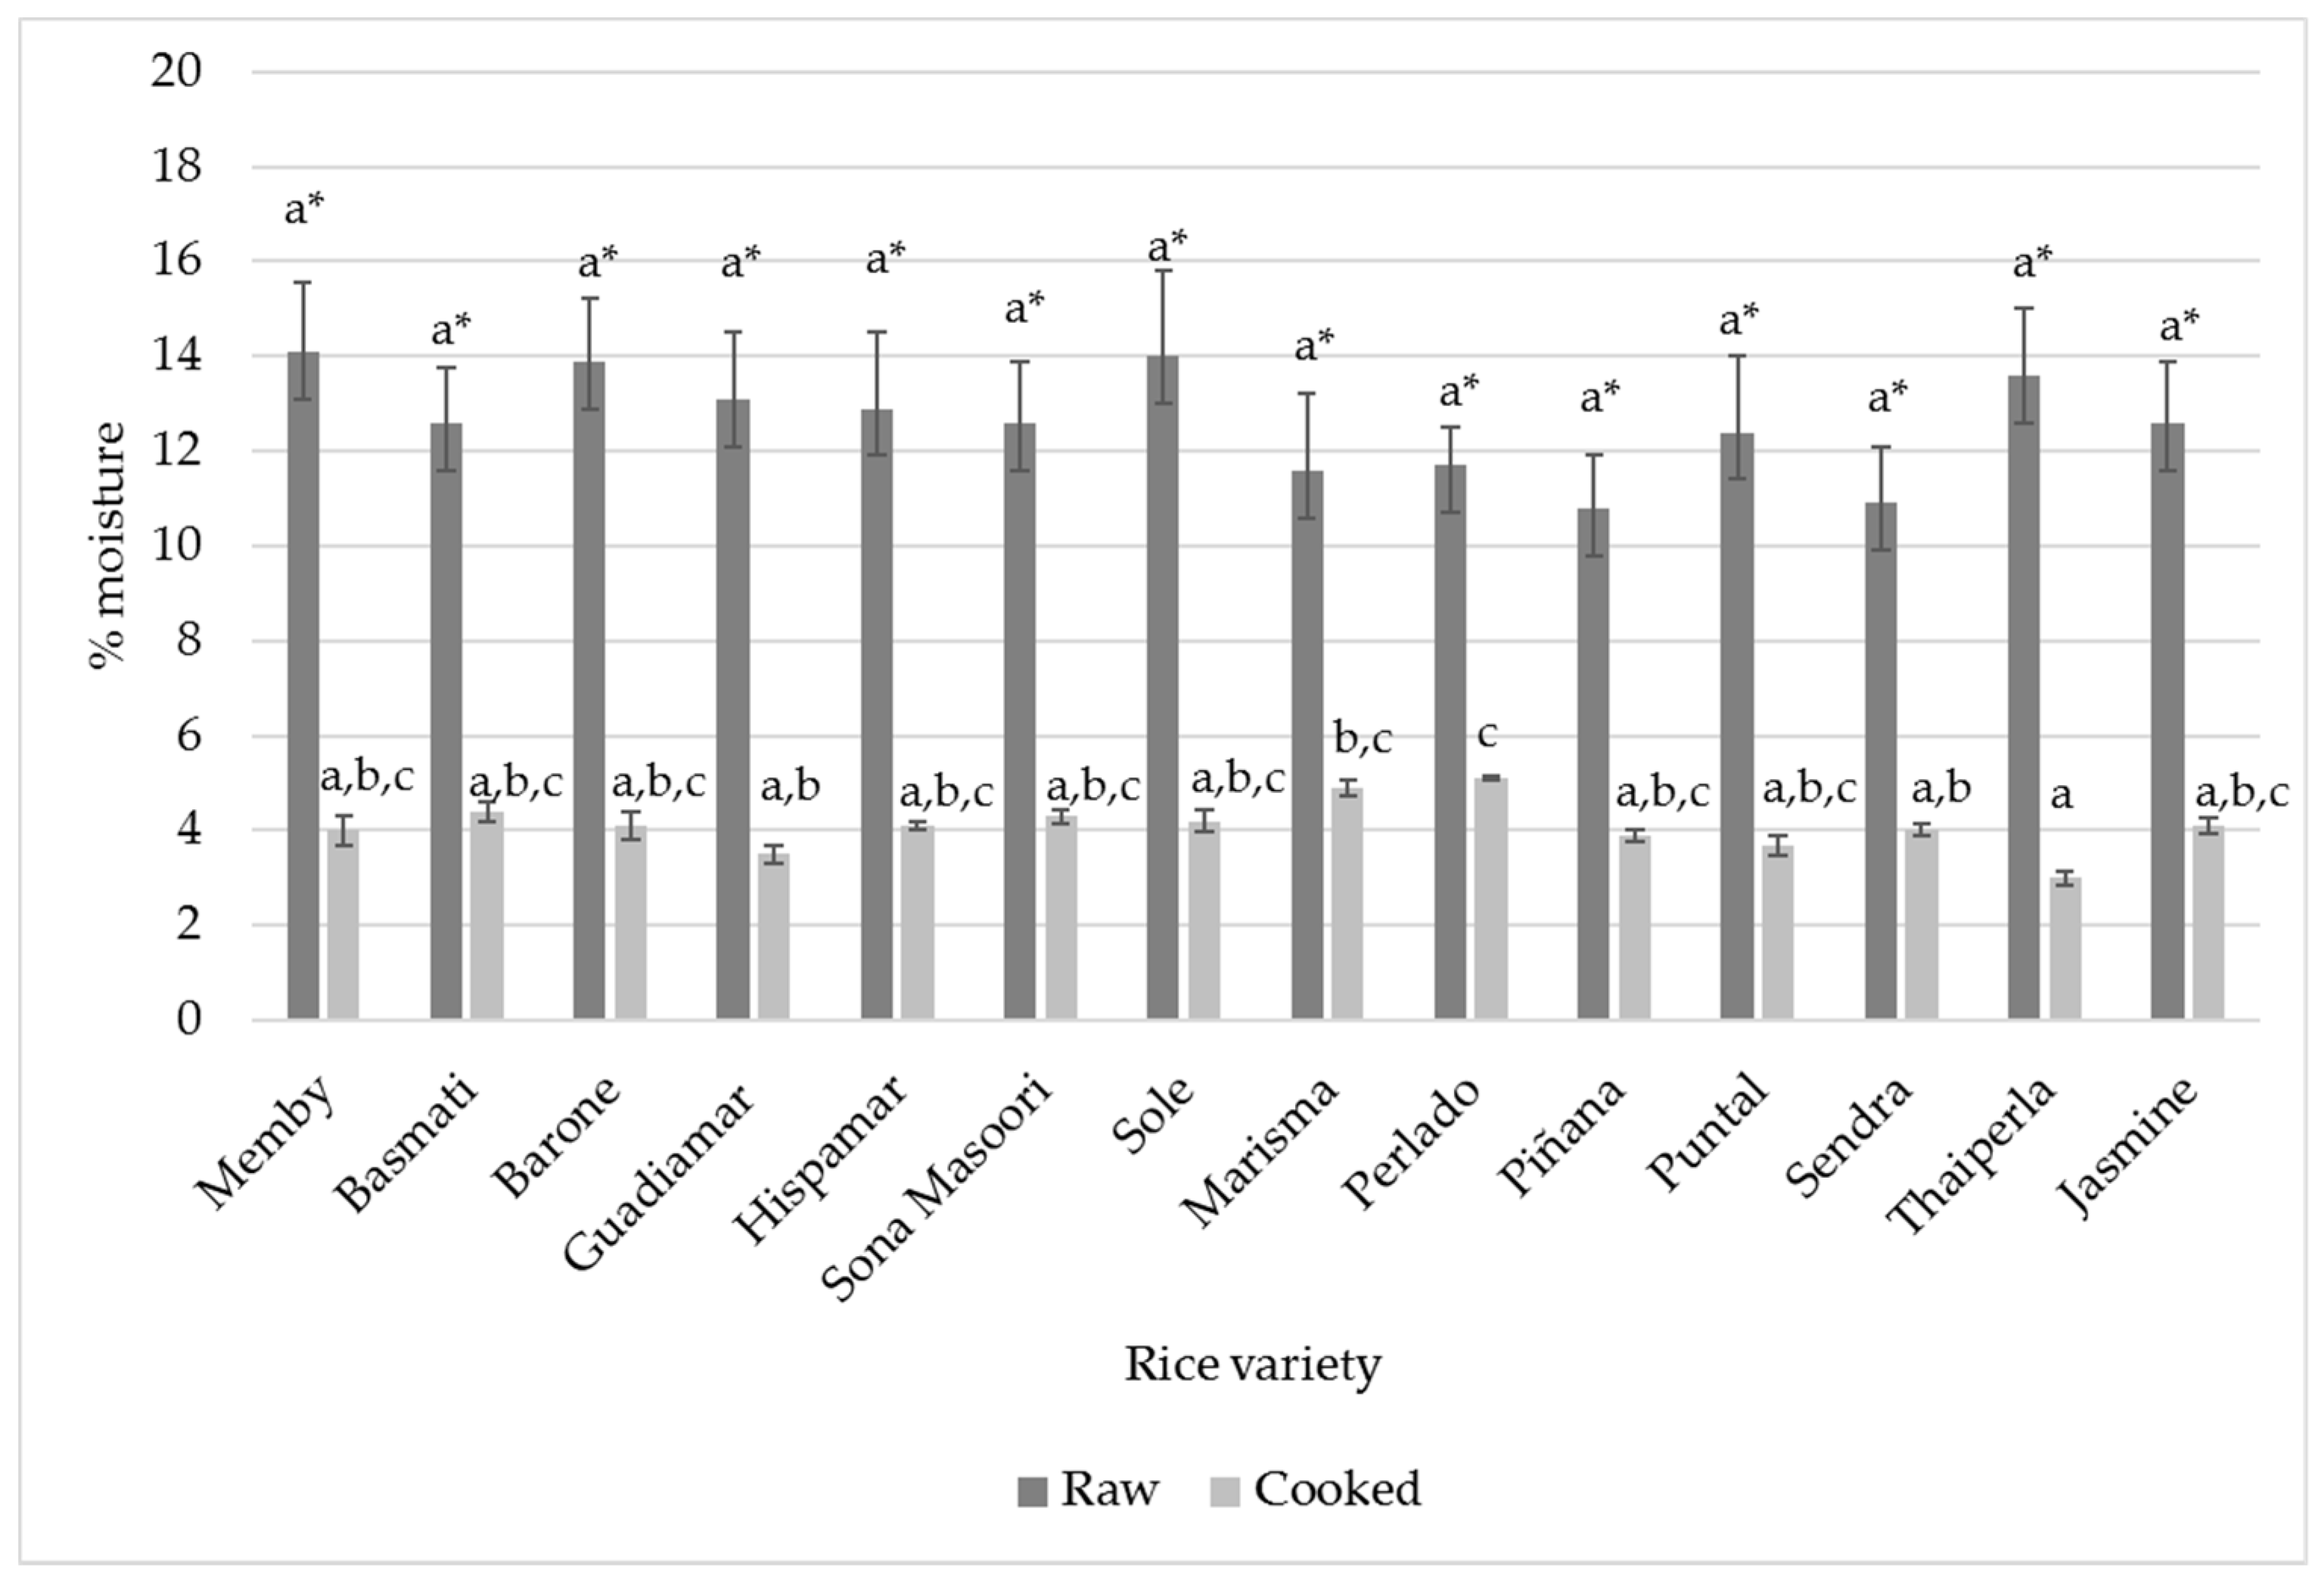
3.1. Chemical Characterization of Raw Rice
3.2. Chemical Characterization of Cooked Rice
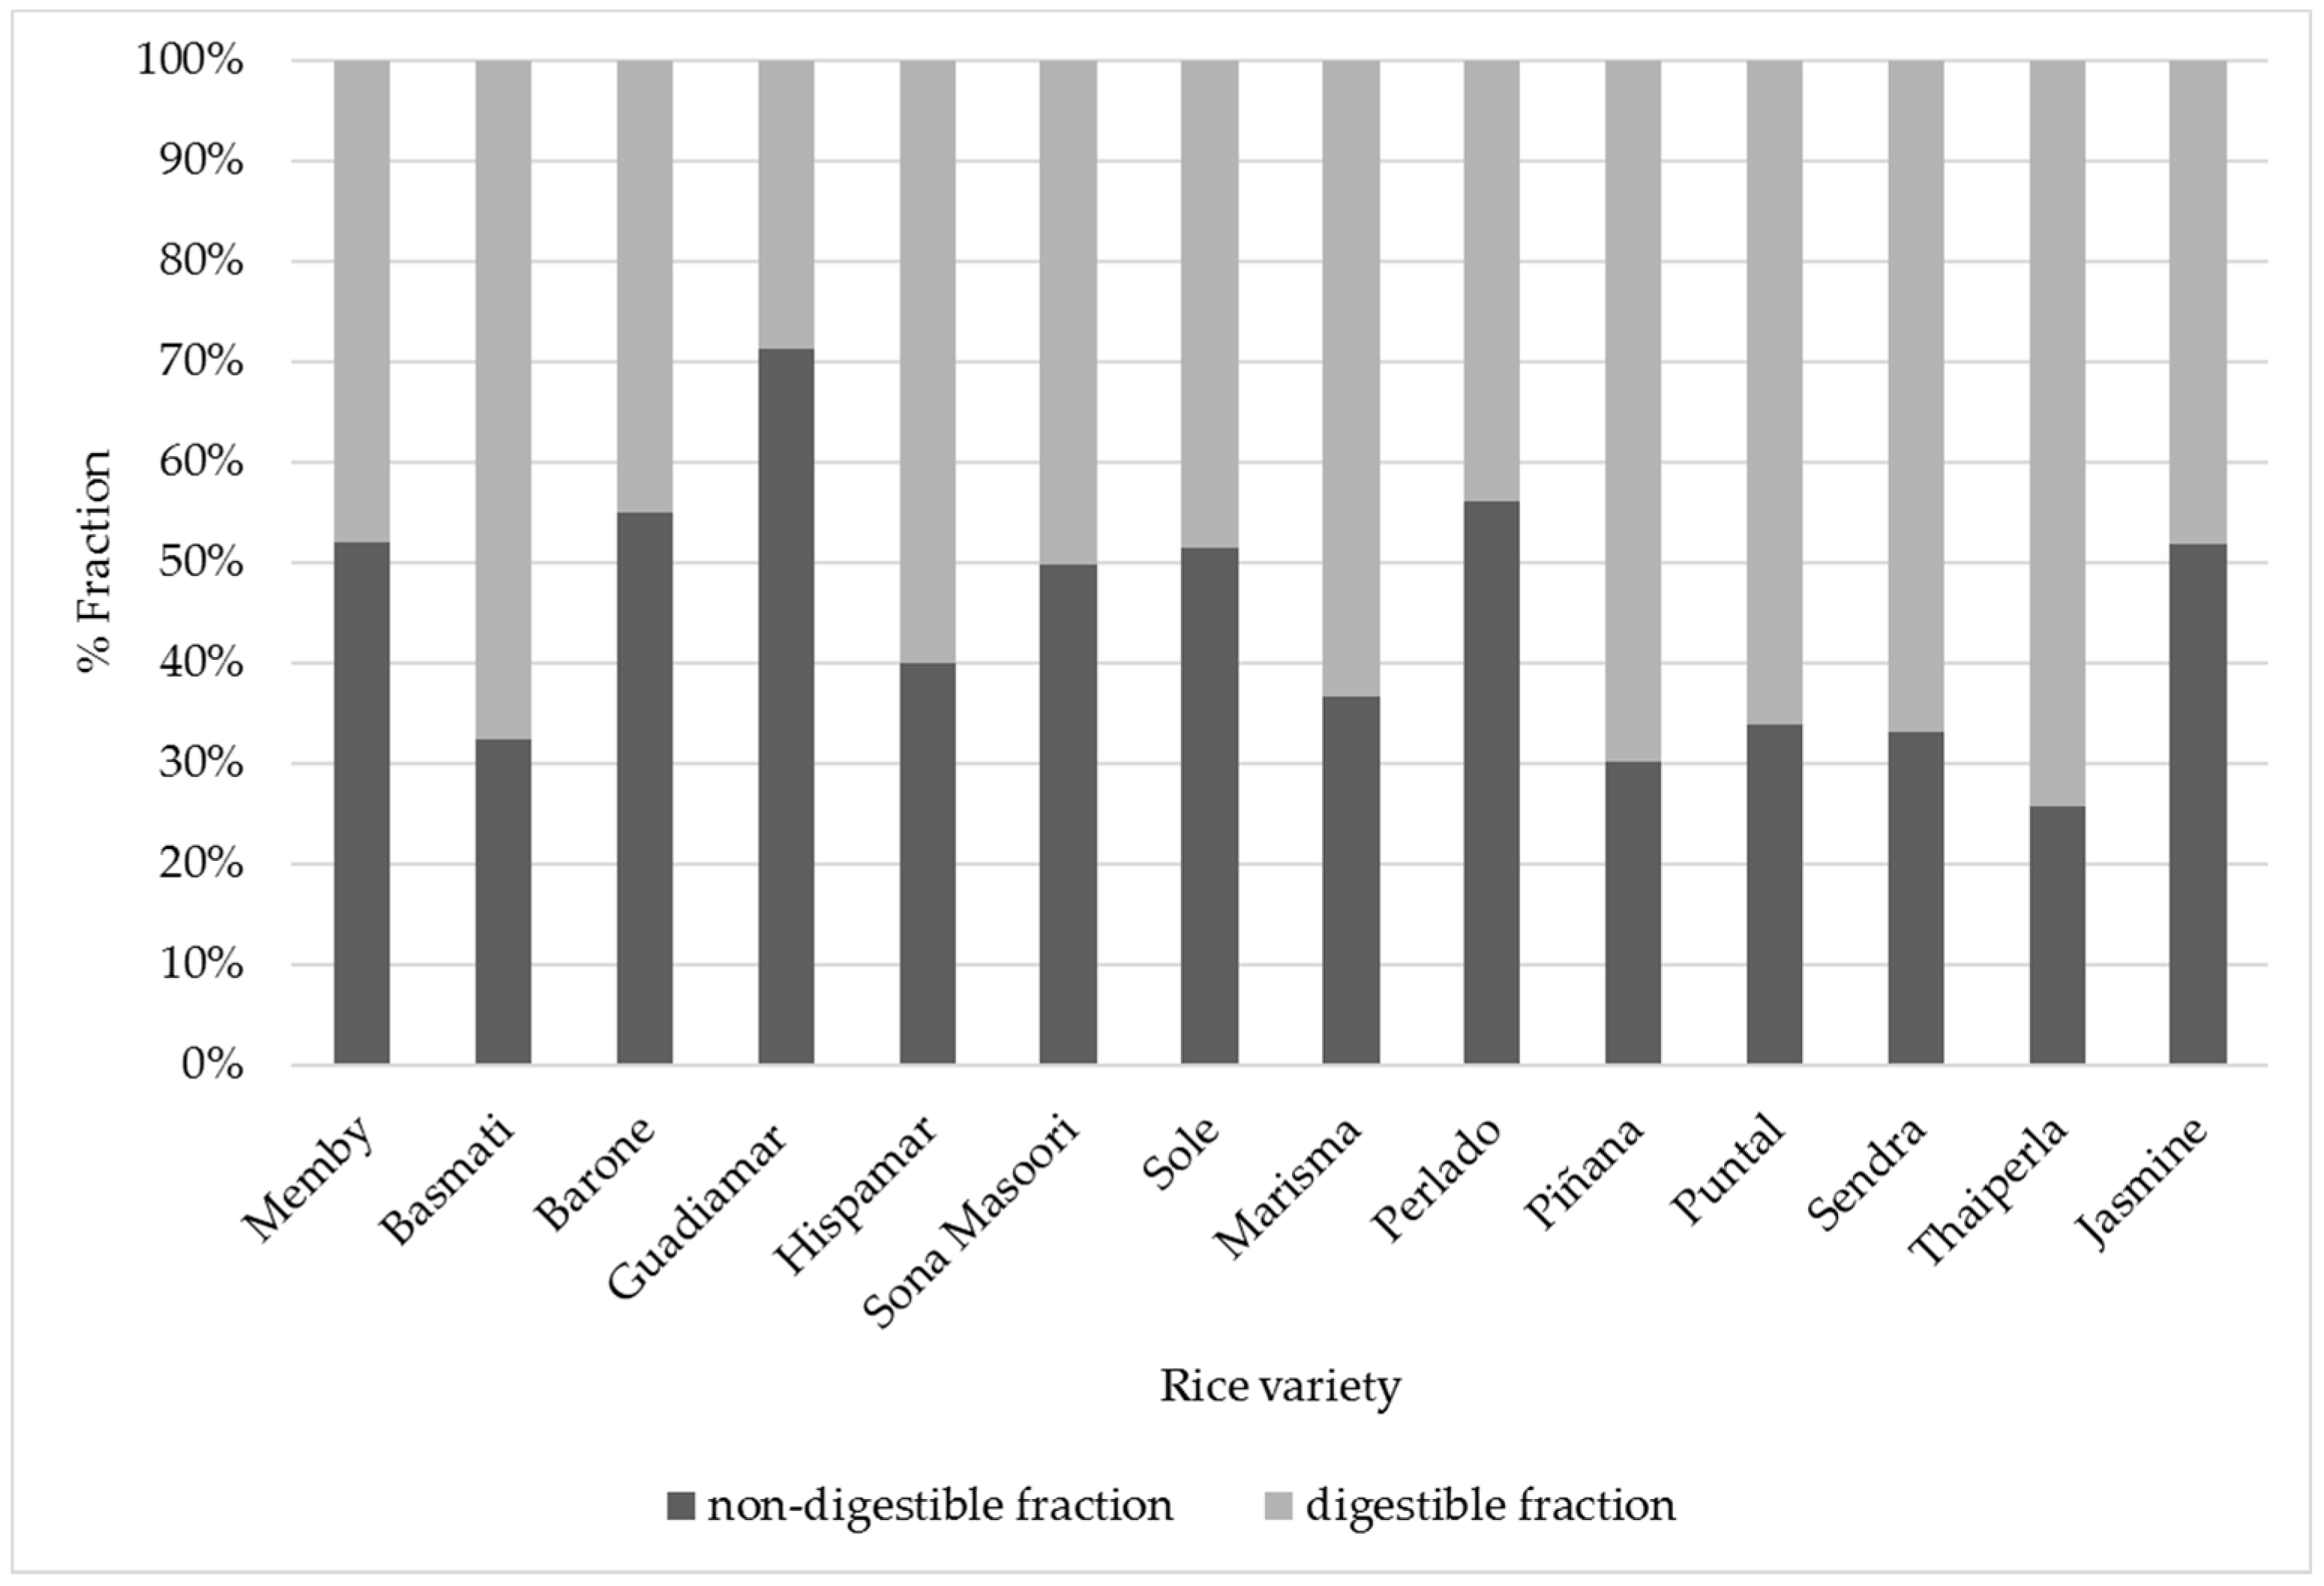
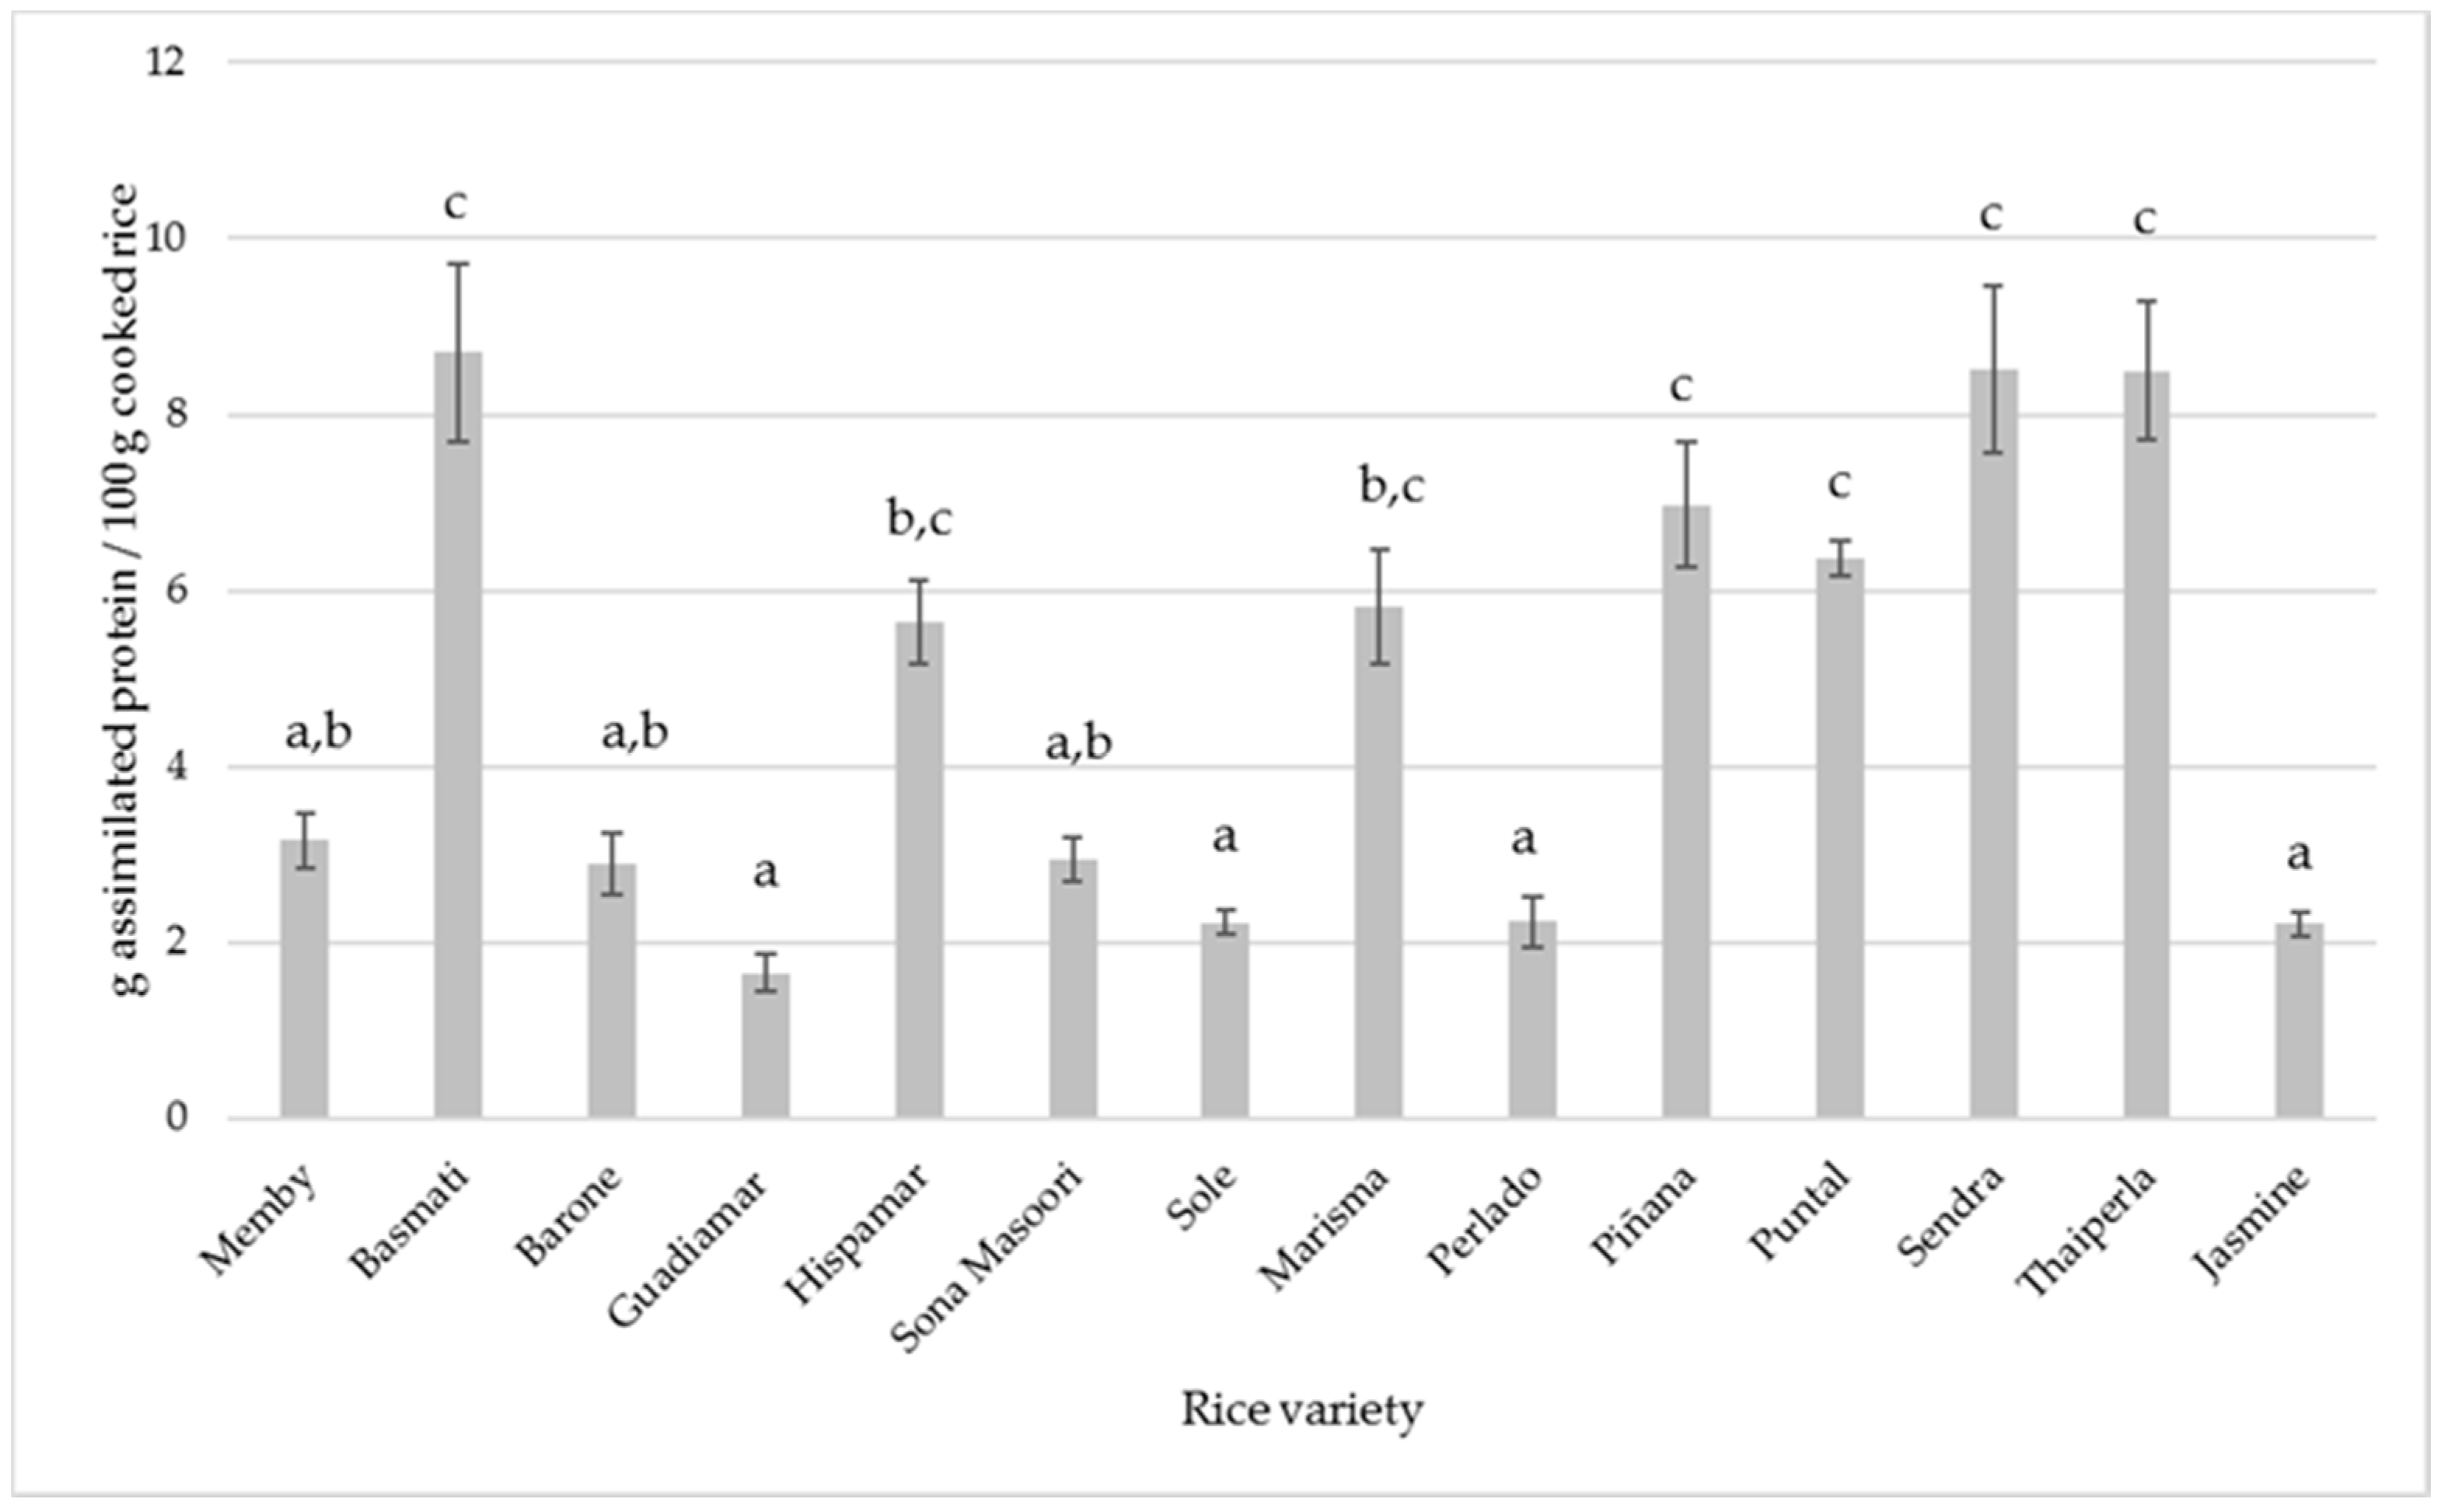
3.3. Digestible and Non-Digestible Fractions
3.4. Metalllic and Metalloid Content in Rice
3.5. Metal Intake through Rice Consumption
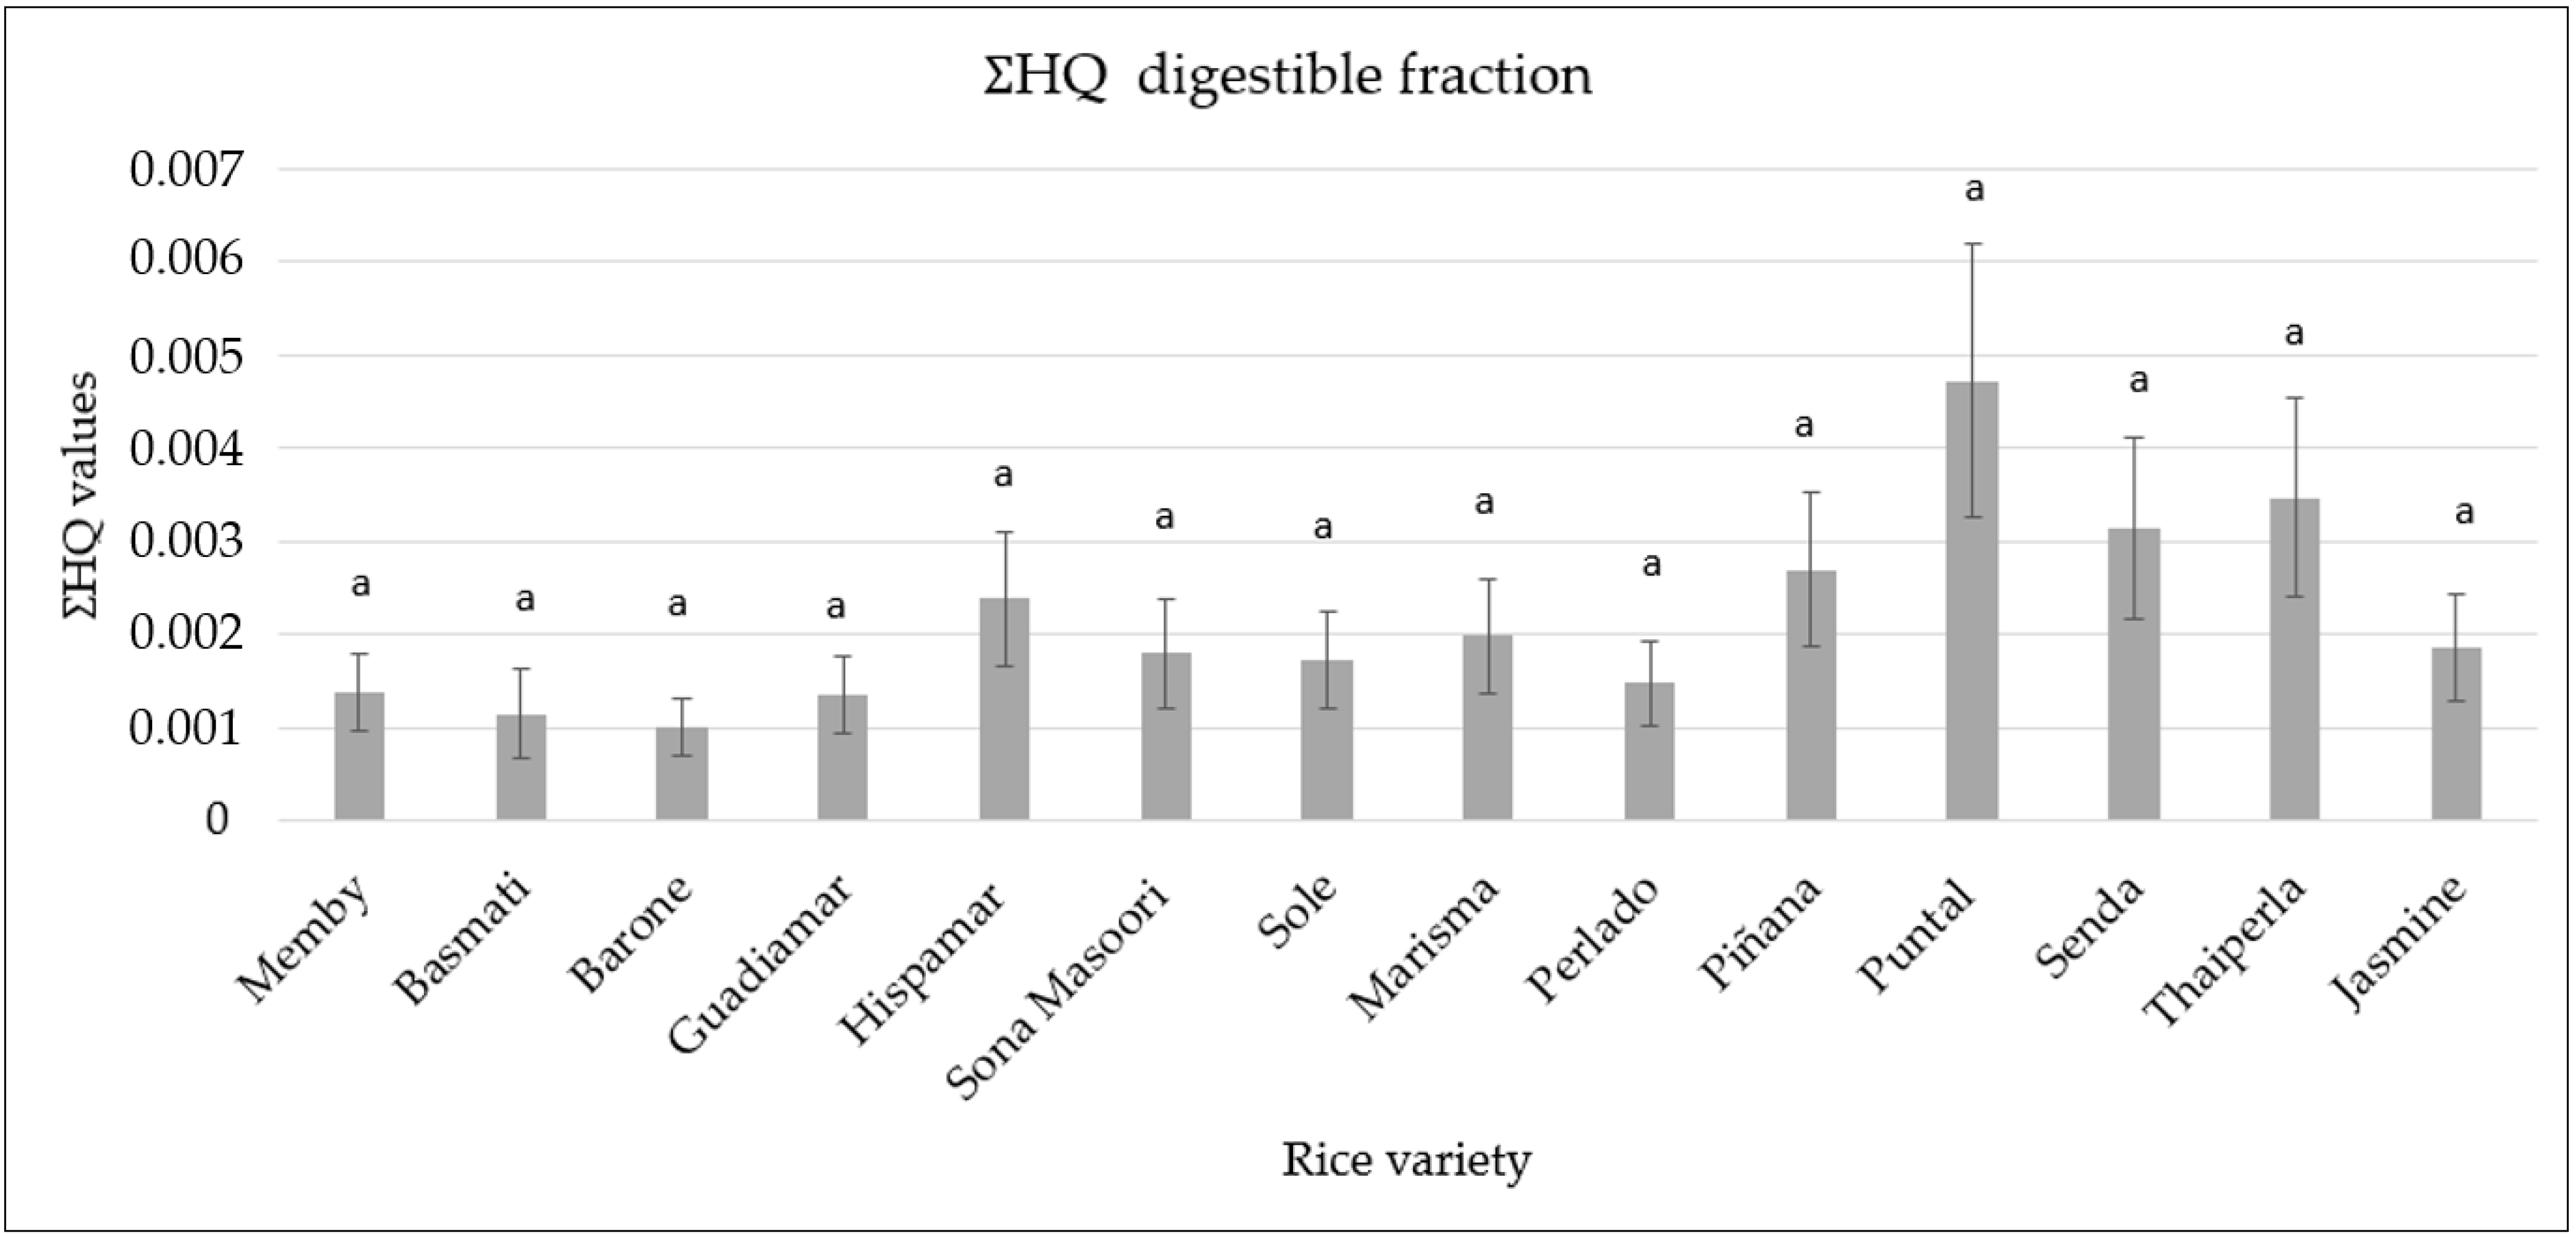
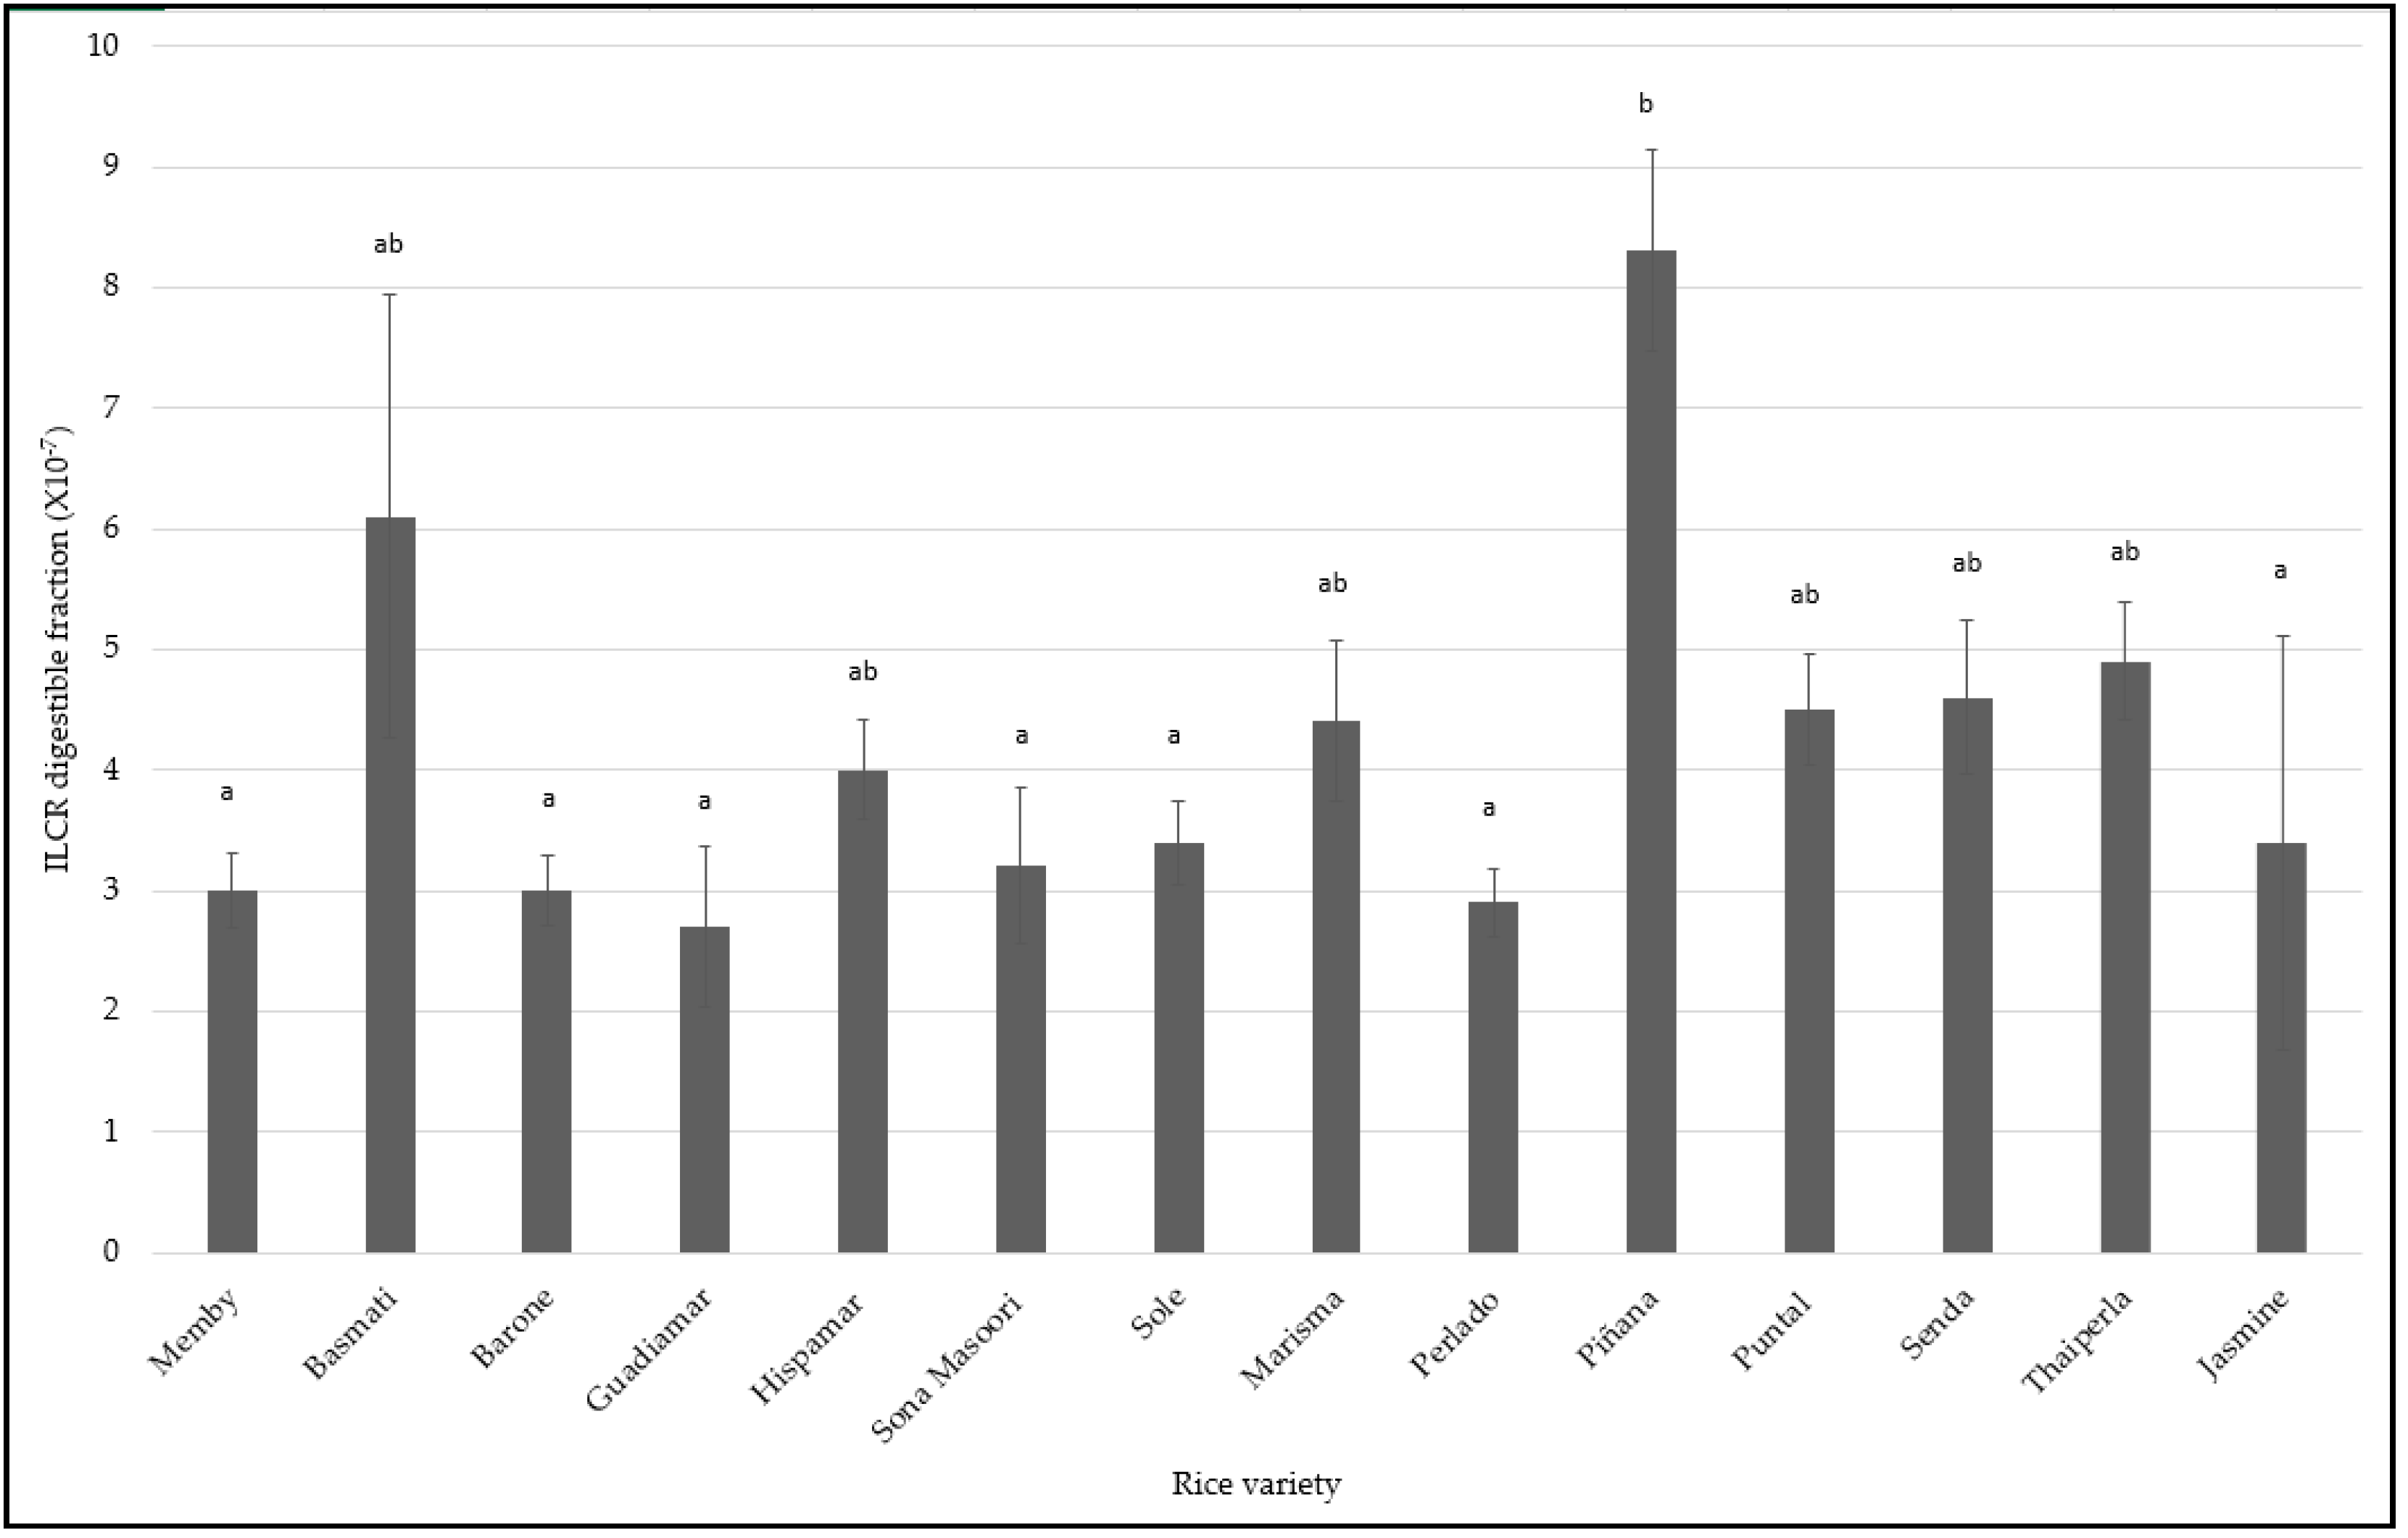
3.6. Human Health Risk Assessment
4. Conclusions
Author Contributions
Funding
Conflicts of Interest
References
- Olayiwola, K.; Soyibo, A.; Atinmo, T. Globalization of Food Systems in Developing Countries: Impact on Food Security and Nutrition Impact of Globalization on Food Consumption, Health and Nutrition in Nigeria. Available online: https://agris.fao.org/agris-search/search.do?recordID=GB2013201546 (accessed on 10 September 2021).
- Total Global Rice Consumption 2021|Statista. Available online: https://www.statista.com/statistics/255977/total-global-rice-consumption/#statisticContainer (accessed on 23 August 2021).
- Almutairi, M.; Alsaleem, T.; Jeperel, H.; Alsamti, M.; Alowaifeer, A.M. Determination of inorganic arsenic, heavy metals, pesticides and mycotoxins in Indian rice (Oryza sativa) and a probabilistic dietary risk assessment for the population of Saudi Arabia. Regul. Toxicol. Pharmacol. 2021, 125, 104986. [Google Scholar] [CrossRef] [PubMed]
- Huang, Z.; Pan, X.-D.; Wu, P.-G.; Han, J.-L.; Chen, Q. Health Risk Assessment of Heavy Metals in Rice to the Population in Zhejiang, China. PLoS ONE 2013, 8, e75007. [Google Scholar] [CrossRef] [PubMed]
- Yang, S.-N.; Hsieh, C.-C.; Kuo, H.-F.; Lee, M.-S.; Huang, M.-Y.; Kuo, C.-H.; Hung, C.-H. The Effects of Environmental Toxins on Allergic Inflammation. Allergy. Asthma Immunol. Res. 2014, 6, 478. [Google Scholar] [CrossRef] [PubMed]
- Singh, R.; Gautam, N.; Mishra, A.; Gupta, R. Heavy metals and living systems: An overview. Indian J. Pharmacol. 2011, 43, 246. [Google Scholar] [CrossRef] [PubMed] [Green Version]
- Tchounwou, P.B.; Yedjou, C.G.; Patlolla, A.K.; Sutton, D.J. Heavy Metals Toxicity and the Environment. EXS 2012, 101, 133. [Google Scholar] [CrossRef] [Green Version]
- Engwa, G.A.; Ferdinand, P.U.; Nwalo, F.N.; Unachukwu, M.N. Mechanism and Health Effects of Heavy Metal Toxicity in Humans. In Poisoning in the Modern World-New Tricks for an Old Dog; Intechopen: Rijeka, Croatia, 2019. [Google Scholar] [CrossRef] [Green Version]
- Simmons, R.W.; Pongsakul, P.; Saiyasitpanich, D.; Klinphoklap, S. Elevated levels of ladmium and zinc in paddy soils and elevated levels of cadmium in rice grain downstream of a zinc mineralized area in Thailand: Implications for public health. Environ. Geochem. Health 2005, 27, 501–511. [Google Scholar] [CrossRef] [PubMed]
- Wacewicz-Muczyńska, M.; Socha, K.; Soroczyńska, J.; Niczyporuk, M.; Borawska, M.H. Cadmium, lead and mercury in the blood of psoriatic and vitiligo patients and their possible associations with dietary habits. Sci. Total Environ. 2021, 757, 143967. [Google Scholar] [CrossRef] [PubMed]
- Huang, C.F.; Chen, Y.W.; Yang, C.Y.; Tsai, K.S.; Yang, R.S.; Liu, S.H. Arsenic and diabetes: Current perspectives. Kaohsiung J. Med. Sci. 2011, 27, 402–410. [Google Scholar] [CrossRef] [PubMed] [Green Version]
- Rahman, M.M.; Ng, J.C.; Naidu, R. Chronic exposure of arsenic via drinking water and its adverse health impacts on humans. Environ. Geochem. Health 2009, 31, 189–200. [Google Scholar] [CrossRef] [PubMed]
- FAO/WHO. Expert Committee on Food Additives Evaluation of certain food additives and contaminants: Eightieth report. WHO Tech. Rep. Ser. 2016, 959, 51–54, 84. [Google Scholar]
- Jiang, Q.; Wang, J.; Li, M.; Liang, X.; Dai, G.; Hu, Z.; Wen, J.; Huang, Q.; Zhang, Y. Dietary exposure to aluminium of urban residents from cities in South China. Food Addit. Contam. Part A 2013, 30, 698–704. [Google Scholar] [CrossRef]
- Herrero Fernández, Z.; Reinaldo Estevez Álvarez, J.; Montero Álvarez, A.; Muñiz Ugarte, O.; Pupo González, I.; Rodríguez González, M.; Araújo Dos Santos Júnior, J.; Brayner Cavalcanti Freire Bezerra, M.; Pereira Dos Santos Junior, O. Metal contaminants in rice from Cuba analyzed by ICP-MS, ICP-AES and CVAAS. Food Addit. Contam. Part A 2021, 14, 59–65. [Google Scholar] [CrossRef]
- Rychen, G.; Aquilina, G.; Azimonti, G.; Bampidis, V.; de Lourdes Bastos, M.; Bories, G.; Chesson, A.; Cocconcelli, P.S.; Flachowsky, G.; Gropp, J.; et al. Guidance on the assessment of the safety of feed additives for the target species. EFSA J. 2017, 15, e05021. [Google Scholar] [CrossRef]
- Meng, W.; Wang, Z.; Hu, B.; Wang, Z.; Li, H.; Goodman, R.C. Heavy metals in soil and plants after long-term sewage irrigation at Tianjin China: A case study assessment. Agric. Water Manag. 2016, 171, 153–161. [Google Scholar] [CrossRef]
- Lin, J.; Sun, D.; Zhang, Z.; Duan, Z.; Dong, J. Heavy metals and health risk of rice sampled in Yangtze River Delta, China. Food Addit. Contam. Part B 2021, 14, 133–140. [Google Scholar] [CrossRef]
- Ministerio de Agricultura, Pesca y Alimentación. Informe del Consumo Alimentario en España 2020. Gob. España 2018, 538. Available online: https://www.mapa.gob.es/ca/alimentacion/temas/consumo-tendencias/informe-anual-consumo-2020_baja-res_tcm34-562704.pdf (accessed on 3 September 2021).
- ONU Arroz: Importaciones Españolas por País de Origen en 2019|Statista. Available online: https://es.statista.com/estadisticas/1139111/volumen-de-arroz-importado-por-espana-desde-distintos-paises-de-origen/ (accessed on 8 July 2021).
- Praveena, S.M.; Omar, N.A. Heavy metal exposure from cooked rice grain ingestion and its potential health risks to humans from total and bioavailable forms analysis. Food Chem. 2017, 235, 203–211. [Google Scholar] [CrossRef] [PubMed]
- Brodkorb, A.; Egger, L.; Alminger, M.; Alvito, P.; Assunção, R.; Ballance, S.; Bohn, T.; Bourlieu-Lacanal, C.; Boutrou, R.; Carrière, F.; et al. INFOGEST static in vitro simulation of gastrointestinal food digestion. Nat. Protoc. 2019, 14, 991–1014. [Google Scholar] [CrossRef] [PubMed]
- McCleary, B.V.; McLoughlin, C.; Charmier, L.M.J.; McGeough, P. Measurement of available carbohydrates, digestible, and resistant starch in food ingredients and products. Cereal Chem. 2020, 97, 114–137. [Google Scholar] [CrossRef] [Green Version]
- Evers, J.M.; Hughes, C.G. ANALYSIS | Chemical Analysis. Encycl. Dairy Sci. 2002, 34–40. [Google Scholar] [CrossRef]
- Luque de Castro, M.D.; García Ayuso, L.E. Environmental Applications|Soxhlet Extraction. Encycl. Sep. Sci. 2000, 2701–2709. [Google Scholar] [CrossRef]
- Rubio-Armendáriz, C.; Soraya, P.; Gutierrez, Á.J.; Gomes Furtado, V.; González-Weller, D.; Revert, C.; Hardisson, A. Toxic Metals in Cereals in Cape Verde: Risk Assessment Evaluation. Int. J. Environ. Res. Public Health 2021, 18, 3833. [Google Scholar] [CrossRef] [PubMed]
- Gutiérrez, A.J.; Rubio, C.; Moreno, I.M.; González, A.G.; Gonzalez-Weller, D.; Bencharki, N.; Hardisson, A.; Revert, C. Estimation of dietary intake and target hazard quotients for metals by consumption of wines from the Canary Islands. Food Chem. Toxicol. 2017, 108, 10–18. [Google Scholar] [CrossRef] [PubMed]
- Sharafi, K.; Yunesian, M.; Mahvi, A.H.; Pirsaheb, M.; Nazmara, S.; Nabizadeh Nodehi, R. Advantages and disadvantages of different pre-cooking and cooking methods in removal of essential and toxic metals from various rice types- human health risk assessment in Tehran households, Iran. Ecotoxicol. Environ. Saf. 2019, 175, 128–137. [Google Scholar] [CrossRef] [PubMed]
- Chien, L.C.; Hung, T.C.; Choang, K.Y.; Yeh, C.Y.; Meng, P.J.; Shieh, M.J.; Han, B.C. Daily intake of TBT, Cu, Zn, Cd and As for fishermen in Taiwan. Sci. Total Environ. 2002, 285, 177–185. [Google Scholar] [CrossRef]
- USEPA Basic Information about the Integrated Risk Information System|US EPA. Available online: https://www.epa.gov/iris/basic-information-about-integrated-risk-information-system (accessed on 10 August 2021).
- US Environmental Protection Agency. Exposure Factors Handbook: 2011 Edition; US Environmental Protection Agency: Washington, DC, USA, 2011; EPA/600/R; pp. 1–1466.
- Zhao, M.; Lin, Y.; Chen, H. Improving nutritional quality of rice for human health. Theor. Appl. Genet. 2020, 133, 1397–1413. [Google Scholar] [CrossRef]
- Tako, M.; Tamaki, Y.; Teruya, T.; Takeda, Y. The Principles of Starch Gelatinization and Retrogradation. Food Nutr. Sci. 2014, 5, 280–291. [Google Scholar] [CrossRef] [Green Version]
- Linden, G.; Lorient, D. Functional properties. New Ingred. Food Process. 1999, 9–35. [Google Scholar] [CrossRef]
- Lim, M.C.; Lim, K.C.; Abdullah, M.Z. Rice moisture imaging using electromagnetic measurement technique. Food Bioprod. Process. Trans. Inst. Chem. Eng. Part. C 2003, 81, 159–169. [Google Scholar] [CrossRef]
- Ozbekova, Z.; Kulmyrzaev, A. Study of moisture content and water activity of rice using fluorescence spectroscopy and multivariate analysis. Spectrochim. Acta-Part. A Mol. Biomol. Spectrosc. 2019, 223, 117357. [Google Scholar] [CrossRef]
- Wu, P.; Deng, R.; Wu, X.; Wang, Y.; Dong, Z.; Dhital, S.; Chen, X.D. In vitro gastric digestion of cooked white and brown rice using a dynamic rat stomach model. Food Chem. 2017, 237, 1065–1072. [Google Scholar] [CrossRef] [PubMed] [Green Version]
- Vici, G.; Perinelli, D.R.; Camilletti, D.; Carotenuto, F.; Belli, L.; Polzonetti, V. Nutritional properties of rice varieties commonly consumed in Italy and applicability in Gluten free diet. Foods 2021, 10, 1375. [Google Scholar] [CrossRef]
- Yankah, N.; Intiful, F.D.; Tette, E.M.A. Comparative study of the nutritional composition of local brown rice, maize (obaatanpa), and millet—A baseline research for varietal complementary feeding. Food Sci. Nutr. 2020, 8, 2692–2698. [Google Scholar] [CrossRef] [Green Version]
- Khangwal, I.; Shukla, P. Potential prebiotics and their transmission mechanisms: Recent approaches. J. Food Drug Anal. 2019, 27, 649–656. [Google Scholar] [CrossRef] [PubMed] [Green Version]
- Panlasigui, D.; Leonora, N.; Thompson, L.U. Blood glucose lowering effects of brown rice in normal and diabetic subjects. Int. J. Food Sci. Nutr. 2009, 57, 151–158. [Google Scholar] [CrossRef] [PubMed]
- Mano, F.; Ikeda, K.; Joo, E.; Fujita, Y.; Yamane, S.; Harada, N.; Inagaki, N. The Effect of White Rice and White Bread as Staple Foods on Gut Microbiota and Host Metabolism. Nutrients 2018, 10, 1323. [Google Scholar] [CrossRef] [PubMed] [Green Version]
- Miraji, K.F.; Linnemann, A.R.; Fogliano, V.; Laswai, H.S.; Capuano, E. Nutritional quality and: In vitro digestion of immature rice-based processed products. Food Funct. 2020, 11, 7611–7625. [Google Scholar] [CrossRef] [PubMed]
- Azizi, R.; Capuano, E.; Nasirpour, A.; Pellegrini, N.; Golmakani, M.T.; Hosseini, S.M.H.; Farahnaky, A. Varietal differences in the effect of rice ageing on starch digestion. Food Hydrocoll. 2019, 95, 358–366. [Google Scholar] [CrossRef]
- Algattawi, A.A.; Fayez-Hassan, M.; Khalil, E. Soil contamination with toxic aluminum at Mid and West Libya. Toxicol. Int. 2018, 25, 198–203. [Google Scholar] [CrossRef]
- Kumar, V.; Gill, K.D. Aluminium neurotoxicity: Neurobehavioural and oxidative aspects. Arch. Toxicol. 2009, 83, 965–978. [Google Scholar] [CrossRef] [PubMed]
- Bondy, S.C. The neurotoxicity of environmental aluminum is still an issue. Bone 2014, 23, 1–7. [Google Scholar] [CrossRef] [PubMed] [Green Version]
- Løvik, M.; Frøyland, L.; Haugen, M.; Henjum, S.; Stea, T.; Strand, T.; Parr, C.; Holvik, K. Assessment of Dietary Intake of Chromium (III) in Relation to Tolerable Upper Intake Level. Eur. J. Nutr. Food Saf. 2018, 8, 195–197. [Google Scholar] [CrossRef] [Green Version]
- Meng, F.; Wei, Y.; Yang, X. Iron content and bioavailability in rice. J. Trace Elem. Med. Biol. 2005, 18, 333–338. [Google Scholar] [CrossRef] [PubMed]
- Niño, S.A.; Morales-Martínez, A.; Chi-Ahumada, E.; Carrizales, L.; Salgado-Delgado, R.; Pérez-Severiano, F.; Díaz-Cintra, S.; Jiménez-Capdeville, M.E.; Zarazúa, S. Arsenic Exposure Contributes to the Bioenergetic Damage in an Alzheimer’s Disease Model. ACS Chem. Neurosci. 2019, 10, 323–336. [Google Scholar] [CrossRef]
- Calatayud, M.; Llopis, J.M.L. Arsenic through the Gastrointestinal Tract. In Handbook of Arsenic Toxicology; Elsevier Inc.: Amsterdam, The Netherlands, 2015; pp. 281–299. ISBN 9780124199552. [Google Scholar]
- Kumari, M.; Platel, K. Effect of sulfur-containing spices on the bioaccessibility of trace minerals from selected cereals and pulses. J. Sci. Food Agric. 2017, 97, 2842–2848. [Google Scholar] [CrossRef]
- USEPA Guidelines for Carcinogen Risk Assessment. EPA/630/P-03/001F 2005. Available online: https://www.epa.gov/risk/guidelines-carcinogen-risk-assessment (accessed on 3 August 2021).
- Lappalainen, K.; Kärkkäinen, J.; Rusanen, A.; Wik, T.-R.; Niemelä, M.; Madariaga, A.G.; Komulainen, S.; Keiski, R.L.; Lajunen, M. Binding of some heavy metal ions in aqueous solution with cationized or sulphonylated starch or waste starch. Starch-Stärke 2016, 68, 900–908. [Google Scholar] [CrossRef]
- Hensawang, S.; Chanpiwat, P. Health impact assessment of arsenic and cadmium intake via rice consumption in Bangkok, Thailand. Environ. Monit. Assess. 2017, 189, 599. [Google Scholar] [CrossRef] [PubMed]
- Upadhyay, M.K.; Majumdar, A.; Barla, A.; Bose, S.; Srivastava, S. An assessment of arsenic hazard in groundwater–soil–rice system in two villages of Nadia district, West Bengal, India. Environ. Geochem. Heal. 2019, 41, 2381–2395. [Google Scholar] [CrossRef] [PubMed]
- Kormoker, T.; Proshad, R.; Islam, M.S.; Tusher, T.R.; Uddin, M.; Khadka, S.; Chandra, K.; Sayeed, A. Presence of toxic metals in rice with human health hazards in Tangail district of Bangladesh. Int. J. Environ. Health Res. 2020, 00, 1–21. [Google Scholar] [CrossRef]
- Zavala, Y.J.; Duxbury, J.M. Arsenic in rice: I. Estimating normal levels of total arsenic in rice grain. Environ. Sci. Technol. 2008, 42, 3856–3860. [Google Scholar] [CrossRef]
- Martínez-Cortijo, J.; Ruiz-Canales, A. Effect of heavy metals on rice irrigated fields with waste water in high pH Mediterranean soils: The particular case of the Valencia area in Spain. Agric. Water Manag. 2018, 210, 108–123. [Google Scholar] [CrossRef]

| Variety | Origin |
|---|---|
| Hispamar | Spain |
| Perlado | Spain |
| Memby | Argentine |
| Barone | Greece |
| Jasmine | Vietnam |
| Sona Masoori | India |
| Sole | Italy |
| Piñana | Spain |
| Thaiperla | Spain |
| Guadiamar | Spain |
| Puntal | Spain |
| Sendra | Spain |
| Basmati | India |
| Marisma | Spain |
| SSF | SGF | SIF | ||||||
|---|---|---|---|---|---|---|---|---|
| pH7 | pH3 | pH7 | ||||||
| Constituent | Stock Concentration | Volume of Stock | Concentration in SSF | Volume of Stock | Concentration in SSF | Volume of Stock | Concentration in SSF | |
| g L−1 | mol L−1 | mL | mmol L−1 | mL | mmol L−1 | mL | mmol L−1 | |
| KCl | 37.3 | 0.5 | 15.1 | 15.1 | 6.9 | 6.9 | 6.8 | 6.8 |
| KH2PO4 | 68 | 0.5 | 3.7 | 3.7 | 0.9 | 0.9 | 0.8 | 0.8 |
| NaHCO3 | 84 | 1 | 6.8 | 13.6 | 12.5 | 25 | 42.5 | 85 |
| NaCl | 117 | 2 | - | - | 11.8 | 47.2 | 9.6 | 38.4 |
| MgCl2(H2O)6 | 30.5 | 0.15 | 0.5 | 0.15 | 0.4 | 0.1 | 1.1 | 0.33 |
| (NH4)2CO3 | 48 | 0.5 | 0.06 | 0.06 | 0.5 | 0.5 | - | - |
| For pH adjustment | ||||||||
| g L−1 | mL | mmol L−1 | mL | mmol L−1 | mL | mmol L−1 | ||
| NaOH | 1 | - | - | - | - | - | - | |
| HCl | 6 | 0.09 | 1.1 | 1.3 | 15.6 | 0.7 | 8.4 | |
| g L−1 | mol L−1 | mmol L−1 | mmol L−1 | mmol L−1 | ||||
| CaCl2(H2O)2 | 44.1 | 0.3 | 1.5 (0.75 *) | 0.15 (0.075 *) | 0.6 (0.3 *) | |||
| Flow Rate | 1.00 |
|---|---|
| Radio frequency power | 1.350 |
| Plasma argon flow rate (L min−1) | 15 |
| Auxiliar argon flow rate (L min−1) | 0.50 |
| Nebulization flow rate (L min−1) | 0.60 |
| Read delay/s | 30 |
| Integration time/s (min-max) | 1–5 |
| Replicate | 3 |
| Wavelengths (nm) | Cd: 226.5, Pb: 220.3, Al: 237.7, As:228.0, Cr: 205.5 |
| Al | 0.0004 |
| Cr | 0.0030 |
| As | 0.0003 |
| Cd | 0.0010 |
| Pb | 0.0035 |
| As | 1.5000 |
| Cd | 0.3800 |
| Cr | 0.5000 |
| Pb | 0.0085 |
| Variety | Moisture (%) | Ash (%) | Fat (%) | Protein (%) | Total Carbohydrates (%) |
|---|---|---|---|---|---|
| Memby | 14.17 ± 1.56 a | 0.64 ± 0.03 d | 0.62 ± 0.02 b | 9.60 ± 1.33 a,b | 75.04 ± 7.66 a |
| Basmati | 12.61 ± 0.94 a | 0.59 ± 0.06 c,d | 0.50 ± 0.06 a,b | 11.45 ± 2.34 a,b | 74.86 ± 8.14 a |
| Barone | 13.93 ± 1.52 a | 0.44 ± 0.06 a,b,c,d | 0.68 ± 0.08 b | 15.09 ± 0.48 b | 69.89 ± 5.28 a |
| Guadiamar | 13.13 ± 2.14 a | 0.39 ± 0.01 a,b,c | 0.59 ± 0.03 b | 9.71 ± 0.97 a,b | 76.21 ± 8.29 a |
| Hispamar | 12.94 ± 1.67 a | 0.43 ± 0.03 a,b,c,d | 0.67 ± 0.02 b | 9.36 ± 2.03 a,b | 76.64 ± 4.13 a |
| Sonamasoori | 17.04 ± 1.63 a | 0.30 ± 0.03 a,b | 0.22 ± 0.02 a | 10.26 ± 1.31 a,b | 72.22 ± 4.66 a |
| Sole | 13.56 ± 2.15 a | 0.52 ± 0.03 b,c,d | 0.64 ± 0.04 b | 6.85 ± 0.95 a | 78.49 ± 8.54 a |
| Marisma | 11.64 ± 1.44 a | 0.45 ± 0.02 a,b,c,d | 0.72 ± 0.09 b | 10.03 ± 1.63 a,b | 77.20 ± 6.94 a |
| Perlado | 10.71 ± 1.13 a | 0.43 ± 0.03 a,b,c,d | 0.68 ± 0.08 b | 5.01 ± 0.21 a | 82.17 ± 6.55 a |
| Piñana | 10.87 ± 1.07 a | 0.37 ± 0.04 a,b,c | 0.64 ± 0.04 b | 9.16 ± 1.82 a,b | 79.03 ± 5.30 a |
| Puntal | 12.46 ± 1.49 a | 0.40 ± 0.05 a,b,c | 0.56 ± 0.06 b | 6.27 ± 0.75 a | 80.37 ± 6.44 a |
| Sendra | 10.95 ± 1.17 a | 0.52 ± 0.03 b,c,d | 0.61 ± 0.04 b | 10.23 ± 1.15 a,b | 77.74 ± 6.98 a |
| Thaiperla | 13.65 ± 1.42 a | 0.48 ± 0.04 a,b,c,d | 0.54 ± 0.06 a,b | 5.21 ± 0.29 a | 80.17 ± 6.57 a |
| Jasmine | 12.64 ± 1.63 a | 0.26 ± 0.06 a | 0.7 ± 0.09 b | 9.82 ± 1.26 a,b | 76.62 ± 6.26 a |
| Average value | 12.62% ± 1.08 | 0.44 ± 0.3 | 0.60 ± 0.05 | 9.14 ± 1.18 | 76.90 ± 6.55 |
| Variety | Moisture (%) | Ash (%) | Fat (%) | Protein (%) | Total Carbohydrates (%) |
|---|---|---|---|---|---|
| Memby | 4.00 ± 0.35 a | 0.74 ± 0.02 f | 0.52 ± 0.03 a,b,c | 10.66 ± 1.15 a,b | 84.14 ± 4.56 a |
| Basmati | 4.44 ± 0.24 a | 0.54 ± 0.03 c,d,e | 0.59 ± 0.04 b,c,d | 12.31 ± 2.06 a,b | 82.16 ± 6.34 a |
| Barone | 4.14 ± 0.53 a | 0.52 ± 0.05 b,c,d,e | 0.62 ± 0.07 b,c,d | 15.49 ± 1.41 b | 79.27 ± 3.76 a |
| Guadiamar | 3.57 ± 0.28 a | 0.36 ± 0.02 a,b,c | 0.49 ± 0.03 a,b,c | 10.97 ± 1.35 a,b | 84.68 ± 6.97 a |
| Hispamar | 4.13 ± 0.45 a | 0.65 ± 0.02 e,f | 0.61 ± 0.03 b,c,d | 10.98 ± 1.41 a,b | 83.66 ± 8.75 a |
| Sonamasoori | 4.37 ± 0.34 a | 0.41 ± 0.03 a,b,c,d | 0.31 ± 0.02 a | 11.53 ± 1.13 a,b | 83.45 ± 4.63 a |
| Sole | 4.26 ± 0.47 a | 0.55 ± 0.02,d,e | 0.59 ± 0.05 b,c,d | 7.25 ± 0.68 a | 87.41 ± 8.12 a |
| Marisma | 4.98 ± 0.55 a | 0.51 ± 0.03 b,c,d,e | 0.81 ± 0.07 d | 10.74 ± 1.64 a,b | 83.04 ± 4.21 a |
| Perlado | 4.01 ± 0.63 a | 0.34 ± 0.03 a,b | 0.59 ± 0.06 b,c,d | 11.98 ± 1.43 a,b | 80.66 ± 8.75 a |
| Piñana | 5.15 ± 0.61 a | 0.32 ± 0.04 a | 0.61 ± 0.03 b,c,d | 9.56 ± 1.21 a,b | 89.51 ± 3.91 a |
| Puntal | 3.96 ± 0.45 a | 0.43 ± 0.04 a,b,c,d | 0.48 ± 0.04 a,b | 7.87 ± 0.63 a | 87.32 ± 5.25 a |
| Sendra | 3.74 ± 0.36 a | 0.62 ± 0.02 e | 0.75 ± 0.03 c,d | 11.46 ± 0.64 a,b | 83.47 ± 7.15 a |
| Thaiperla | 4.00 ± 0.29 a | 0.41 ± 0.04 a,b,c,d | 0.62 ± 0.05 b,c,d | 6.59 ± 0.56 a | 88.38 ± 6.55 a |
| Jasmine | 3.00 ± 0.34 a | 0.32 ± 0.05 a | 0.64 ± 0.07 b,c,d | 10.30 ± 1.67 a,b | 85.74 ± 5.34 a |
| Average value | 4.09% ± 0.52 | 0.48 ± 0.03 | 0.58 ± 0.04 | 10.33 ± 1.21 | 84.49 ± 6.02 |
| Variety | Proteins Measured in Non-Digestible Fraction (%) | Calculated Proteins in Digestible Fraction (%) |
|---|---|---|
| Memby | 8.88 ± 0.81 b,c,d,e | 6.59 ± 0.62 a,b |
| Basmati | 10.53 ± 1.34 d,e | 12.87 ± 1.73 c |
| Barone | 10.12 ± 1.23 c,d,e | 6.44 ± 0.67 a,b |
| Guadiamar | 10.29 ± 0.91 d,e | 5.77 ± 1.09 a,b |
| Hispamar | 8.87 ± 0.81 b,c,d,e | 9.40 ± 1.10 a,b,c |
| Sona Masoori | 6.17 ± 0.53 a,b,c,d | 5.87 ± 0.82 a,b |
| Sole | 4.17 ± 0.36 a | 4.59 ± 0.37 a |
| Marisma | 6.93 ± 0.54 a,b,c,d,e | 9.19 ± 1.00 a,b,c |
| Perlado | 6.74 ± 0.62 a,b,c,d | 5.08 ± 0.40 a |
| Piñana | 5.58 ± 0.58 a,b,c | 9.99 ± 1.10 a,b,c |
| Puntal | 6.42 ± 0.45 a,b,c,d,e | 9.61 ± 1.34 a,b,c |
| Sendra | 10.88 ± 1.34 | 12.75 ± 1.09 c |
| Thaiperla | 5.44 ± 0.66 a,b,c | 11.43 ± 1.34 b,c |
| Jasmine | 4.20 ± 0.45 a,b | 4.58 ± 0.27 a |
| (A) | |||||
| ng/g of Cooked Rice | |||||
| Al | Cd | Cr | Pb | As | |
| Barone | 2.8 × 10⁻³ ± 3.1 × 10⁻⁴ b | 1.8 × 10⁻⁵ ± 2.5 × 10⁻⁷ a | 5.2 × 10⁻⁵ ± 6.8 × 10⁻⁷ c,d,e | 1.8 × 10⁻⁵ ± 1.7 × 10⁻⁶ a | 3.6 × 10⁻⁵ ± 3.5 × 10⁻⁶ a |
| Basmati | 2.1 × 10⁻³ ± 2.5 × 10⁻⁴ a,b | 1.8 × 10⁻⁵ ± 2.3 × 10⁻⁷ a | 6.1 × 10⁻⁵ ± 4.9 × 10⁻⁶ d,e | 1.8 × 10⁻⁵ ± 1.8 × 10⁻⁶ a | 3.2 × 10⁻⁵ ± 1.0 × 10⁻⁶ b |
| Guadiamar | 2.3 × 10⁻³ ± 2.2 × 10⁻⁴ a,b | 1.8 × 10⁻⁵ ± 1.6 × 10⁻⁶ a | 3.2 × 10⁻⁵ ± 4.8 × 10⁻⁷ b,c | 1.8 × 10⁻⁵ ± 2.2 × 10⁻⁶ a | 3.6 × 10⁻⁵ ± 3.2 × 10⁻⁶ a |
| Hispamar | 2.2 × 10⁻³ ± 2.1 × 10⁻⁴ a,b | 1.8 × 10⁻⁵ ± 1.8 × 10⁻⁶ a | 2.1 × 10⁻⁵ ± 1.9 × 10⁻⁶ a,b | 1.8 × 10⁻⁵ ± 2.7 × 10⁻⁶ a | 3.6 × 10⁻⁵ ± 4.0 × 10⁻⁶ a |
| Jasmine | 2.3 × 10⁻³ ± 2.3 × 10⁻⁵ a,b | 1.8 × 10⁻⁵ ± 3.2 × 10⁻¹³ a | 6.5 × 10⁻⁵ ± 6.5 × 10⁻⁸ e | 1.8 × 10⁻⁵ ± 2.3 × 10⁻⁶ a | 3.6 × 10⁻⁵ ± 5.8 × 10⁻⁶ a |
| Marisma | 1.9 × 10⁻³ ± 2.3 × 10⁻⁵ a | 1.8 × 10⁻⁵ ± 1.6 × 10⁻⁶ a | 3. × 10−5 ± 4.3 × 10⁻⁷ b,c | 1.8 × 10⁻⁵ ± 1.4 × 10⁻⁶ a | 3.6 × 10⁻⁵ ± 3.5 × 10⁻⁶ a |
| Memby | 1.9 × 10⁻³ ± 2.9 × 10⁻⁵ a | 1.8 × 10⁻⁵ ± 2.0 × 10⁻⁶ a | 8.7 × 10⁻⁶ ± 1.1 × 10⁻⁷ a | 1.8 × 10⁻⁵ ± 2.7 × 10⁻⁷ a | 3.6 × 10⁻⁵ ± 4.5 × 10⁻⁶ a |
| Perlado | 2.6 × 10⁻³ ± 3.4 × 10⁻⁵ a,b | 1.8 × 10⁻⁵ ± 2.9 × 10⁻⁶ a | 1.6 × 10⁻⁴ ± 2.1 × 10⁻⁶ f | 1.8 × 10⁻⁵ ± 1.6 × 10⁻⁶ a | 3.6 × 10⁻⁵ ± 4.9 × 10⁻⁶ a |
| Piñana | 2.3 × 10⁻³ ± 1.8 × 10⁻⁴ a,b | 1.8 × 10⁻⁵ ± 1.8 × 10⁻⁶ a | 4.7 × 10⁻⁵ ± 3.8 × 10⁻⁶ c,d,e | 1.8 × 10⁻⁵ ± 1.8 × 10⁻⁸ a | 3.6 × 10⁻⁵ ± 3.0 × 10⁻⁶ a |
| Puntal | 3.1 × 10⁻³ ± 4.7 × 10⁻⁵ a | 1.8 × 10⁻⁵ ± 2.3 × 10⁻⁶ a | 6.3 × 10⁻⁵ ± 7.6 × 10⁻⁶ d,e | 1.8 × 10⁻⁵ ± 2.2 × 10⁻⁷ a | 3.6 × 10⁻⁵ ± 2.8 × 10⁻⁶ a |
| Sendra | 2.5 × 10⁻³ ± 2.2 × 10⁻⁴ a,b | 1.8 × 10⁻⁵ ± 2.4 × 10⁻⁶ a | 6.0 × 10⁻⁵ ± 5.7 × 10⁻⁶ d,e | 1.8 × 10⁻⁵ ± 2.3 × 10⁻⁷ a | 3.6 × 10⁻⁵ ± 3.6 × 10⁻⁶ a |
| Sole | 2.2 × 10⁻³ ± 2.2 × 10⁻⁶ a,b | 1.8 × 10⁻⁵ ± 1.5 × 10⁻⁶ a | 6.0 × 10⁻⁵ ± 5.6 × 10⁻⁶ d,e | 1.8 × 10⁻⁵ ± 2.3 × 10⁻⁷ a | 3.6 × 10⁻⁵ ± 5.8 × 10⁻⁶ a |
| Sona Masoori | 2.3 × 10⁻³ ± 2.8 × 10⁻⁵ a,b | 1.8 × 10⁻⁵ ± 1.4 × 10⁻⁶ a | 6.7 × 10⁻⁵ ± 6.7 × 10⁻⁷ d,e | 1.8 × 10⁻⁵ ± 1.4 × 10⁻⁶ a | 3.6 × 10⁻⁵ ± 3.5 × 10⁻⁶ a |
| Thaiperla | 2.4 × 10⁻³ ± 3.1 × 10⁻⁵ a,b | 1.8 × 10⁻⁵ ± 1.8 × 10⁻⁶ a | 4.3 × 10⁻⁵ ± 3.9 × 10⁻⁶ c,d | 1.8 × 10⁻⁵ ± 2.7 × 10⁻⁷ a | 3.6 × 10⁻⁵ ± 4.5 × 10⁻⁶ a |
| (B) | |||||
| ng/g of Digestible Fraction of Rice | |||||
| Al | Cd | Cr | Pb | As | |
| Barone | 1.3 × 10⁻³ ± 1.7 × 10⁻⁹a,b,c,d | 8.6 × 10⁻⁶ ± 1.0 × 10⁻⁷ b,c | 1.8 × 10⁻⁵ ± 1.6 × 10⁻⁶ a | 8.6 × 10⁻⁵ ± 7.8 × 10⁻⁷ a,b | 1.7 × 10⁻⁵ ± 2.4 × 10⁻⁷ a |
| Basmati | 2.2 × 10⁻³ ± 4.8 × 10⁻⁹ f | 1.2 × 10⁻⁵ ± 1.8 × 10⁻⁷ d | 1.8 × 10⁻⁵ ± 2.0 × 10⁻⁶ a | 1.2 × 10⁻⁵ ± 1.2 × 10⁻⁶ b | 2.4 × 10⁻⁵ ± 3.1 × 10⁻⁷ a |
| Guadiamar | 1.2 × 10⁻³ ± 1.4 × 10⁻⁹ a,b,c | 8.1 × 10⁻⁶ ± 1.1 × 10⁻⁷ b | 1.8 × 10⁻⁵ ± 2.9 × 10⁻⁶ a | 8.1 × 10⁻⁶ ± 6.6 × 10⁻¹⁴ a,b | 1.6 × 10⁻⁵ ± 1.5 × 10⁻⁷ a |
| Hispamar | 7.3 × 10⁻⁴ ± 5.3 × 10⁻¹⁰ a | 5.1 × 10⁻⁶ ± 4.1 × 10⁻⁷ a | 1.8 × 10⁻⁵ ± 1.8 × 10⁻⁶ a | 5.1 × 10⁻⁶ ± 4.6 × 10⁻⁷ a | 1.0 × 10⁻⁵ ± 9.8 × 10⁻⁷ a |
| Jasmine | 1.4 × 10⁻³ ± 2.0 × 10⁻⁹ b,c,d,e | 1.1 × 10⁻⁵ ± 1.7 × 10⁻⁷ c,d | 1.8 × 10⁻⁵ ± 2.3 × 10⁻⁶ a | 1.1 × 10⁻⁵ ± 1.2 × 10⁻⁶ b | 2.2 × 10⁻⁵ ± 4.8 × 10⁻¹³ a |
| Marisma | 1.3 × 10⁻³ ± 1.7 × 10⁻⁹ a,b,c,d | 9.0 × 10⁻⁶ ± 8.0 × 10⁻⁷ b,c | 1.8 × 10⁻⁵ ± 2.4 × 10⁻⁶ a | 9.0 × 10⁻⁶ ± 1.4 × 10⁻⁶ a,b | 1.8 × 10⁻⁵ ± 1.6 × 10⁻⁶ a |
| Memby | 1.1 × 10⁻³ ± 1.2 × 10⁻⁴ a,b | 8.7 × 10⁻⁶ ± 8.7 × 10⁻⁹ b,c | 1.8 × 10⁻⁵ ± 1.5 × 10⁻⁶ a | 8.7 × 10⁻⁶ ± 8.5 × 10⁻⁷ a,b | 1.7 × 10⁻⁵ ± 1.9 × 10⁻⁶ a |
| Perlado | 2.0 × 10⁻³ ± 2.4 × 10⁻⁴ e,f | 1.1 × 10⁻⁵ ± 1.3 × 10⁻⁷ c,d | 1.8 × 10⁻⁵ ± 1.4 × 10⁻⁶ a | 1.1 × 10⁻⁵ ± 1.4 × 10⁻⁶ b | 2.3 × 10⁻⁵ ± 3.7 × 10⁻⁶ a |
| Piñana | 1.1 × 10⁻³ ± 1.0 × 10⁻⁴ a,b | 7.9 × 10⁻⁶ ± 1.0 × 10⁻⁷ b | 1.3 × 10⁻⁴ ± 1.2 × 10⁻⁶ b | 7.9 × 10⁻⁶ ± 7.5 × 10⁻⁷ a,b | 1.6 × 10⁻⁵ ± 1.6 × 10⁻⁶ a |
| Puntal | 1.9 × 10⁻³ ± 1.9 × 10⁻⁵ d,e,f | 1.3 × 10⁻⁵ ± 2.0 × 10⁻⁷ d | 1.8 × 10⁻⁵ ± 2.0 × 10⁻⁶ a | 1.3 × 10⁻⁵ ± 1.3 × 10⁻⁷ b | 2.5 × 10⁻⁵ ± 3.2 × 10⁻⁶ a |
| Sendra | 1.4 × 10⁻³ ± 1.4 × 10⁻⁶ b,c,d,e | 1.2 × 10⁻⁵ ± 1.6 × 10⁻⁷ d | 1.0 × 10⁻⁵ ± 2.9 × 10⁻⁶ a | 1.2 × 10⁻⁵ ± 1.8 × 10⁻⁷ b | 2.4 × 10⁻⁵ ± 3.2 × 10⁻⁶ a |
| Sole | 1.6 × 10⁻³ ± 2.1 × 10⁻⁹ b,c,d,e,f | 1.2 × 10⁻⁵ ± 9.6 × 10⁻⁷ d | 1.8 × 10⁻⁵ ± 1.8 × 10⁻⁶ a | 1.2 × 10⁻⁵ ± 1.3 × 10⁻⁷ b | 1.8 × 10⁻³ ± 1.5 × 10⁻⁴ b |
| Sona Masoori | 1.8 × 10⁻³ ± 2,0 × 10⁻⁴ c,d,e,f | 1.3 × 10⁻⁵ ± 2.0 × 10⁻⁷ d | 1.8 × 10⁻⁵ ± 2.3 × 10⁻⁶ a | 1.3 × 10⁻⁵ ± 1.6 × 10⁻⁶ b | 2.7 × 10⁻⁵ ± 2.1 × 10⁻⁶ a |
| Thaiperla | 2.0 × 10⁻³ ± 2.4 × 10⁻⁴ e,f | 8.7 × 10⁻⁶ ± 7.7 × 10⁻⁷ b,c | 1.8 × 10⁻⁵ ± 2.4 × 10⁻⁶ a | 8.7 × 10⁻⁶ ± 8.3 × 10⁻⁷ a,b | 1.7 × 10⁻⁵ ± 1.7 × 10⁻⁶ a |
| Al | Cd | Cr | Pb | As | |
|---|---|---|---|---|---|
| Barone | 59.41 ± 4.23 b,c,d,e,f | 47.99 ± 1.59 b,c | 34.85 ± 1.33 b,c | 47.90 ± 3.29 b,c | 36.71 ± 2.61 a,b |
| Basmati | 75.80 ± 3.05 e,f,g,h | 67.73 ± 1.99 e | 29.60 ± 1.93 a,b | 67.71 ± 2.24 e | 41.61 ± 4.25 a,b,c |
| Guadiamar | 52.47 ± 2.54 b,c,d | 45.12 ± 1.3 b,c | 44.47 ± 2.52 c,d | 45.12 ± 1.89 b | 36.28 ± 4.1 a,b |
| Hispamar | 28.43 ± 1.89 a | 28.60 ± 1.89 a | 76.95 ± 3.33 e | 28.63 ± 1.87 a | 50.16 ± 2.87 b,c,d |
| Jasmine | 67.95 ± 4.81 c,d,e,f,g,h | 59.97 ± 3.25 c,d,e | 33.42 ± 1.98 a,b,c | 59.97 ± 1.01 c,d,e | 31.61 ± 2.98 a |
| Marisma | 56.92 ± 4.01 b,c,d,e, | 50.18 ± 2.87 b,c,d | 49.93 ± 1.66 d | 50.11 ± 3.99 b,c,d,e | 66.20 ± 3.98 e |
| Memby | 65.54 ± 6.10 b,c,d,e,f,g | 48.41 ± 2.45 b,c,d | 51.64 ± 2.36 d | 48.42 ± 2.74 b,c | 66.24 ± 1.88 e |
| Perlado | 81.03 ± 4.54 g,h | 63.43 ± 2.96 d,e | 31.61 ± 2.98 a,b | 63.44 ± 1.79 d,e | 52.43 ± 2.54 c,d,e |
| Piñana | 59.67 ± 1.89 b,c,d,e,f | 43.19 ± 2.01 a,b | 54.80 ± 1.89 d | 43.96 ± 2.29 b | 43.99 ± 2.01 a,b,c |
| Puntal | 47.51 ± 1.99 a,b | 69.80 ± 1.25 e | 28.77 ± 0.98 a,b | 69.81 ± 1.55 e | 67.73 ± 1.99 e |
| Sendra | 72.02 ± 4.66,d,e,f,g,h | 66.25 ± 3.98 e | 30.26 ± 1.57 a,b | 66.20 ± 1.88 e | 34.80 ± 1.33 a,b |
| Sole | 78.46 ± 2.29 f,g,h | 66.80 ± 1.96 e | 37.42 ± 1.64,b.c | 66.88 ± 3.57 e | 59.94 ± 0.01 d,e |
| Sona Masoori | 87.60 ± 2.12 h | 74.41 ± 5.55 e | 22.45 ± 0.01 a | 74.45 ± 2.79 e | 47.92 ± 1.59 b,c,d |
| Thaiperla | 51.51 ± 2.22 b,c | 48.20 ± 1.98 b,c,d | 34.62 ± 0.99 b,c | 48.23 ± 3.31 b,c | 52.41 ± 2.54 c,d,e |
| Al | Cd | Cr | Pb | As | |
|---|---|---|---|---|---|
| Barone | 2.66 ± 0.19 a | 0.03 ± 0.001 a,b | 0.38 ± 0.0001 e | 0.03 ± 0.001 b | 0.07 ± 0.04 a |
| Basmati | 5.39 ± 0.29 b,c | 0.05 ± 0.001 c | 0.33 ± 0.001 d | 0.05 ± 0.002 d | 9.91 ± 4.45,b |
| Guadiamar | 2.70 ± 0.98 a | 0.03 ± 0.0002 a,b | 0.31 ± 0.02 c | 0.03 ± 0.02 b | 0.06 ± 0.03 a |
| Hispamar | 2.41 ± 0.14 a | 0.02 ± 0.01 a | 0.02 ± 0.0001 a | 0.02 ± 0.001 a | 0.04 ± 0.03 a |
| Jasmine | 6.84 ± 0.97c,d | 0.04 ± 0.002 b,c | 0.32 ± 0.02 c,d | 0.04 ± 0.002 c, | 0.08 ± 0.02 a |
| Marisma | 3.70 ± 0.21 a,b,c,d | 0.03 ± 0.001 a,b | 0.38 ± 0.0003 e | 0.03 ± 0.0001 b | 0.07 ± 0.03 a |
| Memby | 3.33 ± 0.16 a | 0.03 ± 0.001 a,b | 0.24 ± 0.001 b | 0.03 ± 0.002 b | 0.07 ± 0.02 a |
| Perlado | 5.26 ± 0.40 b,c | 0.04 ± 0.003 b,c | 0.25 ± 0.03 b | 0.04 ± 0.001c | 0.09 ± 0.06 a |
| Piñana | 2.85 ± 0.2 a | 0.03 ± 0.002 a,b | 0.31 ± 0.001 c | 0.03 ± 0.002 b | 0.06 ± 0.02 a |
| Puntal | 5.67 ± 0.39 c | 0.05 ± 0.003 c | 0.83 ± 0.05 g | 0.05 ± 0.002 d | 0.10 ± 0.09 a |
| Sendra | 5.32 ± 0.35 b,c | 0.05 ± 0.004 c | 0.32 ± 0.002 c,d | 0.05 ± 0.001 d | 0.09 ± 0.08 a |
| Sole | 8.54 ± 0.65 d | 0.05 ± 0.003 c | 0.33 ± 0.002 d | 0.05 ± 0.002 d | 0.09 ± 0.08 a |
| Sona Masoori | 7.01 ± 0.48 c,d | 0.05 ± 0.002 c | 0.40 ± 0.003 f | 0.05 ± 0.01 d | 0.10 ± 0.06 a |
| Thaiperla | 3.58 ± 0.26 a,b | 0.03 ± 0.002 a,b | 0.24 ± 0.001 b | 0.03 ± 0.001 b | 0.07 ± 0.04 a |
Publisher’s Note: MDPI stays neutral with regard to jurisdictional claims in published maps and institutional affiliations. |
© 2021 by the authors. Licensee MDPI, Basel, Switzerland. This article is an open access article distributed under the terms and conditions of the Creative Commons Attribution (CC BY) license (https://creativecommons.org/licenses/by/4.0/).
Share and Cite
Aguilera-Velázquez, J.R.; Carbonero-Aguilar, P.; Martín-Carrasco, I.; Hinojosa, M.G.; Moreno, I.; Bautista, J. Nutritional Quality of the Most Consumed Varieties of Raw and Cooked Rice in Spain Submitted to an In Vitro Digestion Model. Foods 2021, 10, 2584. https://doi.org/10.3390/foods10112584
Aguilera-Velázquez JR, Carbonero-Aguilar P, Martín-Carrasco I, Hinojosa MG, Moreno I, Bautista J. Nutritional Quality of the Most Consumed Varieties of Raw and Cooked Rice in Spain Submitted to an In Vitro Digestion Model. Foods. 2021; 10(11):2584. https://doi.org/10.3390/foods10112584
Chicago/Turabian StyleAguilera-Velázquez, José Raúl, Pilar Carbonero-Aguilar, Irene Martín-Carrasco, María Gracia Hinojosa, Isabel Moreno, and Juan Bautista. 2021. "Nutritional Quality of the Most Consumed Varieties of Raw and Cooked Rice in Spain Submitted to an In Vitro Digestion Model" Foods 10, no. 11: 2584. https://doi.org/10.3390/foods10112584
APA StyleAguilera-Velázquez, J. R., Carbonero-Aguilar, P., Martín-Carrasco, I., Hinojosa, M. G., Moreno, I., & Bautista, J. (2021). Nutritional Quality of the Most Consumed Varieties of Raw and Cooked Rice in Spain Submitted to an In Vitro Digestion Model. Foods, 10(11), 2584. https://doi.org/10.3390/foods10112584