
Effect of a Multistarter Yeast Inoculum on Ethanol Reduction and Population Dynamics in Wine Fermentation


Abstract
:
1. Introduction
2. Materials and Methods
2.1. Yeast Strains
2.2. Natural Must and Starter Cultures
2.3. Fermentation Trials in Natural Must
2.4. Colony Counting
2.5. PMAxx Treatment
2.6. DNA Extraction and qPCR Analysis
2.7. Chemical Analysis
2.8. Statistical Analysis
3. Results
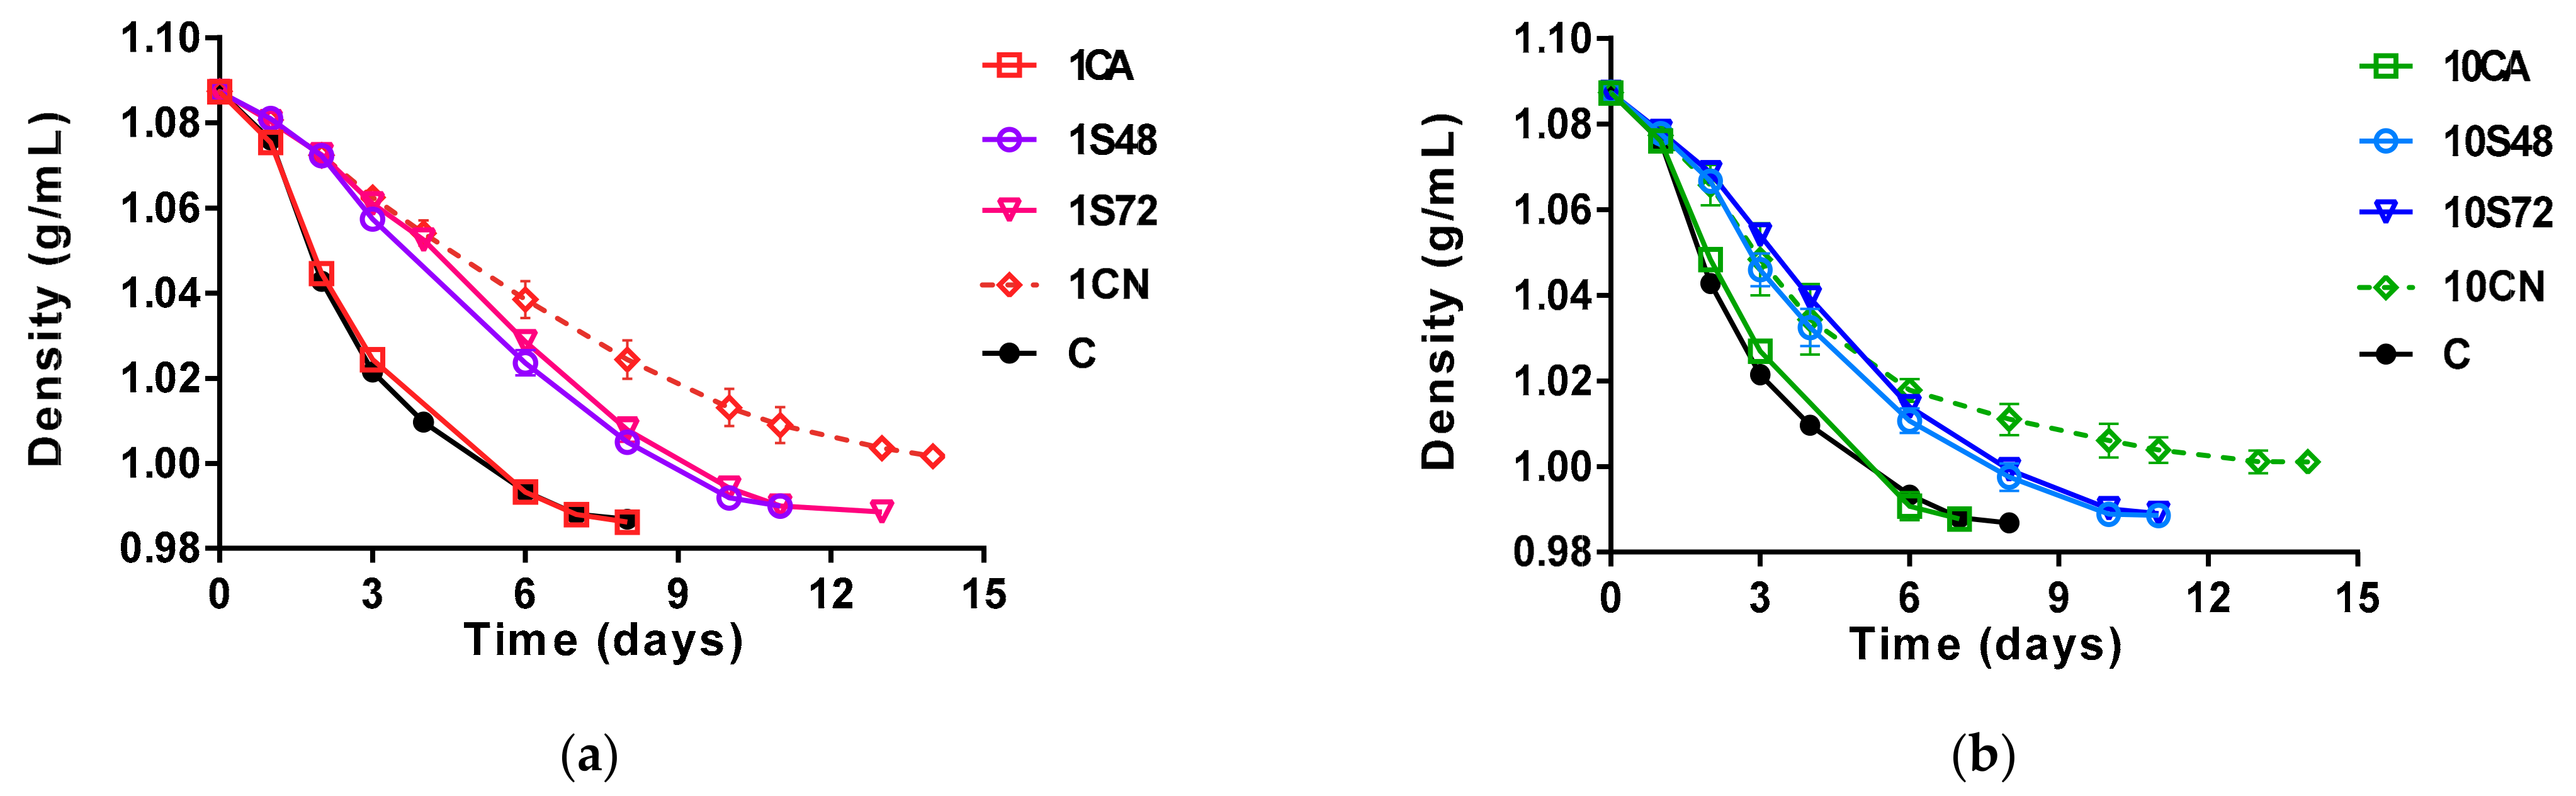
3.1. Fermentation Kinetics
3.2. Yeast Population Dynamics
3.3. Main Fermentation Byproducts
4. Discussion
Author Contributions
Funding
Data Availability Statement
Acknowledgments
Conflicts of Interest
Appendix A

| Target Species | Primer Name | Primer Sequence 5′-3′ | References |
|---|---|---|---|
| S. cerevisiae | CESP-F | ATCGAATTTTTGAACGCACATTG | Hierro et al. (2007) [28] |
| SCER-R | CGCAGAGAAACCTCTCTTTGGA | ||
| M. pulcherrima | MP2-F | AGACACTTAACTGGGCCAGC | García et al. (2017a) [38] |
| MP2-R | GGGGTGGTGTGGAAGTAAGG | ||
| T. delbrueckii | Tods L2 | CAAAGTCATCCAAGCCAGC | Zott et al. (2010) [39] |
| Tods R2 | TTCTCAAACAATCATGTTTGGTAG | ||
| Z. bailii | ZBF1 | CATGGTGTTTTGCGCC | Rawsthorne and Phister. (2006) [26] |
| ZBR1 | CGTCCGCCACGAAGTGGTAGA |
| Slope | Y-Intersection | R2 | Efficiency (%) | LoQ | LoD | |
|---|---|---|---|---|---|---|
| S. cerevisiae | −3.45 ± 0.04 | 40.38 ± 0.20 | 0.9985 | 94.80 | 103 | 10 |
| M. pulcherrima | −3.40 ± 0.03 | 43.51 ± 0.19 | 0.9991 | 97.01 | 104 | 102 |
| T. delbrueckii | −3.35 ± 0.04 | 40.02 ± 0.25 | 0.9978 | 98.83 | 103 | 10 |
| Z. bailii | −3.65 ± 0.03 | 41.81 ± 0.17 | 0.9986 | 87.92 | 103 | 10 |
| Days | Fermentation | Nitrogen (mg/L) | Added Nitrogen (mg/L) |
|---|---|---|---|
| 2nd day | 1S48 | 102 ± 5.66 | 0 |
| 10S48 | 79.67 ± 9.02 | 20 ± 5.50 | |
| 3rd day | 1S72 | 70.67 ± 13.05 | 31 ± 8.54 |
| 10S72 | 48 ± 5.29 | 53.33 ± 5.77 |
References
- Godden, P. Persistent Wine Instability Issues. Aust. Grapegrow. Winemak. 2000, 443, 10–14. [Google Scholar]
- Jones, G.V.; White, M.A.; Cooper, O.R.; Storchmann, K. Climate Change and Global Wine Quality. Clim. Chang. 2005, 73, 319–343. [Google Scholar] [CrossRef]
- Contreras, A.; Hidalgo, C.; Schmidt, S.; Henschke, P.; Curtin, C.; Varela, C. The application of non-Saccharomyces yeast in fermentations with limited aeration as a strategy for the production of wine with reduced alcohol content. Int. J. Food Microbiol. 2015, 205, 7–15. [Google Scholar] [CrossRef] [PubMed]
- Varela, C.; Dry, P.; Kutyna, D.; Francis, I.; Henschke, P.; Curtin, C.; Chambers, P. Strategies for reducing alcohol concentration in wine. Aust. J. Grape Wine Res. 2015, 21, 670–679. [Google Scholar] [CrossRef]
- García-Martín, N.; Perez-Magariño, S.; Ortega-Heras, M.; González-Huerta, C.; Mihnea, M.; González-Sanjosé, M.L.; Palacio, L.; Prádanos, P.; Hernández, A. Sugar reduction in musts with nanofiltration membranes to obtain low alcohol-content wines. Sep. Purif. Technol. 2010, 76, 158–170. [Google Scholar] [CrossRef]
- Bindon, K.; Varela, C.; Kennedy, J.; Holt, H.; Herderich, M. Relationships between harvest time and wine composition in Vitis vinifera L. cv. Cabernet Sauvignon 1. Grape and wine chemistry. Food Chem. 2013, 138, 1696–1705. [Google Scholar] [CrossRef] [PubMed]
- De Toda, F.M.; Sancha, J.; Balda, P. Reducing the Sugar and pH of the Grape (Vitis vinifera L. cvs. ‘Grenache’ and ‘Tempranillo’) Through a Single Shoot Trimming. S. Afr. J. Enol. Vitic. 2016, 34, 246–251. [Google Scholar] [CrossRef]
- Longo, R.; Blackman, J.W.; Torley, P.J.; Rogiers, S.Y.; Schmidtke, L.M. Changes in volatile composition and sensory attributes of wines during alcohol content reduction. J. Sci. Food Agric. 2016, 97, 8–16. [Google Scholar] [CrossRef]
- Padilla, B.; García-Fernández, D.; González, B.; Izidoro, I.; Esteve-Zarzoso, B.; Beltran, G.; Mas, A. Yeast Biodiversity from DOQ Priorat Uninoculated Fermentations. Front. Microbiol. 2016, 7, 930. [Google Scholar] [CrossRef] [PubMed] [Green Version]
- Varela, C.; Barker, A.; Tran, T.; Borneman, A.; Curtin, C. Sensory profile and volatile aroma composition of reduced alcohol Merlot wines fermented with Metschnikowia pulcherrima and Saccharomyces uvarum. Int. J. Food Microbiol. 2017, 252, 1–9. [Google Scholar] [CrossRef]
- Canonico, L.; Solomon, M.; Comitini, F.; Ciani, M.; Varela, C. Volatile profile of reduced alcohol wines fermented with selected non-Saccharomyces yeasts under different aeration conditions. Food Microbiol. 2019, 84, 103247. [Google Scholar] [CrossRef]
- Gobbi, M.; Comitini, F.; Domizio, P.; Romani, C.; Lencioni, L.; Mannazzu, I.; Ciani, M. Lachancea thermotolerans and Saccharomyces cerevisiae in simultaneous and sequential co-fermentation: A strategy to enhance acidity and improve the overall quality of wine. Food Microbiol. 2013, 33, 271–281. [Google Scholar] [CrossRef]
- Gobbi, M.; De Vero, L.; Solieri, L.; Comitini, F.; Oro, L.; Giudici, P.; Ciani, M. Fermentative aptitude of non-Saccharomyces wine yeast for reduction in the ethanol content in wine. Eur. Food Res. Technol. 2014, 239, 41–48. [Google Scholar] [CrossRef]
- Englezos, V.; Rantsiou, K.; Cravero, F.; Torchio, F.; Ortiz-Julien, A.; Gerbi, V.; Rolle, L.; Cocolin, L. Starmerella bacillaris and Saccharomyces cerevisiae mixed fermentations to reduce ethanol content in wine. Appl. Microbiol. Biotechnol. 2016, 100, 5515–5526. [Google Scholar] [CrossRef]
- Hranilovic, A.; Gambetta, J.M.; Jeffery, D.W.; Grbin, P.R.; Jiranek, V. Lower-alcohol wines produced by Metschnikowia pulcherrima and Saccharomyces cerevisiae co-fermentations: The effect of sequential inoculation timing. Int. J. Food Microbiol. 2020, 329, 108651. [Google Scholar] [CrossRef] [PubMed]
- Castrillo, D.; Rabuñal, E.; Neira, N.; Blanco, P. Oenological potential of non-Saccharomyces yeasts to mitigate effects of climate change in winemaking: Impact on aroma and sensory profiles of Treixadura wines. FEMS Yeast Res. 2019, 19, foz065. [Google Scholar] [CrossRef]
- Binati, R.L.; Junior, W.J.L.; Luzzini, G.; Slaghenaufi, D.; Ugliano, M.; Torriani, S. Contribution of non-Saccharomyces yeasts to wine volatile and sensory diversity: A study on Lachancea thermotolerans, Metschnikowia spp. and Starmerella bacillaris strains isolated in Italy. Int. J. Food Microbiol. 2020, 318, 108470. [Google Scholar] [CrossRef]
- Junior, W.J.F.L.; Nadai, C.; Crepalde, L.T.; de Oliveira, V.S.; de Matos, A.D.; Giacomini, A.; Corich, V. Potential use of Starmerella bacillaris as fermentation starter for the production of low-alcohol beverages obtained from unripe grapes. Int. J. Food Microbiol. 2019, 303, 1–8. [Google Scholar] [CrossRef] [PubMed]
- Furlani, M.V.M.; Maturano, Y.P.; Combina, M.; Mercado, L.A.; Toro, M.E.; Vazquez, F. Selection of non-Saccharomyces yeasts to be used in grape musts with high alcoholic potential: A strategy to obtain wines with reduced ethanol content. FEMS Yeast Res. 2017, 17, 1–11. [Google Scholar] [CrossRef] [Green Version]
- Morales, P.; Rojas, V.; Quirós, M.; Gonzalez, R. The impact of oxygen on the final alcohol content of wine fermented by a mixed starter culture. Appl. Microbiol. Biotechnol. 2015, 99, 3993–4003. [Google Scholar] [CrossRef] [PubMed] [Green Version]
- Comitini, F.; Gobbi, M.; Domizio, P.; Romani, C.; Lencioni, L.; Mannazzu, I.; Ciani, M. Selected non-Saccharomyces wine yeasts in controlled multistarter fermentations with Saccharomyces cerevisiae. Food Microbiol. 2011, 28, 873–882. [Google Scholar] [CrossRef]
- Ecanonico, L.; Ecomitini, F.; Eoro, L.; Eciani, M. Sequential Fermentation with Selected Immobilized Non-Saccharomyces Yeast for Reduction of Ethanol Content in Wine. Front. Microbiol. 2016, 7, 278. [Google Scholar] [CrossRef] [Green Version]
- Varela, C.; Sengler, F.; Solomon, M.; Curtin, C. Volatile flavour profile of reduced alcohol wines fermented with the non-conventional yeast species Metschnikowia pulcherrima and Saccharomyces uvarum. Food Chem. 2016, 209, 57–64. [Google Scholar] [CrossRef] [PubMed]
- Canonico, L.; Comitini, F.; Ciani, M. Metschnikowia pulcherrima Selected Strain for Ethanol Reduction in Wine: Influence of Cell Immobilization and Aeration Condition. Foods 2019, 8, 378. [Google Scholar] [CrossRef] [PubMed] [Green Version]
- Pallmann, C.L.; Brown, J.A.; Olineka, T.L.; Cocolin, L.; Mills, D.A.; Bisson, L.F. Use of WL medium to profile native flora fermentations. Am. J. Enol. Vitic. 2001 52, 198–203.
- Wang, C.; Mas, A.; Esteve-Zarzoso, B. The Interaction between Saccharomyces cerevisiae and Non-Saccharomyces Yeast during Alcoholic Fermentation Is Species and Strain Specific. Front. Microbiol. 2016, 7, 502. [Google Scholar] [CrossRef] [Green Version]
- Díaz, C.; Molina, A.M.; Nähring, J.; Fischer, R. Characterization and Dynamic Behavior of Wild Yeast during Spontaneous Wine Fermentation in Steel Tanks and Amphorae. BioMed Res. Int. 2013, 2013, 540465. [Google Scholar] [CrossRef] [Green Version]
- Phister, T.G.; Mills, D.A. Real-Time PCR Assay for Detection and Enumeration of Dekkera bruxellensis in Wine. Appl. Environ. Microbiol. 2003, 69, 7430–7434. [Google Scholar] [CrossRef] [Green Version]
- Rawsthorne, H.; Phister, T.G. A real-time PCR assay for the enumeration and detection of Zygosaccharomyces bailii from wine and fruit juices. Int. J. Food Microbiol. 2006, 112, 1–7. [Google Scholar] [CrossRef]
- Forootan, A.; Sjöback, R.; Björkman, J.; Sjögreen, B.; Linz, L.; Kubista, M. Methods to determine limit of detection and limit of quantification in quantitative real-time PCR (qPCR). Biomol. Detect. Quantif. 2017, 12, 1–6. [Google Scholar] [CrossRef]
- Hierro, N.; Esteve-Zarzoso, B.; Mas, A.; Guillamón, J.M. Monitoring of Saccharomyces and Hanseniaspora populations during alcoholic fermentation by real-time quantitative PCR. FEMS Yeast Res. 2007, 7, 1340–1349. [Google Scholar] [CrossRef] [Green Version]
- Padilla, B.; Zulian, L.; Ferreres, À; Pastor, R.; Esteve-Zarzoso, B.; Beltran, G.; Mas, A. Sequential Inoculation of Native Non-Saccharomyces and Saccharomyces cerevisiae Strains for Wine Making. Front. Microbiol. 2017, 8, 1293. [Google Scholar] [CrossRef]
- Nocker, A.; Cheung, C.-Y.; Camper, A.K. Comparison of propidium monoazide with ethidium monoazide for differentiation of live vs. dead bacteria by selective removal of DNA from dead cells. J. Microbiol. Methods 2006, 67, 310–320. [Google Scholar] [CrossRef]
- Andorrà, I.; Esteve-Zarzoso, B.; Guillamon, J.M.; Mas, A. Determination of viable wine yeast using DNA binding dyes and quantitative PCR. Int. J. Food Microbiol. 2010, 144, 257–262. [Google Scholar] [CrossRef] [PubMed]
- Fittipaldi, M.; Nocker, A.; Codony, F. Progress in understanding preferential detection of live cells using viability dyes in combination with DNA amplification. J. Microbiol. Methods 2012, 91, 276–289. [Google Scholar] [CrossRef]
- Vendrame, M.; Iacumin, L.; Manzano, M.; Comi, G. Use of propidium monoazide for the enumeration of viable Oenococcus oeni in must and wine by quantitative PCR. Food Microbiol. 2013, 35, 49–57. [Google Scholar] [CrossRef] [PubMed]
- Li, Y.; Yang, L.; Fu, J.; Yan, M.; Chen, D.; Zhang, L. The novel loop-mediated isothermal amplification based confirmation methodology on the bacteria in Viable but Non-Culturable (VBNC) state. Microb. Pathog. 2017, 111, 280–284. [Google Scholar] [CrossRef]
- Navarro, Y.; Torija, M.-J.; Mas, A.; Beltran, G. Viability-PCR Allows Monitoring Yeast Population Dynamics in Mixed Fermentations Including Viable but Non-Culturable Yeasts. Foods 2020, 9, 1373. [Google Scholar] [CrossRef] [PubMed]
- Zhu, X.; Navarro, Y.; Mas, A.; Torija, M.-J.; Beltran, G. A Rapid Method for Selecting Non-Saccharomyces Strains with a Low Ethanol Yield. Microorg. 2020, 8, 658. [Google Scholar] [CrossRef] [PubMed]
- Esteve-Zarzoso, B.; Belloch, C.; Uruburu, F.; Querol, A. Identification of yeasts by RFLP analysis of the 5.8S rRNA gene and the two ribosomal internal transcribed spacers. Int. J. Syst. Evol. Microbiol. 1999, 49, 329–337. [Google Scholar] [CrossRef] [Green Version]
- García, M.; Esteve-Zarzoso, B.; Crespo, J.; Cabellos, J.M.; Arroyo, T. Yeast Monitoring of Wine Mixed or Sequential Fermentations Made by Native Strains from D.O. “Vinos de Madrid” Using Real-Time Quantitative PCR. Front. Microbiol. 2017, 8, 2520. [Google Scholar] [CrossRef]
- Zott, K.; Claisse, O.; Lucas, P.; Coulon, J.; Lonvaud-Funel, A.; Masneuf-Pomarede, I. Characterization of the yeast ecosystem in grape must and wine using real-time PCR. Food Microbiol. 2010, 27, 559–567. [Google Scholar] [CrossRef] [PubMed]
- Quirós, M.; Gonzalez-Ramos, D.; Tabera, L.; Gonzalez, R. A new methodology to obtain wine yeast strains overproducing mannoproteins. Int. J. Food Microbiol. 2010, 139, 9–14. [Google Scholar] [CrossRef] [PubMed]
- Contreras, A.; Hidalgo, C.; Henschke, P.A.; Chambers, P.J.; Curtin, C.; Varela, C. Evaluation of Non-Saccharomyces Yeasts for the Reduction of Alcohol Content in Wine. Appl. Environ. Microbiol. 2014, 80, 1670–1678. [Google Scholar] [CrossRef] [Green Version]
- Quirós, M.; Rojas, V.; Gonzalez, R.; Morales, P. Selection of non-Saccharomyces yeast strains for reducing alcohol levels in wine by sugar respiration. Int. J. Food Microbiol. 2014, 181, 85–91. [Google Scholar] [CrossRef] [PubMed] [Green Version]
- Ciani, M.; Morales, P.; Comitini, F.; Tronchoni, J.; Canonico, L.; Curiel, J.A.; Oro, L.; Rodrigues, A.J.; Gonzalez, R. Non-conventional Yeast Species for Lowering Ethanol Content of Wines. Front. Microbiol. 2016, 7, 642. [Google Scholar] [CrossRef] [Green Version]
- Roca-Mesa, H.; Sendra, S.; Mas, A.; Beltran, G.; Torija, M.-J. Nitrogen Preferences during Alcoholic Fermentation of Different Non-Saccharomyces Yeasts of Oenological Interest. Microorganisms 2020, 8, 157. [Google Scholar] [CrossRef] [PubMed] [Green Version]
- Chen, D.; Liu, S.Q. Impact of simultaneous and sequential fermentation with Torulaspora delbrueckii and Saccharomyces cerevisiae on non-volatiles and volatiles of lychee wines. LWT 2016, 65, 53–61. [Google Scholar] [CrossRef]
- Canonico, L.; Comitini, F.; Ciani, M. Torulaspora delbrueckii contribution in mixed brewing fermentations with different Saccharomyces cerevisiae strains. Int. J. Food Microbiol. 2017, 259, 7–13. [Google Scholar] [CrossRef] [PubMed]
- Curiel, J.A.; Morales, P.; Gonzalez, R.; Tronchoni, J. Different Non-Saccharomyces Yeast Species Stimulate Nutrient Consumption in S. cerevisiae Mixed Cultures. Front. Microbiol. 2017, 8, 2121. [Google Scholar] [CrossRef] [PubMed]
- Tronchoni, J.; Curiel, J.A.; Morales, P.; Torres-Pérez, R.; Gonzalez, R. Early transcriptional response to biotic stress in mixed starter fermentations involving Saccharomyces cerevisiae and Torulaspora delbrueckii. Int. J. Food Microbiol. 2017, 241, 60–68. [Google Scholar] [CrossRef]
- Rollero, S.; Bloem, A.; Ortiz-Julien, A.; Camarasa, C.; Divol, B. Altered Fermentation Performances, Growth, and Metabolic Footprints Reveal Competition for Nutrients between Yeast Species Inoculated in Synthetic Grape Juice-Like Medium. Front. Microbiol. 2018, 9, 196. [Google Scholar] [CrossRef]
- Yap, N.; Lopes, M.D.B.; Langridge, P.; Henschke, P. The incidence of killer activity of non-Saccharomycesyeasts towards indigenous yeast species of grape must: Potential application in wine fermentation. J. Appl. Microbiol. 2000, 89, 381–389. [Google Scholar] [CrossRef]
- Branco, P.; Francisco, D.; Chambon, C.; Hébraud, M.; Arneborg, N.; Almeida, M.G.; Caldeira, J.; Albergaria, H. Identification of novel GAPDH-derived antimicrobial peptides secreted by Saccharomyces cerevisiae and involved in wine microbial interactions. Appl. Microbiol. Biotechnol. 2014, 98, 843–853. [Google Scholar] [CrossRef] [PubMed] [Green Version]
- Evelázquez, R.; Ezamora, E.; Álvarez, M.L.; Hernández, L.M.; Eramírez, M. Effects of new Torulaspora delbrueckii killer yeasts on the must fermentation kinetics and aroma compounds of white table wine. Front. Microbiol. 2015, 6, 1222. [Google Scholar] [CrossRef] [Green Version]
- Mencher, A.; Morales, P.; Valero, E.; Tronchoni, J.; Patil, K.R.; Gonzalez, R. Proteomic characterization of extracellular vesicles produced by several wine yeast species. Microb. Biotechnol. 2020, 13, 1581–1596. [Google Scholar] [CrossRef]
- Sadoudi, M.; Tourdot-Maréchal, R.; Rousseaux, S.; Steyer, D.; Gallardo-Chacón, J.-J.; Ballester, J.; Vichi, S.; Guérin-Schneider, R.; Caixach, J.; Alexandre, H. Yeast–yeast interactions revealed by aromatic profile analysis of Sauvignon Blanc wine fermented by single or co-culture of non-Saccharomyces and Saccharomyces yeasts. Food Microbiol. 2012, 32, 243–253. [Google Scholar] [CrossRef]
- Escribano-Viana, R.; González-Arenzana, L.; Portu, J.; Garijo, P.; López-Alfaro, I.; López, R.; Santamaría, P.; Gutiérrez, A.R. Wine aroma evolution throughout alcoholic fermentation sequentially inoculated with non- Saccharomyces/Saccharomyces yeasts. Food Res. Int. 2018, 112, 17–24. [Google Scholar] [CrossRef] [PubMed]
- Zironi, R.; Romano, P.; Suzzi, G.; Battistutta, F.; Comi, G. Volatile metabolites produced in wine by mixed and sequential cultures of Hanseniaspora guilliermondii or Kloeckera apiculata and Saccharomyces cerevisiae. Biotechnol. Lett. 1993, 15, 235–238. [Google Scholar] [CrossRef]
- Soden, A.; Francis, I.; Oakey, H.; Henschke, P. Effects of co-fermentation with Candida stellata and Saccharomyces cerevisiae on the aroma and composition of Chardonnay wine. Aust. J. Grape Wine Res. 2000, 6, 21–30. [Google Scholar] [CrossRef]
- Querol, A.; Fernández-Espinar, M.T.; Del Olmo, M.; Barrio, E. Adaptive evolution of wine yeast. Int. J. Food Microbiol. 2003, 86, 3–10. [Google Scholar] [CrossRef]
- Goddard, M.R. Quantifying the complexities ofsaccharomyces cerevisiae’s ecosystem engineering via fermentation. Ecology 2008, 89, 2077–2082. [Google Scholar] [CrossRef] [Green Version]
- Wang, C.; Mas, A.; Esteve-Zarzoso, B. Interaction between Hanseniaspora uvarum and Saccharomyces cerevisiae during alcoholic fermentation. Int. J. Food Microbiol. 2015, 206, 67–74. [Google Scholar] [CrossRef]
- Lleixà, J.; Manzano, M.; Mas, A.; Portillo, M.D.C. Saccharomyces and non-Saccharomyces Competition during Microvinification under Different Sugar and Nitrogen Conditions. Front. Microbiol. 2016, 7, 1959. [Google Scholar] [CrossRef]
- García, M.; Arroyo, T.; Crespo, J.; Cabellos, J.M.; Esteve-Zarzoso, B. Use of native non-Saccharomyces strain: A new strategy in D.O. Eur. J. Food Sci. Technol. 2017, 5, 1–31. [Google Scholar]
- Loira, I.; Morata, A.; Comuzzo, P.; Callejo, M.J.; González, C.; Calderón, F.; Suárez-Lepe, J.A. Use of Schizosaccharomyces pombe and Torulaspora delbrueckii strains in mixed and sequential fermentations to improve red wine sensory quality. Food Res. Int. 2015, 76, 325–333. [Google Scholar] [CrossRef] [PubMed]
- Ciani, M.; Beco, L.; Comitini, F. Fermentation behaviour and metabolic interactions of multistarter wine yeast fermentations. Int. J. Food Microbiol. 2006, 108, 239–245. [Google Scholar] [CrossRef]
- Medina, K.; Boido, E.; Dellacassa, E.; Carrau, F. Growth of non-Saccharomyces yeasts affects nutrient availability for Saccharomyces cerevisiae during wine fermentation. Int. J. Food Microbiol. 2012, 157, 245–250. [Google Scholar] [CrossRef] [PubMed]
- Taillandier, P.; Lai, Q.P.; Julien-Ortiz, A.; Brandam, C. Interactions between Torulaspora delbrueckii and Saccharomyces cerevisiae in wine fermentation: Influence of inoculation and nitrogen content. World J. Microbiol. Biotechnol. 2014, 30, 1959–1967. [Google Scholar] [CrossRef] [PubMed] [Green Version]
- Chambers, P.; Borneman, A.; Varela, C.; Cordente, A.; Bellon, J.; Tran, T.; Henschke, P.; Curtin, C. Ongoing domestication of wine yeast: Past, present and future. Aust. J. Grape Wine Res. 2015, 21, 642–650. [Google Scholar] [CrossRef]
- Cavazza, A.; Poznanski, E.; Guzzon, R. Must treatments and wild yeast growth before and during alcoholic fermentation. Ann. Microbiol. 2010, 61, 41–48. [Google Scholar] [CrossRef]
- Andorrà, I.; Landi, S.; Mas, A.; Esteve-Zarzoso, B.; Guillamon, J.M. Effect of fermentation temperature on microbial population evolution using culture-independent and dependent techniques. Food Res. Int. 2010, 43, 773–779. [Google Scholar] [CrossRef]
- Vendrame, M.; Manzano, M.; Comi, G.; Bertrand, J.; Iacumin, L. Use of propidium monoazide for the enumeration of viable Brettanomyces bruxellensis in wine and beer by quantitative PCR. Food Microbiol. 2014, 42, 196–204. [Google Scholar] [CrossRef] [PubMed]
- Andorrà, I.; Monteiro, M.; Esteve-Zarzoso, B.; Albergaria, H.; Mas, A. Analysis and direct quantification of Saccharomyces cerevisiae and Hanseniaspora guilliermondii populations during alcoholic fermentation by fluorescence in situ hybridization, flow cytometry and quantitative PCR. Food Microbiol. 2011, 28, 1483–1491. [Google Scholar] [CrossRef]
- Vázquez, J.; Grillitsch, K.; Daum, G.; Mas, A.; Beltran, G.; Torija, M.J. The role of the membrane lipid composition in the oxidative stress tolerance of different wine yeasts. Food Microbiol. 2019, 78, 143–154. [Google Scholar] [CrossRef]
- Pérez-Torrado, R.; Carrasco, P.; Aranda, A.; Gimeno-Alcañiz, J.; Pérez-Ortín, J.E.; Matallana, E.; Del Olmo, M.L. Study of the First Hours of Microvinification by the Use of Osmotic Stress-response Genes as Probes. Syst. Appl. Microbiol. 2002, 25, 153–161. [Google Scholar] [CrossRef] [PubMed]
- Contreras, A.; Curtin, C.; Varela, C. Yeast population dynamics reveal a potential ‘collaboration’ between Metschnikowia pulcherrima and Saccharomyces uvarum for the production of reduced alcohol wines during Shiraz fermentation. Appl. Microbiol. Biotechnol. 2014, 99, 1885–1895. [Google Scholar] [CrossRef]
- Seguinot, P.; Ortiz-Julien, A.; Camarasa, C. Impact of Nutrient Availability on the Fermentation and Production of Aroma Compounds Under Sequential Inoculation With M. pulcherrima and S. cerevisiae. Front. Microbiol. 2020, 11, 305. [Google Scholar] [CrossRef] [PubMed]
- Maturano, Y.P.; Mestre, M.V.; Kuchen, B.; Toro, M.E.; Mercado, L.A.; Vazquez, F.; Combina, M. Optimization of fermentation-relevant factors: A strategy to reduce ethanol in red wine by sequential culture of native yeasts. Int. J. Food Microbiol. 2019, 289, 40–48. [Google Scholar] [CrossRef]
- Minebois, R.; Pérez-Torrado, R.; Querol, A. A time course metabolism comparison among Saccharomyces cerevisiae, S. uvarum and S. kudriavzevii species in wine fermentation. Food Microbiol. 2020, 90, 103484. [Google Scholar] [CrossRef] [PubMed]
- Röcker, J.; Strub, S.; Ebert, K.; Grossmann, M. Usage of different aerobic non-Saccharomyces yeasts and experimental conditions as a tool for reducing the potential ethanol content in wines. Eur. Food Res. Technol. 2016, 242, 2051–2070. [Google Scholar] [CrossRef]
- Rodrigues, A.J.; Raimbourg, T.; Gonzalez, R.; Morales, P. Environmental factors influencing the efficacy of different yeast strains for alcohol level reduction in wine by respiration. LWT 2016, 65, 1038–1043. [Google Scholar] [CrossRef]
- Gonzalez, R.; Quirós, M.; Morales, P. Yeast respiration of sugars by non-Saccharomyces yeast species: A promising and barely explored approach to lowering alcohol content of wines. Trends Food Sci. Technol. 2013, 29, 55–61. [Google Scholar] [CrossRef]
- Magyar, I.; Tóth, T. Comparative evaluation of some oenological properties in wine strains of Candida stellata, Candida zemplinina, Saccharomyces uvarum and Saccharomyces cerevisiae. Food Microbiol. 2011, 28, 94–100. [Google Scholar] [CrossRef]
- Tronchoni, J.; Curiel, J.A.; Sáenz-Navajas, M.P.; Morales, P.; Blanco, A.D.L.F.; Fernández-Zurbano, P.; Ferreira, V.; Gonzalez, R. Aroma profiling of an aerated fermentation of natural grape must with selected yeast strains at pilot scale. Food Microbiol. 2018, 70, 214–223. [Google Scholar] [CrossRef] [PubMed]
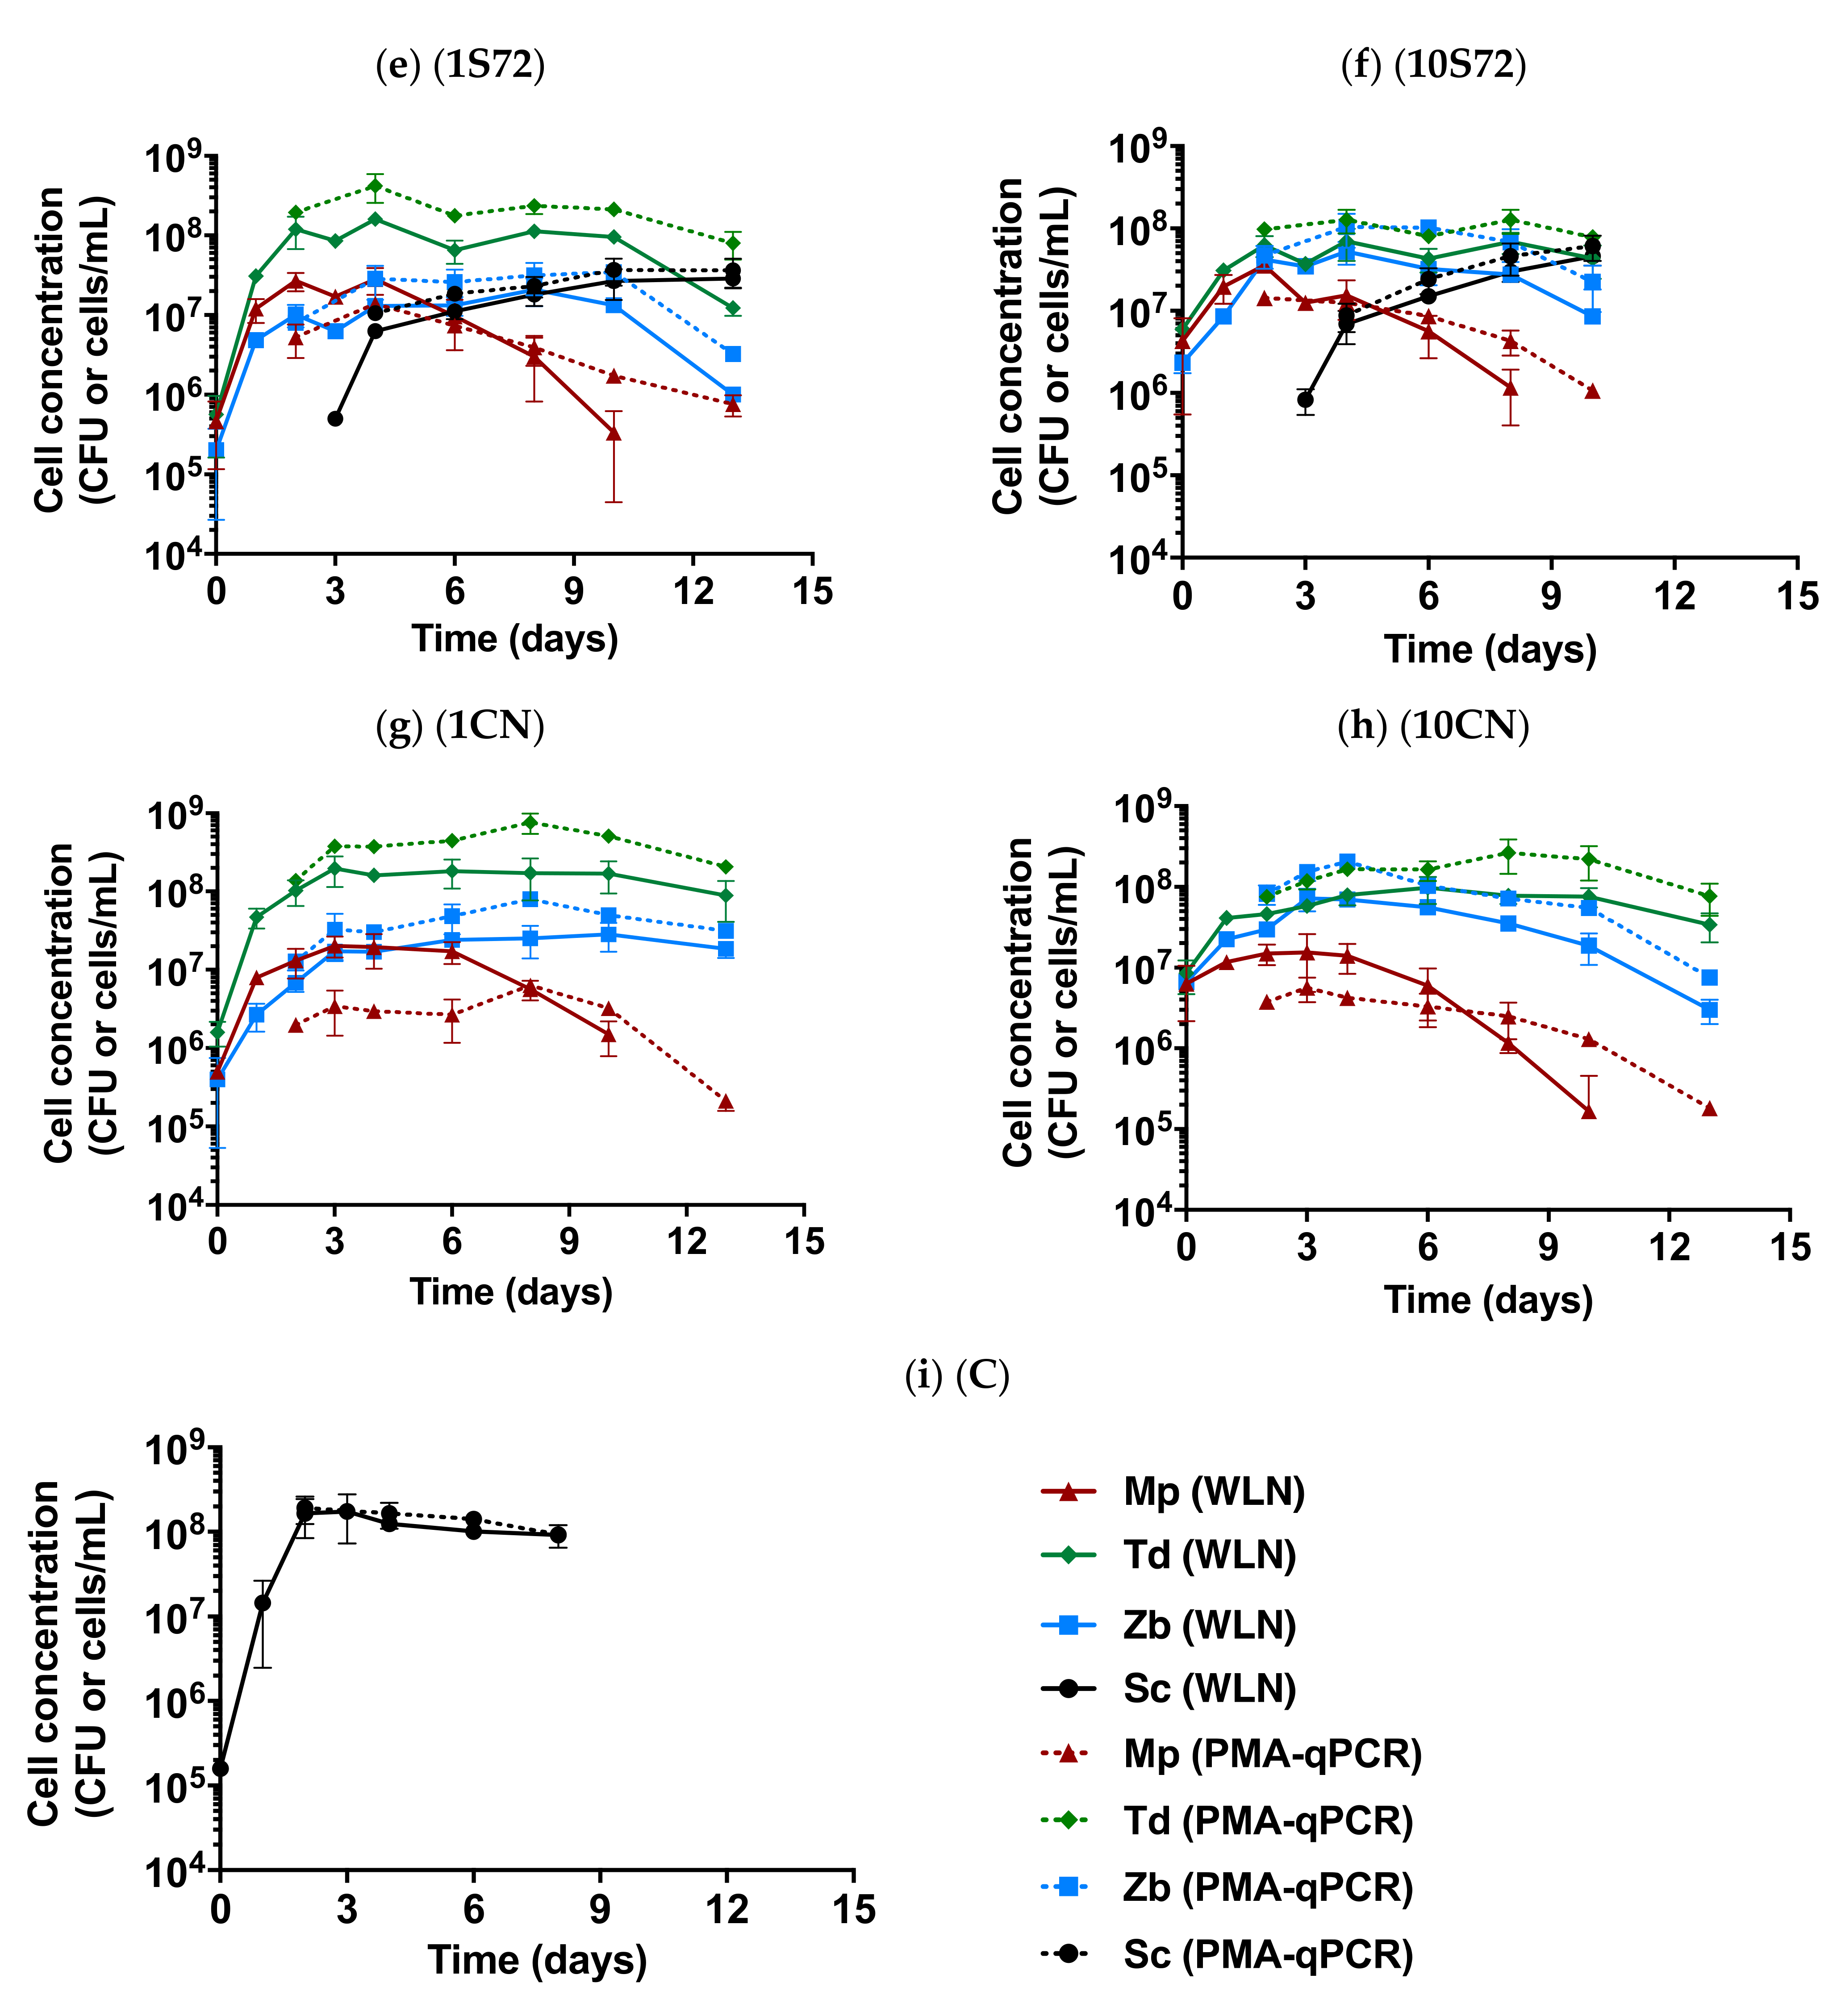
 ) and qPCR with PMAxx treatment (dotted lines
  ), determined in the different fermentative conditions: non-Saccharomyces multistarter coinoculated with (a,b) and without (g,h) S. cerevisaie (Sc); non-Saccharomyces multistarter with sequential inoculation of Sc at 48 h (c,d) or 72 h (e,f) and the single Sc fermentations (i). The initial non-Saccharomyces inoculum size was 106 cells/mL (a,c,e,g) and 107 cells/mL (b,d,f,h). Each species is shown in different colors (Mp in red, Td in green, Zb in blue and Sc in black).
) and qPCR with PMAxx treatment (dotted lines ), determined in the different fermentative conditions: non-Saccharomyces multistarter coinoculated with (a,b) and without (g,h) S. cerevisaie (Sc); non-Saccharomyces multistarter with sequential inoculation of Sc at 48 h (c,d) or 72 h (e,f) and the single Sc fermentations (i). The initial non-Saccharomyces inoculum size was 106 cells/mL (a,c,e,g) and 107 cells/mL (b,d,f,h). Each species is shown in different colors (Mp in red, Td in green, Zb in blue and Sc in black).
), determined in the different fermentative conditions: non-Saccharomyces multistarter coinoculated with (a,b) and without (g,h) S. cerevisaie (Sc); non-Saccharomyces multistarter with sequential inoculation of Sc at 48 h (c,d) or 72 h (e,f) and the single Sc fermentations (i). The initial non-Saccharomyces inoculum size was 106 cells/mL (a,c,e,g) and 107 cells/mL (b,d,f,h). Each species is shown in different colors (Mp in red, Td in green, Zb in blue and Sc in black).
) and qPCR with PMAxx treatment (dotted lines ), determined in the different fermentative conditions: non-Saccharomyces multistarter coinoculated with (a,b) and without (g,h) S. cerevisaie (Sc); non-Saccharomyces multistarter with sequential inoculation of Sc at 48 h (c,d) or 72 h (e,f) and the single Sc fermentations (i). The initial non-Saccharomyces inoculum size was 106 cells/mL (a,c,e,g) and 107 cells/mL (b,d,f,h). Each species is shown in different colors (Mp in red, Td in green, Zb in blue and Sc in black).
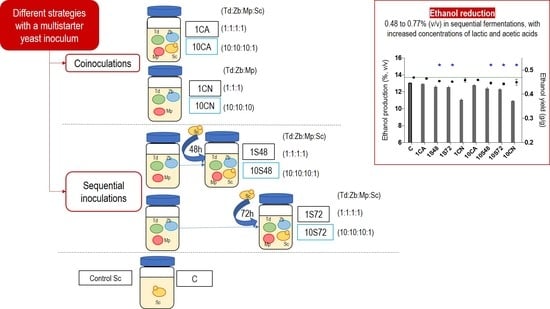
| Fermentations | Inoculum Procedures | Inoculum Ratios (Mp:Td:Zb:Sc) | Mp | Td | Zb | Sc |
|---|---|---|---|---|---|---|
| 1CA | Co-inoculation of all strains | 1:1:1:1 | 1 × 10⁶ | 1 × 10⁶ | 1 × 10⁶ | 1 × 10⁶ |
| 1S48 | Sequential inoculation of Sc at 48 h | 1:1:1:1 | 1 × 10⁶ | 1 × 10⁶ | 1 × 10⁶ | 1 × 10⁶ |
| 1S72 | Sequential inoculation of Sc at 72 h | 1:1:1:1 | 1 × 10⁶ | 1 × 10⁶ | 1 × 10⁶ | 1 × 10⁶ |
| 1CN | Co-inoculation of non-Saccharomyces strains | 1:1:1:0 | 1 × 10⁶ | 1 × 10⁶ | 1 × 10⁶ | |
| 10CA | Co-inoculation of all strains | 10:10:10:1 | 1 × 10⁷ | 1 × 10⁷ | 1 × 10⁷ | 1 × 10⁶ |
| 10S48 | Sequential inoculation of Sc at 48 h | 10:10:10:1 | 1 × 10⁷ | 1 × 10⁷ | 1 × 10⁷ | 1 × 10⁶ |
| 10S72 | Sequential inoculation of Sc at 72 h | 10:10:10:1 | 1 × 10⁷ | 1 × 10⁷ | 1 × 10⁷ | 1 × 10⁶ |
| 10CN | Co-inoculation of non- Saccharomyces strains | 10:10:10:0 | 1 × 10⁷ | 1 × 10⁷ | 1 × 10⁷ | |
| C | Single inoculation of Sc | 1 × 10⁶ |
| Compounds | C | 1CA | 1S48 | 1S72 | 1CN | 10CA | 10S48 | 10S72 | 10CN |
|---|---|---|---|---|---|---|---|---|---|
| Residual sugars (g/L) | 0.13 ± 0.17 | 0.39 ± 0.29 | 1.22 ± 0.62 | 0.42 ± 0.57 | 29.61 ± 5.65 * | 0.42 ± 0.41 | 0.37 ± 0.22 | 0.88 ± 1.03 | 28.30 ± 6.29 * |
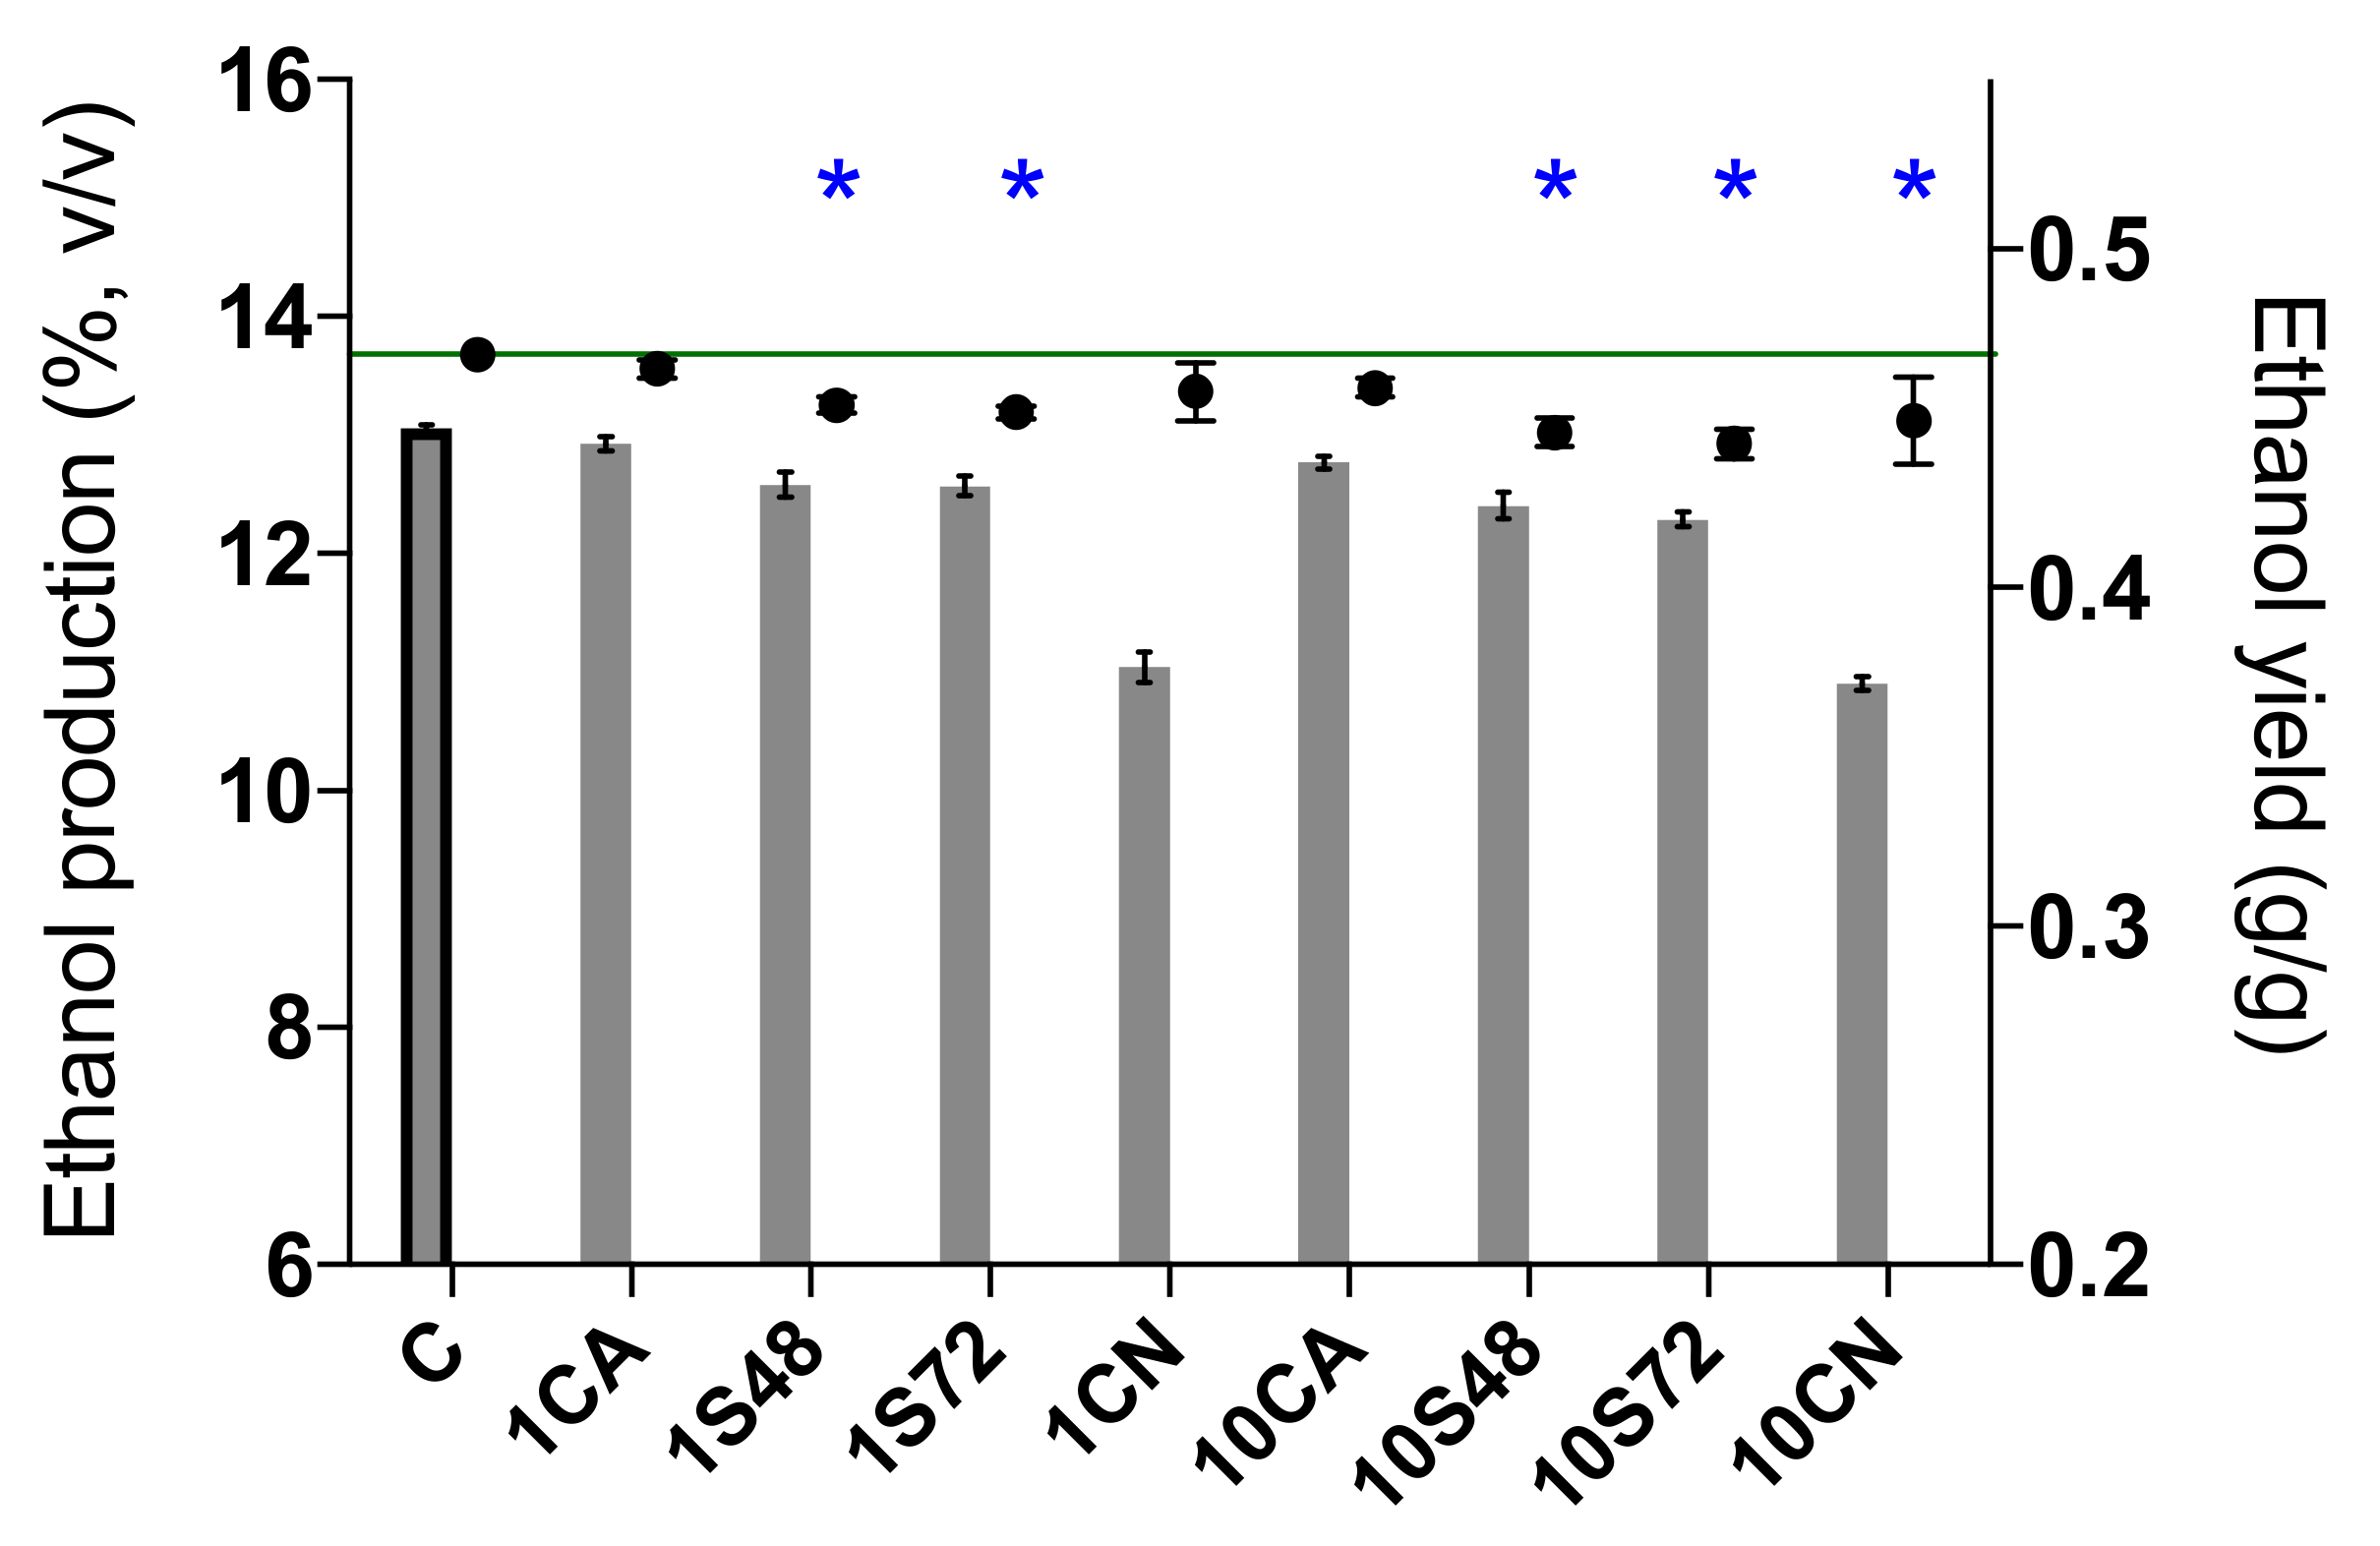
| Ethanol production (%, v/v) | 13.06 ± 0.03 | 12.93 ± 0.06 | 12.58 ± 0.10 * | 12.57 ± 0.08 * | 11.04 ± 0.13 * | 12.77 ± 0.05 * | 12.41 ± 0.11 * | 12.29 ± 0.06 * | 10.91 ± 0.06 * |
| Ethanol yield (g/g) | 0.47 ± 0 | 0.46 ± 0 | 0.45 ± 0 * | 0.45 ± 0 * | 0.46 ± 0.01 | 0.46 ± 0 | 0.45 ± 0 * | 0.44 ± 0 * | 0.45 ± 0.01 * |
| Ethanol reduction (%, v/v) | 0 | 0.13 ± 0.06 | 0.48 ± 0.10 * | 0.49 ± 0.08 * | NC | 0.29 ± 0.05 * | 0.65 ± 0.11 * | 0.77 ± 0.06 * | NC |
| Glycerol (g/L) | 6.57 ± 0.08 | 6.57 ± 0.22 | 5.41 ± 0.75 * | 5.74 ± 0.93 | 4.96 ± 0.41 * | 6.23 ± 0.11 | 6.70 ± 0.48 | 6.38 ± 0.18 | 5.44 ± 0.68 * |
| Citric acid (g/L) | 0.13 ± 0 | 0.13 ± 0 | 0.11 ± 0.01 * | 0.12 ± 0.01 * | 0.12 ± 0 * | 0.12 ± 0.01 * | 0.12 ± 0.01 * | 0.11 ± 0 * | 0.11 ± 0 * |
| Tartaric acid (g/L) | 2.79 ± 0.07 | 3.10 ± 0.14 | 3.41 ± 0.38 | 3.30 ± 0.31 | 3.38 ± 0.34 | 2.47 ± 1.10 | 3.23 ± 0.25 | 3.44 ± 0.14 | 3.38 ± 0.28 |
| Malic acid (g/L) | 0.81 ± 0.13 | 0.63 ± 0.05 * | 0.50 ± 0.03 * | 0.45 ± 0.03 * | 0.39 ± 0.03 * | 0.61 ± 0.02 * | 0.54 ± 0.03 * | 0.51 ± 0.01 * | 0.44 ± 0.02 * |
| Succinic acid (g/L) | 0.44 ± 0 | 0.43 ± 0.05 | 0.40 ± 0.05 | 0.36 ± 0.05 | 0.37 ± 0.02 | 0.44 ± 0.06 | 0.52 ± 0.03 | 0.52 ± 0.02 | 0.67 ± 0.05 * |
| Lactic acid (g/L) | 0.20 ± 0.03 | 0.24 ± 0.02 | 0.24 ± 0.01 | 0.30 ± 0.10 * | 0.29 ± 0.01 * | 0.23 ± 0.05 | 0.30 ± 0 * | 0.33 ± 0.04 * | 0.25 ± 0.03 |
| Acetic acid (g/L) | 0.10 ± 0.01 | 0.14 ± 0.03 | 0.29 ± 0.08 * | 0.36 ± 0.05 * | 0.32 ± 0.06 * | 0.22 ± 0.05 * | 0.23 ± 0.05 * | 0.22 ± 0.08 * | 0.21 ± 0.04 * |
Publisher’s Note: MDPI stays neutral with regard to jurisdictional claims in published maps and institutional affiliations. |
© 2021 by the authors. Licensee MDPI, Basel, Switzerland. This article is an open access article distributed under the terms and conditions of the Creative Commons Attribution (CC BY) license (http://creativecommons.org/licenses/by/4.0/).
Share and Cite
Zhu, X.; Torija, M.-J.; Mas, A.; Beltran, G.; Navarro, Y. Effect of a Multistarter Yeast Inoculum on Ethanol Reduction and Population Dynamics in Wine Fermentation. Foods 2021, 10, 623. https://doi.org/10.3390/foods10030623
Zhu X, Torija M-J, Mas A, Beltran G, Navarro Y. Effect of a Multistarter Yeast Inoculum on Ethanol Reduction and Population Dynamics in Wine Fermentation. Foods. 2021; 10(3):623. https://doi.org/10.3390/foods10030623
Chicago/Turabian StyleZhu, Xiaolin, María-Jesús Torija, Albert Mas, Gemma Beltran, and Yurena Navarro. 2021. "Effect of a Multistarter Yeast Inoculum on Ethanol Reduction and Population Dynamics in Wine Fermentation" Foods 10, no. 3: 623. https://doi.org/10.3390/foods10030623