Abstract
In this work, essential oils (EOs) and hydrolates (Hys) of Rosmarinus officinalis L. and Lavandula angustifolia Mill., grown in Tuscany (Italy), were studied to describe their chemical composition and biological activities. The aromatic profile of the EOs liquid phase was carried out by gas chromatography–mass spectrometry (GC–MS), while the volatile composition of vapor phase EOs and Hys was performed by headspace (HS)/GC–MS. The obtained results show that monoterpene hydrocarbons (71.5% and 89.5%) were the main compounds, followed by oxygenated monoterpenes (26.0% and 10.5%) in the liquid and vapor phase of R. officinalis EO, respectively. The oxygenated monoterpenes were the main components of L. angustifolia EO, reaching 86.9% in the liquid phase and 53.7% in the vapor phase. Regarding Hys, they consisted only of oxygenated monoterpenes, and 1,8-cineole (56.2%) and linalool (42.9%), were the main components of R. officinalis and L. officinalis Hys, respectively. Their cytotoxicity was investigated on an SHSY5Y neuroblastoma cell line by thiazolyl blue tetrazolium bromide (MTT) test, showing a notable effect of the EOs with a time-independent manner of activity and half maximal effective concentration (EC50) values quite similar for the two plant species (from 0.05% to 0.06% v/v for the three time points evaluated). A measurable activity of Hys was also obtained although with higher EC50 values. The antibacterial activity against Escherichia coli ATCC® 25922, Pseudomonas fluorescens ATCC® 13525, Acinetobacter bohemicus DSM 102855 as Gram-negative bacteria and Kocuria marina DSM 16420, Bacillus cereus ATCC® 10876 as Gram-positive bacteria, was evaluated by the agar disk-diffusion method and the VPT (vapor phase test) to determinate the MIC (minimal inhibitory concentration) and the MBC (minimal bactericidal concentration) values. Both EOs possessed a high activity against all the bacterial strains with MIC values ranging from 0.19% to 3.13% v/v. Unlike EOs, Hys did not show an inhibition of the bacterial growth at the tested concentrations. Furthermore, antioxidant power was measured by 2,2′-azino-bis (3-ethylbenzothiazoline-6-sulfonic acid) diammonium salt-based (ABTS•+) and the 2,2-diphenyl-1-picrylhydrazyl (DPPH) assays, showing a remarkable ability to reduce radicals by both EOs; Hys were slightly less active. The findings highlighted that R. officinalis and L. angustifolia EOs and Hys have a chemical composition rich in bioactive molecules, which can exert different biological activities.
1. Introduction
Since historic times, spices and herbs have been used as food flavors, and their effects on human health are still being investigated to understand the roles of their chemical components [1,2]. Rosmarinus officinalis L. (also known as Salvia rosmarinus Schleid) and Lavandula angustifolia Mill. belong to the Lamiaceae family, which comprises different genera whose biological activities are used in traditional medicines all over the world [3,4,5,6]. Rosemary, native to the Mediterranean area, is a shrubby plant up to 1.8 m tall, erect or procumbent with a good aromatic scent due to the glandular hairs that emit volatile essential oils [7]. This plant is widely used in cosmetic preparations to protect from degradation and absorbing UV light, is used as a bactericidal and antifungal agent and furthermore, among others, was exploited in topical applications for wound healing, skin cancer and antimycotic properties [5,7]. Different uses of R. officinalis are known and its volatile essential oil (EO) and leaf extracts possess extensively investigated biological properties, such as antioxidant, anti-inflammatory, antiproliferative, anticancer, antiviral, antimicrobial, hepatoprotective, neuroprotective, nephroprotective, antiulcer and many others [8]. R. officinalis was investigated for its curative properties against some ailments caused by biochemical, chemical or biological agents as reviewed by Oliviera et al. [9], showing that this plant possesses beneficial effects and may be used to treat health problems. English or “true” lavender, the common names of Lavandula angustifolia, is one of the 39 species of the genus Lavandula to which belongs different hybrids [10]. Lavender EO production and quality is regulated by environmental and developmental conditions and temperature and flowering stage determine its chemical composition [11]. L. angustifolia EO is used in perfumery and cosmetics and its activity on the central nervous system, as a sedative, anxiolytic and antidepressant, was also evidenced [12,13,14]. Furthermore, biological activities of EOs from Lavandula genus, such as antifungal, antibacterial, antioxidant and anticancer effects, were reported [15,16,17,18,19,20]. EO chemical composition is highly complex and it can vary considerably depending on several factors, such as the cultivation area, environmental conditions, morphological characteristics and processing techniques of the plant [21,22,23]; moreover, the chemical composition influences the way in which EOs exert their antibacterial activity [24]. Terpene and sesquiterpene hydrocarbons, oxygenated or cyclic, are the main classes of compounds present in EOs, followed by aldehydes, ketones, alcohols, acids and esters [25]. In particular, thanks to their interesting physicochemical characteristics, Lamiaceae EOs were employed in the industrial and medical research sectors as natural products [26]. EOs obtained from L. angustifolia and R. officinalis grown in different countries such as China, Siria, India, Iran, Romania, Canada, Spain, France and others were investigated and linalool, borneol, linalyl acetate and 1,8-cineole as well as camphor, camphene and α-pinene resulted as predominant compounds, although in different proportions according to the vegetative stage and climatic conditions of the origin area [27,28]. There are far fewer studies concerning the volatile chemical composition of hydrolates (Hys), also known as hydrosols. They are aqueous solutions obtained as by-products of distillation [29] containing a certain number of bioactive molecules, although with marked quantitative and qualitative differences compared to EOs [30]. Their aroma can be more or less intense depending on their content of molecules that provide a potential biological effect, making the hydrolates useful for the food industry as preserving and/or aromatic agents [31]. In this study, for the first time, to better describe the vapor phase chemical profiles of Hys and EOs obtained from flowers and inflorescences of R. officinalis and inflorescences of L. angustifolia growing in Tuscany, we used the automated headspace sampler directly coupled with gas chromatography–mass spectrometry (HS/GC–MS) [32,33]. This sampling technique is conservative and non-destructive and does not require the use of solvent for the extraction process, thus avoiding a possible loss of components. The chemical composition of the liquid phase of EOs was also characterized by GC/MS and their antiproliferative, antibacterial and antioxidant activity was evaluated. Moreover, this is the first report revealing the biological activity of the vapor phase and the cytotoxic activity against a neuroblastoma cell line of Lavandula angustifolia and Rosmarinus officinalis Hys.
2. Materials and Methods
2.1. Materials
EOs and Hys from flowers and inflorescences of R. officinalis L. and inflorescences of L. angustifolia Mill. growing in Tuscany (San Donato in Poggio and Roccastrada, respectively), Italy and obtained by steam distillation, were directly provided by “èssenziale” Azienda Agricola, San Donato in Poggio (FI), Italy. The dates of collection of plants were: June 2020 for R. officinalis and July 2020 for L. angustifolia. Lysogeny Broth (LB) with agar, thiazolyl blue tetrazolium bromide (MTT), vinblastine sulfate, methanol, 2,2-diphenyl-1-picrylhydrazyl (DPPH), 6-hydroxy-2,5,7,8-tetramethylchroman-2-carboxylic acid (Trolox), 2,2′-azinobis (3-ethylbenzothiazoline-6-sulfonic acid) diammonium salt (ABTS) and potassium persulfate (K2S2O8) were from Merck (Darmstadt, Germany). Gentamicin sulfate was bought from Biochrom PAN-Bio-Tech GmbH (Aidenbach, Germany).
2.2. GC–FID and GC–MS Analysis
The GC–MS analyses were performed with a gas chromatograph equipped with a flame ionization detector (FID) and coupled to a mass spectrometer (MS), Perkin Elmer Clarus 500 model (Waltham, MA, USA). The GC capillary column was a Varian Factor Four VF-1 and helium served as a carrier gas at a flow rate of 1 mL/min. The injector temperature was 280 °C and the oven temperature program started from 60 up to 220 °C for 20 min at a rate of 6 °C min−1. For liquid injections, the solutions were prepared by diluting 1 μL of each EO with 1 mL of methanol and 1 μL of the sample was injected. MS operative conditions were: ionization voltage of 70 eV and acquisition mass range 40–450. Ion source and the connection parts temperature was 220 °C. The GC–TIC mass spectra were obtained by the TurboMass data analysis software (Perkin Elmer-Vers. 6.1.0). The identification of components was performed by matching their mass spectra with the spectrometer database of the NIST and Wiley libraries and comparison of their linear retention indices (LRIs) calculated against a mixture of n-alkanes (C8–C30). The relative average percentages of compounds were calculated by peak area normalization from GC–FID chromatograms without the use of an internal standard or correction factors. All analyses were conducted in triplicate.
2.3. HS/GC–FID and HS/GC–MS Analysis
To describe the vapor phase profile of EOs and Hys, a Perkin-Elmer Headspace (HS) Turbomatrix 40 (Waltham, MA, USA) autosampler connected to GC–MS was used [34,35]. About 1 mL of EO and 2 mL of Hy were placed separately in 20 mL vials sealed with headspace (PolyTetrafluoroethylene-PTFE)-coated silicone rubber septa and caps. The operative optimized conditions were: the sample was heated at 60 (EOs) and 80 °C (Hys) for 20 min thermostating time and an injection volume of about 10 mL (vapor phase) was sent to the capillary column of GC by a transfer line maintained at 200 °C. Quantification and identification of compounds was carried out by GC–FID and GC–MS analyses.
2.4. Cell Culturing
To assess the biological activity of the examined EOs and related Hys, human neuroblastoma SHSY5Y (ATCC® CRL-2266™) cell lines were used. The cells were maintained in a 75 cm2 flask containing DMEM-F12 (Dulbecco’s modified Eagle’s medium: nutrient mixture F-12) culture medium supplemented with 10% of FBS (fetal bovine serum), 1% glutamine and 1% penicillin/streptomycin, and maintained at 37 °C with 5% CO2 and controlled humidity. Once the cells reached confluence, they were passed into new culture vessels in a 1:20 ratio and the medium was changed every 3 days.
2.5. Cytotoxicity Test (MTT)
The cell viability of SHSY5Y cells treated with R. officinalis and L. angustifolia EOs and Hys was evaluated by MTT assay. The mitochondrial dehydrogenase activity of the control and treated cells, which reflects their cell viability, was analyzed both in a dose- and time-dependent manner. A total of 2 × 10⁴ cells/well were seeded in a 96-well plate 24 h before being treated. EOs were dissolved in Dimethyl Sulfoxide (DMSO) (50% v/v). Twelve two-fold diluted concentrations were applied from 1 × 10⁻¹% to 2 × 10⁻⁴% v/v for the EOs and from 50% to 1 × 10⁻¹% v/v for the Hys; the DMSO (0.05% final concentration) and double distilled water (ddH2O) were used as solvent controls. Vinblastine sulfate (Merck KGaA, Darmstadt, Germany) was used as positive control. After 24 h, 48 h and 72 h of treatment, the medium was removed, MTT solution (0.5 mg/mL) was added to the cells and they were incubated for 3 h in dark conditions at 37 °C. DMSO was used to solubilize the formazan crystals and the absorbance was read by Tecan Sunrise™ (Tecan Group Ltd., Männedorf, Switzerland) UV-vis spectrophotometer at 595 nm. The obtained optical density values were converted into percentage of cell viability and the data were elaborated with AAT Bioquest EC50 Calculator (Sunnyvale, CA, USA) [19] in order to obtain the concentration at which the investigated substance exerts half of its maximal response values (EC50). The values were repeated three times and reported as mean ± SD.
2.6. Antibacterial Activity
To delineate the antibacterial profiles of R. officinalis and L. angustifolia EOs and Hys, the MIC (minimal inhibitory concentration), the MBC (minimal bactericidal concentration), the agar disk-diffusion method and the VPT (vapor phase test) were used. Five different bacteria strains were considered for this study: Escherichia coli ATCC® 25922, Pseudomonas fluorescens ATCC® 13525 and Acinetobacter bohemicus DSM 102855 as Gram-negative bacteria, and Kocuria marina DSM 16420 and Bacillus cereus ATCC® 10876 as Gram-positive bacteria. After 24 h of culturing in lysogeny broth (LB) agar, at 26 (for P. fluorescens, A. bohemicus and B. cereus) and 37 °C (for K. marina and E. coli), the bacterial strains were collected and used for antimicrobial assays.
2.6.1. Minimum Inhibitory Concentration (MIC) and Minimum Bactericidal Concentration (MBC)
The microwell dilution method was carried out to take over the minimum inhibitory concentration (MIC) of the EOs and their corresponding Hys. Twelve two-fold dilutions from 6.25% to 3 × 10⁻³% v/v and from 50% to 1 × 10⁻¹% v/v for EOs and Hys, respectively, were used. Gentamicin was used as a positive control and the negative and solvent controls were also added. A total of 106 colony-forming unit (CFU)/mL of bacteria in LB broth was seeded in 96-well plates, and after 24 h of incubation with the treatments the bacterial growth was evaluated by adding 10 µL of MTT (200 µg/mL) to each well [36,37]. Before adding MTT in the microwell plates, 10 µL of the last four dilutions without bacterial growth were taken and seeded on LB agar Petri plates to evaluate the minimum bactericidal concentration (MBC) or the concentrations for which no bacterial growth was observed after 24 h of incubation. Furthermore, the MBC/MIC ratios were reported and the values >4 defined bacteriostatic activity, while the ratio MBC/MIC ≤4 defined bactericidal activity for the tested samples [38]. All the assays were carried out in triplicate.
2.6.2. Agar Disk-Diffusion Method and Vapor Phase Test (VPT)
The agar disk-diffusion method was carried out to study the activity of the liquid phase. A total of 108 CFU/mL of bacteria was seeded on a Petri dish with LB agar and 10 µL of pure EOs and 15 µL of Hys. Gentamicin (10 mg/mL) was used as a positive control. After 24 h of incubation at the corresponding temperature, the diameter of the growth inhibition halo or inhibition zone (IZ) was measured by a vernier caliper rule [36]. To evaluate the antibacterial activity of the vapor phase of the EOs and Hys, the vapor phase test (VPT) was used. The assay was performed by seeding 108 CFU/mL of bacteria in a Petri dish with LB agar and pouring 5 mL of LB agar in the Petri plate cover where 6 mm sterile disks had been placed and soaked with 10 and 15 µL of the EOs and the corresponding Hys, respectively. The Petri plates were sealed with parafilm in order to prevent any vapor leakage. After 24 h of incubation, the inhibition halo was measured by a vernier caliper rule [33]. The means and standard deviations were obtained by triplicate measures of the Agar disk-diffusion and VPT halos.
2.7. Antioxidant Activity
2.7.1. DPPH Scavenging Activity Assay
Using the protocol described by Sanchez-Moreno et al. [39], the antioxidant activity of R. officinalis and L. angustifolia EOs and Hys was assayed by exploiting the 1,1-diphenyl-2-picrilidrazil radical (DPPH•) properties in the DPPH scavenging activity assay. A total of 100 µL of twelve concentrations obtained by geometric dilutions of each sample (from 25% to 0.01%) were added to a 96-well plate and mixed with 100 µL of a solid DPPH methanol solution (0.2 mM). EOs and Hys without DPPH solution were added as controls and Trolox dilutions and DPPH plus methanol were also added. After 30 min of incubation, the absorbances were measured by a Tecan Sunrise™ UV-vis spectrophotometer (517 nm). Three replicates of the experiment were carried out.
2.7.2. ABTS Radical Scavenging Assay
The ABTS (2,2′-azino-bis(3-ethylbenzothiazoline-6-sulfonic acid) diammonium salt) assay was used to investigate the radical scavenging activity [40]. An aqueous 7 mM solution of ABTS was mixed with K2S2O8 (140 mM) and incubated for 16 h, protected from light at room temperature to allow compounds to form the ABTS+• radical cation. The obtained solution was then diluted in ethanol until the absorbance of 0.70 ± 0.02 at 734 nm was reached. Five geometrical dilutions of each sample were prepared and 20 µL was added to 980 µL of the ABTS+• solution (starting from 2% to 0.125%). After 5 min of incubation, the absorbances of the resulting solutions were measured using a Jasco (Jasco Corporation, Lecco, Italy) V-630 UV-Visible spectrophotometer at 734 nm by the Spectra Manager™ software (version II). The blank consisted of a solution composed of 20 µL of geometrical dilutions of EOs and Hys and 980 µL of ethanol. Trolox geometrical dilutions were used as a positive control. Data were collected in triplicate.
2.8. IC50 and Trolox Equivalents
Using the following equation, the percentage of antioxidant activity (AA%) was estimated:
The percentage of antioxidant activity (AA%) (y) was then plotted against the sample concentrations (x) to form a regression line (y = mx + q). The IC50 value was calculated by the following formula:
The Trolox equivalent antioxidant capacity (TEAC) was also used to express the antioxidant capacity and expressed in µmol Trolox/mg of EOs or Hys.
2.9. Statistical Analysis
The Friedman test, a well-known distribution-free test for the randomized blocks analysis of variance [41], was used for investigating homogeneity in the cytotoxic activity of EOs and Hys across time. Furthermore, for both cytotoxic and antibacterial activities, statistical discrepancies between R. officinalis and L. angustifolia were evaluated by adopting the Mann–Whitney–Wilcoxon nonparametric test [41]. All the statistical tests were performed using R Statistical Software version 4.1.0 (The R foundation for Statistical Computing, Vienna, Austria).
3. Results
3.1. Liquid and Vapor Phase EOs Chemical Volatile Composition
GC–MS and HS/GC–MS techniques were used to investigate the liquid- and vapor-phase chemical composition of R. officinalis and L. angustifolia EOs and Hys. The composition of R. officinalis EO in Table 1 is reported. Monoterpene hydrocarbons (71.5% and 89.5%) were the main compounds followed by oxygenated monoterpenes (26.0% and 10.5%) in the liquid and vapor phase, respectively. Among them, α-pinene (51.2%; 74.7%) and 1,8-cineole (20.1%; 10.0%) were the most abundant components in both phases. Sesquiterpene compounds such as β-caryophyllene (1.4%), α-curcumene (0.1%) and caryophyllene oxide (0.1%) were detected only in the liquid phase.

Table 1.
Chemical composition (%) of liquid and vapor phase R. officinalis essential oil (EO).
Twenty-five volatile compounds were identified in L. angustifolia EO and they are listed in Table 2. In this EO, oxygenated monoterpenes prevailed over monoterpene hydrocarbons with relative percentages equal to 86.9% in the liquid phase and 53.7% in the vapor phase. Linalool (49.9% and 26.2%) was the major compound both in the liquid and vapor phase, respectively. The second most abundant compound was linalyl acetate (17.9%) in the liquid phase while α-pinene (17.8%) was in the vapor phase. Additionally, in this case, sesquiterpenes were present only in the liquid phase with β-caryophyllene (1.5%) and α-farnesene (1.2%) as main components.
Table 2.
Chemical composition (%) of liquid and vapor phase L. angustifolia EO.
3.2. Vapor Phase Hys Chemical Composition
The volatile chemically identified compounds of Hys vapor phase are listed in Table 3. They were only composed of oxygenated monoterpenes, and 1,8-cineole (56.2%) and linalool (42.9%) were the major components of R. officinalis and L. officinalis Hys, respectively. Camphor (20.3% and 18.4%) was the second major component with similar percentage values in both Hys.
Table 3.
Chemical composition (%) of vapor-phase R. officinalis and L. angustifolia Hys.
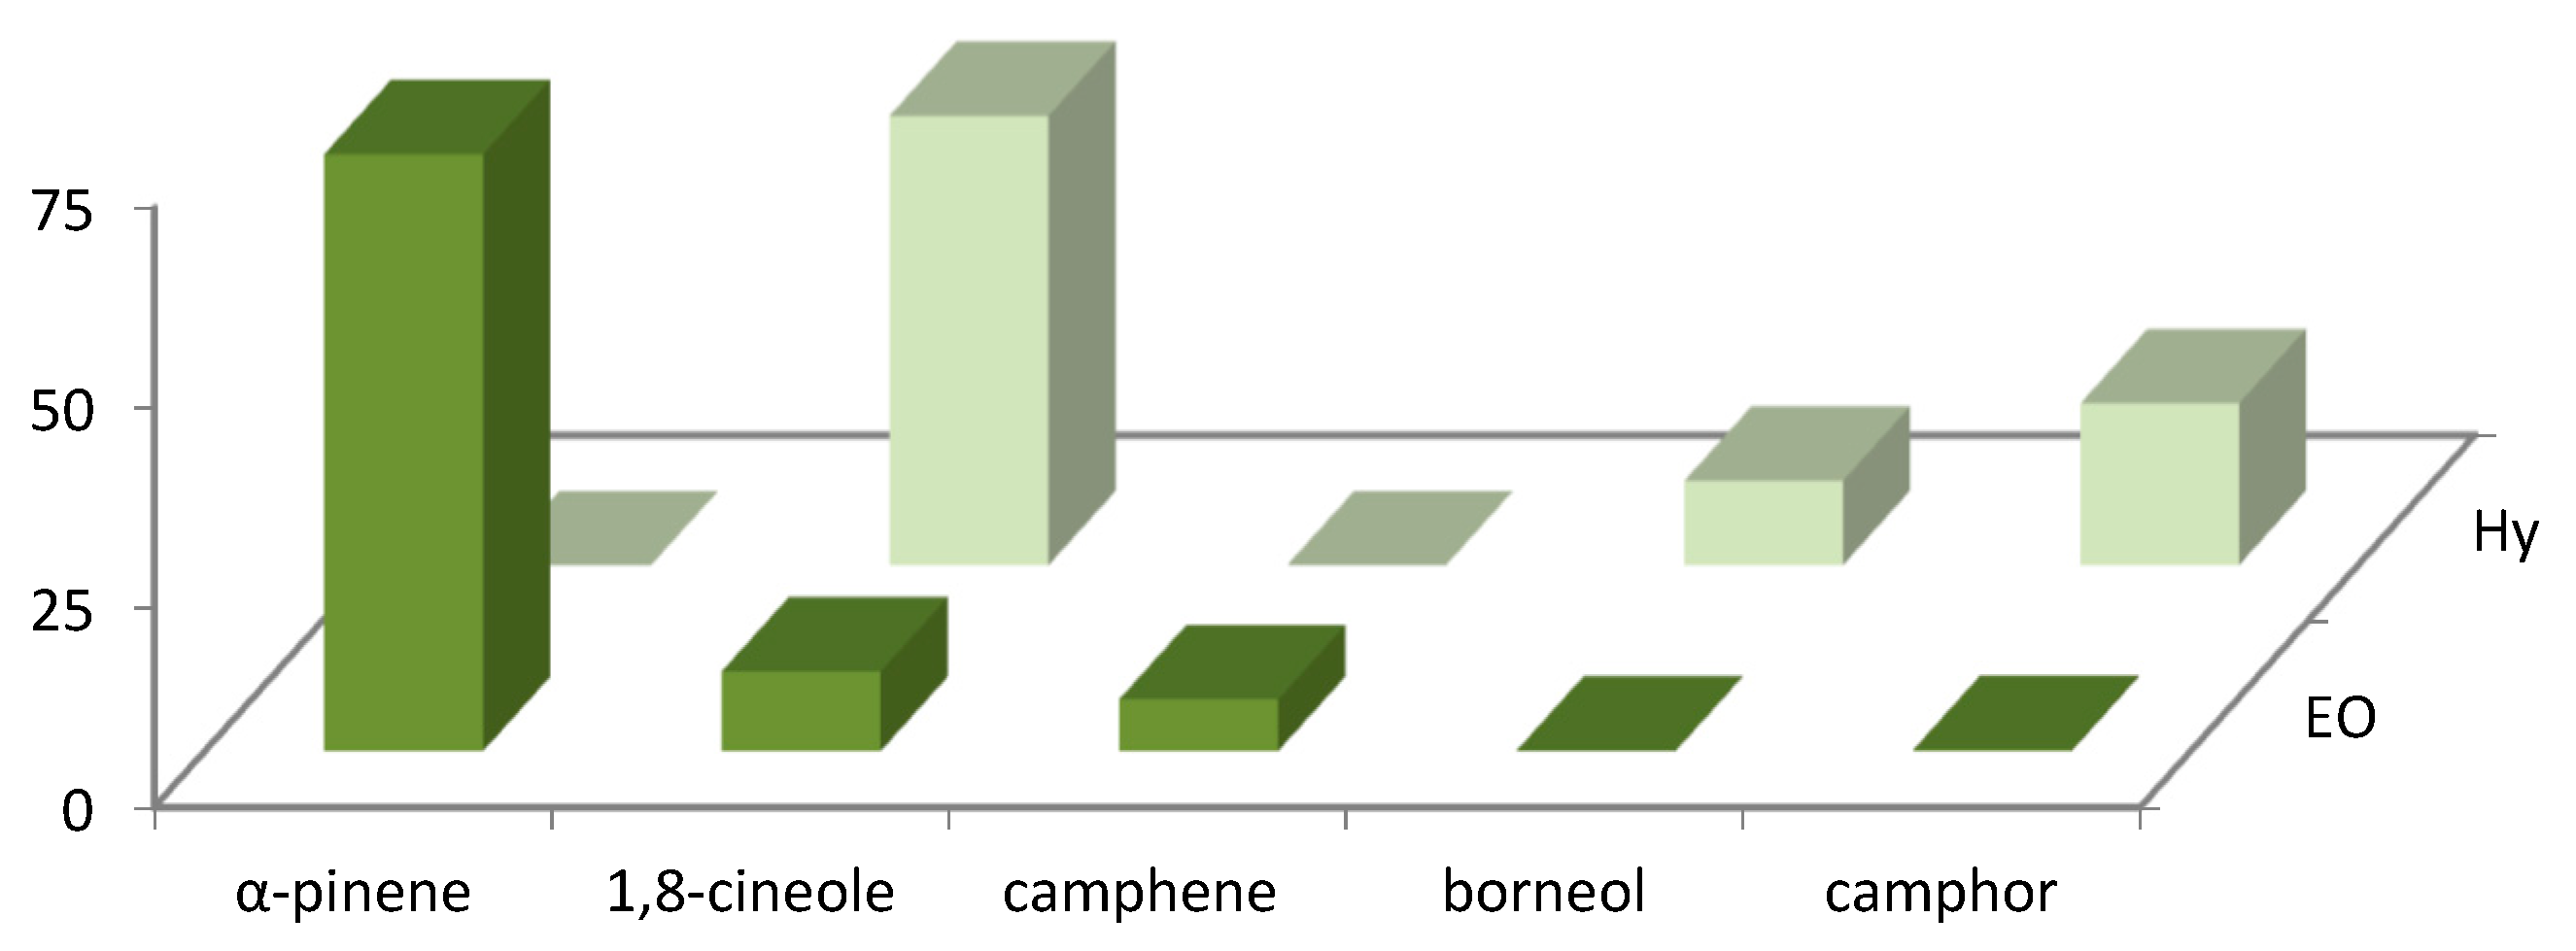
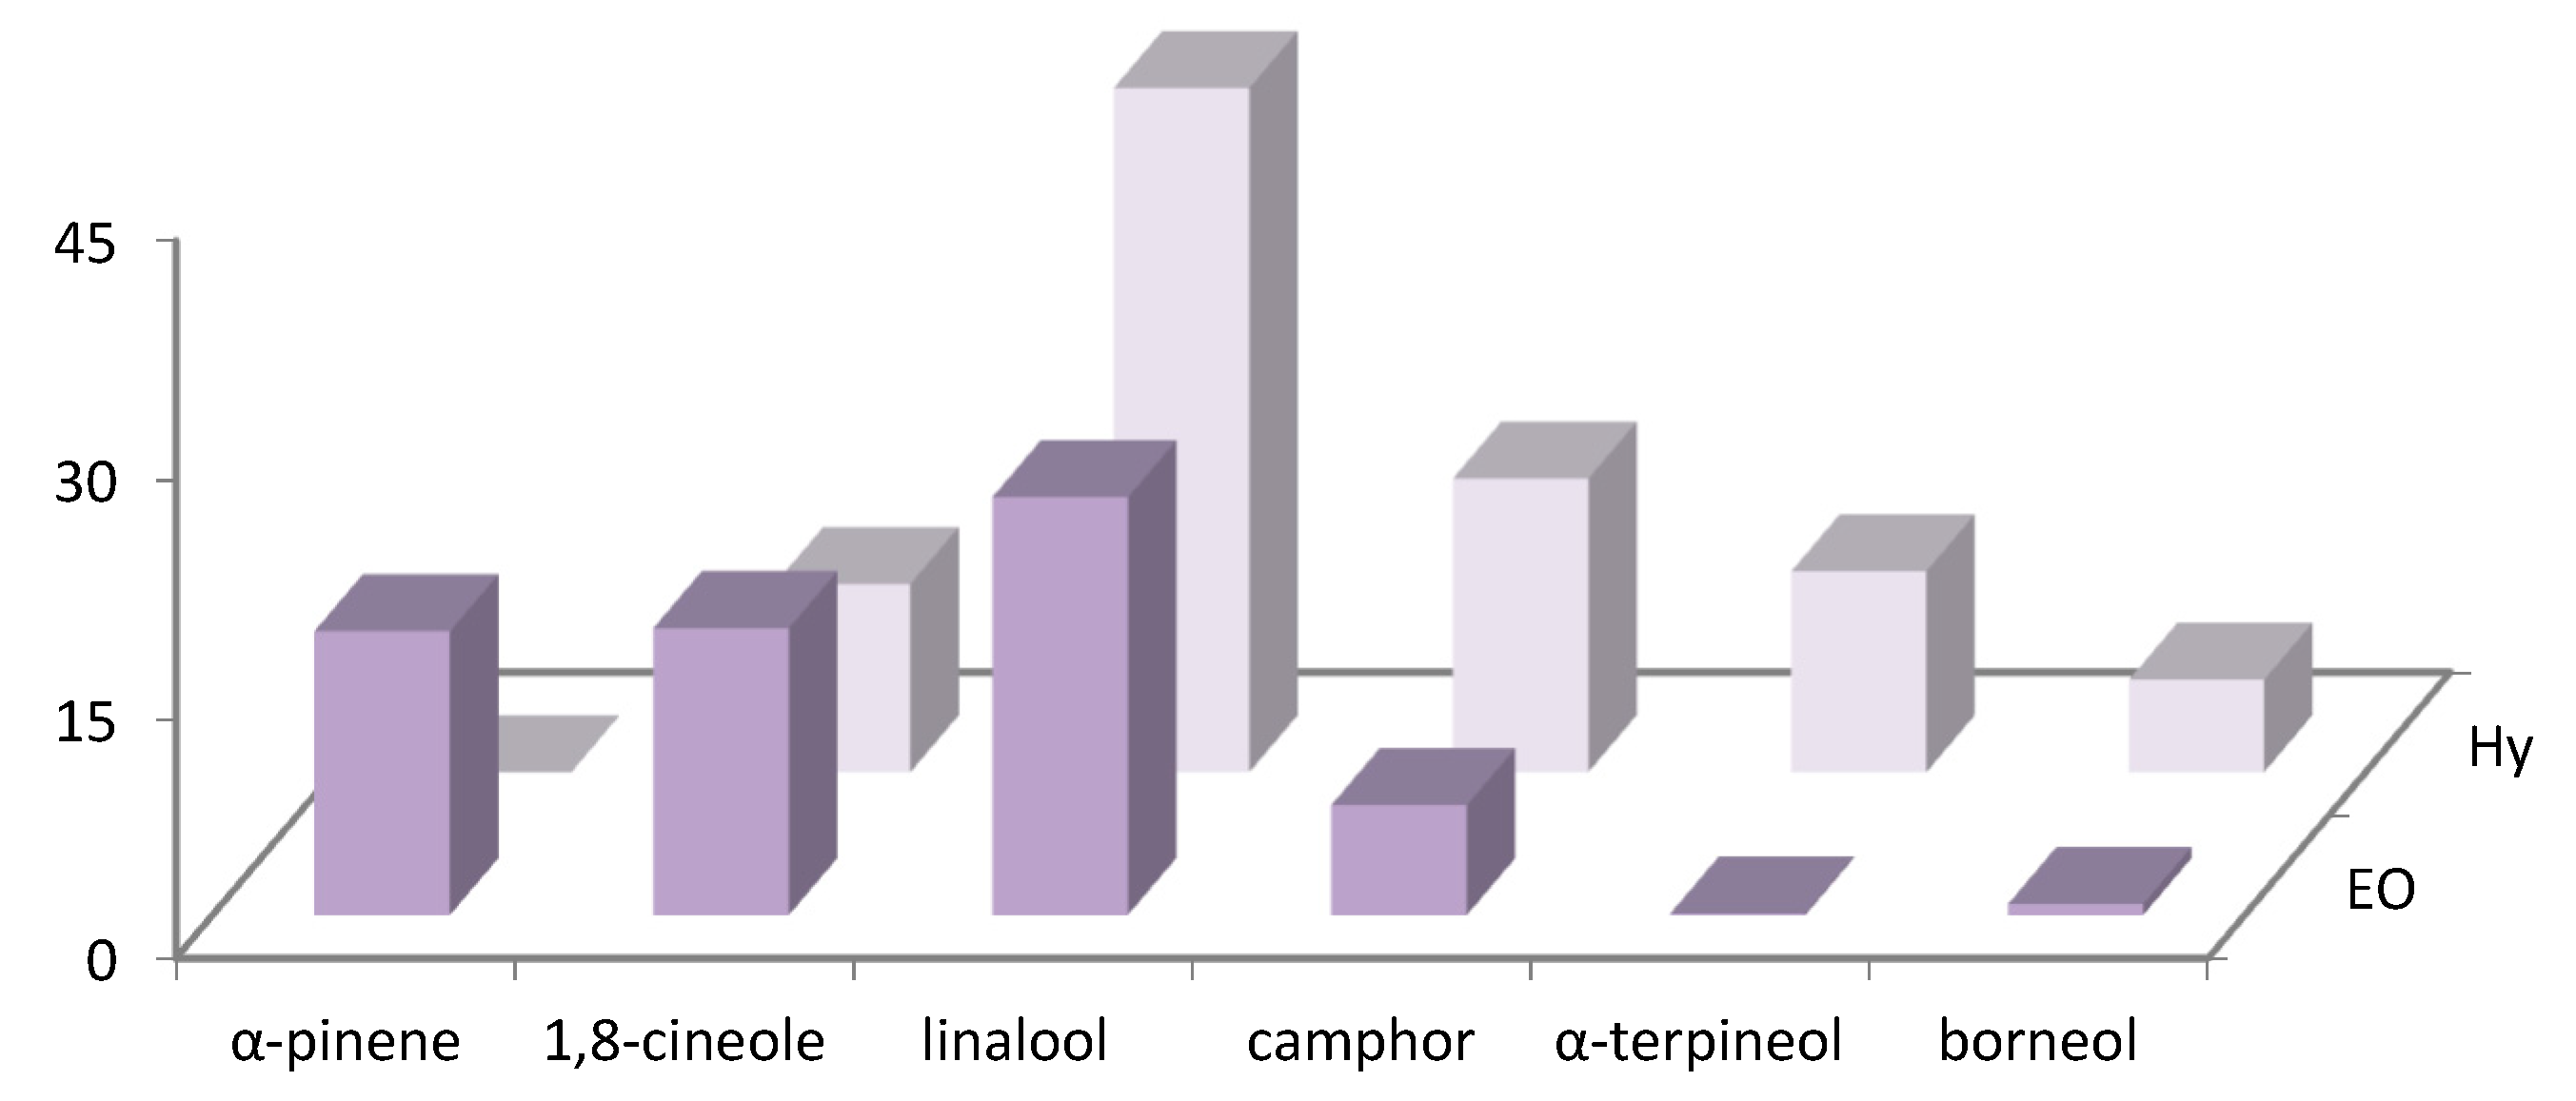
The distribution of the main volatile compounds detected in R. officinalis and L. officinalis Hys and in the vapor-phase EOs is shown in Figure 1 and Figure 2.
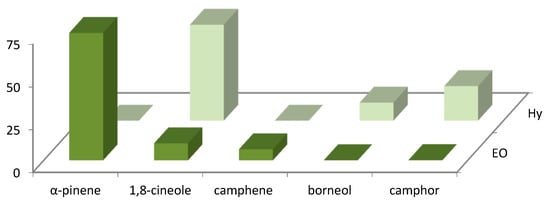
Figure 1.
Bar graph of main compounds detected in vapor-phase R. officinalis Hy and EO.

Figure 2.
Bar graph of main compounds detected in vapor-phase L. angustifolia Hy and EO.
3.3. Cytotoxic Activity
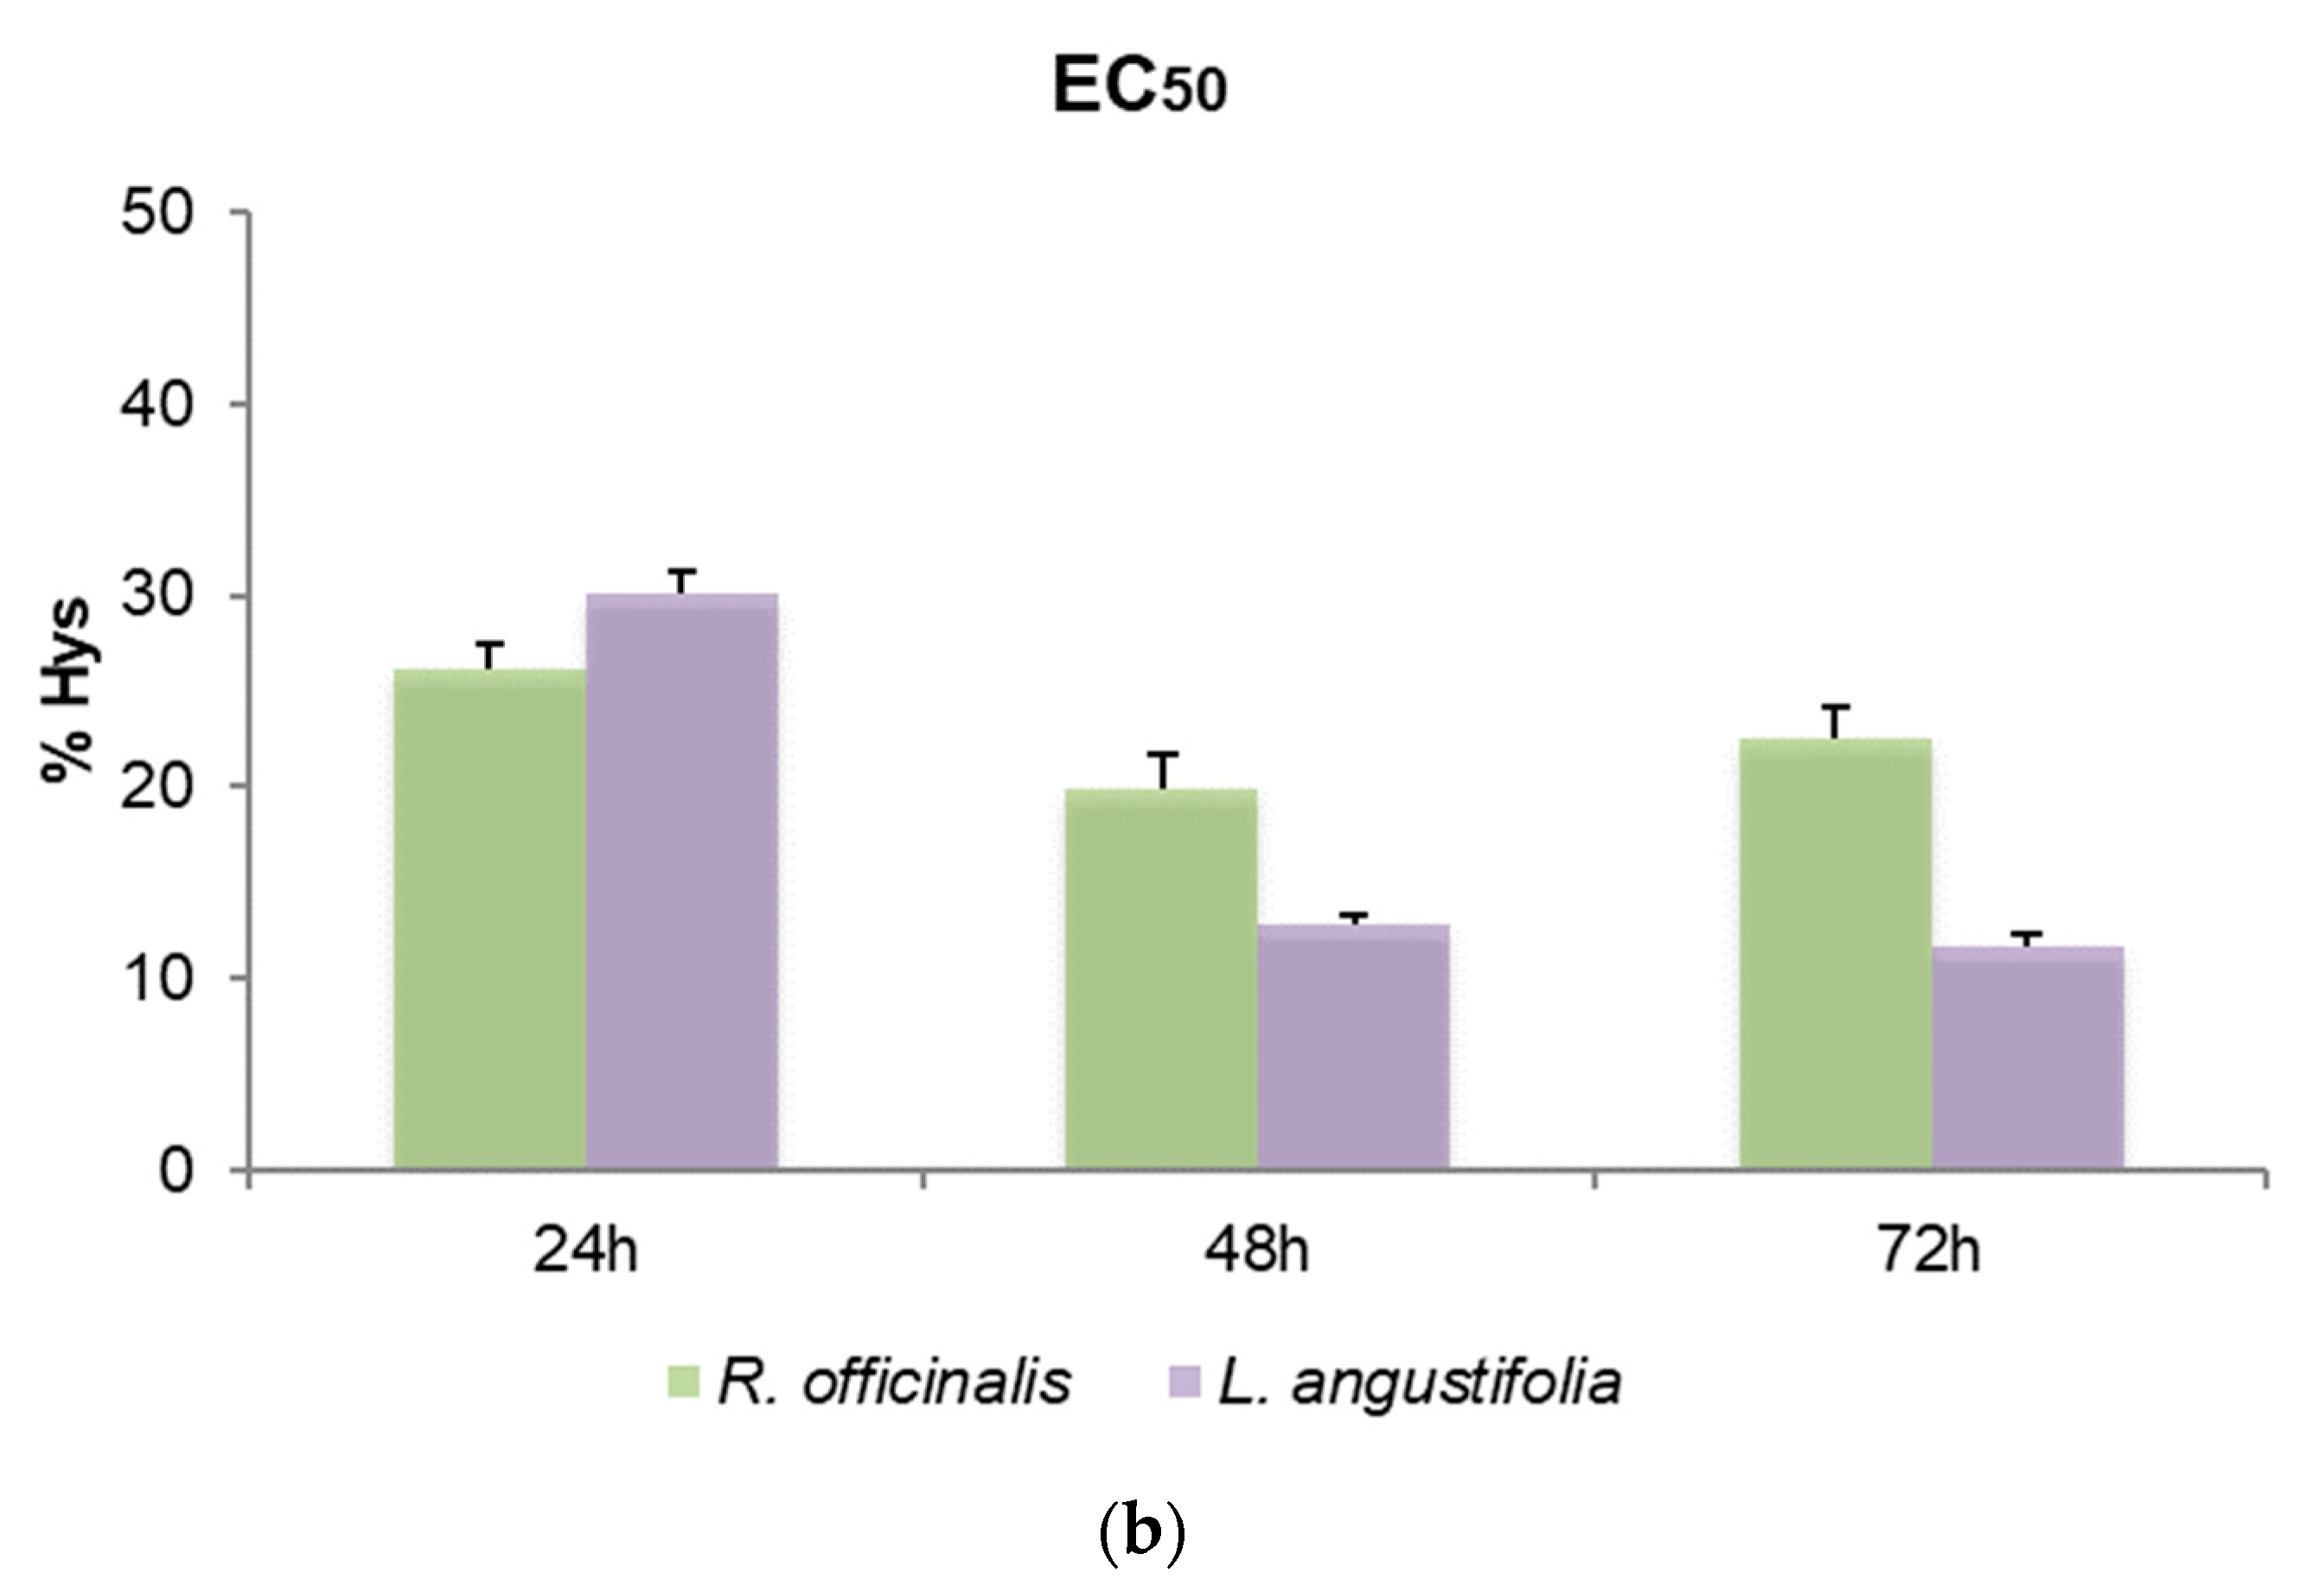
To define the cytotoxic effects of R. officinalis and L. angustifolia EOs and their corresponding Hys, MTT assays were carried out and the EC50 values after 24, 48 and 72 h for SHSY5Y cells were reported (Figure 3). Friedman test p-values for assessing the homogeneity of EC50 across time with respect to EOs and Hys of both plant species are displayed in Table 4. A very mild significance for Hys (p-value equal to 5%) can be detected, while, as highlighted also in Figure 3a, EOs were revealed to be cytotoxic in a time-independent manner, showing EC50 values quite similar in the two plant species considered, from 0.05% to 0.06% v/v for the three time points evaluated (p-values higher than 5%). Even if p-values related to Hys are equal to 5%, the corresponding hypothesis could be barely rejected due to the rather small sample size. Consequently, the Hys EC50 values may be considered substantially stable for each time point and plant species. R. officinalis Hys was slightly lower at 24 h than the L. angustifolia Hys (26.82 ± 2.39% and 30.18 ± 1.11%, respectively) while the latter was more active (19.96 ± 4.7% and 12.78 ± 0.58%) after 48 h and after 72 h (21.53 ± 3.28% and 11.72 ± 0.60%), respectively (Figure 3b). An EC50 value of 1.94 ± 0.18 nM for vinblastine treatment was obtained. DMSO control did not affect cell viability.
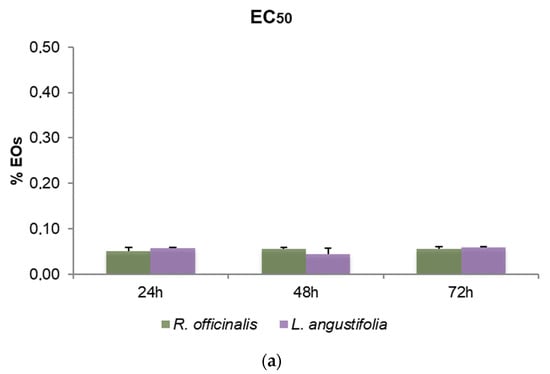

Figure 3.
Bar graphs of EC50 values obtained by thiazolyl blue tetrazolium bromide assay (MTT) after 24, 48 and 72 h of SHSY5Y cell treatments, (a) with R. officinalis and L. angustifolia EOs and (b) with the corresponding Hys. Error bars: standard deviation.
Table 4.
Friedman test p-values for testing homogeneity across time.
Owing to the effective homogeneity resulting from the Friedman test, the data were reduced to the means of EC50 measurements across time. Therefore, in order to assess the EC50 values homogeneity between R. officinalis and L. angustifolia, two Mann–Whitney–Wilcoxon tests were implemented. From the obtained results (both p-values equal to 1), R. officinalis and L. angustifolia produced statistically equivalent EC50 values both for EOs and Hys.
3.4. Antibacterial Activity
Investigations on R. officinalis and L. angustifolia EOs and Hys antibacterial activity were executed by different assays. In Table 5, the results obtained by R. officinalis EO are listed. The highest antibacterial activity was against A. bohemicus with an MIC value of 0.19%, MBC value of 0.39%, IZ of 9.17 ± 0.76 mm and VIZ of 80.00 ± 00 mm. Concerning the other tested bacterial strains, MIC values ranged from 0.39% to 3.13% and MBC values from 0.39% to 6.25%. The MIC/MBC ratio showed that the tested EOs possessed bactericidal properties. IZs were 7.33 ± 0.58 and 8.33 ± 1.52 mm for K. marina and B. cereus, respectively, and VIZs were 80.00 ± 00 mm. For E. coli, IZ was 7.00 ± 0.00 mm, while the EO vapor phase did not determine bacterial growth inhibition. R. officinalis Hy was not active against growth of the tested bacteria (Table 5).
Table 5.
Antibacterial activity of Rosmarinus officinalis EO and Hy.
L. angustifolia EO presented a high antibacterial activity with MIC values of 0.39%, 1.56%, 0.19%, 0.78% and 0.19% and MBC values of 0.39%, 3.13%, 0.39%, 0.78% and 0.19% for E. coli, P. fluorescens, A. bohemicus, K. marina and B. cereus, respectively. MIC/MBC ratios showed that the tested EO possessed bactericidal properties. IZ values for R. officinalis Hy were 11.00 ± 1.00, 7.17 ± 0.76, 11.67 ± 1.15, 11.33 ± 1.53 and 10.67 ± 0.58 mm against E. coli, P. fluorescens, A. bohemicus, K. marina and B. cereus. VIZ values were 6.17 ± 1.04 and 0.67 ± 1.15 mm against A. bohemicus and B. cereus, respectively. L. angustifolia Hy was not effective against the tested bacterial strains growth (Table 6).
Table 6.
Antibacterial activity of L. angustifolia EO and Hy.
IZ and VIZ values for R. officinalis and L. angustifolia EOs were considered for assessing a significant discrepancy in the antibacterial activities. Mann–Whitney–Wilcoxon p-values suggest that, for any significance level greater than 5%, the antibacterial activity against E. coli, A. bohemicus and K. marina, in terms of IZ values, is greater for L. angustifolia EO than for R. officinalis EO (exact p-values equal to 5%), while this cannot be concluded for the antibacterial activity against B. cereus (exact p-value equal to 10%). Contrarily, when VIZ values are considered, the Mann–Whitney–Wilcoxon p-values suggest that for any significance level greater than 5%, the antibacterial activity against A. bohemicus and B. cereus is greater for R. officinalis EO than for L. angustifolia EO (exact p-values equal to 5%).
3.5. Antioxidant Activity of R. officinalis and L. angustifolia EOs and Hys
The antioxidant potential of the EOs and the Hys was investigated by DPPH and ABTS assays reporting the IC50 values (Table 7). Results are also expressed in µM Trolox/mg of samples. The highest antioxidant activity was measured in the EOs followed by Hys of both plants. For R. officinalis EO, IC50 was 13.48 ± 1.58 and 20.21 ± 2.72 µg/mL, while for L. angustifolia EO IC50 was 7.75 ± 0.10 and 18.71 ± 2.15 µg/mL for DPPH and ABTS, respectively. TEAC values were 1.90 ± 1.14 and 23.53 ± 2.43 µmol/mg for R. officinalis EO and 3.30 ± 0.09 and 25.45 ± 3.72 µmol/mg for L. angustifolia EO, for DPPH and ABTS, respectively. R. officinalis and L. angustifolia Hys showed antioxidant activity lower than the corresponding EOs. In particular, R. officinalis Hy IC50 was 136.30 ± 3.85 and 349.42 ± 19.32 µg/mL and TEAC values were 0.22 ± 0.02 and 1.35 ± 0.03 µmol/mg by DPPH and ABTS, respectively. On the contrary, L. angustifolia Hy antioxidant activity was slightly lower than R. officinalis Hy in DPPH assay (240.02 ± 13.65 µg/mL and 0.12 ± 0.01 µmol/mg) and higher in ABTS assay (181.24 ± 15.71 µg/mL and 2.62 ± 0.30 µmol/mg, for IC50 and TEAC, respectively).
Table 7.
Antioxidant activity of R. officinalis and L. angustifolia EOs and Hys.
4. Discussion
In our investigation, liquid and vapor phases of L. angustifolia EO were characterized by linalool (49.9% and 26.2%) as a major constituent, while R. officinalis EO was characterized by α-pinene (51.2% and 74.7%). The chemical profile of L. angustifolia and R. officinalis EOs obtained by aerial parts of plants growing in Syria was investigated by Al-Younis et al. [42], showing a similar composition with borneol (16.25%) and linalool (35.12%) as the main components, respectively, whereas L. angustifolia EO collected in Xinjiang [43] exhibited linalyl acetate (28.89%) as a principal molecule, as well as the Himalayan one (47.56%) [44]. Reagrding R. officinalis EO, 1,8-cineole was the most abundant component in EO from China [45] and Belgrade [46] (26.54% and 43.77%, respectively). On the other side, α-pinene (43.9%) and p-cymene (44.02%) were found to be those with the higher percentage in R. officinalis EO from Iran [47] and Turkey [48]. The present study is the first on the characterization of the aroma profiles of R. officinalis and L. angustifolia Hys grown in the Tuscany region using HS/GC–MS. The obtained results highlight that they were characterized exclusively by oxygenated monoterpenes, among which 1,8-cineole (56.2% in R. officinalis Hy) and linalool (42.9% in L. angustifolia Hy) were the major exponents. Previous studies showed a different chemical composition, with camphor (24.9%), terpinen-4-ol (51.9%) and verbenone (45.31%) as the main components of the R. officinalis hydrolates from Japan [49], Colombia [50] and Korea [51], respectively. Regarding L. angustifolia Hy, a similar composition to that described by us was reported for extracts from Poland [27,52], in which linalool (24.6% and 26.5%, respectively) was also the major detected compound. Of interest, L. angustifolia Hy from Croatia [53] was characterized by linalool (23.2%) when steam distillation was used to obtain the extract, and by 1,8-cineole (20.6%) through hydrodistillation. In fact, the chemical profile of Hys can also vary according to the distillation method used [54].
Our findings and the cited references confirm that the variability of the chemical composition of EOs and Hys depends on various exogenous and endogenous factors, such as the area of provenance of the plant and the extraction method [55].
The biological properties of the R. officinalis and L. angustifolia EOs were investigated with in vivo and in vitro models [9,56] and numerous studies demonstrated their exertion of biological activities [57]. In the present study, R. officinalis and L. angustifolia EOs and Hys, cytotoxic, antimicrobial and antioxidant activities were investigated. Both EOs exerted cytotoxic activities with low EC50 values, corresponding with a high inhibition of SHSY5Y cell proliferation. Regarding Hys treatments, higher EC50 values were obtained and L. angustifolia Hy IC50 was slightly lower than R. officinalis Hy at 48 and 72 h. Studies on Hys cytotoxicity and antiproliferative effects are limited. Melissa officinalis, Achillea teretifolia, Achillea aleppica, Origanum onites and Salvia fruticosa have been investigated on a colorectal cancer cell line to determine their cytotoxic and cytostatic effects, and O. onites Hy was the most effective [58].
In this paper, DPPH and ABTS assays demonstrated that the EOs and Hys possess antioxidant activities, although showing different IC50 values. Antibacterial properties of the Hys were investigated and, unlike EOs, they were not able to inhibit bacterial growth in the different assays.
As reviewed by D’Amato et al. [31], the antibacterial and antifungal, as well antioxidant, properties of the Hys were demonstrated for different plant species, and their uses and applications could be evaluated to control microorganism growth and oxidative processes in food shelf-life. Furthermore, Hys were demonstrated to be active against biofilm production [59,60], and thus could be used as a natural antimicrobial agent for food production [54]. As reported by Šilha et al. [53], no antibacterial effect of L. angustifolia Hy was detected against eight strains of Arcobacter-like bacteria and against Staphylococcus aureus, Enterococcus faecalis, Pseudomonas aeruginosa, Escherichia coli and the yeast Candida albicans. On the contrary, concentrated Hys, obtained by solid-phase extraction and tested against the same microorganisms, exercised a considerable antimicrobial activity.
On the other side, R. officinalis EO showed antioxidant and antimicrobial properties while its corresponding Hy had neither a potential effect against E. coli, P. aeruginosa, S. aureus and C. albicans and A. niger, nor antioxidant properties [50].
Notably, lavandin (L. x intermedia) Hy was not reported to be active against E. coli and B. cereus, whereas it showed antibacterial activity against the same bacterial strains when formulated in nanoemulsion [61].
Hys being composed of the condensed water of the distillation process and by only some volatile oil components, their chemical composition is different with respect to the corresponding EOs; however, the amounts of the main components can vary greatly [31,62]. Generally, Hys exert their biological activities at high concentrations, reflecting their low terpene amount. Since they are aqueous solutions, the hydrophilic environment likely facilitates the terpenes’ availability, enhancing their biological activity [54].
5. Conclusions
Chemical investigations performed by HS/GC–MS revealed that EOs and Hys of R. officinalis and L. angustifolia are rich in bioactive compounds. Both EOs revealed a good antibacterial and antioxidant activity, while their respective Hys exerted a slight antioxidant activity and were completely inactive on the selected bacterial strains. The antiproliferative activity was also evaluated by highlighting, for the first time, that not only EOs but also Hys exerted a cytotoxic effect.
In conclusion, R. officinalis and L. angustifolia EOs, thanks to their exhibited biological activities, could have potential applications in various fields, including foods and beverages. It is also interesting to note that the results obtained with the Hys on the SHSY5Y cell line underline the potentiality of these by-products of the distillation process. In this regard, our findings will be useful for further studies and applications.
Author Contributions
Conceptualization, S.G., V.L.M. and E.O.; investigation, S.G., V.L.M. and E.O.; data curation, S.G., V.L.M., S.F. and E.O.; writing—original draft preparation, S.G., V.L.M. and E.O.; writing—review and editing, S.G. and E.O.; funding acquisition, A.T. and P.G. All the authors critically edited the manuscript before submission. All authors have read and agreed to the published version of the manuscript.
Funding
This research received no external funding.
Institutional Review Board Statement
Not applicable.
Informed Consent Statement
Not applicable.
Data Availability Statement
All generated data are included in this article.
Acknowledgments
The authors are thankful to “èssenziale” Azienda Agricola, Empoli (FI), Italy, for providing EOs and Hys from flowers and inflorescences of L. angustifolia and R. officinalis.
Conflicts of Interest
The authors declare no conflict of interest.
References
- Jiang, T.A. Health benefits of culinary herbs and spices. J. AOAC Int. 2019, 102, 395–411. [Google Scholar] [CrossRef] [PubMed]
- Motti, R. Wild Plants Used as Herbs and Spices in Italy: An Ethnobotanical Review. Plants 2021, 10, 563. [Google Scholar] [CrossRef] [PubMed]
- Cocan, I.; Alexa, E.; Danciu, C.; Radulov, I.; Galuscan, A.; Obistioiu, D.; Morvay, A.A.; Sumalan, R.M.; Poiana, M.; Pop, G.; et al. Phytochemical screening and biological activity of Lamiaceae family plant extracts. Exp. Ther. Med. 2018, 15, 1863–1870. [Google Scholar] [CrossRef] [PubMed] [Green Version]
- Mamadalieva, N.Z.; Akramov, D.K.; Ovidi, E.; Tiezzi, A.; Nahar, L.; Azimova, S.S.; Sarker, S.D. Aromatic medicinal plants of the Lamiaceae family from Uzbekistan: Ethnopharmacology, essential oils composition, and biological activities. Medicines 2017, 4, 8. [Google Scholar] [CrossRef] [Green Version]
- de Macedo, L.M.; Santos, É.M.D.; Militão, L.; Tundisi, L.L.; Ataide, J.A.; Souto, E.B.; Mazzola, P.G. Rosemary (Rosmarinus officinalis L., syn Salvia rosmarinus Spenn.) and Its Topical Applications: A Review. Plants 2020, 9, 651. [Google Scholar] [CrossRef]
- Ydyrys, A.; Zhaparkulova, N.; Aralbaeva, A.; Mamataeva, A.; Seilkhan, A.; Syraiyl, S.; Murzakhmetova, M. Systematic analysis of combined antioxidant and membrane-stabilizing properties of several Lamiaceae family Kazakhstani plants for potential production of tea beverages. Plants 2021, 10, 666. [Google Scholar] [CrossRef]
- González-Minero, F.J.; Bravo-Díaz, L.; Ayala-Gómez, A. Rosmarinus officinalis L. (Rosemary): An Ancient Plant with Uses in Personal Healthcare and Cosmetics. Cosmetics 2020, 7, 77. [Google Scholar] [CrossRef]
- Ribeiro-Santos, R.; Carvalho-Costa, D.; Cavaleiro, C.; Costa, H.S.; Albuquerque, T.G.; Castilho, M.C.; Ramos, F.; Melo, N.R.; Sanches-Silva, A. A novel insight on an ancient aromatic plant: The rosemary (Rosmarinus officinalis L.). Trends Food Sci. Tech. 2015, 45, 355–368. [Google Scholar] [CrossRef]
- De Oliveira, J.R.; Camargo, S.E.A.; De Oliveira, L.D. Rosmarinus officinalis L. (rosemary) as therapeutic and prophylactic agent. J. Biomed. Sci. 2019, 26, 1–22. [Google Scholar] [CrossRef]
- Moja, S.; Guitton, Y.; Nicolè, F.; Legendre, L.; Pasquier, B.; Upson, T.; Jullien, F. Genome size and plastid trnK-matK markers give new insights into the evolutionary history of the genus Lavandula L. Plant Biosyst. Int. J. Deal. All Asp. Plant Biol. 2015, 150, 1216–1224. [Google Scholar] [CrossRef]
- Hassiotis, C.N.; Ntana, F.; Lazari, D.M.; Poulios, S.; Vlachonasios, K.E. Environmental and developmental factors affect essential oil production and quality of Lavandula angustifolia during flowering period. Ind. Crop. Prod. 2014, 62, 359–366. [Google Scholar] [CrossRef]
- de Sousa, D.P.; de Almeida Soares Hocayen, P.; Andrade, L.N.; Andreatini, R. A systematic review of the anxiolytic-like effects of essential oils in animal models. Molecules 2015, 20, 18620–18660. [Google Scholar] [CrossRef] [PubMed] [Green Version]
- Ayaz, M.; Sadiq, A.; Junaid, M.; Ullah, F.; Subhan, F.; Ahmed, J. Neuroprotective and anti-aging potentials of essential oils from aromatic and medicinal plants. Front. Aging Neurosci. 2017, 9, 168. [Google Scholar] [CrossRef] [Green Version]
- López, V.; Nielsen, B.; Solas, M.; Ramírez, M.J.; Jäger, A.K. Exploring pharmacological mechanisms of lavender (Lavandula angustifolia) essential oil on central nervous system targets. Front. Pharmacol. 2017, 8, 280. [Google Scholar] [CrossRef]
- Nikolić, M.; Jovanović, K.K.; Marković, T.; Marković, D.; Gligorijević, N.; Radulović, S.; Soković, M. Chemical composition, antimicrobial, and cytotoxic properties of five Lamiaceae essential oils. Ind. Crop. Prod. 2014, 61, 225–232. [Google Scholar] [CrossRef]
- Gezici, S. Promising anticancer activity of lavender (Lavandula angustifolia Mill.) essential oil through induction of both apoptosis and necrosis. Ann. Phytomed. 2018, 7, 38–45. [Google Scholar] [CrossRef]
- Garzoli, S.; Turchetti, G.; Giacomello, P.; Tiezzi, A.; Laghezza Masci, V.; Ovidi, E. Liquid and vapour phase of lavandin (Lavandula × intermedia) essential oil: Chemical composition and antimicrobial activity. Molecules 2019, 24, 2701. [Google Scholar] [CrossRef] [PubMed] [Green Version]
- Boukhatem, M.N.; Sudha, T.; Darwish, N.H.E.; Chader, H.; Belkadi, A.; Rajabi, M.; Houche, A.; Benkebailli, F.; Oudjida, F.; Mousa, S.A. A New eucalyptol-rich lavender (Lavandula stoechas L.) essential oil: Emerging potential for therapy against inflammation and cancer. Molecules 2020, 25, 3671. [Google Scholar] [CrossRef]
- Laghezza Masci, V.; Ovidi, E.; Taddei, A.R.; Turchetti, G.; Tiezzi, A.; Giacomello, P.; Garzoli, S. Apoptotic effects on HL60 human leukaemia cells induced by lavandin essential oil treatment. Molecules 2020, 25, 538. [Google Scholar] [CrossRef] [PubMed] [Green Version]
- Abd Rashed, A.; Rathi, D.-N.G.; Ahmad Nasir, N.A.H.; Abd Rahman, A.Z. Antifungal properties of essential oils and their compounds for application in skin fungal infections: Conventional and nonconventional approaches. Molecules 2021, 26, 1093. [Google Scholar] [CrossRef]
- Aprotosoaie, A.C.; Gille, E.; Trifan, A.; Luca, V.S.; Miron, A. Essential oils of Lavandula genus: A systematic review of their chemistry. Phytochem. Rev. 2017, 16, 761–799. [Google Scholar] [CrossRef]
- Lawrence, B.M. Progress in essential oils, lavender oils. Perf. Flav. 1993, 18, 58–61. [Google Scholar]
- Cseke, L.J.; Kirakosyan, A.; Kaufman, P.B.; Warber, S.L.; Duke, J.A.; Brielmann, H.L. Natural Products from Plants, 2nd ed.; CRC Press: Boca Raton, FL, USA, 2006. [Google Scholar]
- Bakkali, F.; Averbeck, S.; Averbeck, D.; Idaomar, M. Biological effects of essential oils—A review. Food Chem. Toxicol. 2008, 46, 446–475. [Google Scholar] [CrossRef]
- Dhifi, W.; Bellili, S.; Jazi, S.; Bahloul, N.; Mnif, W. Essential oils’ chemical characterization and investigation of some biological activities: A critical review. Medicines 2016, 3, 25. [Google Scholar] [CrossRef] [PubMed] [Green Version]
- Luo, W.; Du, Z.; Zheng, Y.; Liang, X.; Huang, G.; Zhang, Q.; Liu, Z.; Zhang, K.; Zheng, X.; Lin, L.; et al. Phytochemical composition and bioactivities of essential oils from six Lamiaceae species. Ind. Crop. Prod. 2019, 133, 357–364. [Google Scholar] [CrossRef]
- Prusinowska, R.; Śmigielski, K.B. Composition, biological properties and therapeutic effects of lavender (Lavandula angustifolia L.). A review. Herba Pol. J. 2014, 2, 56–66. [Google Scholar] [CrossRef] [Green Version]
- Begum, A.; Sandhya, S.; Shaffath, A.S.; Vinod, K.R.; Reddy, S.; Banji, D. An in-depth review on the medicinal flora Rosmarinus officinalis (Lamiaceae). Acta Sci. Pol. Technol. Aliment. 2013, 12, 61–73. [Google Scholar] [PubMed]
- Edris, A.E. Identification and absolute quantification of the major water-soluble aroma components isolated from the hydrosols of some aromatic plants. J. Essent. Oil Bear. Plants 2009, 12, 155–161. [Google Scholar] [CrossRef]
- Hamedi, A.; Moheimani, S.M.; Sakhteman, A.; Etemadfard, H.; Moein, M. An overview on indications and chemical composition of aromatic waters (hydrosols) as functional beverages in Persian nutrition culture and folk medicine for hyperlipidemia and cardiovascular conditions. J. Evid. Based Complement. Altern. 2017, 22, 544–561. [Google Scholar] [CrossRef]
- D’Amato, S.; Serio, A.; López, C.C.; Paparella, A. Hydrosols: Biological activity and potential as antimicrobials for food applications. Food Control. 2018, 86, 126–137. [Google Scholar] [CrossRef]
- Ovidi, E.; Laghezza Masci, V.; Zambelli, M.; Tiezzi, A.; Vitalini, S.; Garzoli, S. Laurus nobilis, Salvia sclarea and Salvia officinalis Essential Oils and Hydrolates: Evaluation of Liquid and Vapor Phase Chemical Composition and Biological Activities. Plants 2021, 10, 707. [Google Scholar] [CrossRef]
- Garzoli, S.; Masci, V.L.; Caradonna, V.; Tiezzi, A.; Giacomello, P.; Ovidi, E. Liquid and Vapor Phase of Four Conifer-Derived Essential Oils: Comparison of Chemical Compositions and Antimicrobial and Antioxidant Properties. Pharmaceuticals 2021, 14, 134. [Google Scholar] [CrossRef] [PubMed]
- Zhang, W.; Liang, X. Headspace Gas Chromatography-Mass Spectrometry for Volatile Components Analysis in Ipomoea Cairica (L.) Sweet Leaves: Natural Deep Eutectic Solvents as Green Extraction and Dilution Matrix. Foods 2019, 8, 205. [Google Scholar] [CrossRef] [PubMed] [Green Version]
- Gören, A.C.; Topçu, A.; Bilsel, G.; Bilsel, M.; Wilkinson, J.M.; Cavanagh, H.M. Analysis of essential oil of Satureja thymbra by hydrodistillation, thermal desorber, and headspace GC/MS techniques and its antimicrobial activity. Nat. Prod. Res. 2004, 18, 189–195. [Google Scholar] [CrossRef] [PubMed]
- Balouiri, M.; Moulay Sadiki, M.; Koraichi Ibnsouda, S. Methods for in vitro evaluating antimicrobial activity: A review. J. Pharm. Anal. 2016, 6, 71–79. [Google Scholar] [CrossRef] [PubMed] [Green Version]
- Clinical and Laboratory Standards Institute. M23–A3: Development of In Vitro Susceptibility Testing Criteria and Quality Control Parameters; Approved Guideline, 3rd ed.; CLSI Document; Clinical and Laboratory Standards Institute: Wayne, PA, USA, 2008; pp. 1–68. [Google Scholar]
- Gatsing, D.; Tchakoute, V.; Ngamga, D.; Kuiate, J.; Tamokou, J.; Nji-Nkah, B.; Tchouanguep, F.; Fodouop, S. In vitro antibacterial activity of Crinum purpurascens Herb. leaf extract against the Salmonella species causing typhoid fever and its toxicological evaluation. Iran. J. Med. Sci. 2009, 34, 126–136. [Google Scholar]
- Sanchez-Moreno, C.; Larrauri, J.A.; Saura-Calixto, F. A procedure to measure the antiradical efficiency of polyphenols. J. Sci. Food Agric. 1998, 76, 270–276. [Google Scholar] [CrossRef]
- Re, R.; Pellegrini, N.; Proteggente, A.; Yang, M.; Rice-Evans, C. Antioxidant activity applying an improved ABTS radical cation decolorization assay. Free Radic. Biol. Med. 1999, 26, 1231–1237. [Google Scholar] [CrossRef]
- Hollander, M.; Douglas, A.W. Nonparametric Statistical Methods; John Wiley & Sons: New York, NY, USA, 1999; pp. 106–272. [Google Scholar]
- Al-Younis, F.; Al-Naser, Z.; Al-Hakim, W. Chemical composition of Lavandula angustifolia Miller and Rosmarinus officinalis L. essential oils and fumigant toxicity against larvae of Ephestia kuehniella Zeller. Int. J. Chem. Technol. Res. 2015, 8, 1382–1390. [Google Scholar]
- Xiaotian, C.; Lanyue, Z.; Chenyu, Q.; Zhiyun, D.; Peng, X.; Zhangmin, X. Chemical compositions of essential oil extracted from Lavandula angustifolia and its prevention of TPA-induced inflammation. Microchem. J. 2020, 153, 104458. [Google Scholar]
- Verma, R.S.; Rahman, L.U.; Chanotiya, C.S.; Verma, R.K.; Chauhan, A.; Yadav, A.; Singh, A.; Yadav, A.K. Essential oil composition of Lavandula angustifolia Mill. cultivated in the mid hills of Uttarakhand, India. J. Serb. Chem. Soc. 2010, 75, 343–348. [Google Scholar] [CrossRef]
- Jianga, Y.; Wua, N.; Fua, Y.; Wanga, W.; Luoa, M.; Zhao, C.; Zua, Y.; Liu, X. Chemical composition and antimicrobial activity of the essential oil of Rosemary. Environ. Toxicol. Pharmacol. 2011, 32, 63–68. [Google Scholar] [CrossRef]
- Rašković, A.; Milanović, I.; Pavlović, N.; Ćebović, T.; Vukmirović, S.; Mikov, M. Antioxidant activity of rosemary (Rosmarinus officinalis L.) essential oil and its hepatoprotective potential. BMC Complement. Altern. Med. 2014, 14, 225. [Google Scholar] [CrossRef] [Green Version]
- Jamshidi, R.; Afzali, Z.; Afzali, D. Chemical Composition of Hydrodistillation Essential Oil of Rosemary in Different Origins in Iran and Comparison with Other Countries. Am. Eurasian J. Agric. Environ. Sci. 2009, 5, 78–81. [Google Scholar]
- Özcan, M.M.; Chalchat, J.-C. Chemical composition and antifungal activity of rosemary (Rosmarinus officinalis L.) oil from Turkey. Int. J. Food Sci. Nutr. 2008, 59, 691–698. [Google Scholar] [CrossRef]
- Tomi, K.; Kitao, M.; Konishi, N.; Murakami, H.; Matsumura, Y.; Hayashi, T. Enantioselective GC–MS analysis of volatile components from rosemary (Rosmarinus officinalis L.) essential oils and hydrosols. Biosci. Biotechnol. Biochem. 2016, 80, 840–847. [Google Scholar] [CrossRef] [PubMed] [Green Version]
- Hay, Y.-O.; Abril-Sierra, M.A.; Sequeda-Castañeda, L.G.; Bonnafous, C.; Raynaud, C. Evaluation of combinations of essential oils and essential oils with hydrosols on antimicrobial and antioxidant activities. J. Pharm. Pharmacogn. Res. 2018, 6, 216–230. [Google Scholar]
- Hyeon Jeon, D.; Yong Moon, J.; Bong Hyun, H.; Kim Cho, S. Composition Analysis and Antioxidant Activities of the Essential Oil and the Hydrosol Extracted from Rosmarinus officinalis L. and Lavandula angustifolia Mill. Produced in Jeju. J. Appl. Biol. Chem. 2013, 56, 141–146. [Google Scholar] [CrossRef]
- Śmigielski, K.B.; Prusinowska, R.; Krosowiak, K.; Sikora, M. Comparison of qualitative and quantitative chemical composition of hydrolate and essential oils of lavender (Lavandula angustifolia). J. Essent. Oil Res. 2013, 25, 291–299. [Google Scholar] [CrossRef]
- Šilha, D.; Švarcová, K.; Bajer, T.; Královec, K.; Tesařová, E.; Moučková, K.; Pejchalová, M.; Bajerová, P. Chemical Composition of Natural Hydrolates and Their Antimicrobial Activity on Arcobacter-Like Cells in Comparison with Other Microorganisms. Molecules 2020, 25, 5654. [Google Scholar] [CrossRef] [PubMed]
- Aćimović, M.G.; Tešević, V.V.; Smiljanić, K.T.; Cvetković, M.T.; Stanković, J.M.; Kiprovski, B.M.; Sikora, V.S. Hydrolates—by-products of essential oil distillation: Chemical composition, biological activity and potential uses. Adv. Mater. Technol. 2020, 9, 54–70. [Google Scholar]
- Turek, C.; Stintzing, F.C. Stability of essential oils: A review. Compr. Rev. Food Sci. Food Saf. 2013, 12, 40–56. [Google Scholar] [CrossRef]
- Benny, A.; Thomas, J. Essential oils as treatment strategy for Alzheimer’s disease: Current and future perspectives. Planta Med. 2019, 85, 239–248. [Google Scholar] [PubMed] [Green Version]
- Elshafie, H.S.; Camele, I. An Overview of the biological effects of some mediterranean essential oils on human health. Biomed. Res. Int. 2017, 2017, 9268468. [Google Scholar] [CrossRef] [PubMed]
- Şimşek Sezer, E.; Bozkurt, M.; Tulukcu, E.; Uysal, T. Comparative Cytotoxic Effects of the Hydrosols of Some Ethnobotanic Plants. Curr. Perspect. Med. Aromat. Plants (CUPMAP) 2020, 3, 97–103. [Google Scholar] [CrossRef]
- Karampoula, F.; Giaouris, E.; Deschamps, J.; Doulgeraki, A.; Nychas, G.J.E.; Dubois-Brissonnet, F. Hydrosol of Thymbra capitata is a highly efficient biocide against Salmonella enterica serovar typhimurium biofilm. Appl. Environ. Microbiol. 2016, 82, 5309–5319. [Google Scholar] [CrossRef] [PubMed] [Green Version]
- Chorianopoulos, N.G.; Giaouris, E.D.; Skandamis, P.N.; Haroutounian, S.A.; Nychas, G.J.E. Disinfectant test agains monoculture and mixed-culture biofilms composed of technological, spoilage and pathogenic bacteria: Bactericidal effect of essential oil and hydrosol of Satureja thymbra and comparison with standard acid-base sanitizers. J. Appl. Microbiol. 2008, 104, 1586–1596. [Google Scholar] [CrossRef]
- Garzoli, S.; Petralito, S.; Ovidi, E.; Turchetti, G.; Masci, V.L.; Tiezzi, A.; Trilli, J.; Cesa, S.; Casadei, M.A.; Giacomello, P.; et al. Lavandula x intermedia essential oil and hydrolate: Evaluation of chemical composition and antibacterial activity before and after formulation in nanoemulsion. Ind. Crop. Prod. 2020, 145, 112068. [Google Scholar] [CrossRef]
- Inouye, S. A comparative study on the composition of forty-four hydrosols and their essential oils. Int. J. Essent. Oil Ther. 2008, 2, 89–104. [Google Scholar]

Publisher’s Note: MDPI stays neutral with regard to jurisdictional claims in published maps and institutional affiliations. |
© 2021 by the authors. Licensee MDPI, Basel, Switzerland. This article is an open access article distributed under the terms and conditions of the Creative Commons Attribution (CC BY) license (https://creativecommons.org/licenses/by/4.0/).