Abstract
In this research, the mathematical model associated with the hydrothermal dehydration process of Nixtamalized Corn Grains (NCG) with different Steeping Time (ST) values, allows the fitting of experimental data with initial moisture
and the equilibrium moisture as a function of Isothermal Dehydration Time (IDT). The moisture percentage for any time and dehydration rate (isolines M(t) and isolines respectively) of the NCG is shown by means of matrix graphics as a simultaneous function of IDT and ST. The relationship between initial dehydration rate and initial moisture establishes as a function of ST. Also, the mathematical model associated with the solution of the second Fick’s law allows calculating the diffusivity rate (H2O molecules out of NCG) and verify that the rate of change in moisture and the dynamical proportionality constant has a non-linear dependence on the IDT and that is directly proportional to . The values strongly relate to ST and the calcium ions percentage into NCG according to solubility lime values into cooking water (or nejayote) as a function of decreasing temperature when ST increases.
1. Introduction
Corn production worldwide is larger than any other cereal. The United States Department of Agriculture (USDA) estimates that the 2020/2021 World Corn Production would be 1133.89 million tons. Corn Production last year was 1116.41 million tons. The 1133.89 million tons estimated for this year could mean an increase of 17.47 million tons or 1.57% in the production of corn around the world. Among the main corn producers are: United States: 360,252,000 tons, China: 260,670,000 tons, Brazil: 109,000,000 tons, European Union: 63,600,000 tons Argentina: 47,500,000 tons, Ukraine: 29,500,000 tons, India: 28,500,000 tons, Mexico: 28,000,000 tons.
The TNP, originally from Mexico, is an alkaline hydrothermal process that consisting of the cooked corn grains immersed in an aqueous solution of CaOH2 (“nejayote” in the indigenous language), which have three purposes: the pericarp degradation, the calcium ions diffusion, and hydration on corn grains. The alkaline aqueous solution is prepared from 0.8% up to 2% of lime with respect to the weight of corn grains, where temperatures can vary from 72 °C until the solution boils. Afterward, the corn grains submerge into the nejayote, which cools to room temperature according to Newton’s law of cooling. This process is named Steeping Time (ST) and must last several hours. Simultaneously, in the cooking time and ST stages, partial NCG-starch hydration, Ca++ and Ca(OH)+ ions (divalent and monovalent respectively) [1] diffusion increases, allowing the pre-gelatinization and starches gelatinization of the outermost endosperm part. In this way, the hydration process occurs faster. Later, the nejayote drained, and the NCG is three times water-rinsed to eliminate the residual lime, which, in turn, facilitates the NCG milling and the conversion to fresh corn dough [2,3]. Then, the NCG is milled in a stone mill to prepare fresh corn masa, and circular disks are molded to prepare tortillas. The NCG’s dehydration kinetics, after the TNP described above, reflects the physical-chemical state of water and the Ca++ and Ca(OH)+ ions into the grains, and the water extraction by heating must be applied with a temperature less than that of starch gelatinization during the isothermal dehydration process. The corn grains hydration process has been studied as a function of ST, such as the ST effect on different physical-chemical properties of the Instantaneous Nixtamalized Corn Flour and Ca++ and Ca(OH)+ ions diffusion through the different sections of the NCG: pericarp, endosperm, and germ [3,4,5]. Also, the absorption mechanism and the percolation channels for Ca++ and Ca(OH)+ ions diffusion to explain the accumulation process in the external layers of NCG have been studied. These ions contribute to the total calcium percentage in the corn grains [3,5,6,7].
In the past, for the alkaline hydration process, some mathematical models based on three parameters published to date: is dynamical proportionality constant, maximum moisture percentage, saturation or equilibrium and endogenous moisture. For example, the differential Equation (1), in varieties of beans and fava beans, results in the fact that the water absorption ratio is directly proportional to the difference of the percentage of maximum moisture and the percentage of moisture at any time with a constant of proportionality [6,7,8,9,10,11,12]. However, they omitted to indicate which was the experimental data to determine the border conditions and for solving the differential equation. Another researcher group proposed the differential Equation (2) for the water absorption ratio in red beans, which is proportional to the difference between the maximum moisture percentage and the moisture percentage at any time [12,13,14]. They did not propose a value of . Other authors proposed an asymptotic exponential model using Equation (3) to explain the water absorption kinetics in chickpeas, millets, cereal flakes, and soybeans [12,13,14,15,16,17,18]. Moreover, they did not justify their results mathematically or with experimental data.
A mathematical model was proposed, with corn grains spherical geometry, employing the second Fick’s law, to explain the Ca++ and Ca(OH)+ ions diffusion across the pericarp membrane and areas without pericarp [18]. The H2O-Ca simultaneous diffusion into corn grains without a pericarp is explained by employing the second Fick’s equation solution for chemical reactions during the TNP, in cooked isothermal alkaline [19,20]. Also, there are researches about calculating the barrier effects on pericarp of NCG in the water diffusion during an alkaline thermal treatment, and values compare for NCG with no pericarp [20,21]. As far as is known, no evidence exists on the fitting of results during the dehydration process after TNP with a satisfactory explanation, using a mathematical model and its relationship with Fick’s law for the water diffusion as a function of ST. Fick’s equation can be related, with the fitting the NCG dehydration curves to calculate and values for water diffusivity or water evaporation of the NCG. Therefore, this research aims at deducing and solving the first-order differential equation to describe the dehydration kinetics of NCG after TNP at different ST, applying border conditions and the experimental data fitting to verify the mathematical model validity. Besides, the mathematical model calculates the moisture percentage and dehydration rate isolines. The model calculates as a function of during IDT.
2. Experimental
By performing TNP, the white corn grains using (a commercial variety called Toluqueño harvest 2019) with 14.54% average of endogenous moisture, and with the same qualitative characteristics such as not broken, similar grain sizes, and color. The mixture is prepared into an Erlenmeyer flask with 10 g of corn grains adding water until reaching 30 mL; besides, the mixture contains 0.8% of Ca(OH)2 with respect to the weight of the white corn grains (0.36 g of lime). Then, the mixture cooks at 80 °C for 60 min on a thermostat water bath (ECOSHEL, USA). The flask is covering with aluminum paper to avoid water evaporation. This process repeats five times for every ST (0, 2, 4, 6, and 8 h). Thus, the total NTP was 25 times. Then, the NCG was dried and weighed simultaneously without washing (into an equipment balance with a halogen lamp model HR83 Mettler-Toledo; Switzerland). The chosen time for dehydration in the 0–120 min interval at 50 °C (temperature to avoid starches gelatinization during dehydration process) constantly taking weight measurements every 15 min during the first 2 h. To the parameter, samples dehydrate for 2600 min. There were five measurements for each ST experiment.
3. Mathematical Model
For the NCG the solution to Equation (4) and its relationship with Fick’s law allows calculating the effective diffusivity coefficient during the isothermal dehydration process as a function of ST. The NCG loses water continuously. This loss is expressed by employing a moisture differential per a time differential , where is proportional to it is contained in NCG at any plus a constant where the constant depends on the border conditions obtained from experimental data.
where is a dynamical constant. The border conditions Equation (4) expressed by Equation (5):
where and, are the initial moisture and equilibrium moisture, respectively [21]. The Isothermal Dehydration Process develops from conditions of Equation (5). Integrating Equation (4):
From Equation (6) the resulting is:
Then, the moisture percentage for any time is:
By substituting border conditions in Equation (8), obtains Equations (9) and (10)
By substituting Equations (9) and (10) into Equations (4) and (8), respectively, obtains Equations (11) and (12), Where is the Isothermal Dehydration Rate for all times .
Developing the term that corresponds to the moisture ratio is expressed by Equation (13) for the hydration process [21,22,23], and can also be expressed by the right part, which is the solution to the second Fick’s law
where is summation terms, is corn grain radius, and is an effective diffusivity coefficient.
Then Isothermal Dehydration Rate can be calculated using two methods: (1) from the first-derivative of Equations (12) and (2) by employing Equation (11). Therefore:
Border conditions for Equation (14) are shown in Equation (15) following experimental data.
Therefore, Equations (16) and (17) are:
where is the initial dehydration rate, and which one will be applied to experimental results. In another analysis, obtains from Equation (12) to give Equation (18).
To explain the isothermal dehydration process adequately, to the Equations (19) and (20), there are limits.
Therefore and .
Evaluating the second Fick’s law solution when then:
Employing value into Equation (9) then:
Then, the moisture rate is calculating as a function of . In this work, is named Diffusivity Rate. Therefore:
4. Results and Discussion
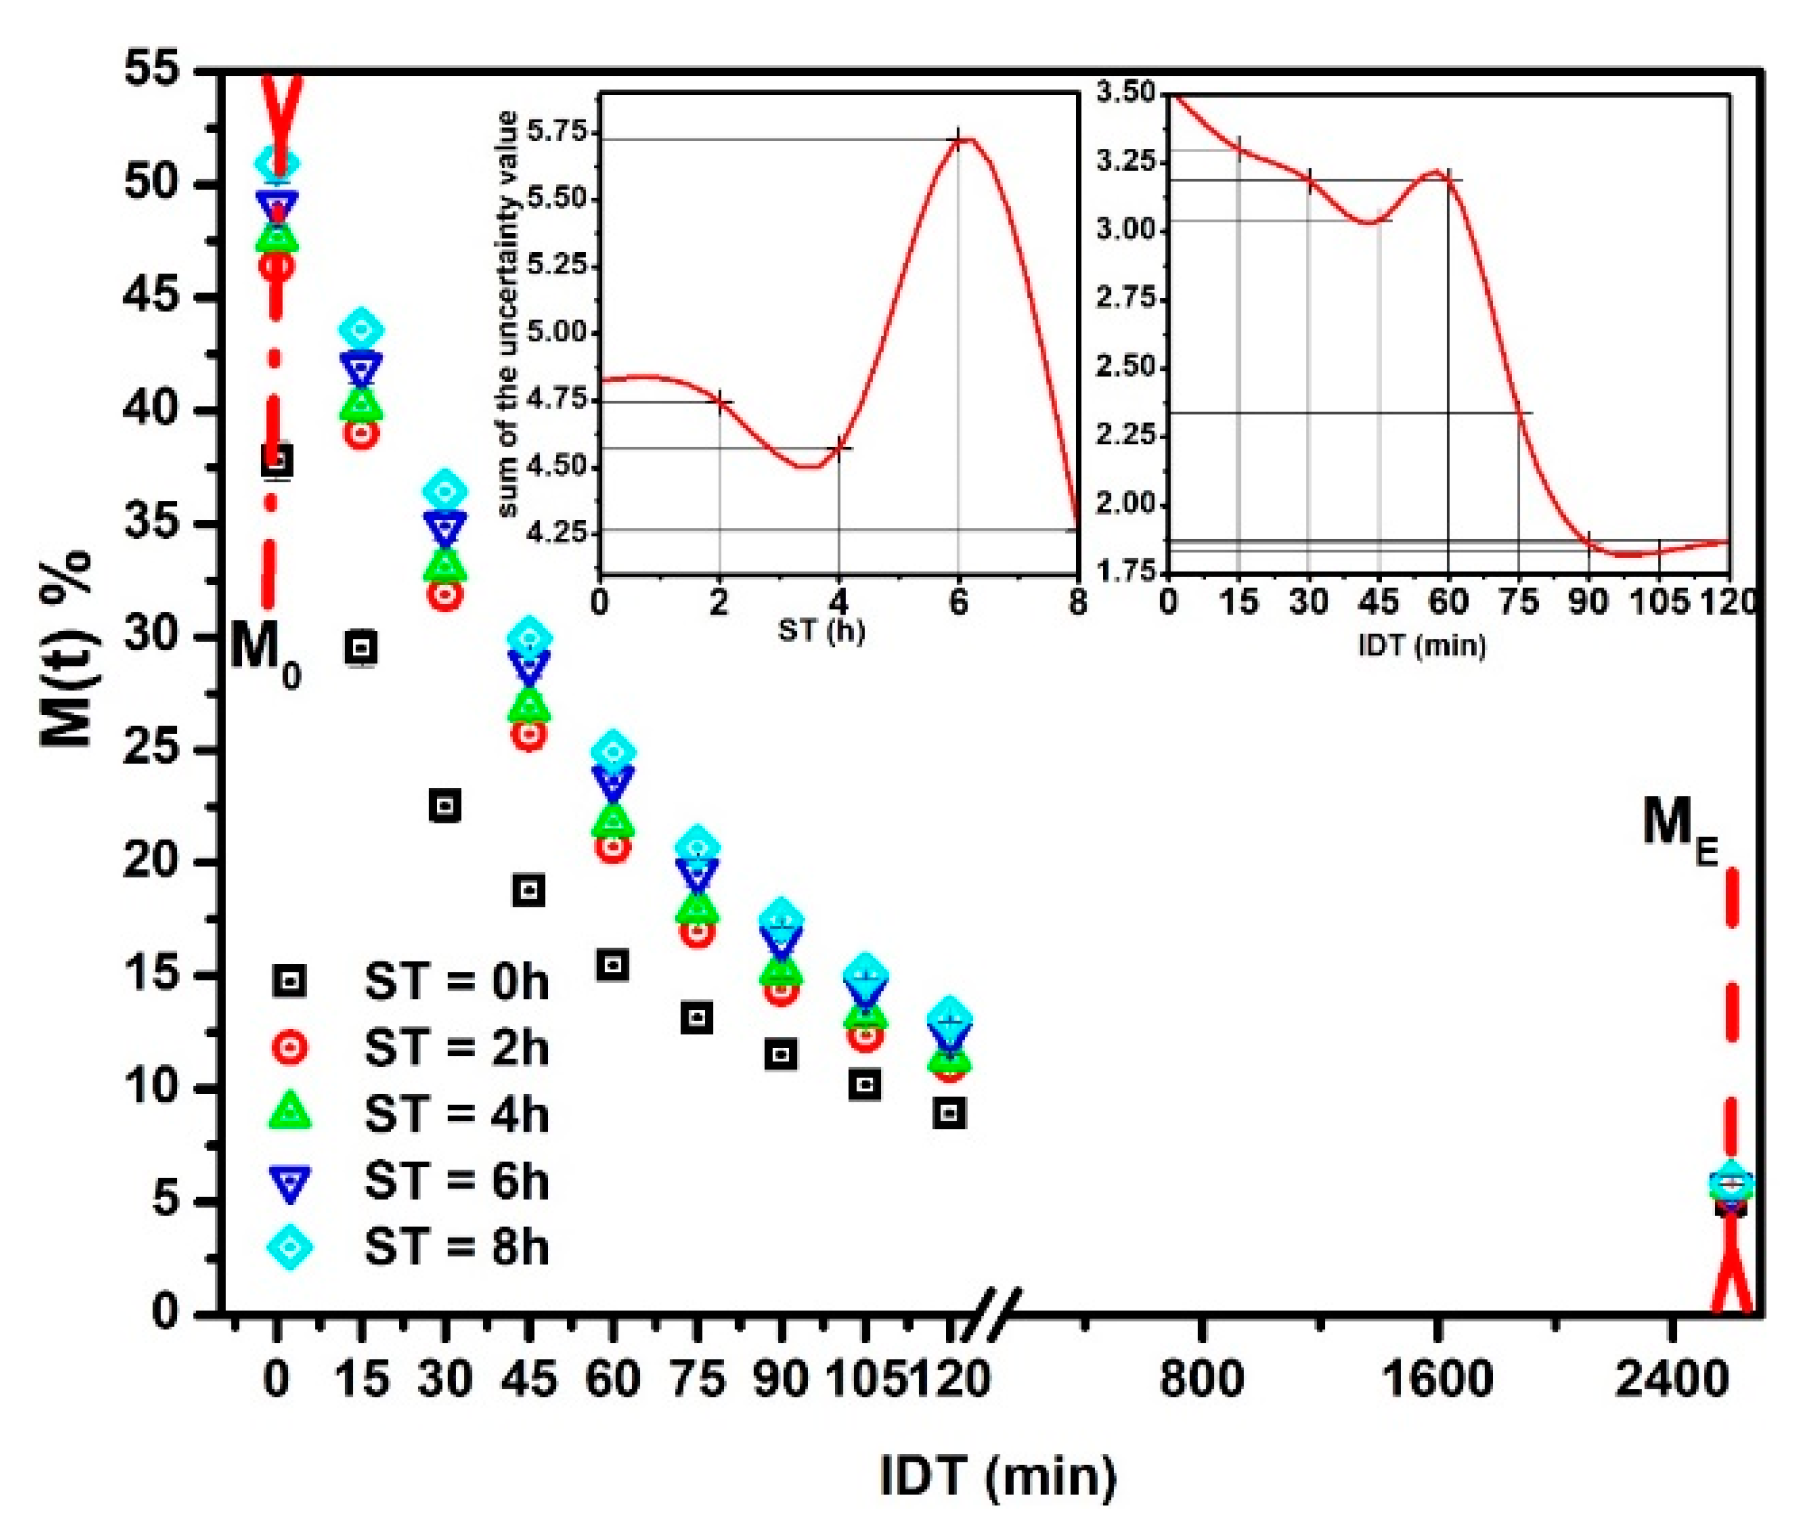
The experimental versus IDT data (points) for ST = 0, 2, 4, 6 and 8 h are depicted in Figure 1. The reproducibility (R2) of fitting has a determination value in the 0.994 ≤ R2 ≤ 0.999 interval. These R2 values establish the Equation (9) validation to predict the NCG dehydration kinetics as a function of ST. That is, the predicted results will have an uncertainty within the ±0.181–±0.993 interval. All the versus IDT curves display a similar aspect. The sample with ST = 0, with only cooked alkaline water (black squares), shows a significant difference as compared with others for ST ≠ 0. The initial moisture is lower for ST = 0 because, with only cooking time, the water absorbed is less. When ST increases, increases significantly [22,23]. vs. IDT results show similar curves to those reported by [24,25]. The insets in Figure 1 indicate that higher ST and IDT, uncertain values tend to stabilize in lower values. As a consequence, if the ST-IDT couple of data increases, the measurement reproducibility improves. Nevertheless, in general, the tendency to increase is from high to low IDT values. The importance of this statistical experimental information is that the uncertain values are small; thus, each experimental datum is satisfactory, followed by the mathematical model.
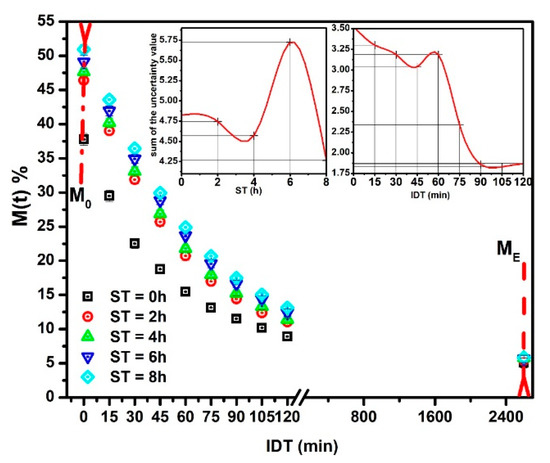
Figure 1.
NCG- experimental points versus IDT for different ST values.
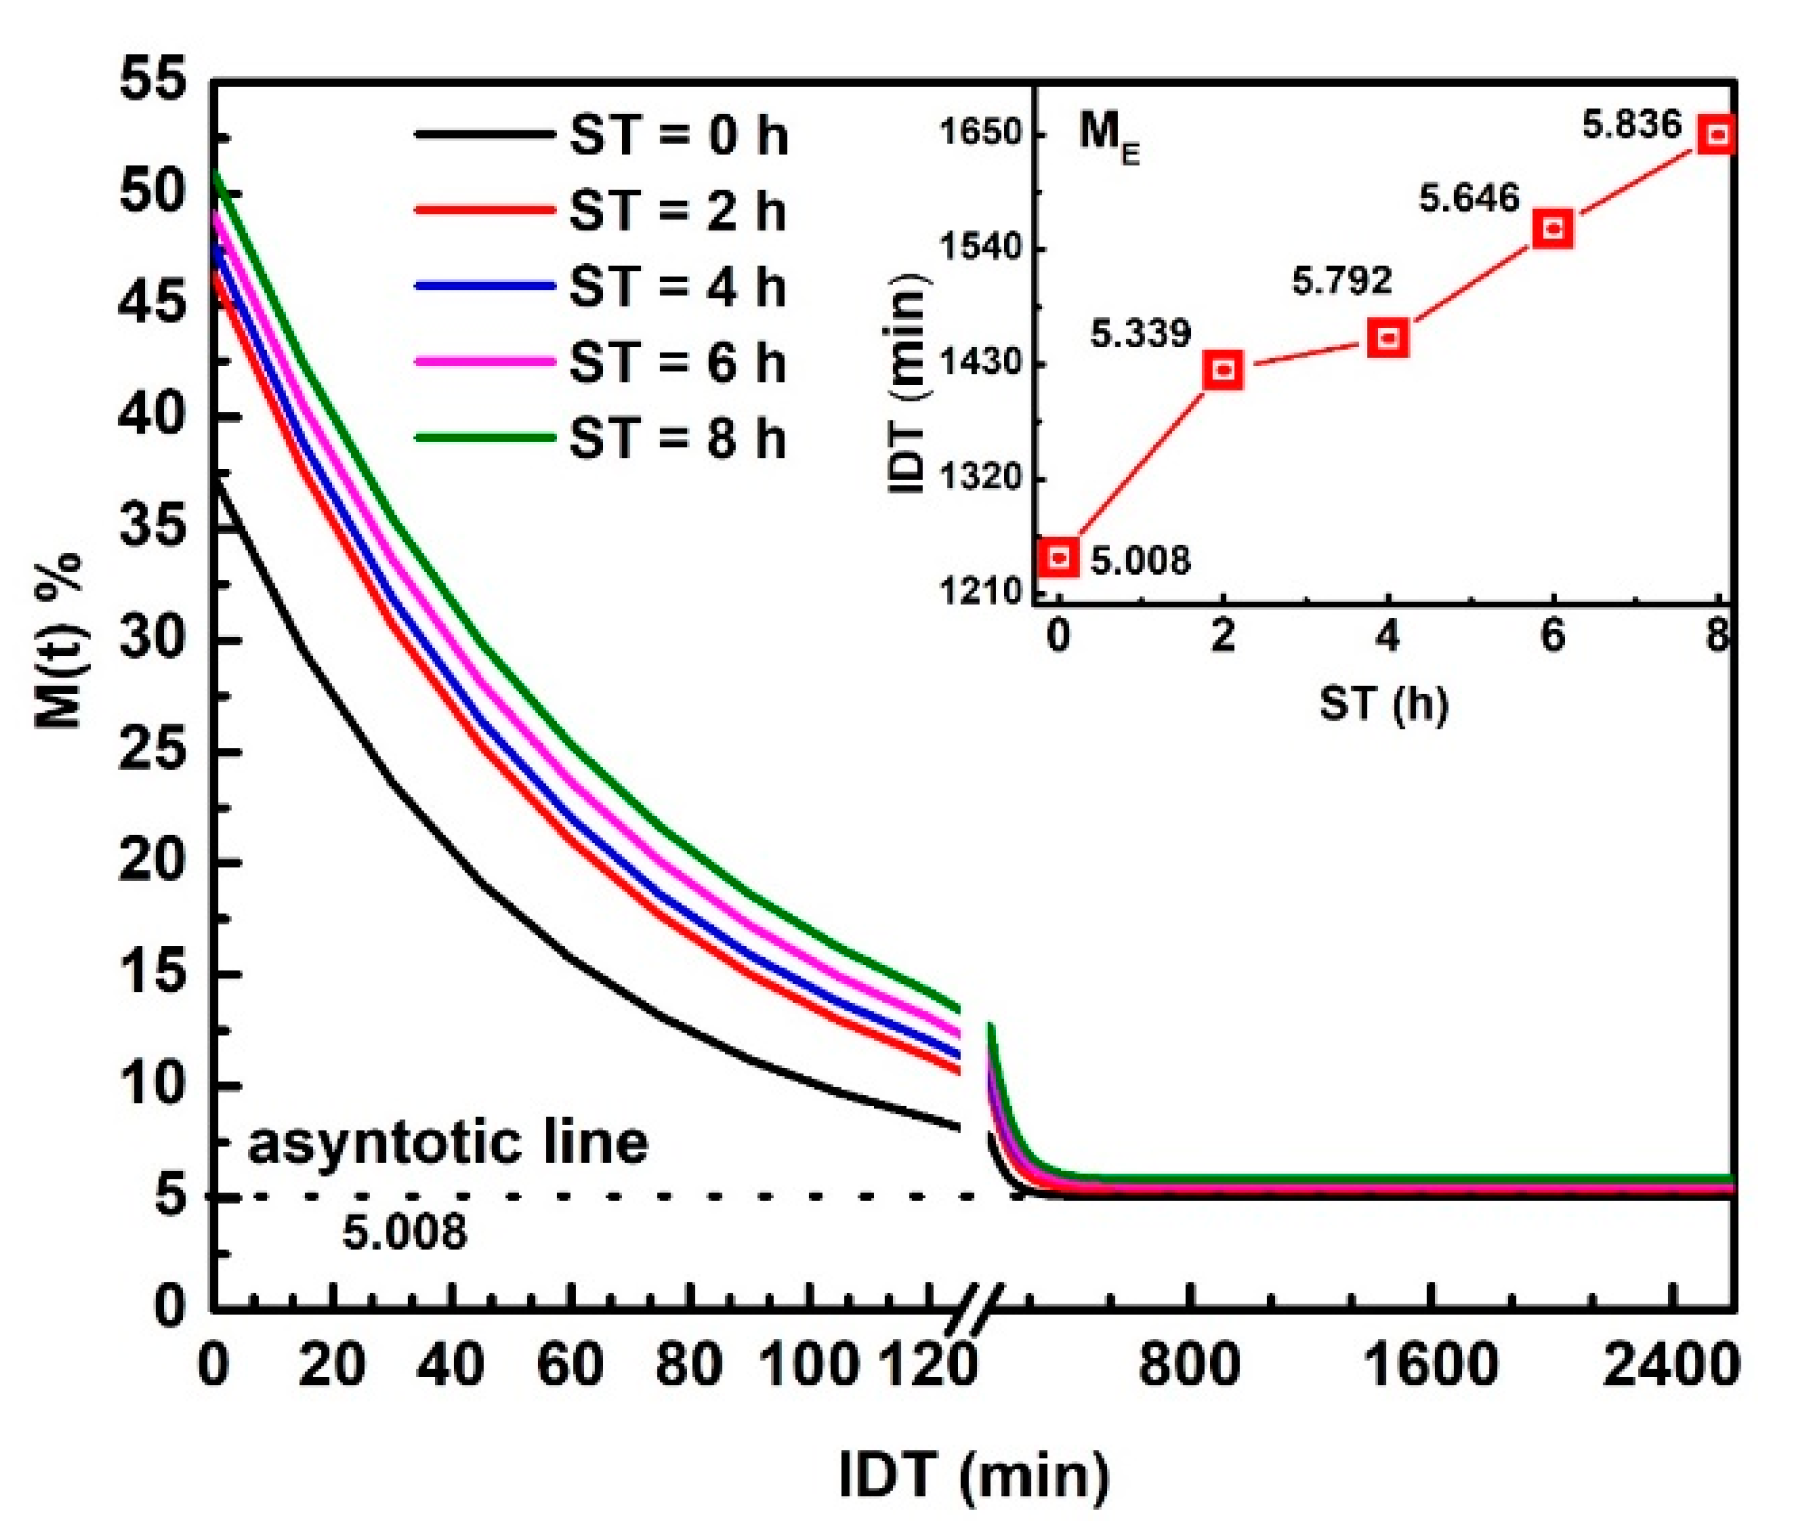
Figure 2 displays versus IDT curves fitting in the 0 ≤ IDT≤ 2600 min intervals of time. represents the moisture data within the range from up to .The three , , and , parameters were obtained from the fitting. The inset plots IDT vs. ST; numbers above each point indicate IDT to reach for every ST [25]. Notice how IDT to obtain increases as ST rises. The IDT versus ST data tendency does not follow smooth increases. The non-smooth, gradual variation of data along a smooth line is not due to errors since they are contained within the size of plotted points. The ST increases have a significant effect on , which influences the corn masa performance after the NCG milling in a stone mill, affecting the tortillas as a final product. Observe that the moisture tends to be an asymptotic value when IDT tends to infinite. is the new endogenous moisture limit in all samples, which is similar for all ST and is represented by an asymptotic value in versus IDT curve.
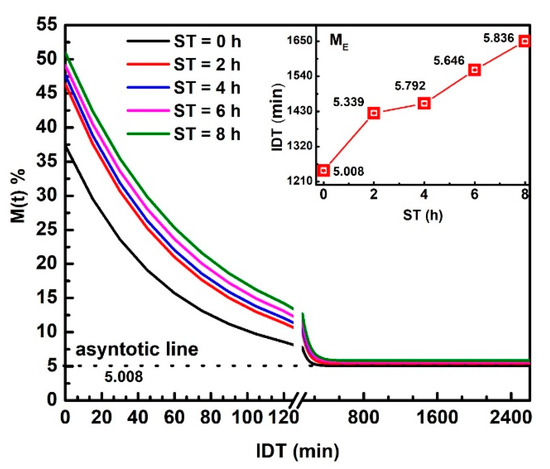
Figure 2.
NCG- fitting as a function of IDT for the ST values studied. The inset exhibits IDT vs. ST, numbers above each point indicate IDT to reach .
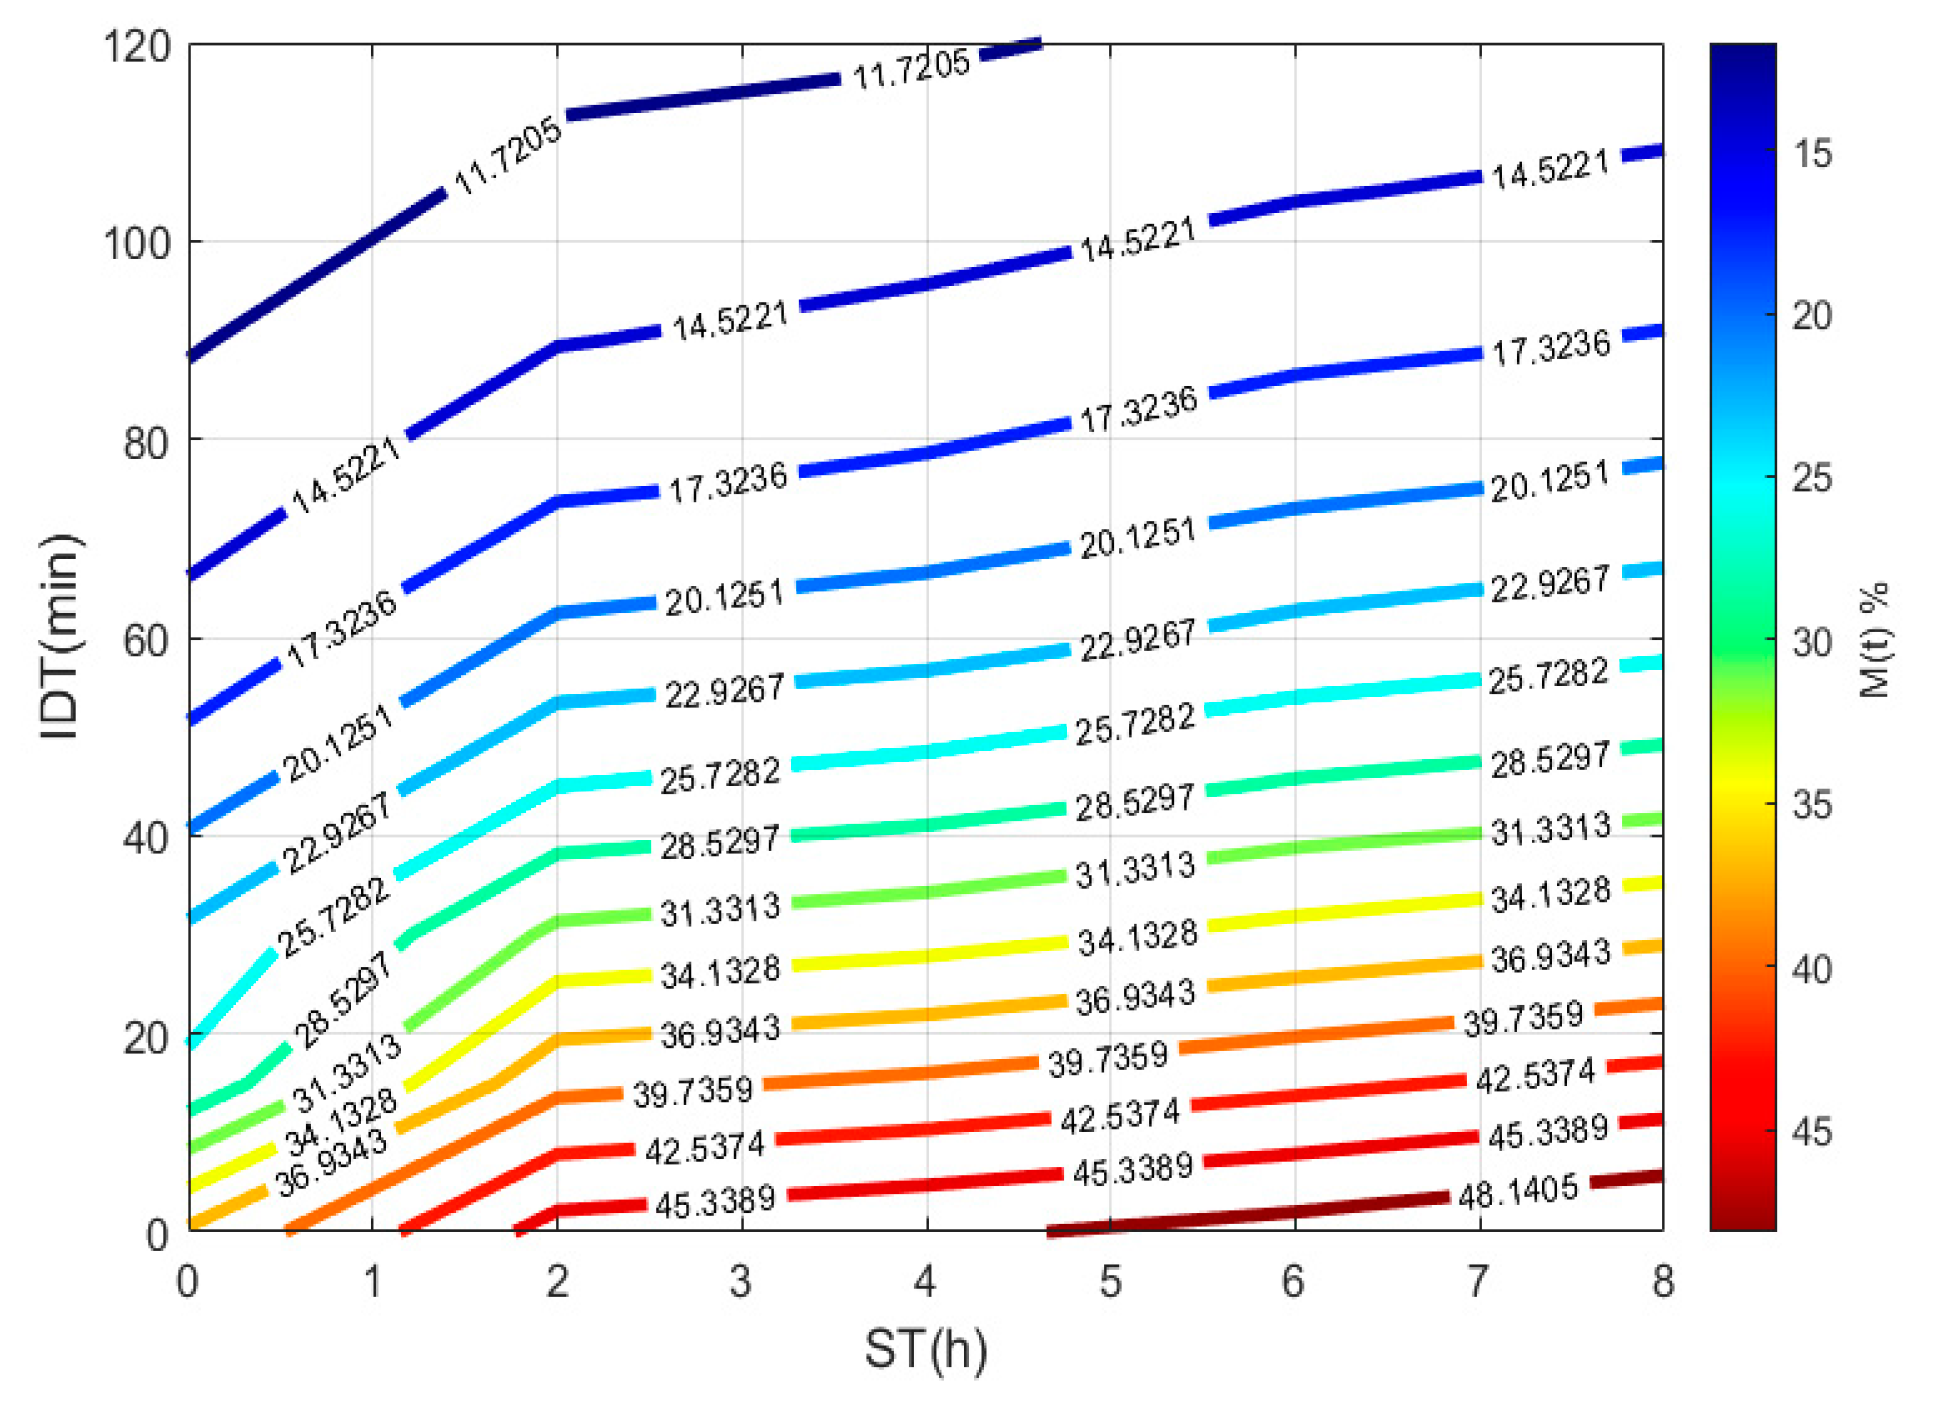
To plot Figure 3, a 3D matrix-graph with contour(X,Y,Z,n) is used, to obtain moisture percentages isolines, where x = ST, y = IDT, Z == moisture constant, and n = 14. The exercise practical-technological utility can summarize in (a) needed time prediction for the TNP-NCG process plus dehydration up to moisture needed to prepare the desired product. (b) instantaneous nixtamalized corn flour preparation containing 19–15% moisture to diminish the salmonella growth during storage. (c) instantaneous nixtamalized corn flour moisture percentage standardization for use in labs [25,26,27].
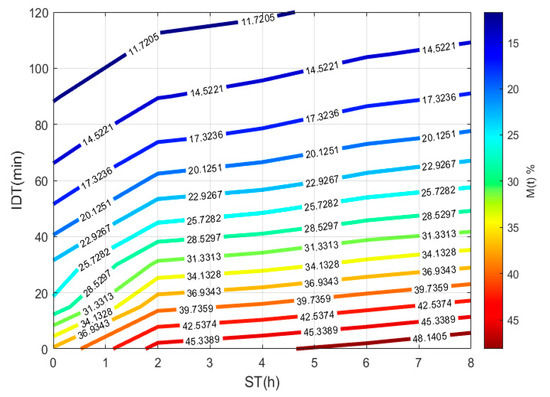
Figure 3.
IDT versus ST, where the final product with a specific moisture percentage can be obtained.
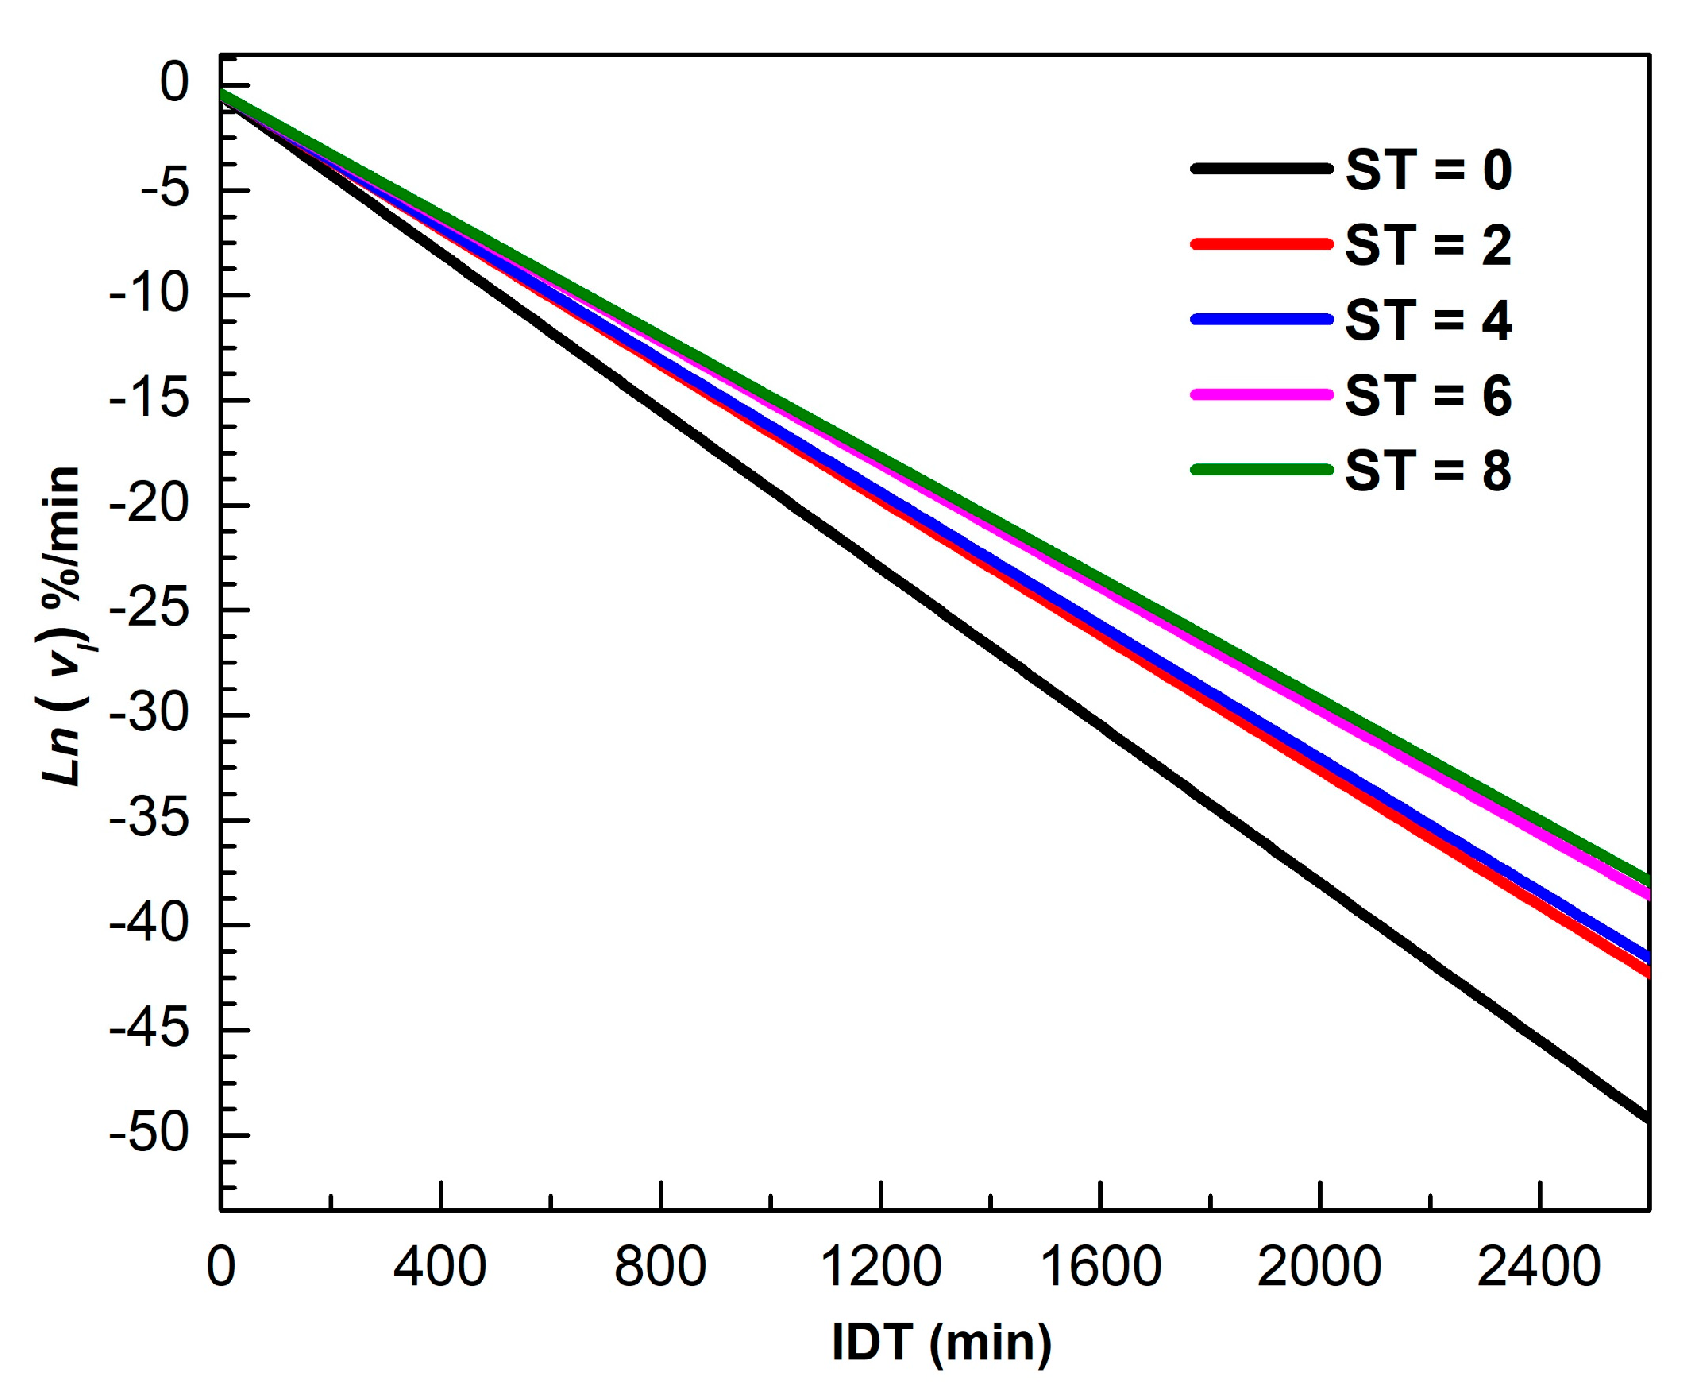
Figure 4 shows for different ST of in the 0 ≤≤ 2600 min interval. The logarithm scale in the vertical axis facilitates visualization for longer times. The mathematical description of is valid for all isothermal dehydration processes, where the slope represents the dynamical constant.

Figure 4.
Ln versus IDT for different ST.
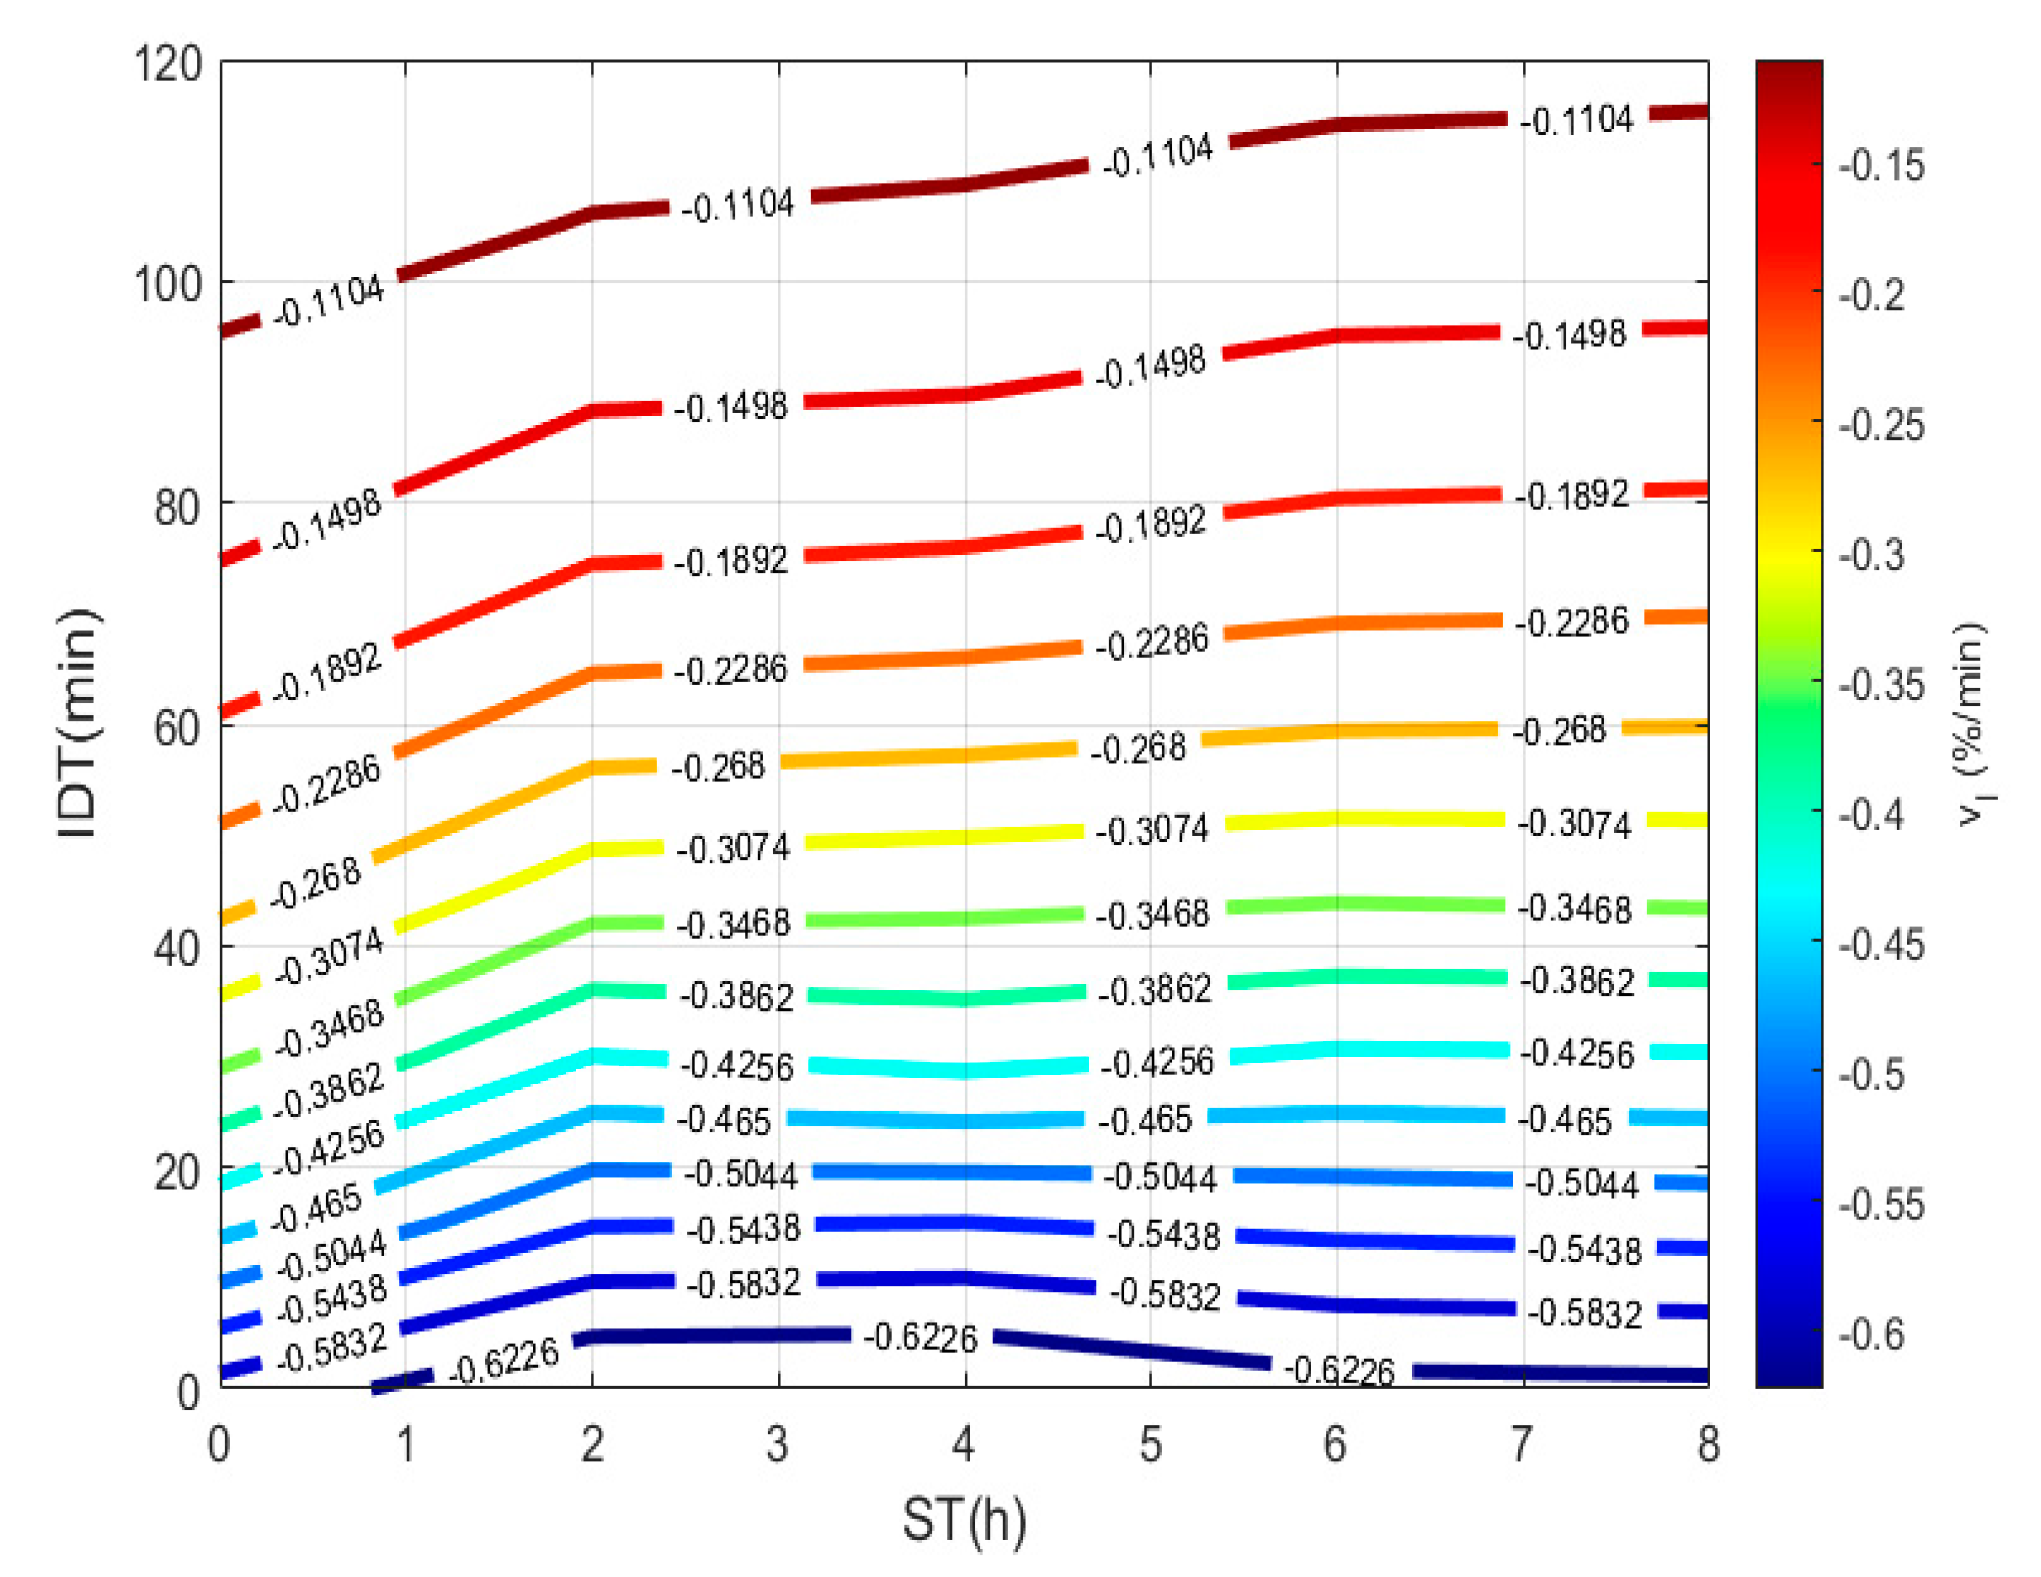
To plot Figure 5, a 3D matrix-graph with contour(X,Y,Z,n) is used to obtain dehydration rate isolines, where x = ST, y = IDT, Z == constant rate and n = 14. From data obtained from Equation (11) and listed in Table 1, the rate, in the 0 to 8 h interval, for any ST experimental point can reproduce, and in intermediate points predicted in the 0 to 120 min range. A negative sign physically represents the hydration percentage lost during the NCG dehydration process. The , which shows a continuous representation during the dehydration process, depends on ST that can be conveniently applied to loss of moisture when being cooked. Thus, corn performance rises to increase the quality of the tortilla.

Figure 5.
NCG dehydration rate using dehydration time vs. ST.

Table 1.
Isothermal Dehydration Rate. Equations for every ST.
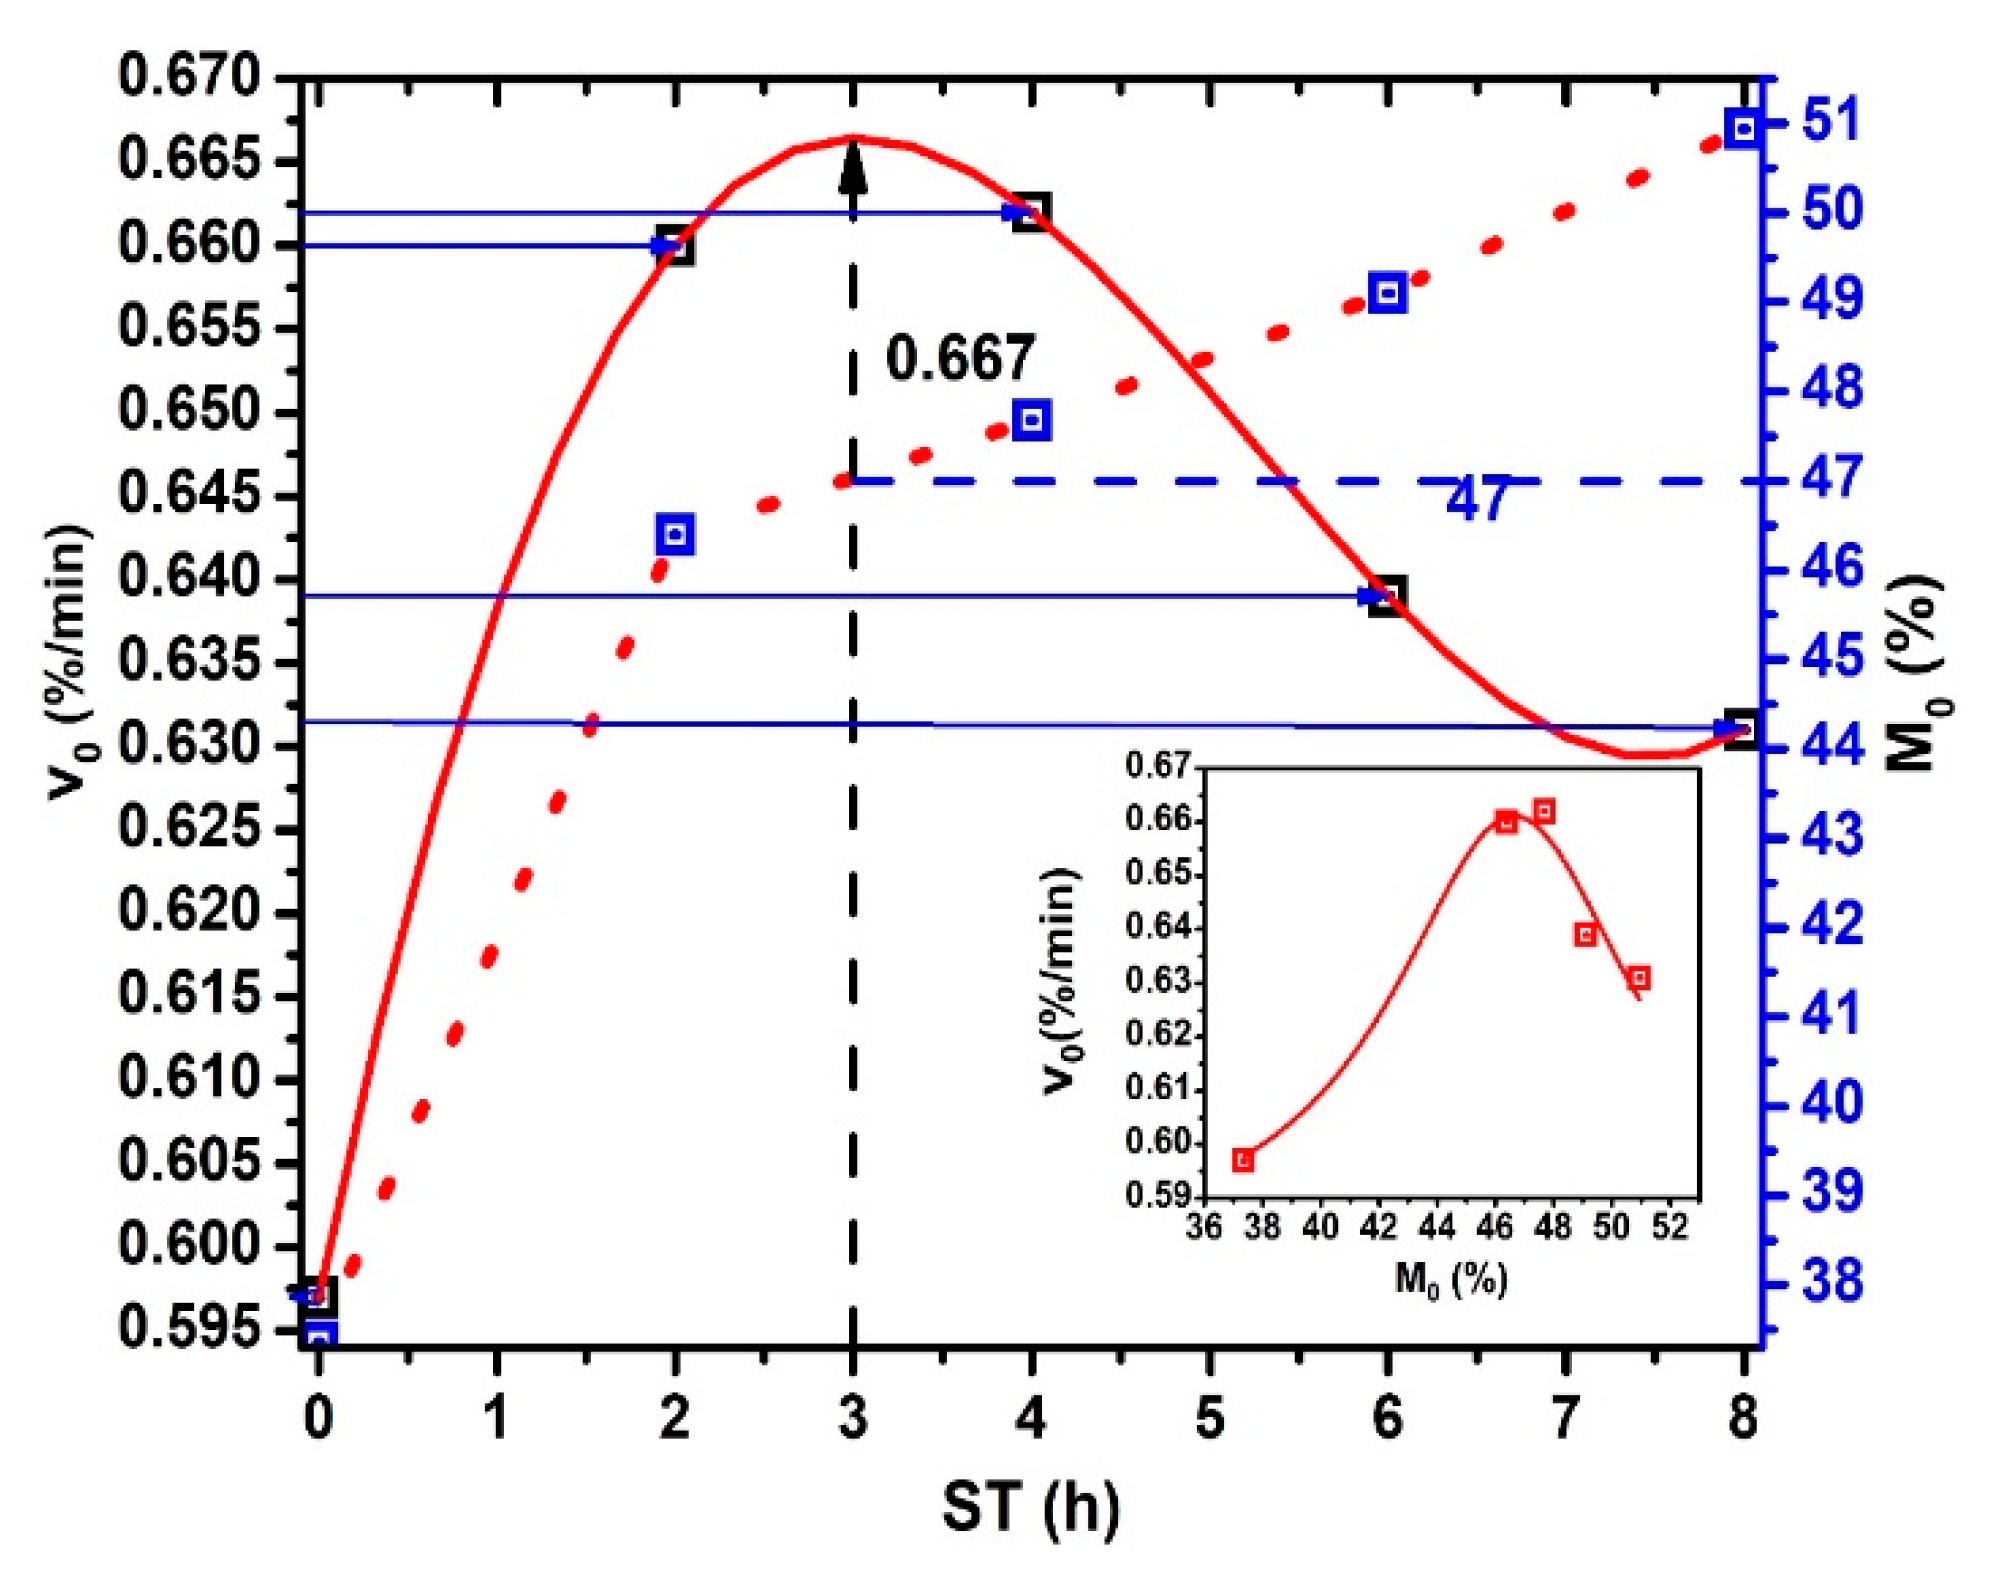
The initial dehydration rate versus ST plot shows in Figure 6. Notice that obtains when → 0 and, is calculating for each ST due to , , and are particular values for each ST. The continuous red line, drawn as an extrapolation, predicts maximum moisture of 47% for ST = 3 h (see the crossing point between the blue dash line and the red dash line projecting by the black dash line until the red extrapolation curve) and decreases like an inverted sigmoid curve in the 3 ≤ ST ≤ 8 interval. This values for ST > 3 h can be associated with: (a) increase of both gelatinization and solubilization process of the starches in the NCG periphery. (b) Then, decreasing is the consequence of the gelatinized starch and Ca(OH)+- Ca++ composite formed during hydrolysis. The Ca(OH)+, and Ca++ ions effect on the amylose and amylopectin mix in starch is more relevant for molecular crosslinking) [23,26,27,28], (c) there may be increase bonding into calcium ions, amylose, and amylopectin hydroxyl groups in gelatinized starches [29,30], and (d) the decreasing the cracking of NCG during drying. also decreases due to a total gelatinization of starch, which shows a radial dependence from the surface to center in the more NCG external layers, as was shown by the lack of different scanning calorimetry profiles generation. [29,30]. When 7 ≤ ST ≤ 8 interval, a relative minimum can be observed. The importance of minimum stabilization when ST increases reflect the homogenization and retention of in the NCG internal structure related to the NCG performance when converted to corn masa. Equal values observed in the curve for different moisture percentages and ST values. These behaviors reflect structural properties in the NCG periphery, which modulate , and indicate the possible presence of pericarp fragments for low ST values. In this way, the total or chemical partial degradation (porous formation) of the superficial pericarp area during TNP is revealed by the physical-chemical analysis of nejayote [30,31]. The increasing when ST increases strongly relates to pericarp chemical degradation during the TNP. The inset figure shows the relationship between vs. . Lorentz’s profile is very clear.
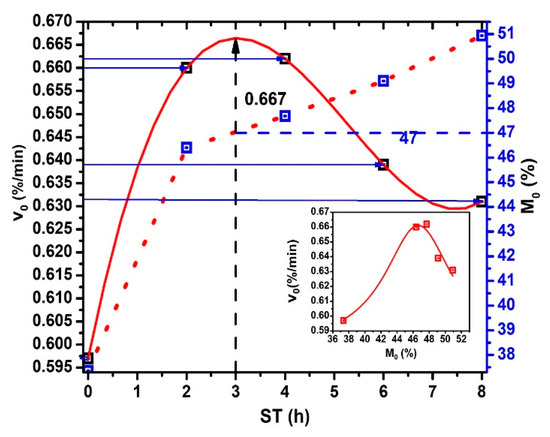
Figure 6.
and vs. ST.
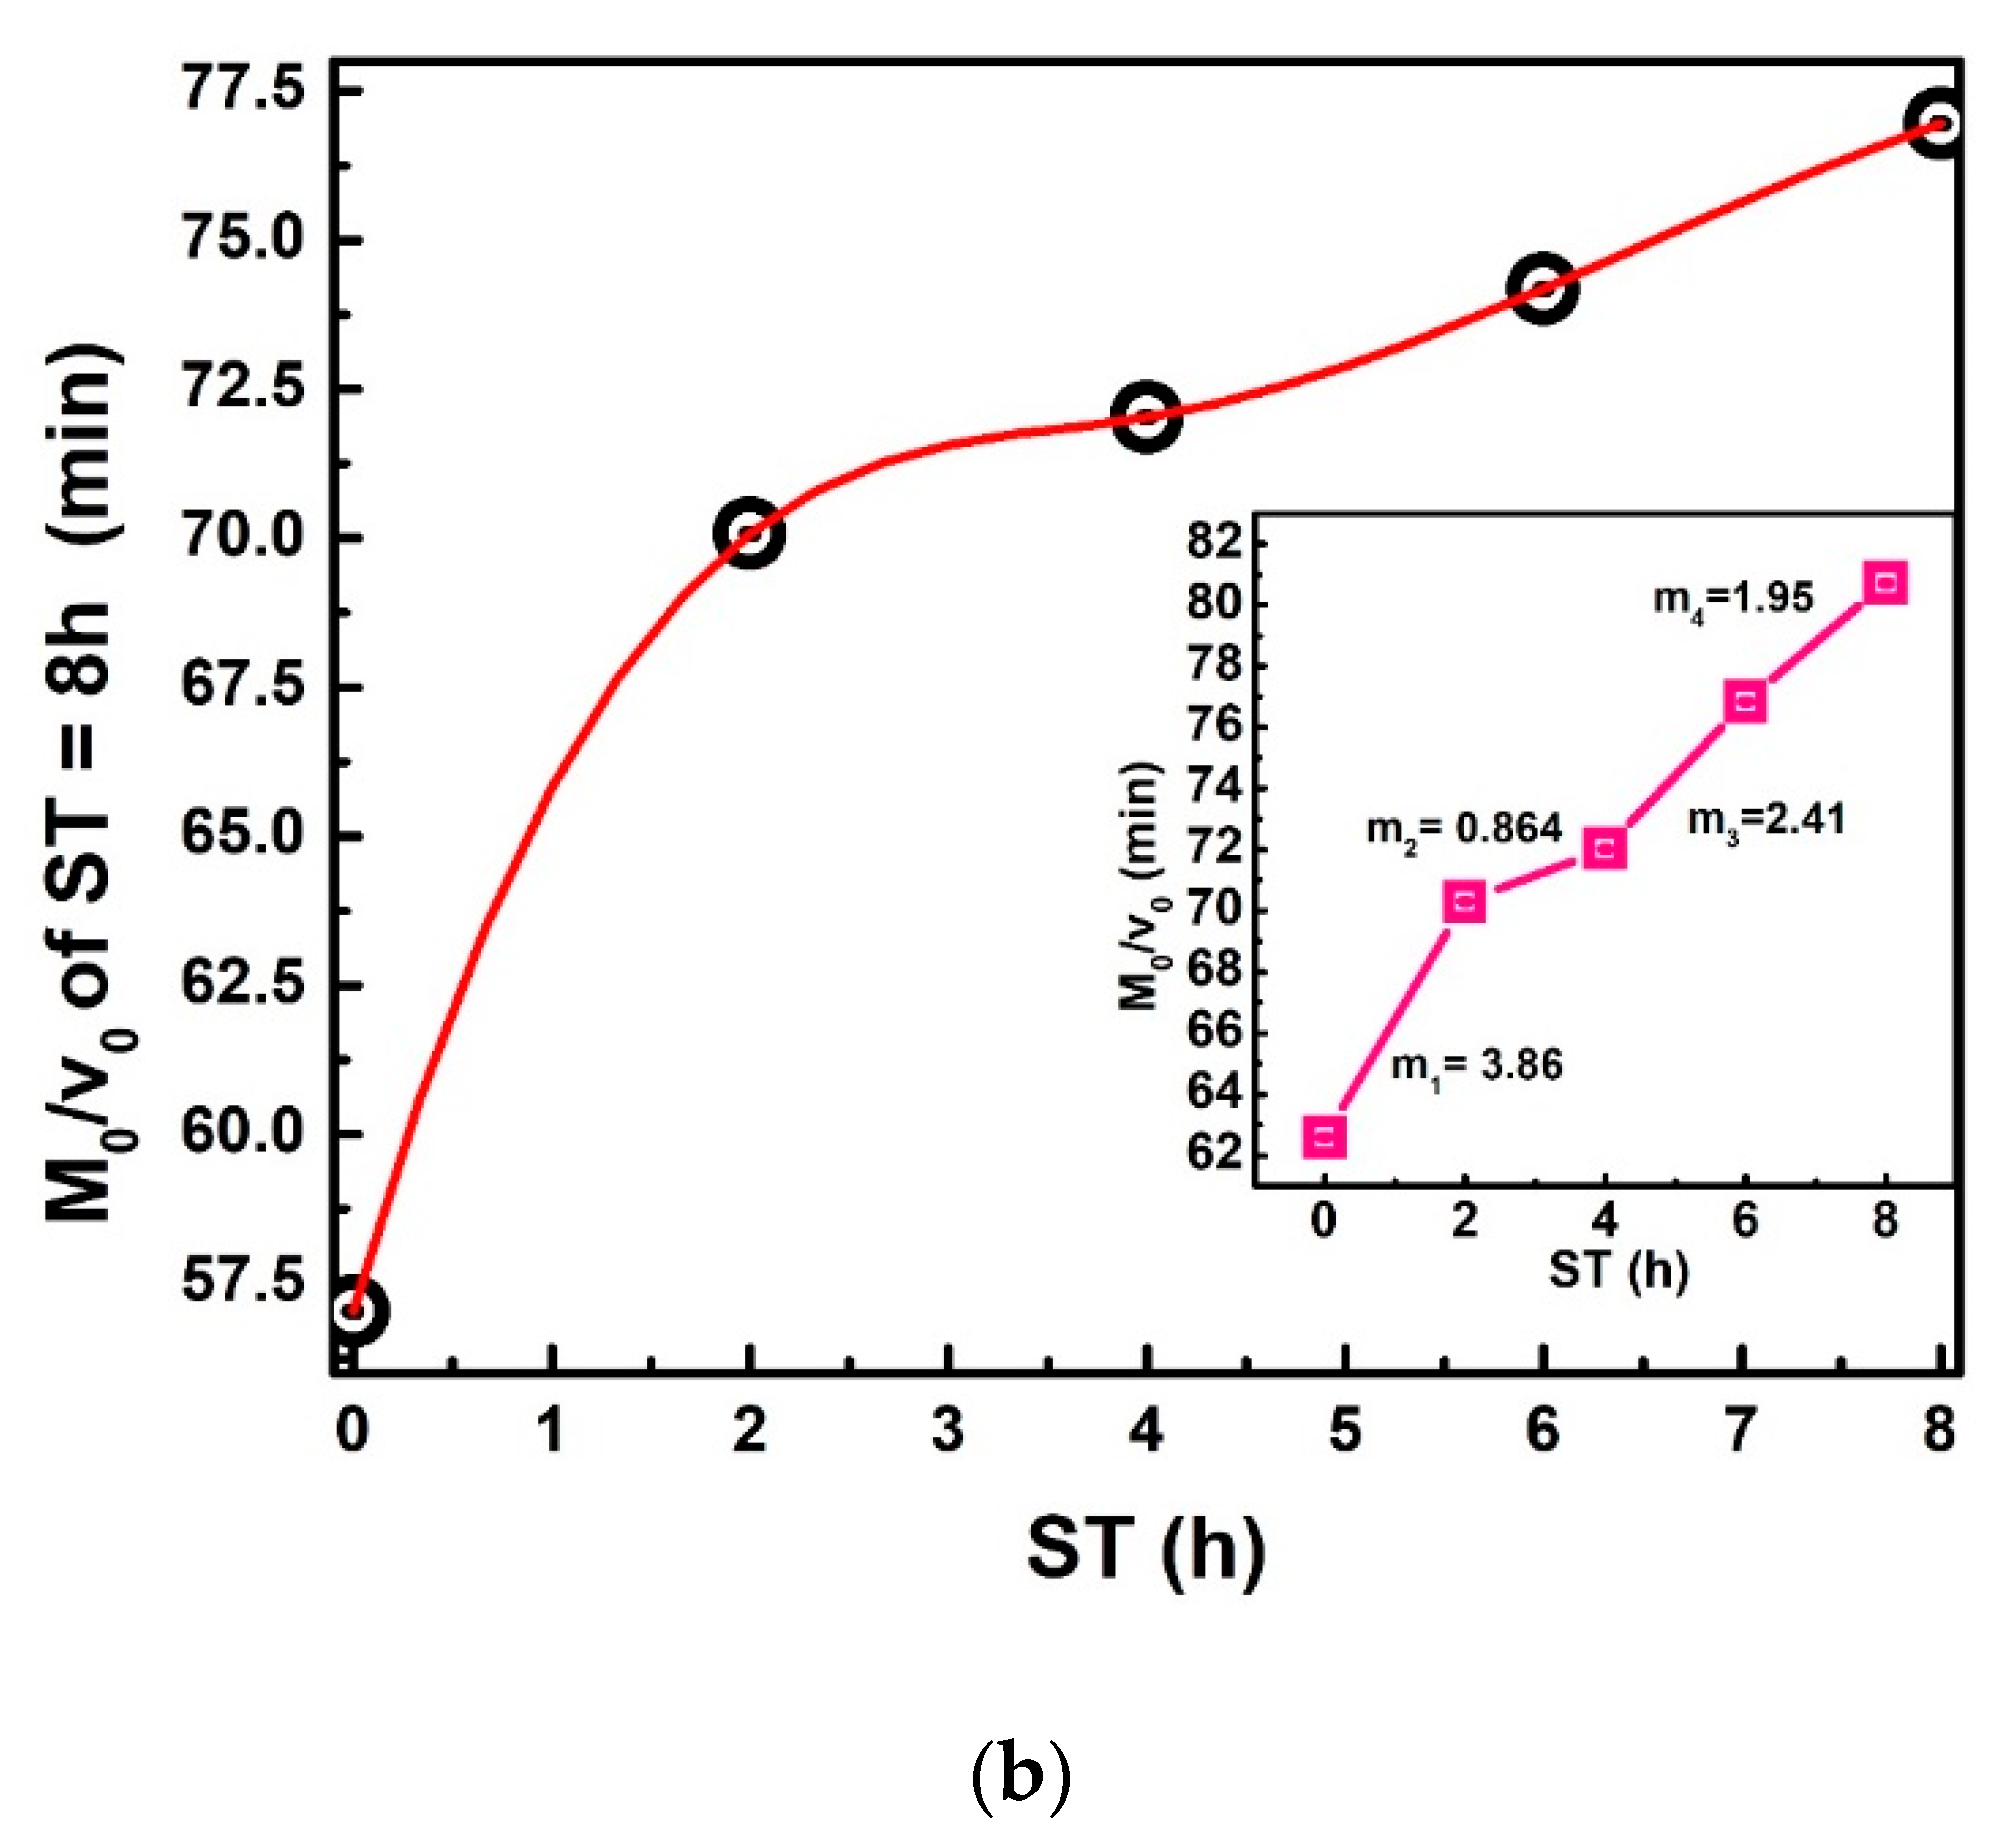
To plot Figure 7a, Equation (23) is used. The relevance of this equation rests on the comparison of two straight-line equations with a negative slope. The first equals , and the second is directly proportional to , where and is the slope in straight lines and a = 0.0049 m; the average radius of the corn grain [30,31]. The practical value of obtains between 2.56 × 10⁻⁶ to 2.26 × 10⁻⁶ m2/h. The decreases when ST increases, as can be observed in the inset of Figure 7a. Moreover, the decreasing can have a direct correlation with the calcium percentage increase when ST also increases, which modifies the NCG structural properties on different parts of the grain (pericarp, tip-cap, germ, and endosperm). The ratio / versus ST is displayed in Figure 7b, is the same value as that dividing the dimensionless drying rate [20,32]. This Figure ideally represents the IDT required for dehydration of the total grain percentage moisture . This red curve does not show a discontinuous slope where the points join through straight lines with a variable slope (m1, m2, m3, m4), / increases when ST increases. Furthermore, these increases have the same proportion.
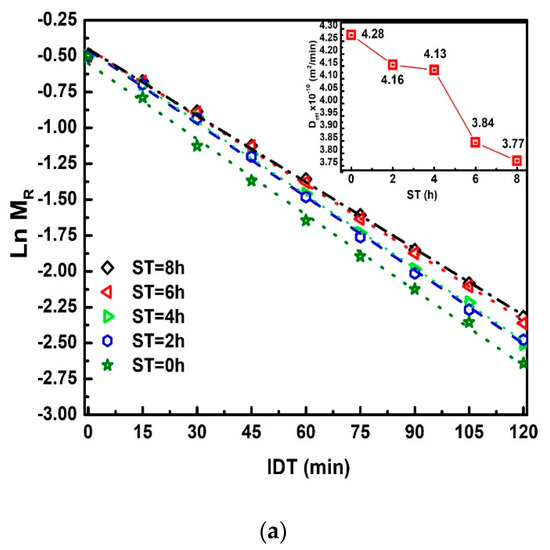
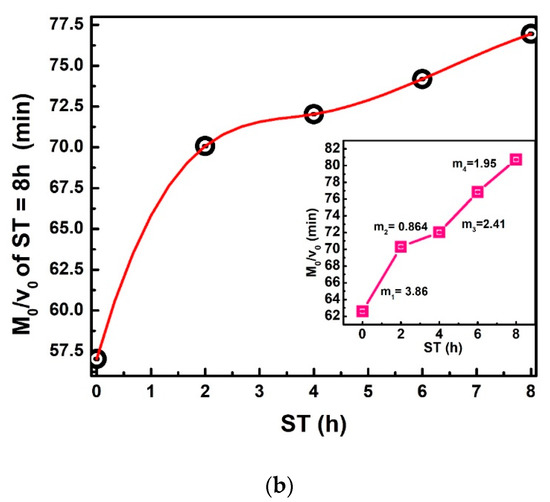
Figure 7.
(a) vs. ST, The inset exhibits 𝐷𝑒𝑓𝑓 vs. ST. (b) / vs. ST. The red line has been drawn as an approximation.
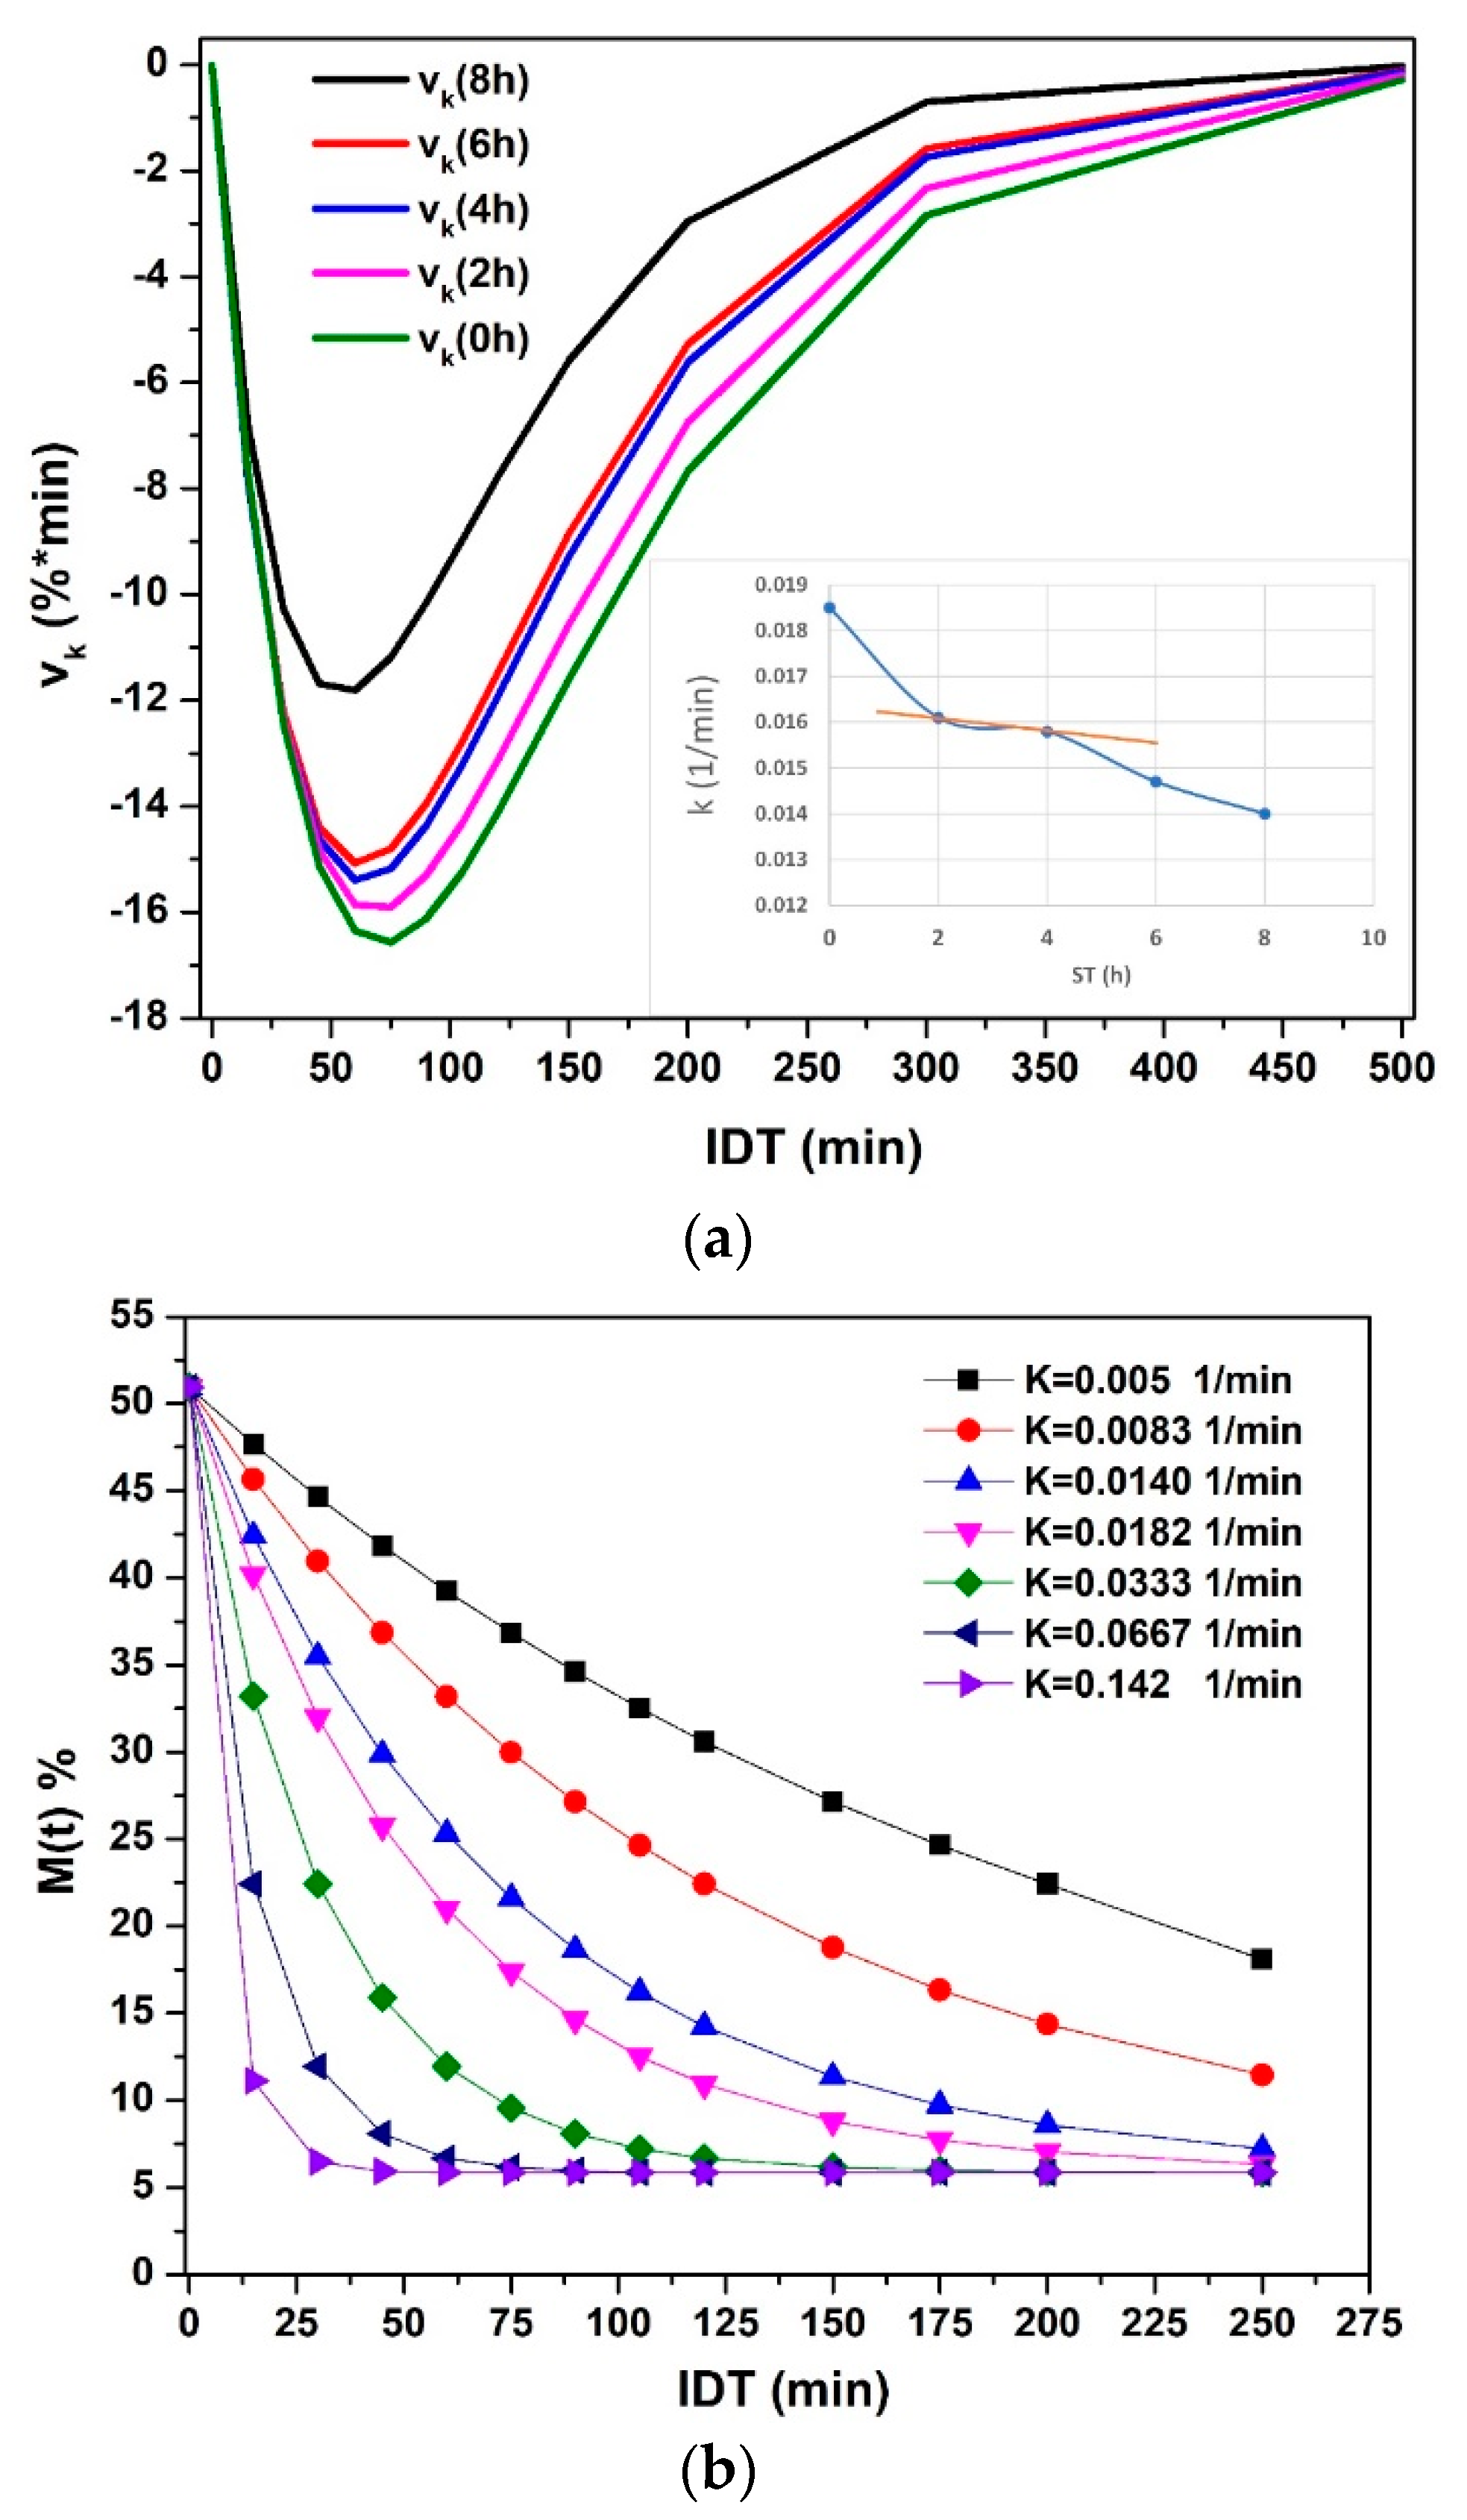
Figure 8a plots named in this manuscript as the isothermal diffusivity rate; this value represents the variation of for any t value resulting from the first derivative of the values of , and that it is directly proportional to the and inversely proportional to the square off of the grain surface. Before 100 min, a maximum value of change in the moisture present in the corn grains obtains. When the ST is greater, the maximum loss of moisture is achieved in a long time. A shift to the right indicates that diffusivity slows down due to the bonds of water, and the hydroxyl groups of amylose and amylopectin occur at higher bond energy between them by means of the Van Der Valls forces and a greater number of links [18,26,33,34,35]. After 300 min of drying, the behavior becomes asymptotic with the abscissa axis. The pericarp thickness degradation process is represented by the gap between NCG with/without ST, which is maintained from 0 to 200 min [19,34,36]. Figure 8b. Hypothetical values are plotted as a simulation of the change over time, knowing that changes during the ST because the solubility of Ca(OH)2 is greater when the temperature of the nejayote decreases. Analyzing Figure 8b, when increases, the NCG capacity to retain water molecules decreases. From another point of view, when decreases, the water retention capacity increases. Then the H+ and -OH bridges of amylose and amylopectin (from being crystalline to amorphous) with water increase significantly, caused by the physical-chemical process of crosslinking during the gelatinization of the starches on the outermost surface of the NCG [18,19,23,26,27,34,35,36,37,38,39,40,41,42,43,44]. In conclusion, the curvature of the graphed functions indicates that when increases, the number of free water molecules in the interior structures of the NCG is greater, and it evaporates quicker than the water.

Figure 8.
(a) The diffusivity rate vs. IDT. (b) The moisture percentage vs. IDT with the variation of for ST = 8 h.
5. Conclusions
The most important conclusions of this manuscript are: Firstly, a first-order differential equation describes dehydration kinetics on NCG and, usable in educational texts. Secondly, the mathematical model predicts the necessary moisture percentage and dehydration rate of NCG through isolines. Thirdly, when h of ST decreases although increases, thus these values benefit obtaining a better tortilla yield. Fourth, when and decreases when ST increases. Fifth, the lime solubility into nejayote for different ST has a very strong relationship with the diffusivity rate values on NCG. These can have important technological applications such as: (a) milling of NCG in different moisture percentages (dry milling < 15%, 45% < humid milling < 15% and with plenty of water > 45%) according to selected isolines, (b) to avoid the growth of pathogenic organisms’ moisture < 15%, (c) better manufacturing, handling and storage control on various products (snacks, chips, toasts, flours, etc.). Also, it can improve the standardization of the organoleptic and performance properties of the tortilla, the extraction of starches with different alkaline treatments, and carrying out measurements in laboratories, among other known processes. In addition, the manufacturing costs can reduce significantly. It is important to note that the future for the tortilla industry is in the ascendency due to the vast Latin-American emigration to the USA. However, the fifty million Latins still follow their traditional eating habits of which tortillas are an essential part.
Author Contributions
Conceptualization, M.Á.G.-S., J.R.-M., J.L.F.-M., H.E.M.-F.; formal analysis, M.T.Z.-Á., J.L.F.-M.; methodology, M.Á.G.-S., J.L.F.-M., M.T.Z.-Á., H.E.M.-F.; investigation, M.Á.G.-S., J.L.F.-M., J.R.-M.; supervision, J.L.F.-M.; validation, J.L.F.-M., J.R.-M., H.E.M.-F.; visualization, M.Á.G.-S., K.A.A.C.; writing—original draft, J.L.F.-M., J.R.-M.; writing—review and editing, J.L.F.-M., J.R.-M., M.T.Z.-Á., K.A.A.C.; funding acquisition, J.L.F.-M.; project administration, J.L.F.-M.; resources, J.L.F.-M. All authors have read and agreed to the published version of the manuscript.
Funding
This research received no external funding.
Data Availability Statement
Not applicable.
Acknowledgments
The authors thank to Secretaría de Investigación y de Posgrado del Instituto Politécnico Nacional (SIP-IPN 20210300). A special acknowledgment to Orlando Zelaya for his incessant support to research in the TNP, since 20 years ago. The authors want to honor CICATA-IPN Legaria for its 25th anniversary.
Conflicts of Interest
The authors declare not conflict of interest.
Nomenclature
| ST | Steeping Time (hours) |
| NCG | Nixtamalized Corn Grains |
| IDT | Isothermal Dehydration Time (minutes) |
| TNP | Traditional Nixtamalization Process |
| a | meters: average corn grains radius |
| Ca(OH)2 | % calcium hydroxide or lime SX: uncertainty. Dimensionless |
| m2/min, effective diffusivity coefficient | |
| 1/min, dynamical proportionality constant (time). | |
| 1/min, dynamical proportionality constant (time and ). | |
| U.S. | mesh open size |
| (%) percentage moisture at | |
| initial moisture (%) | |
| (%) equilibrium moisture percentage | |
| (%) saturate moisture | |
| moisture ratio | |
| %/min, Initial Dehydration Rate | |
| %/min, Isothermal Dehydration Rate | |
| %*min, Diffusivity Rate | |
| time (minutes) | |
| isolines | are color lines with the same value but with different simultaneous IDT and ST values. |
References
- Bryant, C.M.; Hamaker, B.R. Effect of Lime on Gelatinization of Corn Flour and Starch. Cereal Chem. J. 1997, 74, 171–175. [Google Scholar] [CrossRef]
- Gutiérrez-Cortez, E.; Rojas-Molina, I.; Rojas, A.; Arjona, J.; Villegas, M.D.L.A.C.; Zepeda-Benítez, Y.; Velazquez-Hernandez, R.; Ibarra-Alvarado, C.; Rodríguez-García, M. Microstructural changes in the maize kernel pericarp during cooking stage in nixtamalization process. J. Cereal Sci. 2010, 51, 81–88. [Google Scholar] [CrossRef]
- Acosta-Estrada, B.A.; Serna-Saldívar, S.O.; Gutiérrez-Uribe, J.A. Chemopreventive effects of feruloyl putrescines from wastewater (Nejayote) of lime-cooked white maize (Zea mays). J. Cereal Sci. 2015, 64, 23–28. [Google Scholar] [CrossRef]
- Zazueta, C.; Ramos, G.; Fernández-Muñoz, J.L.; Rodriguez, M.E.; Acevedo-Hernandez, G.; Pless, R.C. A Radioisotopic Study of the Entry of Calcium Ion into the Maize Kernel During Nixtamalization. Cereal Chem. J. 2002, 79, 500–503. [Google Scholar] [CrossRef]
- Rojas-Molina, I.; Gutiérrez, E.; Rojas, A.; Cortés-Álvarez, M.; Campos-Solís, L.; Hernández-Urbiola, M.; Arjona, J.L.; Cornejo, A.; Rodriguez-Garcia, M.E. Effect of Temperature and Steeping Time on Calcium and Phosphorus Content in Nixtamalized Corn Flours Obtained by Traditional Nixtamalization Process. Cereal Chem. J. 2009, 86, 516–521. [Google Scholar] [CrossRef]
- Ramos, G.; Pezet-Valdez, M.; O’Connor-Sánchez, A.; Placencia, C.; Pless, R.C. Hydration Rates for Various Types of Mexican Maize Based on Single-Kernel Measurements. Cereal Chem. J. 2004, 81, 308–313. [Google Scholar] [CrossRef]
- Abu-Ghannam, N.; McKenna, B. Hydration Kinetics of Red Kidney Beans (Phaseolus vulgaris L.). J. Food Sci. 1997, 62, 520–523. [Google Scholar] [CrossRef]
- Abu-Ghannam, N. Modelling textural changes during the hydration process of red beans. J. Food Eng. 1998, 38, 341–352. [Google Scholar] [CrossRef]
- Haladjian, N.; Fayad, R.; Toufeili, I.; Shadarevian, S.; Sidahmed, M.; Baydoun, E.; Karwe, M. pH, temperature and hydration kinetics of faba beans (Vicia faba L.). J. Food Process. Preserv. 2003, 27, 9–20. [Google Scholar] [CrossRef]
- Yildirim, A.; Bayram, M.; Böner, M. Hydration Kinetics of Ultrasound Treated Chickpeas (Cider arietinum L.) During Soaking. Harran Tarım ve Gıda Bilimleri Dergisi 2012, 16, 26–35. [Google Scholar]
- Ulloa, J.; Bonilla-Sánchez, C.; Ortíz-Jiménez, M.; Rosas-Ulloa, P.; Ramírez-Ramírez, J.C.; Ulloa-Rangel, B. Rehydration properties of precooked whole beans (Phaseolus vulgaris) dehydrated at room temperature. CyTA J. Food 2013, 11, 94–99. [Google Scholar] [CrossRef]
- Garvín, A.; Augusto, P.; Ibarz, R.; Ibarz, A. Kinetic and thermodynamic compensation study of the hydration of faba beans (Vicia faba L.). Food Res. Int. 2019, 119, 390–397. [Google Scholar] [CrossRef]
- Oroian, M. The temperature hydration kinetics of Lens culinaris. J. Saudi Soc. Agric. Sci. 2017, 16, 250–256. [Google Scholar] [CrossRef] [Green Version]
- Solomon, W. Effect of barrel temperature on rehydration kinetics of direct-expandedtefflour breakfast cereal. J. Food Process. Eng. 2008, 31, 469–487. [Google Scholar] [CrossRef]
- Gowen, A.; Abu-Ghannam, N.; Frias, J.; Oliveira, J. Modelling the water absorption process in chickpeas (Cicer arietinum L.)—The effect of blanching pre-treatment on water intake and texture kinetics. J. Food Eng. 2007, 78, 810–819. [Google Scholar] [CrossRef]
- Gowen, A.; Abu-Ghannam, N.; Frias, J.; Oliveira, J. Influence of pre-blanching on the water absorption kinetics of soybeans. J. Food Eng. 2007, 78, 965–971. [Google Scholar] [CrossRef]
- Visvanathan, R.; Balkrishna, P.S. Temperature Dependent Hydration Kinetics of Finger Millet (Eleusine coracana) and Foxtail Millet (Setaria italica) Grain. Agric. Eng. Today 2019, 43, 10–17. [Google Scholar]
- Gutiérrez-Cortez, E.; Rojas-Molina, I.; Zambrano-Zaragoza, M.; Espinosa-Arbeláez, D.; Rojas, A.; García, J.; Cornejo-Villegas, M.; Rodriguez-Garcia, M.E. The mass transport phenomenon through pericarp during the nixtamalization process. Food Bioprod. Process. 2016, 100, 477–486. [Google Scholar] [CrossRef]
- Tolaba, M.P.; Suarez, C.; Viollaz, P.E. The use of a diffusional model in determining the permeability of corn pericarp. J. Food Eng. 1990, 12, 53–66. [Google Scholar] [CrossRef]
- Pineda-Gomez, P.; Rosales-Rivera, A.; Gutierrez-Cortez, E.; Rodriguez-Garcia, M.E. Comparative analysis of the water diffusion in the corn grains, with and without pericarp during the thermo-alkaline treatment. Food Bioprod. Process. 2020, 119, 38–47. [Google Scholar] [CrossRef]
- Fernández-Muñoz, J.L.; Acosta-Osorio, A.; Gruintal-Santos, M.; Zelaya-Angel, O. Kinetics of water diffusion in corn grain during the alkaline cooking at different temperatures and calcium hydroxide concentration. J. Food Eng. 2011, 106, 60–64. [Google Scholar] [CrossRef]
- Simal, S.; Femenia, A.; Garau, M.; Rosselló, C. Use of exponential, Page’s and diffusional models to simulate the drying kinetics of kiwi fruit. J. Food Eng. 2005, 66, 323–328. [Google Scholar] [CrossRef]
- Brenda, C.-J.; Marcela, G.-M.; De Dios, F.-C.J.; Raúl, A.A.-Z.; Eduardo, M.-S. Effect of steeping time and calcium hydroxide concentration on the water absorption and pasting profile of corn grits. J. Food Eng. 2014, 122, 72–77. [Google Scholar] [CrossRef]
- Arámbula, V.; Mauricio, S.; Figueroa, C.; González-Hernández, J.; Ordorica, F. Corn Masa and Tortillas from Extruded Instant Corn Flour Containing Hydrocolloids and Lime. J. Food Sci. 1999, 64, 120–124. [Google Scholar] [CrossRef]
- Zagaceta, M.T.; Palma, R.; Aguilar, K.A.; Fernández-Muñoz, J.L. Efecto del tiempo de reposo en la cinética de deshidratación de los granos de maíz nixtamalizados. Inf. Tecnol. 2020, 31, 149–158. [Google Scholar] [CrossRef]
- Rojas-Molina, I.; Mendoza-Avila, M.; Cornejo-Villegas, M.D.L.; Del Real-López, A.; Rivera-Muñoz, E.; Rodríguez-García, M.; Gutiérrez-Cortez, E. Physicochemical Properties and Resistant Starch Content of Corn Tortilla Flours Refrigerated at Different Storage Times. Foods 2020, 9, 469. [Google Scholar] [CrossRef] [PubMed] [Green Version]
- Hu, Z.; Yang, Y.; Lu, L.; Chen, Y.; Zhu, Z.; Huang, J. Kinetics of water absorption expansion of rice during soaking at different temperatures and correlation analysis upon the influential factors. Food Chem. 2021, 346, 128912. [Google Scholar] [CrossRef]
- Fernández-Muñoz, J.L.; Zelaya-Angel, O.; Cruz-Orea, A.; Sánchez-Sinencio, F. Phase Transitions in Amylose and Amylopectin under the Influence of Ca(OH)2 in Aqueous Solution. Anal. Sci. 2001, 17, s308–s341. [Google Scholar] [CrossRef]
- Rojas-Molina, I.; Gutierrez-Cortez, E.; Palacios, A.; Baños, L.; Hernández, J.L.P.; Guzman, S.H.; Pineda-Gomez, P.; Rodriguez-Garcia, M.E. Study of Structural and Thermal Changes in Endosperm of Quality Protein Maize During Traditional Nixtamalization Process. Cereal Chem. J. 2007, 84, 304–312. [Google Scholar] [CrossRef]
- Valderrama-Bravo, C.; Rojas-Molina, A.; Gutiérrez-Cortez, E.; Oaxaca-Luna, A.; De la Rosa-Rincón, E.; Rodriguez-Garcia, M.E. Mechanism of calcium uptake in corn kernels during the traditional nixtamalization process: Diffusion, accumulation and percolation. J. Food Eng. 2010, 98, 126–132. [Google Scholar] [CrossRef]
- Pineda-Gómez, P.; Acosta-Osorio, A.; Coral, D.F.C.; Rosales-Rivera, A.; Echeverri, L.A.S.; Rojas-Molina, I.; Rodriguez-Garcia, M.E. Physicochemical characterization of traditional and commercial instant corn flours prepared with threshed white corn. CyTA J. Food 2012, 10, 287–295. [Google Scholar] [CrossRef]
- Pineda-Gómez, P.; Rosales-Rivera, A.; Rodriguez-Garcia, M.E. Modeling calcium and water intake in threshed corn grain during thermo-alkaline treatment. J. Food Eng. 2012, 113, 434–441. [Google Scholar] [CrossRef]
- Kouhila, M.; Moussaoui, H.; Lamsyehe, H.; Tagnamas, Z.; Bahammou, Y.; Idlimam, A.; Lamharrar, A. Drying characteristics and kinetics solar drying of Mediterranean mussel (mytilus galloprovincilis) type under forced convection. Renew. Energy 2020, 147, 833–844. [Google Scholar] [CrossRef]
- Silvas-García, M.I.; Ramírez-Wong, B.; Torres-Chávez, P.I.; Medina-Rodríguez, L.C.; Salazar-García, M.G.; Ledesma-Osuna, A.I. The use of xanthan gum in the nixtamalization process: A review. In Xanthan Gum: Applications and Research Studies; Universidad de Sonora: Sonora, Mexico, 2016; pp. 33–66. [Google Scholar]
- Santiago-Ramos, D.; Figueroa-Cárdenas, J.D.D.; Véles-Medina, J.J. Viscoelastic behaviour of masa from corn flours obtained by nixtamalization with different calcium sources. Food Chem. 2018, 248, 21–28. [Google Scholar] [CrossRef] [PubMed]
- Miano, A.C.; Ibarz, A.; Augusto, P.E.D. Ultrasound technology enhances the hydration of corn kernels without affecting their starch properties. J. Food Eng. 2017, 197, 34–43. [Google Scholar] [CrossRef]
- García-Armenta, E.; Caro-Corrales, J.J.; Cronin, K.; Reyes-Moreno, C.; Gutiérrez-Dorado, R. Heat transfer simulation in corn kernel during nixtamalization process. Rev. Mex. Ing. Química 2020, 19, 745–754. [Google Scholar] [CrossRef]
- Musita, N. Nixtamalization application to shelf life of corn flour. IOP Conf. Ser. Mater. Sci. Eng. 2021, 980, 012033. [Google Scholar] [CrossRef]
- Serna-Saldivar, S.O. Understanding the functionality and manufacturing of nixtamalized maize products. J. Cereal Sci. 2021, 99, 103205. [Google Scholar] [CrossRef]
- Escalante-Aburto, A.; Mariscal-Moreno, R.M.; Santiago-Ramos, D.; Ponce-García, N. An Update of Different Nixtamalization Technologies, and Its Effects on Chemical Composition and Nutritional Value of Corn Tortillas. Food Rev. Int. 2019, 36, 456–498. [Google Scholar] [CrossRef]
- Prasad, K.; Vairagar, P.; Bera, M. Temperature dependent hydration kinetics of Cicer arietinum splits. Food Res. Int. 2010, 43, 483–488. [Google Scholar] [CrossRef]
- Miano, A.C.; Augusto, P.E.D. The Hydration of Grains: A Critical Review from Description of Phenomena to Process Improvements. Compr. Rev. Food Sci. Food Saf. 2018, 17, 352–370. [Google Scholar] [CrossRef] [Green Version]
- Cheevitsopon, E.; Noomhorm, A. Kinetics of hydration and dimensional changes of brown rice. J. Food Process. Preserv. 2011, 35, 840–849. [Google Scholar] [CrossRef]
- Van Cauwenberge, J.E.; Bothast, R.J.; Kwolek, W.F. Thermal inactivation of eight Salmonella serotypes on dry corn flour. Appl. Environ. Microbiol. 1981, 42, 688–691. [Google Scholar] [CrossRef] [Green Version]

Publisher’s Note: MDPI stays neutral with regard to jurisdictional claims in published maps and institutional affiliations. |
© 2021 by the authors. Licensee MDPI, Basel, Switzerland. This article is an open access article distributed under the terms and conditions of the Creative Commons Attribution (CC BY) license (https://creativecommons.org/licenses/by/4.0/).