Abstract
The ongoing miniaturization of spectrometers creates a perfect synergy with the common advantages of near-infrared (NIR) spectroscopy, which together provide particularly significant benefits in the field of food analysis. The combination of portability and direct onsite application with high throughput and a noninvasive way of analysis is a decisive advantage in the food industry, which features a diverse production and supply chain. A miniaturized NIR analytical framework is readily applicable to combat various food safety risks, where compromised quality may result from an accidental or intentional (i.e., food fraud) origin. In this review, the characteristics of miniaturized NIR sensors are discussed in comparison to benchtop laboratory spectrometers regarding their performance, applicability, and optimization of methodology. Miniaturized NIR spectrometers remarkably increase the flexibility of analysis; however, various factors affect the performance of these devices in different analytical scenarios. Currently, it is a focused research direction to perform systematic evaluation studies of the accuracy and reliability of various miniaturized spectrometers that are based on different technologies; e.g., Fourier transform (FT)-NIR, micro-optoelectro-mechanical system (MOEMS)-based Hadamard mask, or linear variable filter (LVF) coupled with an array detector, among others. Progressing technology has been accompanied by innovative data-analysis methods integrated into the package of a micro-NIR analytical framework to improve its accuracy, reliability, and applicability. Advanced calibration methods (e.g., artificial neural networks (ANN) and nonlinear regression) directly improve the performance of miniaturized instruments in challenging analyses, and balance the accuracy of these instruments toward laboratory spectrometers. The quantum-mechanical simulation of NIR spectra reveals the wavenumber regions where the best-correlated spectral information resides and unveils the interactions of the target analyte with the surrounding matrix, ultimately enhancing the information gathered from the NIR spectra. A data-fusion framework offers a combination of spectral information from sensors that operate in different wavelength regions and enables parallelization of spectral pretreatments. This set of methods enables the intelligent design of future NIR analyses using miniaturized instruments, which is critically important for samples with a complex matrix typical of food raw material and shelf products.
1. Introduction
During the last four decades, near-infrared (NIR) spectroscopy (800–2500 nm; 12,500–4000 cm−1) has become one of the most attractive and used methods for food analysis and quality control for the following reasons: it represents a nondestructive analytical tool that allows a fast and simultaneous qualitative and quantitative characterization of a wide variety of samples with regard to their chemical compositions and physical attributes [1,2,3]. NIR spectroscopy is nowadays seen as a critical element to be successfully integrated into the modern system for food monitoring on its path to sustainability [4]. The last decade marked a rapid acceleration in the continuing trend of the miniaturization of NIR spectrometers. These devices significantly increase the flexibility of analysis; however, attention needs to be paid to the various factors that affect their performance in different scenarios [1,2,3,4,5,6]. Currently, it is a focused and very active research direction to systematically perform evaluation studies of the analytical accuracy and reliability of various miniaturized spectrometers available in the market [5,7].
NIR spectroscopy is a particularly potent tool for analyzing whole foods and highly processed products and their constituents [8,9,10,11,12,13,14]. The challenging characteristics of such analyses are commonly encountered in the agri-food sector [12,15,16] and the medicinal plant sector of the pharmaceutical industry [17,18,19], as well as in environmental monitoring and ecology studies [20,21,22,23]. As the result of chemical diversity and often challenging physical properties as well, such as the specific surface texture, the presence of layers resulting from biological structure of plant tissue [24] (e.g., husks), and even the presence of color, miniaturized NIR instruments often face serious challenges in the analysis of chemically complex, granular, and inhomogeneous samples typical for food items. Therefore, the applicability and analytical performance of miniaturized NIR spectrometers in such applications is the topic of extensive feasibility research, a factor of critical importance for establishing practical applications with high reliability.
It is noteworthy that the development of analytical applications of NIR spectroscopy originated from the needs of the agri-food sector, and its subsequent evolution was largely stimulated by the needs of the analyses required therein [11]. The decisive advance of this technique toward wide adoption was tightly coupled with the progress in the instrumentation, where the appearance of Fourier-transform (FT)-NIR spectrometers in early 1990s was the first major cornerstone [25,26]. The second breakthrough in technology can be easily associated with the introduction of portable and handheld instruments in the 2000s. However, from the conceptual point of view, the step into portability formed a much more decisive reshaping of the application horizon of this technique, as that breakthrough was the cornerstone of transiting the analysis from the lab to the site, which brought particular benefits to the agri-food sector [5].
Applications of miniaturized NIR spectroscopy in food-related scenarios connect to a variety of problems, in which the design and knowledge-based optimization of an analytical pathway is essential to maximize the practical gain from using this innovative technology (Figure 1). In this review article, we present an overview of the current research directions, with a critical inspection of the key elements constituting the advancement of the micro-NIR analytical framework for modern food analysis, quality control, and safety risk monitoring. In particular, attention is given to the importance of using combined tools integrated into the NIR analytical method, which improve its accuracy, reliability, and applicability. Advanced methods of calibration (e.g., artificial neural networks (ANNs)) directly improve the performance of miniaturized instruments in analyzing complex and challenging samples, equalizing the accuracy of these instruments with benchtop spectrometers. Two-dimensional correlation spectroscopy (2D-COS) yields insights into the relative sensitivity observed between different instruments toward specific NIR bands [27]. NIR spectra are intrinsically very complex with highly convoluted signals, which becomes an extremely strong feature in the case of complex, multiconstituent samples, such as those of natural origin [28,29]. Quantum-mechanical simulations of NIR spectra provide deep comprehension of the chemical information in the processed spectra. This method unveils the chemical structures correlated with meaningful features of calibration models [30]. These simulations also enable the interpretation of the instrumental differences observed between different handheld sensors in light of the chemical information of a given constituent, and to the prediction of the performance level of a spectrometer in a similar analysis. With the comprehension of the chemical information analyzed by each spectrometer, the effectiveness of the sensor-fusion approach can be further validated. Finally, calibration transfer enables sharing of the trained calibration models between various NIR sensors, providing a large practical gain in efficiency. This suite of methods enables a better-informed design of future NIR spectroscopic analyses, which is particularly important for most samples with a complex matrix (Figure 1) [31].
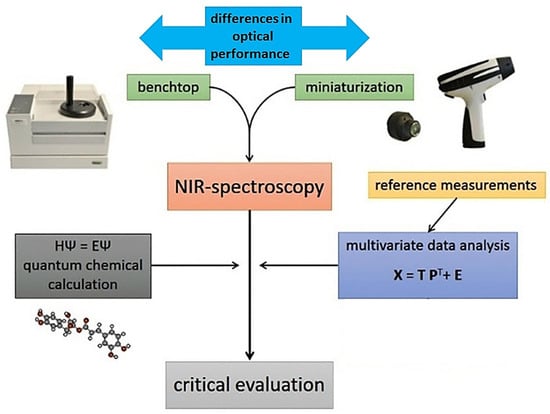
Figure 1.
The workflow of the multiplanar methodology used for understanding the instrumental performance and increasing the accuracy, flexibility, and applicability of miniaturized NIR spectroscopy.
2. Modern NIR Instrumentation—Toward Sensor Ultraminiaturization and Integration
Much of the specifics of the analytical framework based on miniaturized NIR spectrometers may be better comprehended by highlighting the decisive differences that exist between a standard laboratory stationary (i.e., benchtop) NIR spectrometer and handheld instruments. The former is nowadays a fully matured instrument that follows a rather uniform construction scheme, in which either a Michelson or a polarization interferometer is used, and the spectrum is acquired based on the Fourier-transform (FT) principle [32]. In contrast, there are numerous optical and engineering principles implemented in the competing portable and miniaturized NIR instruments, constituting the diversity in the operational characteristics, price-per-unit factor, and the ultimate applicability of these devices.
2.1. General Design of an FT-NIR Benchtop Spectrometer
A construction scheme of a benchtop NIR spectrometer does not essentially differ from that of a generic instrument for optical absorption spectroscopy [33,34,35]. It comprises a light source, a wavelength selector, and a detector as the main building/functional blocks, which are interconnected by optics for the propagation of the beam. While NIR spectrometers can be straightforwardly configured for transmission measurements, in which case a sample compartment is typically integrated within the spectrometer’s casing, a diffuse reflection mode of spectra acquisition is much more popular in analytical applications. This advantage results from the physical principles of NIR spectroscopy (i.e., high permeability of typical organic matter against NIR wavelengths), which make it straightforwardly applicable for obtaining good-quality reflectance spectra of samples without any prior pretreatments, such as dilution in a nonabsorbing medium (e.g., KBr powder), which is necessary for measuring mid-infrared (MIR) spectra, with the cost of a destructive method of analysis. Unlike most other instruments, NIR spectrometers can be readily equipped with fiber probes for remote scanning in diffuse reflectance mode, further adding to the versatility and practical usefulness of NIR spectroscopy.
An NIR spectrometer can be implemented using two different concepts of performing the wavelength selection. In a dispersive spectrometer, at a given time, only a narrow waveband is passed through a monochromator (e.g., a diffraction grating and optical slit system) and subsequently presented to the detector. The motion of the diffraction grating over time selects a consecutively changing waveband (i.e., narrow fragment of the wavelengths), effectively scanning the entire spectral region in which the instrument operates. As mentioned in the introduction, this mode of operation has been made obsolete in benchtop NIR spectroscopy by a superior FT spectrometer [33,34]. In an FT-NIR instrument, the entire measured wavelength region (i.e., broadband) is passed to the detector. Using an interferometer, either a Michelson-type or the less-popular polarization interferometer, an interferogram (i.e., a signal in the time domain) is registered by the detector. The signal in the frequency domain (i.e., the spectrum) is reconstructed from the interferogram through a Fourier transform. The primary benefits of such a solution are the gain in the optical throughput of the spectrometer and a precisely controlled wavelength axis [33]. In contrast to full-scale benchtop spectrometers, miniaturization introduces several difficulties that effectively reduce the advantage of implementing the FT principle in the spectrometer [5]. Certain other solutions, including multichannel devices, are feasible and offer competitive performance and cost-effectiveness. Consequently, the handheld instruments available on the market utilize diverse optical principles and engineering solutions to acquire NIR spectra [5].
2.2. Functional Design Scheme of a Miniaturized NIR Spectrometer
2.2.1. Radiation Source
A tungsten halogen incandescent lamp is almost always used as a light source in benchtop NIR spectrometers. With a few exceptions, it is also a standard used in miniaturized devices [14]. The emission profile of this source makes it very well suited for the NIR region, creating a simple, reliable, bright source with very good stability when thermal equilibrium is achieved. The tungsten halogen source is also preferred in miniaturized NIR spectrometers; however, there are additional requirements to make it suitable for such implementation. Energy efficiency and physical dimensions must be optimized, and the thermal stability of the source can become a problem in miniaturized devices due to a limited heat capacity or potential exposure to environmental conditions (e.g., sunlight) during field operation. For example, the insufficient thermal stability of some of earlier designs of otherwise very potent miniaturized instruments was found to negatively affect their analytical performance; as reported in a case study, additional cooling of the entire instrument with a thermocouple eliminated this shortcoming [36]. The effect of source heating on the entire miniaturized spectrometer can be minimized by supplying the source with power only for the duration of the measurement; in some designs, this occurs automatically. Other solutions include a temperature-correction function implemented in spectrometer software, such as that for the MicroNIR 1700 ES instrument. Regardless, it is recommended that the background and dark scan are collected frequently to keep the background profile up to date during measurements.
On the other hand, a light-emitting diode (LED) is a semiconductor source that offers an extremely low power consumption and operating voltage, compactness, and durability, and has an excellent value compared to its cost [37]. However, current technology offers LEDs that emit in a relatively narrow wavelength range that only partially covers the NIR region; for example, a gallium arsenide (GaAs) LED has a bandwidth of only 50 nm with a maximum emission at 870 nm [38]. Consequently, these components are suitable for use in visible/short-wavelength NIR (Vis/SW-NIR) spectrometers, in which compact dimensions and cost-effectiveness of the instrument are crucial (e.g., SCiO) [5].
2.2.2. Wavelength Selector
The wavelength-selection principle and its corresponding implementation in hardware are the most critical characteristics of a spectrometer, and largely determine its overall design and operating parameters [5]. Furthermore, this element manifests the widest diversity among the designs present in the market, making it the most essential for the characterization of a given instrument. Although interferometer-based designs dominate in benchtop spectrometers, implementation of a Michelson interferometer in handheld devices involves considerable trade-offs resulting from difficulties in miniaturizing this complex element [5]. Consequently, it is no longer far superior to other solutions, and so far no uniformly “best” concept for wavelength selection has been established for a miniaturized NIR spectrometer. The currently available portable NIR spectrometers demonstrate far-reaching diversity in this regard, with wavelength selectors ranging from the Fabry–Pérot interferometer and the Hadamard mask to multichannel devices that combine a linear variable filter (LVF) with an array detector. On the other hand, miniaturized dispersive spectrometers have been proved to be competitive; e.g., those implementing a digital micromirror system that avoids the use of movable dispersion grating, and thus are well suited to the regime of miniaturization [5]. Complex wavelength selectors allow the use of single-element detectors, resulting in the most cost-effective combination; the alternative is the integration of an expensive array detector with a fairly simple optical filter. Several known types of wavelength selectors are subject to miniaturization using microelectromechanical system (MEMS) or micro-optoelectro-mechanical system (MOEMS) technology [39]. These optomechanical devices are assembled with silicon using industry-standard technologies for the production of integrated circuits, and their popularization had a particularly important role in the development of miniaturized NIR spectrometers [5].
The principle of the Hadamard transform (HT) as the wavelength-selection approach was implemented in multiple handheld NIR spectrometers [40]. The practical advantages of Hadamard NIR spectrometers were discussed in detail by Fateley and co-workers [41,42]. In its simplest form of the single-encoded HT spectrometer, the light beam is focused on a slit, and after passing through the grating and the associated optics, is encoded by a multiaperture mask (Hadamard mask) and projected onto a single-pixel detector. This optical configuration results in a Hadamard-encoded signal reaching the detector and the spectrum being restored through a Hadamard transform. Theoretically, the advantages of Hadamard spectrometers were demonstrated relatively early, as they shared optical benefits with FT instruments; namely, the multiplex (Felgett), frequency accuracy (Connes), and throughput (Jacquinot) advantages, while HT spectrometers do not extensively rely on moving parts [40]. Importantly, a programmable Hadamard mask proved to be implementable via MOEMS technology, contributing largely to the success of this solution in handheld NIR instruments.
A digital micromirror device (DMD) is a wavelength selector in which an array of microscale mirrors manufactured using MOEMS technology form the wavelength-scanning element. The implementation of a DMD enables the construction of a dispersive spectrometer in which this element is accompanied by a fixed dispersive grating instead of the moving grating characteristic of the canonical optical spectrometer [5]. DMD design also enables the construction of a Hadamard-transform spectrometer (Figure 2) [43]. In contrast to that obsolete design, a DMD-based spectrometer has no moving macroparts and offers advantages in terms of mechanical robustness, size, and cost-effectiveness of the wavelength selector element itself, while its optical configuration allows the use of an inexpensive single-pixel detector.
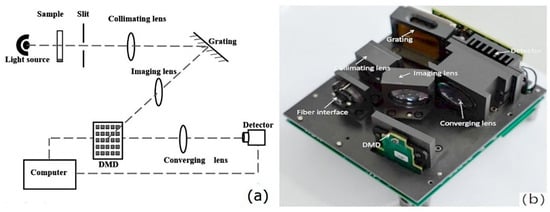
Figure 2.
The implementation of a Hadamard-transform (HT) spectrometer by Lu et al. (a) Scheme of the optical system; (b) design of HT spectrometer. Reproduced (CC-BY 4.0 license) from [43].
The Fabry–Pérot interferometer also acts as a miniaturized wavelength selector [5]. Its scheme of operation is based on two parallel mirrors separated by a constant or variable distance, forming a Fabry–Pérot cavity. The filter is transparent only for resonant wavelengths related to the standing wave effect of the electric field generated in the optical resonator and controlled by the cavity width. Variable filter settings allow incoming polychromatic band (i.e., broadband) to be successively divided into several narrower wavelength fragments (i.e., narrow bands). Microfabrication of a programmable Fabry–Pérot interferometer is also feasible using MEMS technology. It is possible to easily reconfigure the spectrometer to work in other spectral ranges as a factory setting; for example, in NIRONE sensors.
Furthermore, while not being clearly superior in miniaturized form, the Michelson interferometer has been implemented in a number of compact NIR instruments, including those that achieved considerable commercial success; e.g., NeoSpectra sensors [5]. Notably, a more recent generation of miniaturized FT-NIR spectrometers has emerged; for example, the Hefei SouthNest spectrometer. This design implements a relatively large mirror with a diameter of 3 cm in the interferometer, resulting in much improved optical throughput of the spectrometer compared with earlier generations of miniaturized FT-NIR devices. Michelson-interferometer-based sensors offer a wide operational spectral region and superior resolution, comparable to those offered by benchtop FT-NIR spectrometers.
In addition to the above examples, one alternative concept for a spectrometer constitutes an array detector with multiple independent photosensitive elements [5]. While expensive, such a detector only needs to be combined with a relatively simple optical filter to work efficiently as a multichannel spectrometer that measures all wavelengths in the spectrum simultaneously without any scanning principle involved. This solution is particularly beneficial for miniaturized instruments, as it involves no moving parts even at the microscale, a high mechanical resistance, and very compact dimensions. Among the solutions implemented in the current miniaturized NIR instruments, multichannel sensors based on a linear variable filter (LVF) deserve particular attention. An LVF works as a wedge-shaped optical filter with an optical coating of a different thickness, which creates a linear variation in the transparency of the filter at different wavelengths. Designs based on an array detector and an LVF, unlike those based on MOEMS, do not have the high initial investment costs that are characteristic of semiconductor manufacturing. An LVF element is very thin itself, allowing the construction of instruments with a very short path length, further improving the properties of the multichannel spectrometer with high optical performance. Since there is no movement in the operation of the spectrometer, acquisition of a single spectrum is possible with an integration time of less than 10 ns, resulting in the ability to average a large number of spectra in an overall short collection time [5].
2.2.3. Detector
Miniaturized NIR spectrometers are usually equipped with an indium gallium arsenide (InGaAs) or “extended” InGaAs detector, although some instruments also contain silicon (Si) photovoltaic diodes [5,34,44]. The size constraint seen in miniaturized spectrometers limits their optical performance. Therefore, in order to maintain an adequate signal-to-noise (S/N) ratio, the InGaAs detector is more desirable due to its high sensitivity, especially in the range of the longer wavelengths of the NIR region (Figure 3) [14]. The typical wavelength range for its optimal performance is around 1000–1600 nm (10,000–6250 cm−1); however, in practice, several InGaAs-based NIR spectrometers offer good performance at adjacent wavelengths as well. Compared to other types of detectors, InGaAs detectors offer a fast response time, good quantum efficiency, and low dark current, allowing a short scan time while maintaining a good S/N [5]. The extended InGaAs detector is suitable for instruments operating at shorter wavelengths of ca. 1700 nm. However, this type of detector has a lower sensitivity, and may require integrated cooling solutions [44].
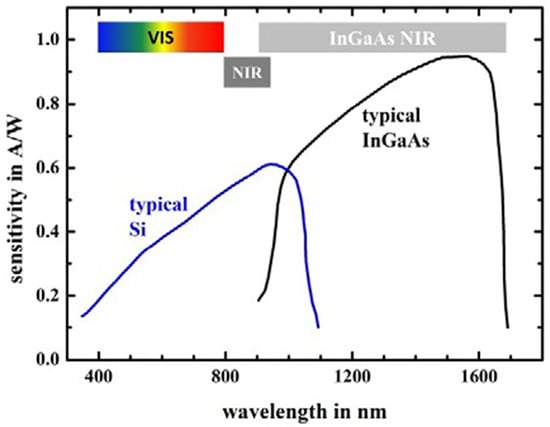
Figure 3.
Typical quantum efficiency spectra of Si and InGaAs detectors. The colored and grey bars indicate the visible, SW-NIR, and conventional NIR (named “InGaAs NIR” in the source) wavelength ranges. Reproduced (CC-BY 4.0 license) from [45].
Photovoltaic Si detectors maintain a reasonable sensitivity in the wavelength range from the visible region to ca. 1100 nm (9100 cm−1), which makes them suitable for cost-effective, compact spectrometers operating only in the visible and SW-NIR regions, as presented in Figure 3 [5,44]. Photodiodes used in portable spectrometers require the use of a wavelength-blocking filter to mask the detector from sunlight. The favorable affordability of this type of detector makes it particularly suitable for spectrometers oriented toward the consumer market [5,44].
2.2.4. Other Elements
Optics. NIR spectrometers are compatible with glass optics because this material does not absorb in the visible and most of the NIR region [5,34]. This enables the use of cheap mechanically and chemically resistant optical materials for the construction of portable NIR spectrometers [5,44]. However, the best performance in the long-wavelength part of the NIR region may require high-quality optics made from fused silica; i.e., without O-H impurities. To ensure reliable operation in direct contact with the sample, the optical window at the sample interface made from a scratch-resistant material is preferred. For example, some designs employ sapphire for this role, as it is a mechanically resilient material with the required transparency in the NIR wavelength range. However, it features a rather high refractive index (greater than 1.7 in the visible and NIR regions) that increases optical loss from reflection, making it more suitable for instruments with good optical throughput, such as MicroNIR multichannel spectrometers.
Connectivity, user interface, and power delivery. Modern electronics have achieved high levels of energy efficiency, which is a great advantage for portable spectrometers. These instruments follow one of two power delivery concepts: either the power supply is provided by an external source, or the unit is equipped with its own battery. For many spectrometers, the first solution is practically implemented with a universal serial bus (USB) connection, which is also used for spectrometer control and data transfer (for example, the standard version of the MicroNIR spectrometer). However, this is only possible if the total power consumption of the instrument does not exceed the capacity of the USB interface. In addition, the use of the instrument is limited by a permanent connection to the main computer (PC) via a USB cable. The second solution is needed for completely autonomous spectrometers (e.g., microPHAZIR) and those compatible with smartphone applications (e.g., Tellspec Enterprise sensor and SCiO). With this latest type of device, the data interface for transferring measured spectra and associated data can be maintained via USB as well (e.g., microPHAZIR) or via a cloud service (e.g., Tellspec Enterprise sensor and SCiO).
Closely related to the above, the user control over the instrument can also be achieved in several ways. The fully autonomous instruments feature their own user interface with a display screen and a user-input device (e.g., a keyboard), as in the case of, for example, microPHAZIR. Spectrometers that require continuous external power are typically controlled by a PC-installed application with the data interface and power delivery conveniently handled by a wired USB interface; examples include MicroNIR instruments [5]. Many devices aimed at the consumer market are operated through an application installed on a smartphone with continuous communication with a user device over a wireless connection; i.e., Wi-Fi or a low-power Bluetooth interface.
2.3. Brief Overview of Selected Representative Miniaturized NIR Spectrometers
The principle of the Hadamard spectrometer was implemented in one of the first handheld NIR instruments introduced to the wide market by Polychromix, now the intellectual property of Thermo Fisher Scientific Inc. The instrument employed a programmable microscale MEMS-based Hadamard mask, a low-power tungsten lamp source, and an InGaAs single-element detector. These solutions enabled a robust, reliable, and reasonably compact instrument, given its fully autonomous operation. The device was fitted with its own power source—a lithium-ion battery—that was swappable for continued operation, a display screen, and a user interface; i.e., a keyboard.
Several successful products on the market are based on the NIRscan Digital Light Processor (DLP) module from Texas Instruments. This solution is based on a digital micromirror device (DMD) manufactured using MEMS technology, and is available as two evaluation modules (EVMs): a high-performance (HP) EVM with a DLP NIRscan sensor and a mobile sensing (MS) EVM with a DLP NIRscan Nano. The latter, more compact one is primarily suitable for cost-efficient portable spectrometers. It is implemented in the NIR-S-G1 instrument from InnoSpectra [46], available as a customized product from, e.g., SphereOptics [47], Sagitto [48], Allied Scientific [49] and Tellspec [50]. The NIR-S-G1 spectrometer is extremely compact (82 mm × 63 mm × 43 mm; weight less than 145 g); it is equipped with li-ion battery, is operated through a mobile app, and communicates with a smartphone via a power-efficient Bluetooth interface.
A Fabry–Pérot interferometer was implemented by Spectral Engines in a miniaturized NIR spectrometer NIRONE S sensor [51], with several variants preconfigured for different operational wavelength-range, S/N ratio, and resolution parameters (Table 1) while maintaining very compact dimensions (25 × 25 × 17.5 mm; weight 15 g). The implementation of the Fabry–Pérot interferometer created an optical configuration of the sensor suitable for detection in a relatively large area of either the InGaAs or extended InGaAs type. The Sensor X is a compact version of the instrument optimized for cost-effectiveness and ease of production. Notably, the latest advances in Fabry–Pérot interferometer technology show promise for ultraminiaturization. For instance, Hamamatsu recently unveiled a series of ultracompact NIR sensors, differing mostly in their operational spectral regions that, however, are quite narrow and depend on the variant, ranging from 1350 to 2150 nm (7407–4651 cm−1) [52].

Table 1.
The operational characteristics of selected miniaturized NIR spectrometers available on the market in comparison with two exemplary benchtop FT-NIR devices.
An alternative approach to a multichannel spectrometer is offered by the VIAVI MicroNIR series of instruments. These devices combine a multielement array detector (InGaAs) coupled with an LVF, enabling a very compact, mechanically robust spectrometer with superior optical performance for its size. Newer versions of the MicroNIR; e.g., the 1700 ES, improve the operational stability over time thanks to a temperature-correction function, effectively recalibrating the detector’s response depending on its temperature to mitigate the thermal capacity imposed by the compact dimensions of the device. The standard MicroNIR instrument is powered and controlled via a wired USB connection with a host PC, while the dedicated OnSite-W variant, intended for in-field operation, is equipped with battery power source and a waterproof and dustproof housing [53].
Miniaturized FT-NIR spectrometers equipped with a Michelson interferometer are offered by, e.g., Si-Ware Systems with a NeoSpectra device (Table 1, Figure 4) [54]. Recently, a new generation of FT-NIR minispectrometers appeared. For example, Hefei SouthNest Technology introduced the nanoFTIR NIR spectrometer, which operates in the full NIR range of 800–2600 nm (12,500–3846 cm−1) while maintaining a relatively high spectral resolution of 6 nm at 1600 nm. The device has compact dimensions (14.3 × 4.9 × 2.8 cm) and is light (220 g), and can be equipped with an external light source and a fiber-optic probe compliant with the industry standard, making it suitable for online analysis. Furthermore, recently another MEMS-based FT-NIR spectrometer from Hamamatsu appeared, equipped with a large mirror (3 mm diameter) interferometer, enabling a good S/N ratio with a wide spectral range of 1100–250 nm (9090–4000 cm−1). On the other hand, regardless of the underlying technology, many of the spectrometers are offered in a specialized variant sold as “turn-key” analyzers to be operated by personnel not trained in spectroscopy. Such analyzers are preconfigured for the intended analyses, with a specialized software suite containing spectra-processing algorithms and precalibrated models for quantitative and qualitative analyses typically performed in a given area of application. For example, several analyzers based on the microPHAZIR spectrometer appeared that are intended to be operated under minimal supervision [55]. Exemplary configurations include, e.g., the microPHAZIR AG Handheld Analyzer, which is intended for animal feed analysis, and is preconfigured to predict major quality parameters and ingredients in these products, such as moisture, protein, fiber, starch, etc., [56]. The other turn-key configurations of the microPHAZIR include, e.g., the microPHAZIR PC analyzer, which is intended for plastics analysis in recycling [57]; the microPHAZIR RX analyzer, which is preconfigured for pharmaceuticals [58]; or the microPHAZIR AS, which fulfills the role of an asbestos analyzer [59]. Mini-NIR analyzers in particular are growing in popularity in the agri-food industry, with several examples of specialized devices; e.g., the NIR4 Farm spectrometer from AB Vista, which is intended for the analysis of feed and forage [60]; as well as analyzers that are preconfigured for grain assessment, such as AURA’s Handheld NIR [61] or the X-NIR Analyzer [62].
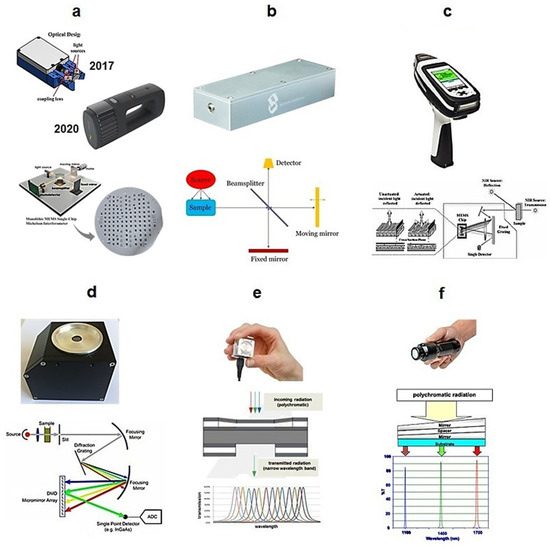
Figure 4.
Principles of wavelength selectors built into different handheld NIR spectrometers: (a) MEMS Michelson interferometer—NeoSpectra, Si-Ware, Cairo, Egypt; (b) MEMS Michelson interferometer with a large mirror—nanoFTIR NIR, SouthNest Technology, Hefei, China; (c) MEMS Hadamard mask—microPHAZIR, Thermo Fisher Scientific, Waltham, MA, USA; (d) MEMS DMD—implementation of DLP NIRscan module, Texas Instruments, Dallas, TX, USA; (e) MEMS Fabry–Pérot interferometer—NIRONE Sensor S, Spectral Engines, Helsinki, Finland; (f) LVF—MicroNIR Pro ES 1700, VIAVI, Santa Rosa, CA, USA. Adopted (CC-BY 4.0 license) from [7].
In the context of food analysis, attention should be given to specialized, consumer-oriented NIR spectrometers designed to accept somewhat limited overall performance with the greatest benefit of cost-effectiveness. These are the necessary trade-offs to fit the instruments into their specific niche of the market, where they are offered as “pocket food analyzers” for use by the general public [63]. The sensor hardware is tailored to provide a sufficient optical performance, while the primary value for the intended operators originates from the associated software. These instruments offer an easy-to-use cloud service, in which the results of the analysis are displayed to the end user in a “black-box”, with underlying predictions based on precalibrated models stored in the cloud service. A good example of such a device is the Consumer Physics SCiO NIR microspectrometer [64]. Marketed as the first “pocket” spectrometer, the unit measures 67.7 × 40.2 × 8.8 mm, weighs 35 g, and is intended primarily for everyday consumer assessment of food quality and nutritional value. The necessary economical affordability is achieved by using an LED light source and a simple 12-element Si photodiode detector, with an array of a 4 × 3 configuration, combined with optical filters across each pixel to form a 12-channel spectrometer. However, in this design, noticeable penalties in terms of optical performance were inevitable, manifested primarily in the low number of measured wavelengths. Below-average S/N levels and a narrow wavelength range covering only a fragment of the visible/SW-NIR range (740–1070 nm; 13,514–9346 cm−1) seem sufficient for the intended applications of this device, as a number of essential quality parameters of foods can be effectively predicted from these spectra. In connection with the ultraminiaturized, consumer-oriented instruments described above, the much-anticipated NIR sensor fully integrated with a smartphone has remained a vivid concept in the past decade [65]. While the initial prototype revealed highly promising characteristics [66,67], so far, no such solution has appeared on the market. However, more recent advances into ultraminiaturization; e.g., as demonstrated by Hamamatsu MEMS-FPI spectrum sensors [65], suggest that NIR spectrometers integrated with smartphones may become commercially available in the next few years.
3. Methods and Techniques for Spectral Acquisition, Data Analysis, and Interpretation
3.1. Techniques for Spectra Acquisition
Miniaturized spectrometers, in general, can be adopted to perform well in all modes of spectral acquisition established in NIR spectroscopy; i.e., diffuse reflectance (Figure 5a) and transmittance (Figure 5b), as well as the mode effectively combining both of these; i.e., transflectance (Figure 5c) [68]. Furthermore, the interactance mode (Figure 5d) can be distinguished, which is based on a geometrical arrangement of the sensor vs. the sample surface, rather than a distinct optical phenomenon. This configuration reduces optical losses at the path to the sample surface; i.e., a higher portion of the incident beam effectively reaches the sample. Additionally, in the case of the transmittance measurement of materials in which strong scattering occurs (e.g., dense solid samples), a distorted behavior of the NIR beam when propagating through the sample may occur (Figure 5e).
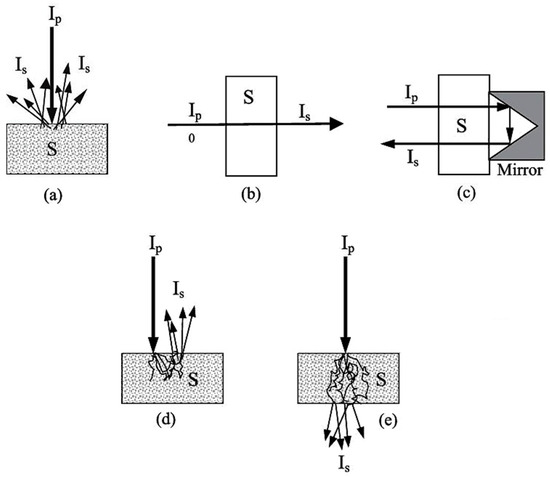
Figure 5.
Modes of spectral acquisition employed in NIR spectroscopy: (a) diffuse reflectance; (b) transmittance; (c) transflectance; (d) interactance; (e) transmittance through scattering medium. Adopted (CC-BY 4.0 license) from [68].
That being said, most miniaturized NIR spectrometers are factory-configured to operate in diffuse reflectance mode, and some of them are offered with additional accessories for transflectance measurements, as in the case of, e.g., the VIAVI MicroNIR. Typically, spectral acquisition in this mode is performed by using an external reflector and holder designed for maximizing the optical gain of a specific instrument. Such an accessory may be also custom-made; e.g., a gold-plated surface with a geometrical shape tailored to a specific analysis [36]. On the other hand, to perform conventional transmittance measurements, which are preferable for reliability in the analysis of suitable samples such as liquids, miniaturized instruments require an accessory with its own radiation source. A transmittance accessory is therefore less common in miniaturized NIR spectroscopy, but is offered again by, for example, VIAVI, to fit their MicroNIR spectrometer. The interactance principle is typically implemented through a fiber probe accessory. Different architectures of optical probes are possible: either the illumination and collection path use the same light fiber, resulting in a single-fiber probe (SFP) configuration, or two independent fiber probes are dedicated to each beam, resulting in a multiple-fiber probe (MFP) configuration. While intensively used in industrial environments, only certain general-oriented miniaturized NIR spectrometers are solely designed to operate via a fiber probe; e.g., the Hefei SouthNest FT-NIR instrument.
MVA groups various mathematical methods capable of correlating many variables at one time [69]. Every spectral point carries information about the sample, and effectively, the correlation function binds the property of a multicomponent sample with its vibrational spectrum in a many-parameter function. The machine-learning methods in the variants applied in chemistry are commonly known as chemometrics, and these are the main tools for quantitative and discriminant (i.e., qualitative) analysis in applied spectroscopy [69,70]. These methods may be roughly divided into the following categories.
Exploratory data analysis (EDA) groups techniques for data mining (i.e., cluster analysis and principal component analysis (PCA)) used to gain a general overview of the variance in the dataset and explore the statistical properties (i.e., distribution in multi-variate space) of high volume, complex data; e.g., sets of spectra.
Pattern-recognition (classification) techniques are used for separation (grouping) of the samples according to the statistical specificity of the sample set. Supervised classification methods include, e.g., linear discriminant analysis (LDA) or support vector machine (SVM) classification [71]. Clustering methods [72]; e.g., hierarchical cluster analysis or k-means clustering, are archetypical unsupervised machine-learning algorithms that are frequently used in the determination of the similarities between samples by grouping unlabelled datasets. Artificial neural networks (ANNs) are very potent supervised methods for performing classifications, particularly in challenging cases; e.g., those affected by instrumental noise and other perturbations.
Regression analysis groups the methods used for quantitative prediction of a sample’s properties; e.g., quantification of chemical content (either one or a group of constituents) present in the sample. The most popular techniques include multiple linear regression (MLR), principal component regression (PCR), and partial least-squares regression (PLSR). Nonlinear regression methods (e.g., Gaussian process regression (GPR)) and ANNs can perform very well and improve the analytical performance of miniaturized sensors, in which a lower resolution and spectral region limit the amount of information available for the analysis [31,73].
The statistical parameters of trained classification or regression models need to be evaluated to assess their validity (i.e., ability to describe the variance not only in the calibration set, but also in general population) and predictive performance. The coefficient of determination (R2), root-mean-square of calibration (RMSEC), and root-mean-square error of cross-validation (RMSECV) describe the robustness of the model. The ultimate prediction power of the model is best assessed by evaluating the root-mean-square error of prediction (RMSEP) on the basis of an independent one, or preferably more test sets of samples. Finally, the level of detection (LOD) and level of quantification (LOQ) are essential parameters that indicate a sensor’s performance (in a specific analysis) toward low-concentrated constituents, which often receive most focus in certain applications. Furthermore, statistical parameters can be used to directly compared different approaches or various instruments being used; e.g., to describe the performance of the sensing device in different conditions (for example, configuration of the sensing interface).
Advancements in chemometrics, or even more broadly understood data science, are naturally beneficial to the applications of miniaturized NIR spectrometers, although this is a generally oriented trend that brings merit to analytical spectroscopy, rather than focused research oriented strictly at providing gains only for miniaturized sensors. Certain aspects of this progress, however, might be linked with proportionally greater benefits offered by this specific technology. Data-fusion concepts are useful to combine spectral information from several sensors operating in narrow wavelength regions, as well as to provide the possibility of performing parallelized spectral pretreatments (Section 5.2). Development and validation of precalibrated models stored in cloud services should be mentioned, where the robustness (i.e., universality) of the models is a critical factor; however, this development remains mostly the proprietary intellectual property of instrument vendors. On the other hand, recent attention in NIR spectroscopy has been increasingly directed toward the application of deep neural networks (i.e., deep learning or “deep chemometrics”) for prediction and classification purposes [74,75,76]. However, to date, only scarce literature has appeared that studied the potential benefits of applying deep-learning methods to reinforce the analytical framework of miniaturized NIR sensors [75]. However, it seems plausible that deep networks could provide benefits in processing challenging data sets; e.g., those of complex samples measured by ultraminiaturized NIR spectrometers. On the other hand, recent critical evaluations of the current state of data science related to the applications of miniaturized NIR spectrometers indicate urgent problems yet to be comprehensively studied [77]. Giusanni et al. pointed out the attention to the issue of the possible deterioration of miniaturized sensors over time, and the connected problem of the validity of the respective calibration models. Other concerns expressed in that study included the transferability of the models to future generations of sensors, which seems entirely legitimate as we approach the era in which the effort invested in the training and validation of models may outweigh the unit cost of inexpensive sensors. Furthermore, issues related to the automatization of the data transfer from the instrument to the user device were pointed out as well [77]. Therefore, there appear to be specific challenges and problems to be solved by data scientists and chemometricians that are directly related to the widespread use of miniaturized NIR spectrometers by nonexpert personnel.
3.2. Methods for Interpretation of NIR Spectra
While conventional methods of spectral interpretation provide generalized tables of assignments of the NIR bands representative of chemical constituents typically present in foodstuffs (Table 2; limited to the major classes of chemical compounds only), the identification of specific markers in NIR spectra is much less straightforward than it is, for example, in MIR or Raman spectroscopy [78]. This is the consequence of the intrinsic complexity of NIR spectra and the resulting difficulty in their direct interpretation, which remains a limiting factor regardless of the application. In contrast to MIR and Raman techniques, NIR spectroscopy has been hindered in forming a practically accessible synergy with computational chemistry [79]. In recent years, however, advances in the tools used in computational chemistry have created an opportunity to take a step beyond this barrier [28,80,81,82].
Table 2.
Approximate positions of NIR bands of the major classes of chemical compounds commonly present in foodstuffs (excluding water). Reproduced (CC-BY 4.0 license) from [29].
This led to considerable advances in the applicability of the methods of theoretical chemistry to NIR spectroscopy [83]. The accurate simulation of NIR spectra of reasonably large molecules largely improves our comprehension of NIR spectra, and offers an opportunity to take a step beyond this barrier. Quantum-mechanical simulations of NIR spectra of a variety of compounds are significant from the point of view of physiochemical and analytical spectroscopy. The examples range from basic molecules (alcohols, nitriles, carboxylic acids) [84,85,86,87] to complex molecules with importance in biophysical science (fatty acids, nucleobases) [88,89], materials science and industry [90], and analytical chemistry (vitamins, natural drugs, polyphenols, alkaloids, food adulterants) [91,92,93,94,95]. The simulated NIR spectra largely increase the level of detail in the band assignments compared to the one available in conventional methods of spectral analysis (Table 2).
A remarkable potential arises from the growing applicability of anharmonic computations in solving the problems that arise in both basic and analytical NIR spectroscopy [96]. The highly convoluted, overlapping nature of NIR spectra can be successfully dissected in theoretical spectra, as presented in the example of a caffeine molecule (Figure 6) [93]. The elucidated rich information stemming from numerous NIR bands can subsequently be used to improve the basic understanding of NIR spectroscopy, as well as to advance its applications. In silico simulations of NIR spectra yield highly detailed and accurate chemical interpretations of the NIR bands. This information opens up new possibilities of performing a deep examination of the performance profile of handheld NIR spectrometers (Section 2.2 and Section 2.3). The calibration models constructed for different spectrometers capture chemical information on the analyzed constituent in clearly distinct ways, with the benchtop high-resolution spectrometer being able to capture individual vibrational bands much more accurately. This results in consequences to the ability of a spectrometer to acquire fine intensity changes in a specific task. The detailed comprehension of NIR bands from an accurate simulation of the spectra enables the knowledge-based design and optimization of analytical applications of NIR spectroscopy.
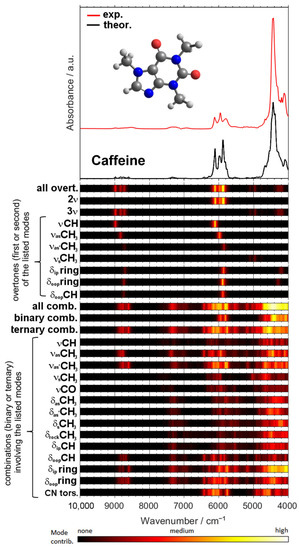
Figure 6.
Vibrational modes’ contribution to NIR spectrum of caffeine available from quantum chemical calculations. Reproduced (CC-BY 4.0 license) from [93].
This detailed information on the chemical origin of each NIR band enables new approaches to the support of analytical applications. For example, one may select the best-suited sensor for the intended analysis by assessing its suitability in measuring the characteristic absorption regions of the targeted constituent. Miniaturized NIR spectrometers most often can only measure fragments of the NIR spectrum (Figure 7), and hence, only selective chemical information can be acquired by these devices. An accurate spectral simulation, such as the example for caffeine presented above (Figure 6), enable a full understanding of which NIR vibrations a specific sensor can acquire, and thus, the best-suited instrument for the targeted analysis can be selected.
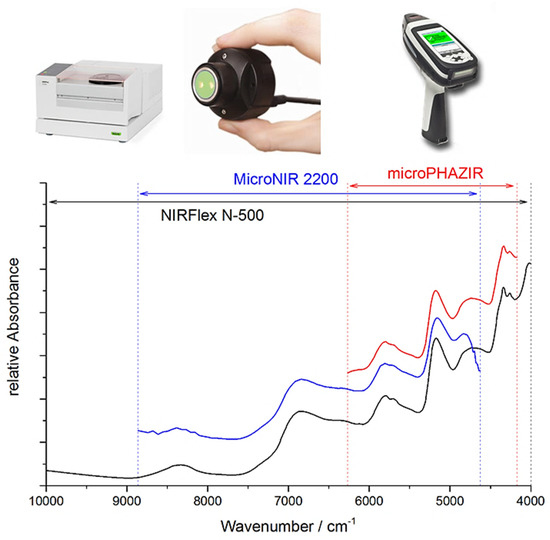
Figure 7.
In contrast to benchtop FT-NIR instruments that measure the full NIR wavenumber region, the access of miniaturized NIR spectrometers to chemical information is selective, resulting from only narrow, and at best partially overlapping, fragments of the NIR spectra measured by these sensors. Adopted with the permission of the Royal Society of Chemistry (2017) from [27].
Furthermore, a detailed interpretation of PLS regression factors becomes possible as well, providing deep insights into the critically important connections between the chemical information present in the sample and the analytical framework [97]. In this way, the interpretation, in a chemical sense, of the meaningful variables in chemometric models becomes possible [98,99,100].
These three essential pillars, each of which takes advantage of a detailed understanding of the chemical information in the processed spectra, enable a “‘smart”, knowledge-based design and the optimization of an analytical approach in modern miniaturized NIR spectroscopy.
4. Overview of Applications of Miniaturized NIR Spectrometers in the Agri-Food Sector
NIR spectroscopy is one of the most versatile methods with great utility, and is highly valued as an analytical and quality-control tool for foods [101,102]. Miniaturized NIR spectrometers have particularly rich applications in agricultural and foodstuff areas, as their portability greatly enhances the common conventional strengths of the NIR analytical framework, and the miniaturized instruments meet the challenges and specifics of food-related analysis very well [11]. The complex nature of the food production and delivery chains, as well as the susceptibility of foods to quality loss, promote the need for a flexible analytical tool [103]. Similarly, onsite NIR spectroscopy is an excellent tool for monitoring the quality and growth conditions of crops, and the advent of this technology revolutionized certain aspects of agriculture [104]. For these reasons, mobile NIR spectrometers attracted relatively early attention in the area of food analysis [104,105]. Ellis and colleagues previously provided a perspective view on the specific capabilities of portable NIR devices and their applications in food supply chains [106].
The current state of the art of miniaturized NIR spectroscopy in food analysis shows that handheld instruments can be used successfully for a wide variety of problems, but the applicability potential and relative performance may vary from instrument to instrument [73,77,99,100,107,108,109,110,111,112,113,114,115,116,117,118,119,120,121,122,123,124,125,126,127,128,129,130,131,132,133,134,135,136,137,138,139,140,141,142,143,144,145,146,147,148,149,150,151,152,153,154,155,156,157,158,159,160,161,162,163,164,165,166,167,168,169,170,171,172,173,174,175,176,177,178,179,180,181,182,183,184,185,186,187,188,189,190,191,192,193,194,195]. In such applications, the instrumental difference can be profoundly manifested. For example, affordable visible/SW-NIR spectrometers can perform well in the analysis of macronutrients, but their applications in other scenarios may be limited [112,118]. This makes it difficult to predict the performance of a given spectrometer without performing systematic feasibility studies. Such attempts have been made, and it should be briefly mentioned that recent studies were aimed at obtaining a wider perspective on the instrumental differences manifested in the ability to acquire the characteristic signal of a specific constituent present in the sample [100]. Most of the recent research has focused on developing effective methods for determining the quality of shelf products. The challenges faced in this scenario result from several factors. Firstly, the chemical variety of foodstuffs, often further complicated by the complex matrix and high moisture content, are of note. Hence, for example, the accessibility to the spectral footprint of food adulterants in a specific spectral region may vary [94]. Next, the physical properties of these products, such as surface texture, may frequently interfere with the analysis. Finally, it is often desirable to perform a nondestructive analysis of an originally packaged product; i.e., the influence of the packaging material needs to be addressed. Consequently, the feasibility of miniaturized NIR spectrometers may greatly vary from case to case. Nevertheless, portable NIR spectroscopy has been introduced with remarkable success in the food industry. Application development remains an active direction of research in this area, and numerous reports appeared in the current literature, as summarized in the following sections.
4.1. Milk
Miniaturized NIR spectroscopy finds particularly widespread use in the analysis of dairy products, with a considerable research effort oriented directly at developing analytical methods for the analysis of milk, as evidenced by the recent literature [107,108,109,110,111,112,113,114,115]. Table 3 presents summarized and tabularized key information provided in the reviewed studies. Investigations toward the qualitative assessment of milk have attracted the main attention, where examples of discrimination between organic and conventional milk, authenticity checks and detection of milk adulteration, or discrimination between regular and lactose-free milk directly in the field should be noted. However, studies demonstrating the full capacity of miniaturized NIR spectroscopy to perform rapid quantitative predictions of the key quality parameters of milk, such as fat and protein content or fatty-acid composition, have been conducted as well.
Table 3.
Recent research activity oriented toward miniaturized NIR spectroscopy for analysis of milk.
Very often, the prediction performance offered by miniaturized NIR sensors in the established analytical framework was deemed comparable to that of benchtop NIR spectrometers, enabling the real-time monitoring of quality-control parameters of cow milk for each specimen. Furthermore, while primary attention is given here to bovine milk, examples of goat milk analysis can also be found in the recent literature as well [108]. In the area of methodology, it should be pointed out that there has been development toward an effective calibration transfer in order to share calibration models among several portable instruments, which provided decisive gains in efficient in situ analysis at the farm level [110].
4.2. Other Dairy Products
Dairy products other than milk also have been extensively examined by miniaturized NIR spectrometers, with numerous feasibility studies and practical applications of the developed methods. In this area, the analysis of cheese quality predominates, while examples of successful examinations of yogurts and milk/dairy powders can be provided in this category as well [116,117], as summarized in Table 4. Notably, good analytical figures of merit were accomplished in these feasibility studies; even in the cases of extremely cost-effective NIR sensors intended for the consumer market; the prediction performance remained acceptable even when cloud-based “black-box” calibration integrated with the consumer-aimed software was used for the analysis. Furthermore, the literature suggests that improved control of the cheese-making process is permissible with miniaturized NIR sensors, as these devices enable the early detection of deviations from the target quality directly in the production process, as well as the aging of cheese. On the other hand, the relevance of the visible/SW-NIR region to provide information correlated with the quality parameters of dairy products emerged from the reviewed studies. This seems to explain why these ultra-cost-effective sensors, which operate in the visible/SW-NIR region as the result of their constructional principles (i.e., Si photodetectors and LED sources), generally present very good performance in these applications when compared to benchtop NIR spectrometers that operate in the conventional NIR spectral range.
Table 4.
Recent research activity oriented toward miniaturized NIR spectroscopy in the area of dairy-product applications.
4.3. Meat
An inspection of the current literature found intensive development of meat analysis using miniaturized NIR spectroscopy (Table 5). Predominantly, attention is drawn toward the rapid, nondestructive analysis of freshness, which is a major concern in the everyday consumption of meat, as well as the authenticity check and the detection of adulteration, following several episodes of the mislabeling of meat that occurred in the past [9,11,13,128].
Table 5.
Recent research activity oriented toward miniaturized NIR spectroscopy in the area of meat application.
Notably, it was demonstrated that, in the case of the former concern, the aging day and levels of chemical/microbial indicators (i.e., thiobarbituric acid, volatile basic nitrogen, and bacteria levels) could be successfully analyzed using miniaturized NIR instruments in a rapid manner with no need for destructive sampling procedures [135]. On the other hand, classification of chicken meat by a portable NIR spectrometer while also discriminating between different parts of the chicken could be performed directly in the processing line.
Quantitative predictions often focus on the analysis of the fat content in meat, as well as the microbiological status, or the quantitative prediction of the level of fat adulteration [140]. Furthermore, quantification of a specific type of meat in a ground meat blend; e.g., the beef content in chicken/beef, pork/beef, and chicken/beef/pork blends, was successfully accomplished with miniaturized NIR spectroscopy as well [138]. In a number of investigations, the applicability of miniaturized NIR spectrometers in tackling the challenging problem of the quality control of meat was evaluated not only in comparison with benchtop NIR spectroscopy, but also in comparison with other analytical techniques, including optical spectroscopy (e.g., visible spectroscopy) [142,143].
4.4. Fish
Countering seafood mislabeling is receiving increased attention, as numerous cases of food fraud involving fish and seafood products were reported lately [148,149,150]. The scale of the problem can be well highlighted by economic-driven fraud reaching the entire fish supply chain, where on several occasions, a substitution for valuable fish with a cheaper species occurred [148]. Therefore, considerable research efforts have recently been directed at developing effective and reliable miniaturized NIR methods in this area of application. Miniaturized spectrometers were concluded to be feasible to provide accurate discrimination between fish species, as well as to quantitatively predict the main chemical contents in fish flesh; for example, fat composition, protein, or lipids (Table 6).
Table 6.
Recent research activity oriented toward miniaturized NIR spectroscopy in the area of fish analysis.
To reflect state-of-the-art and currently undertaken research directions, Pennisi et al. [157] recently demonstrated highly accurate results using handheld NIR spectrometers for direct screening of a production line of cuttlefish and musky octopus. The authors emphasized the decisive practical gain from using miniaturized NIR instrumentation, with a greatly reduced complexity and the execution of the analysis that make it much more practical for successfully adoption in the challenging conditions commonly found at fish and seafood production sites.
4.5. Fruits and Vegetables
Fruits and vegetables are also among the most-studied items in the development of analytical miniaturized NIR spectroscopy, with equal interests in both the food and agriculture sectors. Most often, the aim of the analyses was directed towards the prediction of the quality parameters of fruits and vegetables (Table 7). Several canonical types of analysis were used; i.e., moisture level, protein content, and total sugar content (i.e., BRIX index), as well as the metrics of fruit maturity, content of soluble solid, titratable acidity and ascorbic acid, extractable polyphenols, etc. Often, more than one property of interest could be simultaneously predicted from a single spectrum. Importantly, in most cases, the full feasibility of miniaturized NIR spectrometers to perform those analyses directly under field conditions and/or during fruit ripening was demonstrated. Other than those, the qualitative assessments of relevant properties also included identification of the variety and/or geographical origin, assessment of the refrigerated-storage duration, and authenticity checks. Notably, there were studies demonstrating the potential for rapid discrimination of fraud due to the mislabeling of conventionally produced fruits as organic ones; e.g., in the case of pineapples [150]. A similar potential can be concluded for vegetable analysis, with the example of the examination of spinach leaves in situ, directly on the plant, in which a green color, the texture, and dry matter were detected using a miniaturized NIR instrument [158,159,160,161]. Such a capacity can be effectively used in the optimization process of cultural practices, such as fertilization and irrigation and to assess the quality of a vegetable when harvested.
Table 7.
Recent research activity oriented toward miniaturized NIR spectroscopy in the area of fruit and vegetable applications.
4.6. Beverages and Syrups
Considering the success of miniaturized NIR spectroscopy in predicting critical qualitative and quantitative properties of foods that feature considerable complexity, such as meat, fresh fruits, or vegetables, one should expect that the analysis of beverages or syrups should be within reach of this technology as well. An inspection of the recent literature indicated that miniaturized NIR sensors can provide the rapid assessment of sugar content in such samples in a wide range of concentrations, and in a robust manner (Table 8). The prediction of other chemical contents, such as polyphenols, amino acids, caffeine, and theanine, as well as the quantitative assessment of the adulteration level, could be concluded in the available literature.
Table 8.
Recent research activity oriented toward miniaturized NIR spectroscopy in the area of beverage and syrup applications.
Noteworthy classification examples that included discrimination between different beer brands or sake varieties using miniaturized NIR spectroscopy should be mentioned as well [179,180].
4.7. Miscellaneous
Other examples of recent food-analysis studies should also be noted that further demonstrated the versatility of miniaturized NIR spectrometers, in which they were successfully applied to qualitative and quantitative analyses in a variety of cases, from whole foods to highly processed products (Table 9). Content analysis included, e.g., carbohydrates, fats and oils, fiber, proteins, and sugar as well as general energetic/nutritional value. Specific chemical constituents could be successfully analyzed; for instance, piperine in black pepper, or insect proteins in fitness bars [73,99]. Detection of adulterants; for example, in palm oil [176], as well as the quantitative analysis of adulteration was feasible using miniaturized NIR spectroscopy. Examples of successful authentication or classification/identification of various food products included the different quality grades and geographical origins of rice, as well as of basic food powders such as sugar, salt, cream, flour, corn, rice, bean, and potato powders [177]. The prediction of other quality parameters of more general nature; e.g., egg storage time assessment, was permissible as well [174].
Table 9.
Recent research activity oriented toward miniaturized NIR spectroscopy in the area of various miscellaneous applications.
An inspection of the available literature well demonstrated the versatility and superior utility of miniaturized NIR spectrometers in the diverse realm of food analysis and quality control. On the other hand, attention should be also given to some of the limitations in the applicability of handheld NIR instruments; for example, chlorophyll content could not be accurately predicted in canola seed, as determined by Barthet et al. [186].
5. Current Trends in Method Development
5.1. Systematic Evaluation of Calibration Methods
In parallel to their revolutionary practical advantages, miniaturized technologies also impose inevitable limitations on the optical/spectral capabilities of the very compact NIR instruments. Spectra measured in narrow wavenumber regions with a relatively low resolution and an often-inferior S/N ratio, as compared with benchtop spectrometers, place a particular need on performing systematic feasibility studies of miniaturized NIR spectrometers in given analytical scenarios. In this case, the evaluation of numerous spectral pretreatments and calibration algorithms, including artificial neural networks (ANNs) and nonlinear regression methods (e.g., Gaussian process regression (GPR)) is recommended to establish the best data-analytical approach for a given sensor in a specific analytical scenario. As demonstrated, this may result in a sizeable improvement in the predictive performance of portable NIR spectrometers, surpassing PLSR with minimal or no penalties to the prediction performance of handheld vs. benchtop spectroscopy in difficult analyses (e.g., moisture analysis in a plant matrix). Advanced calibration enables miniaturized spectrometers to nearly match the performance of benchtop instruments.
As shown by Mayr et al. [31], the analytical performance of miniaturized spectrometers in a challenging scenario of the quantitative analysis of the moisture in chemically complex plant matrices could be significantly improved by carefully evaluating several different spectral pretreatments and calibration methods, which were systematically evaluated for each of the considered benchtop and miniaturized NIR spectrometers. In that study, two benchtop instruments (NIRFlex N-500 and MPA I) and three miniaturized instruments (microPHAZIR, MicroNIR 2200, and MicroNIR 1700 ES) were used, while the analysis of the moisture content was performed for 192 samples of dried plant extracts, consisting of five different plants of different geographical origins harvested at different times over two years. The samples included extracts laced with a drying agent, as well as unpretreated samples that presented a less-stable matrix that was prone to variations in the moisture content. The reference moisture analysis for calibration was performed using an industry standard; i.e., the Karl Fischer titration method. Moisture content is one of the most important quality parameters of numerous food products, including spices, teas, fruits, and vegetables, as well as in herbal medicines. It is decisive for the product stability and shelf life, and requires close monitoring. In the analyzed scenario, for the calibration/prediction procedure, in addition to the standard PLSR method, GPR and ANN models also were constructed for the spectral sets of each instrument. For each spectral set, a systematic evaluation of the best pretreatment combination was conducted as well. The prediction performances of those calibration models were evaluated through the root-mean-square error of prediction (RMSEP) determined for an independent test set (Table 10). The nonlinear GPR and ANN methods were noted to offer substantially improved performances in the case of poorer quality of the spectra from certain instruments, as well as in the case of the more challenging analysis of unpretreated samples. In this case, the miniaturized spectrometers offered a prediction performance at the level of the benchtop instruments (Table 10). Moreover, the samples in their native states proved to be more difficult to analyze for all evaluated instruments when using PLSR calibration [31]. That study demonstrated the potential of improving the analytical figure of merit of micro-NIR analysis for less-than-ideal data-sets; e.g., resulting from the difficult nature of the analyzed sample (i.e., chemically complex plant matrix) and the reduced quality of the spectra (i.e., narrow spectral region, lower resolution, and poorer S/N ratio typically accepted for the miniaturized spectrometers). This suggested that through systematic evaluation and selection of the data-analytical scheme, the penalty to the accuracy resulting from the hardware miniaturization can be compensated by using GPR or ANN calibration.
Table 10.
RMSEP values for validation of an independent test set resulting from PLSR, GPR, and ANN. The best performance levels are highlighted. Reproduced (CC-BY 4.0 license) from [31].
5.2. NIR Sensor Fusion
Data-fusion methodologies offer considerable potential, effectively combining strengths of different analytical techniques. The opportunities stemming from this concept for food and beverage authentication and quality assessment were discussed in detail by Borràs et al. [196]. However, relatively greater attention was paid to using conventional benchtop NIR spectroscopy as the component of the fused approaches.
For example, an integrated analytical framework using fused physicochemical analyses, benchtop NIR spectroscopy, and melissopalynology (pH, electrical conductivity, and humidity) was recently presented by Bodor et al. [197]. An analytical method was developed to check the authenticity of Hungarian honey, with PCA-LDA models built to classify the different botanical and geographic sources using individual and fused data at a low level (i.e., low-level data fusion). Optimization of the number of principal components (PCs) and external validation were applied to all models. The botanical origin classification models demonstrated >90% and >55% accuracy levels for the melissopalynology and NIR methods when used separately. Improved results were obtained by combining physicochemical, melissopalynology, and NIR techniques, resulting in >99% and >81% accuracy of the botanical and geographic origin classification models developed for the fused data, respectively. Although a benchtop NIR spectrometer was used in that study, a similar method can likely be designed to include miniaturized/portable NIR instruments as well.
On the other hand, a direct improvement of the performance of NIR sensors with mutually exclusive operational spectral regions can be accomplished by data fusion as well. Several cost-effective miniaturized NIR sensors appeared on the market that were specifically intended for food analysis [5,6,7,77]. These devices are potentially very interesting for the small-scale manufacturing of food, which is becoming increasingly popular. Efficient quality control in such production poses considerable difficulties, and the final product quality depends on the supplied ingredients. Miniaturized NIR spectrometers are particularly promising in such scenarios, but often manifest inferior performances compared to benchtop NIR spectrometers; in certain cases, no successful calibration by PLSR could be obtained for some sensors in particularly challenging analyses [31,99]. As discussed in the previous section, advanced calibration methods offer promising potential in such cases. Further gains can be obtained with sensor fusion, which offers a convenient uplift in performance by combining spectra measured in different wavenumber regions for extended access to chemical information for more reliable calibration.
Although still relatively scarce, studies of effective data-fusion strategies that integrated miniaturized NIR spectrometers have begun to attract growing attention in the fields of food and agriculture. In the study of Bec et al. [73], a benchtop (Buchi NIRFlex N-500) and three miniaturized (MicroNIR 1700 ES, Tellspec Enterprise sensor, and SCiO sensor) NIR spectrometers were evaluated and optimized within a calibration framework based on the PLSR and GPR methods for prediction of the protein content in fitness bars containing edible insect material. The analyzed protein content in the calibration series was between 19.3 and 23.0% (Table 11). In the nondestructive analysis of intact bars, the RMSEP values from the PLSR prediction were determined to be 0.611% for the benchtop, and remained in the range of 0.545 to 0.659% for the miniaturized spectrometers. The predictions by GPR models were 0.506% (benchtop) and 0.482–0.580% (miniaturized). When taking into account the milled samples, the corresponding RMSEP values for the PLSR prediction were improved to 0.210% for the benchtop spectrometer, but remained in the inferior range of 0.525–0.571% for the miniaturized devices. However, the RMSEP values for GPR prediction for the miniaturized spectrometers were noticeably improved to 0.230% (MicroNIR 1700 ES), 0.326% (Tellspec), and 0.338% (SCiO). In combination with the PLSR method, the portable instruments showed a significantly lower predictive performance as measured by the RMSEP values determined for the data from an independent test set. Using a nonlinear GPR calibration method significantly improved the accuracy of prediction of the miniaturized spectrometers, with the MicroNIR achieving a performance equal to the stationary instrument, while only a slightly worse performance was achieved by the Tellspec and SCiO sensors.
Table 11.
The parameters of the regression models constructed for the fused spectral data from the two cost-effective miniaturized NIR spectrometers (Tellspec Enterprise sensor and SCiO sensor) for the analysis of protein content in intact and milled bars. Analyzed protein concentration range: 19.3–23.0 % (w/w). Reproduced (CC-BY 4.0 license) from [73].
A further increase in the reliability of the analysis can be achieved by low-level fusion of the spectra from spectrometers measuring largely different, only partially overlapping fragments of NIR spectrum, such as the SCiO and Tellspec instruments considered in that study (Figure 8). The Tellspec and SCiO sensors cover highly complementary VIS/SW-NIR and NIR wavelength ranges, with only a narrow overlap of the spectral regions measured by these two devices (Figure 8). Therefore, an attempt was made to aggregate (i.e., concatenate) the data from these sensors to effectively provide the calibration model with an extended spectral region compared to any of these two spectrometers used separately. In the GPR calibration and test-set validation performed on the fused data (Tellspec + SCiO), the RMSEP values were improved to 0.517% (for intact samples) and 0.295% (for milled samples). Because the Tellspec and SCiO sensors are consumer-oriented devices with superior affordability, it is still a cost-effective and economical option to use them together to increase the accuracy and reliability of an analysis. Fused-sensor NIR spectroscopy, with the combined strengths of multiple miniaturized portable instruments, can be successfully used for rapid, nondestructive analysis of total protein content with better performance than the sensors used separately.
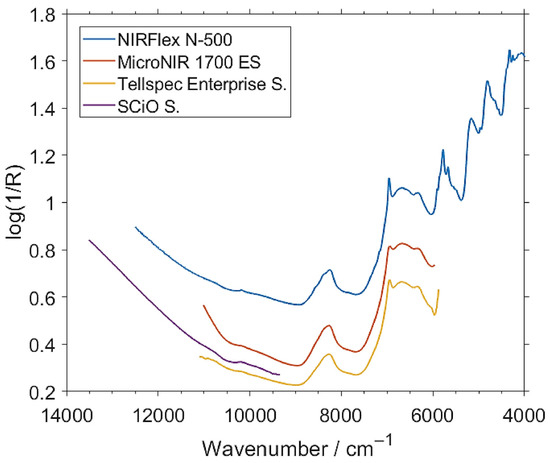
Figure 8.
Unpretreated NIR spectra of exemplary intact insect protein fitness bar samples measured by a benchtop NIRFlex N-500 and three miniaturized (MicroNIR 1700 ES, Tellspec Enterprise sensor, and SCiO sensor) spectrometers. The two latter sensors are cost-effective designs specifically intended for food analysis by consumers. Reproduced (CC-BY 4.0 license) from [73].
Furthermore, Cavallini et al. [198] recently explored a midlevel data-fusion approach for three different NIR spectrometers: SCiO, MicroNIR, and a benchtop instrument (Bruker MPA). Additionally, covariance selection (CovSel) [199] and common dimensions (ComDim) [200] approaches were applied as well to establish a robust approach for distinguishing between fresh and frozen cephalopods. Interestingly, the authors noted that the similarities and differences among the datasets measured by these three instruments reflected their design characteristics.
The conclusions that might be drawn from the data-fusion studies involving miniaturized NIR sensors suggest that the profound instrumental differences often observed for these devices create a particular opportunity for fusion approaches to provide direct gains in analytical performance.
On the other hand, a different approach to reinforcing an analytical framework using miniaturized NIR spectrometers through a data-fusion approach stems from parallelization of spectra pretreatments. As concluded in numerous case studies, and as outlined in other sections of this review, miniaturized sensors often provide spectra of inferior quality, in various terms, compared to full-scale benchtop instruments. Often, most of the resulting distortions of the spectra (e.g., scattering profile, noise) can be corrected or suppressed by separately applied algorithms. However, a promising alternative is provided by applying the pretreatments in parallel and fusing the resulting datasets for further calibration and prediction. The methodological background of this concept was recently exhaustively presented by Mishra et al. [201]. Given the importance of the pretreatment step in processing the challenging spectral datasets often encountered in agri-food NIR analysis using miniaturized spectrometers, it should be expected that parallelized spectra pretreatment via data fusion will attract increasing attention in the development of analytical methods in the reviewed area of application.
5.3. Chemical Interpretation of Calibration Models and Instrumental Differences
With the recently provided availability of in silico simulated NIR spectra, it has become feasible to elucidate in detail the sensor sensitivity to specific chemical information, and thus gain a deeper insight into the critical factors that affect its prediction performance in a given analytical application. Accordingly, the differences in the prediction power of caffeine and L-theanine content in black tea using the microPHAZIR and MicroNIR instruments were analyzed in detail in a recent investigation by Mayr et al. [100]. The authors concluded that the sensitivities of these two miniaturized spectrometers to the characteristic absorption bands of these two components were distinct. This resulted from the observed substantial differences in the way the different NIR instruments recorded the chemical information of caffeine compared to theanine. Handheld spectrometers have shown a limited suitability for assessing theanine, as the meaningful absorption of this constituent falls outside the spectral region measured by these devices. On the contrary, the most characteristic absorption of caffeine is acquired by these handhelds, and as a consequence, their performance in analyzing caffeine content is comparable to that of a benchtop device. These observations suggest that the application of both spectrometers in the analysis of compounds structurally similar to caffeine may be successful, while in the chemicals structurally similar to theanine, it may be challenging for both instruments [100]. Similar conclusions have been drawn from the combined interpretation of the simulated spectrum of piperine and the chemometric models calibrated for the prediction of that chemical in the plant matrix of black pepper from the spectral datasets acquired by the same set of miniaturized spectrometers [99]. The noticeably different spectral regions that these devices measured illustrated a clear distinction between their abilities to acquire the meaningful absorption of a given constituent; in that case, piperine [99].
Another good example of how the comprehension of chemical information can be used in such scenario was provided by the further investigation by Grabska et al. into the patterns unveiled in the above-discussed studies [97]. In that study, the detailed band assignments of piperine offered insights into the correspondence of the PLS factors in the models describing piperine content in black pepper samples. The NIR vibrational contributions of piperine could be roughly established. The analysis using a benchtop spectrometer NIRFlex N-500 (Figure 9A) and a handheld microPHAZIR (Figure 9B) was dissected. The narrow spectral region in which the microPHAZIR operates (6266–4173 cm−1) was just enough to acquire the most meaningful absorption of piperine, with only weak second overtones and ternary combination bands populating the spectrum above 6150 cm−1. Firstly, as expected, the structure of the loading plots for all factors indicated a clear correspondence with the absorption features of piperine. Interestingly, exclusion of the region between 5550 and 4950 cm−1 improved the performance of the prediction for the microPHAZIR. Comparing this information with the determined vibrational assignments, one may conclude that the contributions from weak CH combination bands of piperine to the NIR spectrum of black pepper were not acquired to a satisfactory degree by the microPHAZIR. The model constructed for the microPHAZIR required four factors to obtain the maximum predictive performance, while for the dataset from the benchtop spectrometer, the optimal number of factors was three. The structures of the first factors for both cases are quite similar, and these seem to capture the most intense bands of piperine. Note, the structure of the third factor in the case of benchtop spectrometer clearly stands out from the remaining ones, e.g., above 6000 cm−1 and in the region of 5300–4900 cm−1. At these wavenumbers, one may see, standing out from the rest as well, the contributions from the combination bands involving CH and, to lesser extent, the ring deformation bands of piperine. The presence of the combinations involving ring deformation were also viable in the second factor for the benchtop spectrometer, where a distinct structure was observed near 4750–4500 cm−1.
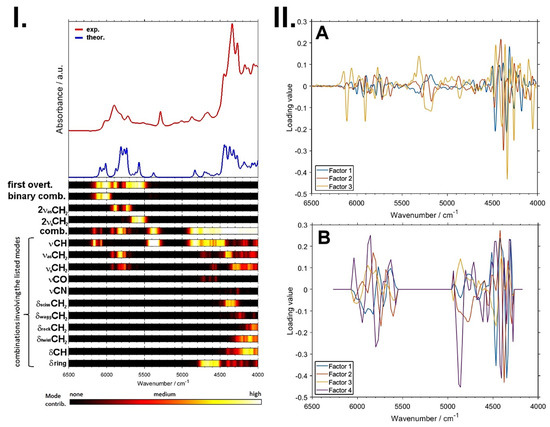
Figure 9.
Panel (I): simulated spectrum elucidates vibrational contributions to NIR spectrum of piperine. Panel (II): this information enables the interpretation of the chemical information in the loading plots for the PLSR model of piperine content in black pepper developed for the NIR spectral sets measured with (A) a benchtop Büchi NIRFlex N-500; and (B) a miniaturized microPHAZIR spectrometer. Reproduced (CC-BY 4.0 license) from [97].
The conclusions drawn in this study indicated that the laboratory spectrometer appeared to be more sensitive to the specific vibrations of piperine in black pepper. As shown, for example, by the factor 3 corresponding to νCH combination bands of piperine that was clearly distinct from the others (i.e., F-1 and F-2). There was also a significant part of the ring-deformation bands that contributed to the second and third factors in the PLSR model calibrated for the spectral set measured by the benchtop NIRFlex N-500 spectrometer. Therefore, in this case, a more accurate association between the distinct chemical information and the particular factors in the regression model was recorded.
In contrast, the factors in the PLSR model constructed for the spectral set from the microPHAZIR appeared to be less specific to individual vibrations of piperine. Consequently, the microPHAZIR was less capable of following fine spectral variations representing intensity changes in the spectrum related to a specific chemical constituent.
It is likely that the poorer spectral resolution of the miniaturized spectrometer also played a role here. It remains to be seen whether this observation can explain, at least in part, the poorer performance of the microPHAZIR spectrometer compared to the laboratory spectrometer in the analysis under discussion (root-mean-square of prediction; i.e., RMSEP of 0.30 and 0.18% w/w, respectively) [97].
5.4. Calibration Transfer
A calibration model, regardless of whether the intended problem to solve concerns classification (e.g., food authentication, identification of variety, brand, origin, etc.) or quantification (i.e., prediction of concentration of a targeted constituent, age of product, etc.) is generally valid only if the spectra used for predicting the property of interest is measured by the same spectrometer by which the calibration set was obtained. The critical difference here results from the disparity between two or more instruments with respect to key optical performance parameters such as the operating spectral region, wavelength accuracy, dynamic range, distance between sample and optics, the photometric response of the detector, etc. These differences are very likely to invalidate the prediction model when used with a different instrument, thus necessitating time-consuming calibration and validation for each specific spectrometer. On the other hand, in practical routines, often more than one NIR instrument; e.g., benchtop and miniaturized, or several miniaturized ones, are available at the site. Considerable gains in the efficiency of the analytical framework can be provided by the ability to perform calibration procedure on just one master instrument, which is then subsequently used for predictions from the spectra collected by the other sensors.
Various mathematical algorithms known as calibration-transfer or standardization strategies help convert models or data measured by a particular instrument for use by other instruments [202]. For this purpose, the following frameworks are widely used for eliminating the need for full recalibration: standardization of model coefficients, spectral responses, direct standardization (DS), segmental direct standardization (PDS), and spectral variations at each wavelength [202].
Examples demonstrating the utility value of calibration transfer in food analysis and quality control appeared in literature shortly after the first miniaturized spectrometers were popularized on the market. For example, the aim of the study of Pierna et al. [203] was to assess the possibility of transferring the calibration from the benchtop Foss NIRSystem 6500 instrument to the miniaturized microPHAZIR. In that case, good calibration models were obtained for the various feed properties (fat, fiber, protein, and starch) that were developed on the Foss NIRSystem 6500 on the basis of the spectral database of 9164 samples, and these were subsequently successfully transferred to the handheld spectrometer.
In another example, Zamora-Rojaset et al. [142] evaluated the performance of a miniaturized handheld NIRS instrument for assembling a meat-quality database from a high-performance benchtop NIR spectrometer. The authors showed that large databases of spectra of important samples collected over several years could be successfully transferred to a miniaturized, handheld NIR instrument, which is possibly better suited for in situ analysis on an industrial scale. The successful transfer of the database to the miniaturized NIR instrument provided considerable gains in efficiency and throughput of the analysis, particularly in a large-scale, low-cost online in situ analysis, a scenario that is commonly found in food industries.
6. Summary of Current Trends and Future Prospects
NIR spectroscopy is a powerful tool for qualitative and quantitative analyses involving different types of samples used in various industries. The canonical advantages of NIR spectroscopy; i.e., nondestructive analysis, high-throughput capacity, cost-effectiveness, and its “green” nature (i.e., no chemical solvent used, no expenditure of the product for the needs of analysis), form a perfect synergy with the novel, miniaturized sensor technology. With the advent of portable spectrometers, decisive enhancement of NIR spectroscopy in its utility in the agri-food sector was offered. The unique value of miniaturized NIR spectroscopy is best manifested in this sector, on which the analysis of complex, chemically and physically diverse samples of natural origin is focused; i.e., raw food materials, whole and highly processed foods, and agricultural crops. Importantly, this technology permits the persistent monitoring of food quality at every stage of its complex production and supply chain, from the farm to the shelf. In these applications, the revolutionary advantage of miniaturized sensors is manifested by the capacity to perform rapid, high-throughput analyses with no need for sample preparation directly onsite.
Accompanying progress in technology, recent breakthroughs in spectral-analysis methods and fundamental science have decisively changed our understanding of NIR spectra and largely expanded the potential for new applications. Comprehension of chemical information enables the interpretation of calibration models, while sensor fusion enhances the availability of the information correlated with food-quality parameters. The progress in data-analytical methods and the fundamental science underlying NIR spectra permit the knowledge-based design and optimization of the analytical application of NIR spectroscopy. These qualities have directly translated to a thriving development of new applications of miniaturized NIR spectroscopy, as it is readily available to combat food-safety risks resulting from the globalization of the food market. Hence, it has become widely adopted in this critically important sector of public interest.
While immensely successful and widespread, the technology and applications of miniaturized NIR spectroscopy still face certain challenges that should be considered in the future. Unexplored areas such as sensor deterioration and transferability of the models to new generations of instruments have been signaled by recent reviews published in the field. On the other hand, ultraminiaturization and the trend aiming at providing ordinary consumers with a spectrometer in their pocket urge the reinforced reliability of precalibrated models, as well as the user-friendliness and accessibility of cloud-based services that are intended for the processing and analysis of the spectra from such sensors. The reliable and fail-proof operation of NIR spectrometers integrated with smartphones by nonexpert personnel and ordinary consumers would mark the next cornerstone of this technology in food analysis, provided that the outlined challenges are successfully addressed.
Author Contributions
Conceptualization, K.B.B. and J.G.; investigation, K.B.B. and J.G.; writing—original draft preparation, K.B.B. and J.G.; writing—review and editing, K.B.B., J.G. and C.W.H.; visualization, K.B.B. and J.G.; supervision, C.W.H. All authors have read and agreed to the published version of the manuscript.
Funding
This work was supported by the Austrian Science Fund (FWF) (P32004-N28).
Acknowledgments
Open Access Funding by the Austrian Science Fund (FWF).
Conflicts of Interest
The authors declare no conflict of interest.
References
- Ozaki, Y.; Huck, C.W.; Tsuchikawa, S.; Engelsen, S.B. (Eds.) Near-Infrared Spectroscopy; Springer: Singapore, 2021. [Google Scholar]
- Ozaki, Y.; Huck, C.W.; Beć, K.B. Near-IR spectroscopy and its applications. In Molecular and Laser Spectroscopy. Advances and Applications; Gupta, V.P., Ed.; Elsevier: San Diego, CA, USA, 2018; pp. 11–38. [Google Scholar] [CrossRef]
- Huck, C.W.; Beć, K.B.; Grabska, J. Near infrared spectroscopy in natural product research. In Encyclopedia of Analytical Chemistry: Applications, Theory and Instrumentation; Meyers, R.A., Ed.; John Wiley & Sons: Hoboken, NJ, USA, 2020; pp. 1–29. [Google Scholar] [CrossRef]
- Cozzolino, D. Advantages, opportunities, and challenges of vibrational spectroscopy as tool to monitor sustainable food systems. Food Anal. Methods 2022, 15, 1390–1396. [Google Scholar] [CrossRef]
- Beć, K.B.; Grabska, J.; Huck, C.W. Principles and applications of miniaturized near-infrared (NIR) spectrometers. Chem. Eur. J. 2021, 27, 1514–1532. [Google Scholar] [CrossRef] [PubMed]
- Crocombe, R.A. Portable spectroscopy. App. Spectr. 2018, 72, 1701–1751. [Google Scholar] [CrossRef] [PubMed]
- Beć, K.B.; Grabska, J.; Siesler, H.W.; Huck, C.W. Handheld near-infrared spectrometers: Where are we heading? NIR News 2020, 31, 28–35. [Google Scholar] [CrossRef]
- Cozzolino, D. From consumers’ science to food functionality—Challenges and opportunities for vibrational spectroscopy. Adv. Food Nutr. Res. 2021, 97, 119–146. [Google Scholar] [CrossRef]
- Cozzolino, D. Introduction to food quality, traceability and foodomics section. In Comprehensive Foodomics; Cifuentes, A., Ed.; Elsevier: Amsterdam, The Netherlands, 2020; p. 224. [Google Scholar] [CrossRef]
- Cozzolino, D.; Roberts, J. Spectroscopy analysis of beverages. In Spectroscopic Methods in Food Analysis; Franca, A.S., Nollet, L., Eds.; CRC Press: Boca Raton, FL, USA, 2017; pp. 429–434. [Google Scholar] [CrossRef]
- Cozzolino, D. Near infrared spectroscopy and food authenticity. In Advances in Food Traceability Techniques and Technologies: Improving Quality throughout the Food Chain; Espiñeira, M., Santaclara, F.J., Eds.; Elsevier: Cambridge, MA, USA, 2016; pp. 119–136. [Google Scholar] [CrossRef]
- Roberts, J.; Power, A.; Chapman, J.; Chandra, S.; Cozzolino, D. Vibrational spectroscopy methods for agro-food product analysis. Compr. Anal. Chem. 2018, 80, 51–68. [Google Scholar] [CrossRef]
- Cozzolino, D. Food adulteration. In Spectroscopic Methods in Food Analysis; Franca, A.S., Nollet, L., Eds.; CRC Press: Boca Raton, FL, USA, 2017; pp. 353–361. [Google Scholar] [CrossRef]
- Cozzolino, D. Authentication of cereals and cereal products. In Advances in Food Authenticity Testing; Downey, G., Ed.; Woodhead Publishing: Duxford, UK, 2016; pp. 441–457. [Google Scholar] [CrossRef]
- Beć, K.B.; Grabska, J.; Huck, C.W. Portable spectroscopy applications in food, feed and agriculture. In Portable Spectroscopy and Spectrometry 2: Applications; Crocombre, R.A., Leary, P.E., Kammrath, B.W., Eds.; John Wiley & Sons, Ltd.: Hoboken, NJ, USA, 2021; pp. 299–324. [Google Scholar] [CrossRef]
- Beć, K.B.; Grabska, J.; Huck, C.W. Issues in hyperspectral traceability of foods. In Comprehensive Foodomics; Cifuentes, A., Ed.; Elsevier: Amsterdam, The Netherlands, 2021; Volume 3, pp. 258–289. [Google Scholar] [CrossRef]
- Beć, K.B.; Grabska, J.; Huck, C.W. NIR spectral analysis of natural medicines supported by novel instrumentation, methods of data analysis and interpretation. J. Pharm. Biomed. Anal. 2020, 193, 113686. [Google Scholar] [CrossRef]
- Beć, K.B.; Grabska, J.; Huck, C.W. Infrared and near-infrared spectroscopic techniques for the quality control of herbal medicines. In Evidence-Based Validation of Herbal Medicine; Mukherjee, P.K., Ed.; Elsevier: Amsterdam, The Netherlands, 2022. [Google Scholar]
- Beć, K.B.; Grabska, J.; Huck, C.W. Miniaturized near-infrared spectroscopy in natural product analysis. Current and future directions. In Molecular and Laser Spectroscopy—Advances and Applications; Gupta, V.P., Ed.; Elsevier: Amsterdam, The Netherlands, 2022; Volume 3. [Google Scholar]
- Grabska, J.; Beć, K.B.; Huck, C.W. Current and future applications of IR and NIR spectroscopy in ecology, environmental studies, wildlife and plant investigations. In Comprehensive Analytical Chemistry; Cozzolino, V.D., Ed.; Elsevier: Amsterdam, The Netherlands, 2021; Volume 95. [Google Scholar] [CrossRef]
- Beć, K.B.; Grabska, J.; Huck, C.W. Near-infrared (NIR) sensors in environmental analysis. In Encyclopedia of Sensor Technology; Narayan, R., Ed.; Elsevier: Amsterdam, The Netherlands, 2022. [Google Scholar]
- Chapman, J.; Truong, V.K.; Elbourne, A.; Gangadoo, S.; Cheeseman, S.; Rajapaksha, P.; Latham, K.; Crawford, R.J.; Cozzolino, D. Combining chemometrics and sensors: Toward new applications in monitoring and environmental analysis. Chem. Rev. 2020, 120, 6048–6069. [Google Scholar] [CrossRef]
- Cozzolino, D. Near infrared spectroscopy as a tool to monitor contaminants in soil, sediments and water—State of the art, advantages and pitfalls. Trends Environ. Anal. Chem. 2016, 9, 1–7. [Google Scholar] [CrossRef]
- Beć, K.B.; Grabska, J.; Bonn, G.K.; Popp, M.; Huck, C.W. Principles and applications of vibrational spectroscopic imaging studies in plant science: A review. Front. Plant Sci. 2020, 11, 1226. [Google Scholar] [CrossRef]
- Ozaki, Y. NIR spectroscopy—What a wonderful world! NIR News 2022, 33, 10–17. [Google Scholar] [CrossRef]
- Ozaki, Y.; McClure, W.F.; Christy, A.A. (Eds.) Near-Infrared Spectroscopy in Food Science and Technology; Wiley-Interscience: Hoboken, NJ, USA, 2007. [Google Scholar] [CrossRef]
- Kirchler, C.G.; Pezzei, C.K.; Beć, K.B.; Mayr, S.; Ishigaki, M.; Ozaki, Y.; Huck, C.W. Critical evaluation of spectral information of benchtop vs. portable near-infrared spectrometers: Quantum chemistry and two-dimensional correlation spectroscopy for a better understanding of PLS regression models of the rosmarinic acid content in Rosmarini folium. Analyst 2017, 142, 455–464. [Google Scholar] [CrossRef] [PubMed]
- Czarnecki, M.A.; Beć, K.B.; Grabska, J.; Hofer, T.S.; Ozaki, Y. Overview of application of NIR spectroscopy to physical chemistry. In Near-Infrared Spectroscopy; Ozaki, Y., Huck, C.W., Tsuchikawa, S., Engelsen, S.B., Eds.; Springer: Singapore, 2021; pp. 297–330. [Google Scholar] [CrossRef]
- Beć, K.B.; Grabska, J.; Huck, C.W. Near-infrared spectroscopy in bio-applications. Molecules 2020, 25, 2948. [Google Scholar] [CrossRef] [PubMed]
- Beć, K.B.; Grabska, J.; Ozaki, Y. Advances in anharmonic methods and their applications to vibrational spectroscopies. In Frontiers of Quantum Chemistry; Wójcik, M.J., Nakatsuji, H., Kirtman, B., Ozaki, Y., Eds.; Springer: Singapore, 2017; pp. 438–512. [Google Scholar] [CrossRef]
- Mayr, S.; Beć, K.B.; Grabska, J.; Wiedemair, V.; Pürgy, V.; Popp, M.A.; Bonn, G.K.; Huck, C.W. Challenging handheld NIR spectrometers with moisture analysis in plant matrices: Performance of PLSR vs. GPR vs. ANN modelling. Spectrochim. Acta A 2021, 249, 119342. [Google Scholar] [CrossRef]
- Griffiths, P.R. Resolution and instrument line shape function. In Handbook of Vibrational Spectroscopy; Griffiths, P.R., Chalmers, J.M., Eds.; John Wiley & Sons, Ltd.: Hoboken, NJ, USA, 2006; pp. 241–248. [Google Scholar] [CrossRef]
- Workman, J., Jr. Optical spectrometers. In Applied Spectroscopy: A Compact Reference for Practitioners; Workman, J., Jr., Springsteen, A., Eds.; Academic Press: Cambridge, MA, USA, 1998; pp. 3–28. [Google Scholar] [CrossRef]
- Ikehata, A. NIR optics and measurement methods. In Near-Infrared Spectroscopy; Ozaki, Y., Huck, C.W., Tsuchikawa, S., Engelsen, S.B., Eds.; Springer: Singapore, 2021; pp. 211–233. [Google Scholar] [CrossRef]
- Okura, T. Hardware of near-infrared spectroscopy. In Near-Infrared Spectroscopy; Ozaki, Y., Huck, C.W., Tsuchikawa, S., Engelsen, S.B., Eds.; Springer: Singapore, 2021; pp. 235–264. [Google Scholar] [CrossRef]
- Lutz, O.M.D.; Bonn, G.K.; Rode, B.M.; Huck, C.W. Reproducible quantification of ethanol in gasoline via a customized mobile near-infrared spectrometer. Anal. Chim. Acta 2014, 826, 61–68. [Google Scholar] [CrossRef]
- Schubert, E.F. Light-Emitting Diodes, 3rd ed.; Cambridge University Press: Cambridge, UK, 2018. [Google Scholar]
- Schubert, E.F. Resonant-cavity light-emitting diodes. In Light-Emitting Diodes, 2nd ed.; Cambridge University Press: Cambridge, UK, 2012; pp. 255–274. [Google Scholar] [CrossRef]
- Antila, J.; Tuohiniemi, M.; Rissanen, A.; Kantojarvi, U.; Lahti, M.; Viherkanto, K.; Kaarre, M.; Malinen, J.; Nasila, A. MEMS- and MOEMS-based near-infrared spectrometers. In Encyclopedia of Analytical Chemistry; John Wiley: Hoboken, NJ, USA, 2021. [Google Scholar] [CrossRef]
- Dyer, S.A. Hadamard transform spectrometry. Chemom. Intell. Lab. Syst. 1991, 12, 101–115. [Google Scholar] [CrossRef]
- Fateley, W.G. Hadamard transform instrumentation: A variety of choices. In Infrared Technology and Applications, Proceedings of the SPIE Eighth International Conference Infrared Technology and Applications, London, UK, 26–28 June 1990; SPIE: Bellingham, WA, USA, 1990; Volume 1320, p. 1320. [Google Scholar] [CrossRef]
- Hammaker, R.M.; DeVerse, R.A.; Asunskis, D.J.; Fateley, W.G. Hadamard transform near infrared spectrometers. In Handbook of Vibrational Spectroscopy; Griffiths, P., Chalmers, J.M., Eds.; John Wiley & Sons Ltd.: Hoboken, NJ, USA, 2006. [Google Scholar] [CrossRef]
- Lu, Z.; Zhang, J.; Liu, H.; Xu, J.; Li, J. The improvement on the performance of DMD Hadamard transform near-infrared spectrometer by double filter strategy and a new Hadamard mask. Micromachines 2019, 10, 149. [Google Scholar] [CrossRef]
- Huck, C.W. New trend in instrumentation of NIR spectroscopy—Miniaturization. In Near-Infrared Spectroscopy; Ozaki, Y., Huck, C.W., Tsuchikawa, S., Engelsen, S.B., Eds.; Springer: Singapore, 2021; pp. 193–210. [Google Scholar] [CrossRef]
- Vollmer, M.; Möllmann, K.-P.; Shaw, J.A. The optics and physics of near infrared imaging. In Education and Training in Optics and Photonics: ETOP 2015, Proceedings of the Education and Training in Optics and Photonics: ETOP 2015, Bordeaux, France, 29 June–2 July 2015; SPIE: Bellingham, WA, USA, 2015; Volume 9793, p. 97930Z. [Google Scholar] [CrossRef]
- InnoSpectra. Available online: http://www.inno-spectra.com/en/product (accessed on 6 August 2021).
- SphereOptics. Available online: http://sphereoptics.de/en/product/nir-s-g1/ (accessed on 6 August 2021).
- Sagitto. Available online: https://cloud.sagitto.com/ (accessed on 6 August 2021).
- Allied Scientific. Available online: https://alliedscientificpro.com/shop/product/g1-nirvascan-smart-near-infrared-spectrometer-reflective-model-g1-21390 (accessed on 6 August 2021).
- Tellspec. Available online: http://tellspec.com/ (accessed on 6 August 2021).
- Spectral Engines. Available online: https://www.spectralengines.com/products/nirone-sensors (accessed on 6 August 2021).
- Hamamatsu. Available online: https://www.hamamatsu.com/us/en/product/optical-sensors/spectrometers/ftir_engine/index.html (accessed on 6 August 2021).
- VIAVI. Available online: https://www.viavisolutions.com/en-us/osp/products/micronir-onsite-w (accessed on 6 August 2021).
- Si-Ware Systems. Available online: https://www.neospectra.com/our-offerings/neospectra-scanner/ (accessed on 6 August 2021).
- Thermo Fischer Scientific. Material Identification Analyzers. Available online: https://www.thermofisher.com/search/browse/category/us/en/90150372/material+identification+analyzers (accessed on 20 December 2021).
- Thermo Fischer Scientific. Available online: https://static.thermoscientific.com/images/D22399~.pdf (accessed on 6 August 2021).
- Thermo Fischer Scientific. Available online: https://www.thermofisher.com/order/catalog/product/MICROPHAZIRPC?SID=srch-srp-MICROPHAZIRPC#/MICROPHAZIRPC?SID=srch-srp-MICROPHAZIRPC (accessed on 6 August 2021).
- Thermo Fischer Scientific. Available online: https://www.thermofisher.com/order/catalog/product/MICROPHAZIRRX?SID=srch-srp-MICROPHAZIRRX#/MICROPHAZIRRX?SID=srch-srp-MICROPHAZIRRX (accessed on 6 August 2021).
- Thermo Fischer Scientific. Available online: https://www.thermofisher.com/order/catalog/product/MICROPHAZIRAS#/MICROPHAZIRAS (accessed on 6 August 2021).
- AB Vista. Available online: https://www.abvista.com/Products/GB/NIR-4-Farm.aspx (accessed on 6 August 2021).
- ZEISS. Available online: https://www.zeiss.com/spectroscopy/products/spectrometer-systems/aura-handheld-nir.html#benefitsandequipment (accessed on 6 August 2021).
- Dinamica Generale. Available online: https://www.dinamicagenerale.com/en-ww/x-nir.aspx (accessed on 6 April 2022).
- Michael, I. NIR pocket-size food scanner, Spectroscopy Europe World 2019. Available online: https://www.spectroscopyeurope.com/news/nir-pocket-size-food-scanner (accessed on 6 April 2022).
- Consumer Physics. Available online: https://www.consumerphysics.com/technology/ (accessed on 6 August 2021).
- McGonigle, A.J.S.; Wilkes, T.C.; Pering, T.D.; Willmott, J.R.; Cook, J.M.; Mims, F.M., III; Parisi, A.V. Smartphone spectrometers. Sensors 2018, 18, 223. [Google Scholar] [CrossRef]
- Michael, I. Smartphone NIR. 2018. Spectroscopy Europe. Available online: https://www.spectroscopyeurope.com/news/smartphone-nir (accessed on 6 April 2022).
- Reinig, R.; Grüger, H.; Knobbe, J.; Pügner, T.; Meyer, S. Bringing NIR spectrometers into mobile phones. In MOEMS and Miniaturized Systems XVII, Proceedings of the SPIE OPTO, San Francisco, CA, USA, 27 January–1 February 2018; SPIE: Bellingham, WA, USA, 2018; Volume 10545, p. 105450F. [Google Scholar] [CrossRef]
- Pasquini, C. Near Infrared Spectroscopy: Fundamentals, practical aspects and analytical applications. J. Braz. Chem. Soc. 2003, 14, 198–219. [Google Scholar] [CrossRef]
- Mark, H.; Workman, J., Jr. Chemometrics in Spectroscopy, 2nd ed.; Academic Press: Cambridge, MA, USA, 2018. [Google Scholar]
- Heise, H.M.; Winzen, R. Chemometrics in near-infrared spectroscopy. In Near-Infrared Spectroscopy; Siesler, H.W., Ozaki, Y., Kawata, S., Heise, H.M., Eds.; Wiley-VCH: Weinheim, Germany, 2002; pp. 125–162. [Google Scholar] [CrossRef]
- Xue, J.; Fuentes, S.; Poblete-Echeverria, C.; Gonzalez Viejo, C.; Tongson, E.; Du, H.; Su, B. Automated Chinese medicinal plants classification based on machine learning using leaf morpho-colorimetry, fractal dimension and visible/near infrared spectroscopy. Int. J. Agric. Biol. Eng. 2019, 12, 123–131. [Google Scholar] [CrossRef]
- Nazarenko, D.V.; Rodin, I.A.; Shpigun, O.A. The use of machine learning in the analytical control of the preparations of medicinal plants. Inorg. Mater. 2019, 55, 1428–1438. [Google Scholar] [CrossRef]
- Beć, K.B.; Grabska, J.; Plewka, N.; Huck, C.W. Insect protein content analysis in handcrafted fitness bars by NIR spectroscopy. Gaussian process regression and data fusion for performance enhancement of miniaturized cost-effective consumer-grade sensors. Molecules 2021, 26, 6390. [Google Scholar] [CrossRef] [PubMed]
- Mishra, P.; Passos, D. A synergistic use of chemometrics and deep learning improved the predictive performance of near-infrared spectroscopy models for dry matter prediction in mango fruit. Chemom. Intell. Lab. Syst. 2021, 212, 104287. [Google Scholar] [CrossRef]
- Mishra, P.; Passos, D. Deep chemometrics: Validation and transfer of a global deep near-infrared fruit model to use it on a new portable instrument. J. Chemom. 2021, 35, e3367. [Google Scholar] [CrossRef]
- Passos, D.; Mishra, P. A tutorial on automatic hyperparameter tuning of deep spectral modelling for regression and classification tasks. Chemom. Intell. Lab. Syst. 2022, 223, 104520. [Google Scholar] [CrossRef]
- Giussani, B.; Gorla, G.; Riu, J. Analytical chemistry strategies in the use of miniaturised NIR instruments: An overview. Crit. Rev. Anal. Chem. 2022, 2022, 1–33. [Google Scholar] [CrossRef]
- Beć, K.B.; Grabska, J.; Huck, C.W. Physical principles of infrared spectroscopy. In Comprehensive Analytical Chemistry; Cozzolino, D., Ed.; Elsevier: Amsterdam, The Netherlands, 2020. [Google Scholar] [CrossRef]
- Beć, K.B.; Grabska, J.; Hofer, T.S. Introduction to quantum vibrational spectroscopy. In Near-Infrared Spectroscopy; Ozaki, Y., Huck, C.W., Tsuchikawa, S., Engelsen, S.B., Eds.; Springer: Singapore, 2021; pp. 83–110. [Google Scholar] [CrossRef]
- Beć, K.B.; Grabska, J.; Huck, C.W.; Ozaki, Y. Quantum mechanical simulation of near-infrared spectra. Applications in physical and analytical chemistry. In Molecular Spectroscopy: A Quantum Chemistry Approach; Ozaki, Y., Wójcik, M.J., Popp, J., Eds.; Wiley-VCH: Weinheim, Germany, 2019; Volume 2, pp. 353–388. [Google Scholar] [CrossRef]
- Beć, K.B.; Grabska, J.; Huck, C.W. Current and future research directions in computer-aided near-infrared spectroscopy: A perspective. Spectrochim. Acta A 2021, 254, 119625. [Google Scholar] [CrossRef]
- Beć, K.B.; Huck, C.W. (Eds.) Advances in Near Infrared Spectroscopy and Related Computational Methods; MDPI: Basel, Switzerland, 2020. [Google Scholar] [CrossRef]
- Ozaki, Y.; Beć, K.B.; Morisawa, Y.; Yamamoto, S.; Tanabe, I.; Huck, C.W.; Hofer, T.S. Advances, challenges and perspectives of quantum chemical approaches in molecular spectroscopy of the condensed phase. Chem. Soc. Rev. 2021, 50, 10917–10954. [Google Scholar] [CrossRef]
- Beć, K.B.; Grabska, J.; Huck, C.W.; Czarnecki, M.A. Effect of conformational isomerism on NIR spectra of ethanol isotopologues. Spectroscopic and anharmonic DFT study. J. Mol. Liq. 2020, 310, 113271. [Google Scholar] [CrossRef]
- Beć, K.B.; Grabska, J.; Huck, C.W.; Czarnecki, M.A. Spectra–structure correlations in isotopomers of ethanol (CX3CX2OX.; X = H, D): Combined near-infrared and anharmonic computational study. Molecules 2019, 24, 2189. [Google Scholar] [CrossRef]
- Grabska, J.; Beć, K.B.; Ozaki, Y.; Huck, C.W. Temperature drift of conformational equilibria of butyl alcohols studied by near-infrared spectroscopy and fully anharmonic DFT. J. Phys. Chem. A 2017, 121, 1950–1961. [Google Scholar] [CrossRef] [PubMed]
- Beć, K.B.; Karczmit, D.; Kwaśniewicz, M.; Ozaki, Y.; Czarnecki, M.A. Overtones of νCN vibration as a probe of structure of liquid CH3CN, CD3CN, and CCl3CN: Combined infrared, near-infrared, and Raman spectroscopic studies with anharmonic density functional theory calculations. J. Phys. Chem. A 2019, 123, 4431–4442. [Google Scholar] [CrossRef] [PubMed]
- Grabska, J.; Beć, K.B.; Ishigaki, M.; Huck, C.W.; Ozaki, Y. NIR spectra simulations by anharmonic DFT-saturated and unsaturated long-chain fatty acids. J. Phys. Chem. B 2018, 122, 6931–6944. [Google Scholar] [CrossRef] [PubMed]
- Beć, K.B.; Grabska, J.; Ozaki, Y.; Czarnecki, M.A.; Huck, C.W. Simulated NIR spectra as sensitive markers of the structure and interactions in nucleobases. Sci. Rep. 2019, 9, 17398. [Google Scholar] [CrossRef] [PubMed]
- Beć, K.B.; Grabska, J.; Badzoka, J.; Huck, C.W. Spectra-structure correlations in NIR region of polymers from quantum chemical calculations. The cases of aromatic ring, C=O, C≡N and C-Cl functionalities. Spetrochim. Acta A 2021, 262, 120085. [Google Scholar] [CrossRef]
- Beć, K.B.; Grabska, J.; Huck, C.W.; Mazurek, S.; Czarnecki, M.A. Anharmonicity and spectra-structure correlations in MIR and NIR spectra of crystalline menadione (vitamin K3). Molecules 2021, 26, 6779. [Google Scholar] [CrossRef]
- Beć, K.B.; Huck, C.W. Breakthrough potential in near-infrared spectroscopy: Spectra simulation. A review of recent developments. Front. Chem. 2019, 7, 48. [Google Scholar] [CrossRef]
- Grabska, J.; Beć, K.B.; Ozaki, Y.; Huck, C.W. Anharmonic DFT study of near-infrared spectra of caffeine. Vibrational analysis of the second overtones and ternary combinations. Molecules 2021, 26, 5212. [Google Scholar] [CrossRef]
- Grabska, J.; Beć, K.B.; Kirchler, C.G.; Ozaki, Y.; Huck, C.W. Distinct difference in sensitivity of NIR vs. IR bands of melamine to inter-molecular interactions with impact on analytical spectroscopy explained by anharmonic quantum mechanical study. Molecules 2019, 24, 1402. [Google Scholar] [CrossRef]
- Beć, K.B.; Grabska, J.; Kirchler, C.G.; Huck, C.W. NIR spectra simulation of thymol for better understanding of the spectra forming factors, phase and concentration effects and PLS regression features. J. Mol. Liq. 2018, 268, 895–902. [Google Scholar] [CrossRef]
- Grabska, J. Current frontiers in quantum chemical simulations of NIR spectra—Polymers, biomolecules, aqueous matrix, and interpretation of instrumental difference of handheld spectrometers. NIR News 2021, 32, 7–14. [Google Scholar] [CrossRef]
- Grabska, J.; Beć, K.B.; Mayr, S.; Huck, C.W. Theoretical simulation of near-infrared spectrum of piperine. Insight into band origins and the features of regression models. Appl. Spectr. 2021, 75, 1022–1032. [Google Scholar] [CrossRef] [PubMed]
- Mayr, S.; Strasser, S.; Kirchler, C.G.; Meischl, F.; Stuppner, S.; Beć, K.B.; Grabska, J.; Sturm, S.; Popp, M.; Stuppner, H.; et al. Quantification of Silymarin in Silybi mariani fructus: Challenging the analytical performance of benchtop vs. handheld NIR spectrometers on whole seeds. Planta Med. 2022, 88, 20–23. [Google Scholar] [CrossRef] [PubMed]
- Mayr, S.; Beć, K.B.; Grabska, J.; Schneckenreiter, E.; Huck, C.W. Near-infrared spectroscopy in quality control of Piper nigrum: A Comparison of performance of benchtop and handheld spectrometers. Talanta 2021, 223, 121809. [Google Scholar] [CrossRef] [PubMed]
- Mayr, S.; Schmelzer, J.; Kirchler, C.G.; Pezzei, C.K.; Beć, K.B.; Grabska, J.; Huck, C.W. Theae nigrae folium: Comparing the analytical performance of benchtop and handheld near-infrared spectrometers. Talanta 2021, 221, 121165. [Google Scholar] [CrossRef]
- Rodriguez-Saona, L.; Aykas, D.P.; Rodrigues Borba, K.; Urtubia, A. Miniaturization of optical sensors and their potential for high-throughput screening of foods. Curr. Opin. Food Sci. 2020, 31, 136–150. [Google Scholar] [CrossRef]
- Müller-Maatsch, J.; van Ruth, S.M. Handheld devices for food authentication and their applications: A review. Foods 2021, 10, 2901. [Google Scholar] [CrossRef]
- Qu, J.-H.; Liu, D.; Cheng, J.-H.; Sun, D.-W.; Ma, J.; Pu, H.; Zeng, X.-A. Applications of near-infrared spectroscopy in food safety evaluation and control: A review of recent research advances. Crit. Rev. Food Sci. Nutr. 2015, 55, 1939–1954. [Google Scholar] [CrossRef]
- Dos Santos, C.A.T.; Lopo, M.; Páscoa, R.N.; Lopes, J.A. A Review on the applications of portable near-infrared spectrometers in the agro-food industry. Appl. Spec. 2013, 67, 1215–1233. [Google Scholar] [CrossRef]
- Alander, J.T.; Bochko, V.; Martinkauppi, B.; Saranwong, S.; Mantere, T. A Review of optical nondestructive visual and near-infrared methods for food quality and safety. Int. J. Spectrosc. 2013, 2013, 341402. [Google Scholar] [CrossRef]
- Ellis, D.I.; Muhamadali, H.; Haughey, S.A.; Elliott, C.T.; Goodacre, R. Point-and-shoot: Rapid quantitative detection methods for on-site food fraud analysis—Moving out of the laboratory and into the food supply chain. Anal. Methods 2015, 7, 9401–9414. [Google Scholar] [CrossRef]
- Liu, N.; Parra, H.A.; Pustjens, A.; Hettinga, K.; Mongondry, P.; van Ruth, S.M. Evaluation of portable near-infrared spectroscopy for organic milk authentication. Talanta 2018, 184, 128–135. [Google Scholar] [CrossRef] [PubMed]
- Dos Santos Pereira, E.V.; de Sousa Fernandes, D.D.; Ugulino de Araujo, M.C.; Dias Diniz, H.G.; Sucupira Maciel, M.I. In-situ authentication of goat milk in terms of its adulteration with cow milk using a low-cost portable NIR spectrophotometer. Microchem. J. 2021, 163, 105885. [Google Scholar] [CrossRef]
- Van Ruth, S.; Liu, N. How organic is organic milk? Can we have a quick check? NIR News 2019, 30, 18–21. [Google Scholar] [CrossRef]
- De la Roza-Delgado, B.; Garrido-Varo, A.; Soldado, A.; Gonzalez Arrojo, A.; Cuevas Valdes, M.; Maroto, F.; Perez-Marin, D. Matching portable NIRS instruments for in situ monitoring indicators of milk composition. Food Control 2017, 76, 74–81. [Google Scholar] [CrossRef]
- Muniz, R.; Cuevas-Valdes, M.; de la Roza-Delgado, B. Milk quality control requirement evaluation using a handheld near infrared reflectance spectrophotometer and a bespoke mobile application. J. Food Compos. Anal. 2020, 86, 103388. [Google Scholar] [CrossRef]
- Riu, J.; Gorla, G.; Chakif, D.; Boque, R.; Giussani, B. Rapid analysis of milk using low-cost pocket-size NIR spectrometers and multivariate analysis. Foods 2020, 9, 1090. [Google Scholar] [CrossRef]
- De Lima, G.F.; Cardoso Andrade, S.A.; da Silva, V.H.; Araujo, H. Multivariate classification of UHT milk as to the presence of lactose using benchtop and portable NIR spectrometers. Food Anal. Methods 2018, 11, 2699–2706. [Google Scholar] [CrossRef]
- Llano Suarez, P.; Soldado, A.; Gonzalez-Arrojo, A.; Vincente, F.; de la Roza-Delgado, B. Rapid on-site monitoring of fatty acid profile in raw milk using a handheld near infrared sensor. J. Food Compos. Anal. 2018, 70, 1–8. [Google Scholar] [CrossRef]
- Risoluti, R.; Gullifa, G.; Materazi, S. Assessing the quality of milk using a multicomponent analytical platform MicroNIR/chemometric. Front. Chem. 2020, 8, 614718. [Google Scholar] [CrossRef]
- Pu, Y.; Peres-Marin, D.; O’Shea, N.; Garrido-Vara, A. Recent advances in portable and handheld NIR spectrometers and applications in milk, cheese and dairy powders. Foods 2021, 10, 2377. [Google Scholar] [CrossRef] [PubMed]
- Riu, J.; Gorla, G.; Giussani, B. Miniaturized near-infrared instruments in dairy products or dairy industry: First steps in a long-distance race? NIR News 2021, 32, 17–19. [Google Scholar] [CrossRef]
- Wiedemair, V.; Langore, D.; Garsleitner, R.; Dillinger, K.; Huck, C.W. Investigations into the performance of a novel pocket-sized near-infrared spectrometer for cheese analysis. Molecules 2019, 24, 428. [Google Scholar] [CrossRef] [PubMed]
- Eskildsen, C.E.; Sanden, K.W.; Wubshet, S.G.; Andersenm, P.V.; Oyaas, J.; Wold, J.P. Estimating dry matter and fat content in blocks of Swiss cheese during production using on-line near infrared spectroscopy. J. Near Infrared Spectrosc. 2019, 27, 293–301. [Google Scholar] [CrossRef]
- Ma, Y.B.; Babu, K.S.; Amamcharla, J.K. Prediction of total protein and intact casein in cheddar cheese using a low-cost handheld short-wave near-infrared spectrometer. LWT-Food Sci. Technol. 2019, 109, 319–326. [Google Scholar] [CrossRef]
- Yaman, H.; Aykas, D.; Jiménez-Flores, R.; Rodriguez-Saona, L.E. Monitoring the ripening attributes of Turkish white cheese using miniaturized vibrational spectrometers. J. Dairy Sci. 2022, 105, 40–55. [Google Scholar] [CrossRef]
- Manuelian, C.L.; Ghetti, M.; De Lorenzi, C.; Pozza, M.; Franzoi, M.; De Marchi, M. Feasibility of pocket-sized near-infrared spectrometer for the prediction of cheese quality traits. J. Food Compos. Anal. 2022, 105, 104245. [Google Scholar] [CrossRef]
- Marinoni, L.; Stroppa, A.; Barzaghi, S.; Cremonesi, K.; Pricca, N.; Meucci, A.; Pedrolini, G.M.; Gallia, A.; Cabassia, G. On site monitoring of Grana Padano cheese production using portable spectrometers. In Proceedings of the 18th International Conference on Near Infrared Spectroscopy, Copenhagen, Denmark, 11–15 June 2017; pp. 85–90. [Google Scholar] [CrossRef]
- Stocco, G.; Cipolat-Gotet, C.; Ferragina, A.; Berzaghi, P.; Bittante, G. Accuracy and biases in predicting the chemical and physical traits of many types of cheeses using different visible and near-infrared spectroscopic techniques and spectrum intervals. J. Dairy Sci. 2019, 102, 9622–9638. [Google Scholar] [CrossRef]
- Wu, D.; He, Y.; Feng, S. Short-wave near-infrared spectroscopy analysis of major compounds in milk powder and wavelength assignment. Anal. Chim. Acta 2008, 10, 232–242. [Google Scholar] [CrossRef]
- Kong, W.W.; Zhang, C.; Gong, A.P.; He, Y. Irradiation dose detection of irradiated milk powder using visible and near-infrared spectroscopy and chemometrics. J. Dairy Sci. 2013, 96, 4921–4927. [Google Scholar] [CrossRef]
- Karunathilaka, S.R.; Yakes, B.J.; He, K.; Chung, J.K.; Mossoba, M.M. Non-targeted NIR spectroscopy and SIMCA classification for commercial milk powder authentication: A study using eleven potential adulterants. Heliyon 2018, 4, e00806. [Google Scholar] [CrossRef] [PubMed]
- Charlebois, S.; Schwab, A.; Henn, R.; Huck, C.W. Food fraud: An exploratory study for measuring consumer perception towards mislabeled food products and influence on self-authentication intentions. Trends Food Sci. Technol. 2016, 50, 211–218. [Google Scholar] [CrossRef]
- Wiedemair, V.; De Biasio, M.; Leitner, R.; Balthasar, D.; Huck, C.W. Application of design of experiment for detection of meat fraud with a portable near-infrared spectrometer. Curr. Anal. Chem. 2018, 14, 58–67. [Google Scholar] [CrossRef]
- Dixit, Y.; Pham, H.Q.; Realini, C.E.; Agnew, M.P.; Craigie, C.R.; Reis, M.M. Evaluating the performance of a miniaturized NIR spectrophotometer for predicting intramuscular fat in lamb: A comparison with benchtop and hand-held Vis-NIR spectrophotometers. Meat Sci. 2020, 162, 108026. [Google Scholar] [CrossRef]
- Parastar, H.; van Kollenburg, G.; Weesepoel, Y.; van den Doel, A.; Buydens, L.; Jansen, J. Integration of handheld NIR and machine learning to “Measure & Monitor” chicken meat authenticity. Food Control 2020, 112, 107149. [Google Scholar] [CrossRef]
- Prado, N.; Fernández-Ibáñez, V.; González, P.; Saldado, A. On-Site NIR spectroscopy to control the shelf life of pork meat. Food Anal. Methods 2011, 4, 582–589. [Google Scholar] [CrossRef]
- Cáceres-Nevado, J.M.; Garrido-Varo, A.; De Pedro-Sanz, E.; Pérez-Marín, D.C. NIR handheld miniature spectrometer to increase the efficiency of Iberian pig selection schemes based on chemical traits. Spectrochim. Acta A 2021, 258, 119865. [Google Scholar] [CrossRef]
- Wei, W.; Peng, Y.; Qiao, L. Development of hand-held nondestructive detection device for assessing meat freshness. In Sensing for Agriculture and Food Quality and Safety VIII, Proceedings of the SPIE Commercial + Scientific Sensing and Imaging, Baltimore, MD, USA 17–21 April 2016; SPIE: Bellingham, WA, USA, 2016; p. 98640W. [Google Scholar] [CrossRef]
- Wei, W.; Peng, Y.; Li, Y.; Qiao, L. Lightweight portable nondestructive detection technique for assessing meat freshness attributes based on light emitting diode array. In Proceedings of the ASABE Annual International Meeting, New Orleans, LA, USA, 26–29 July 2015; American Society of Agricultural and Biological Engineers: St. Joseph, MI, USA, 2015; pp. 1–6. [Google Scholar] [CrossRef]
- Lee, S.; Noh, T.G.; Choi, J.H.; Han, J.; Ha, J.Y.; Lee, J.Y.; Park, Y. NIR spectroscopic sensing for point-of-need freshness assessment of meat, fish, vegetables and fruits. In Sensing for Agriculture and Food Quality and Safety IX, Proceedings of the SPIE Commercial + Scientific Sensing and Imaging, 2017, Anaheim, CA, USA, 9–13 April 2017; SPIE: Bellingham, WA, USA, 2017; Volume 10217, p. 1021708. [Google Scholar] [CrossRef]
- Goi, A.; Hocquette, J.-F.; Pellattiero, E.; De Marchi, M. Handheld near-infrared spectrometer allows on-line prediction of beef quality traits. Meat Sci. 2022, 184, 108694. [Google Scholar] [CrossRef]
- Nolasco Perez, I.M.; Badaro, A.T.; Barbon, S., Jr.; Barbon, A.P.A.; Pollonio, M.A.R.; Barbin, D.F. Classification of chicken parts using a portable near-infrared (NIR) spectrophotometer and machine learning. Appl. Spectr. 2018, 72, 1774–1780. [Google Scholar] [CrossRef]
- Silva, L.C.R.; Folli, G.S.; Santos, L.P.; Barros, I.H.A.S.; Oliveira, B.G.; Borghi, F.T.; dos Santos, F.D.; Filgueiras, P.R.; Romão, W. Quantification of beef, pork, and chicken in ground meat using a portable NIR spectrometer. Vib. Spectrosc. 2020, 111, 103158. [Google Scholar] [CrossRef]
- Dumalisile, P.; Manley, M.; Hoffman, L.; Williams, P.J. Discriminating muscle type of selected game species using near infrared (NIR) spectroscopy. Food Control 2020, 110, 106981. [Google Scholar] [CrossRef]
- Schmutzler, M.; Beganovic, A.; Böhler, G.; Huck, C.W. Methods for detection of pork adulteration in veal product based on FT-NIR spectroscopy for laboratory, industrial and on-site analysis. Food Control 2015, 57, 258–267. [Google Scholar] [CrossRef]
- Zamora-Rojas, E.; Pérez-Marín, D.; De Pedro-Sanz, E.; Guerrero-Ginel, J.E.; Garrido-Varo, A. Handheld NIRS analysis for routine meat quality control: Database transfer from at-line instruments. Chem. Intel. Lab. Sys. 2012, 114, 30–35. [Google Scholar] [CrossRef]
- Prieto, N.; Juarez, M.; Larsen, I.L.; Lopez-Campos, O.; Zijlstra, R.T.; Aalhus, J.L. Rapid discrimination of enhanced quality pork by visible and near infrared spectroscopy. Meat Sci. 2015, 110, 76–84. [Google Scholar] [CrossRef]
- Patel, N.; Toledo-Alvarado, H.; Bittante, G. Performance of different portable and hand-held near-infrared spectrometers for predicting beef composition and quality characteristics in the abattoir without meat sampling. Meat Sci. 2021, 178, 106518. [Google Scholar] [CrossRef]
- Kucha, C.T.; Ngadi, M.O. Rapid assessment of pork freshness using miniaturized NIR spectroscopy. J. Food Meas. Charact. 2020, 14, 1105–1115. [Google Scholar] [CrossRef]
- Prieto, N.; Dugan, M.E.R.; Juárez, M.; López-Campos, Ó.; Zijlstra, R.T.; Aalhus, J.L.; Plaizier, J. Using portable near-infrared spectroscopy to predict pig subcutaneous fat composition and iodine value. Can. J. Anim. Sci. 2018, 98, 221–229. [Google Scholar] [CrossRef]
- Horcada, A.; Valera, M.; Juarez, M.; Fernandez-Cabanas, V.M. Authentication of Iberian pork official quality categories using a portable near infrared spectroscopy (NIRS) instrument. Food Chem. 2020, 318, 126471. [Google Scholar] [CrossRef]
- Jacquet, J.L.; Pauly, D. Trade secrets: Renaming and mislabeling of seafood. Mar. Policy 2008, 32, 309–318. [Google Scholar] [CrossRef]
- Di Pinto, A.; Mottola, A.; Marchetti, P.; Bottaro, M.; Terio, V.; Bozzo, G.; Bonerba, E.; Ceci, E.; Tantillo, G. Packaged frozen fishery products: Species identification, mislabeling occurrence and legislative implications. Food Chem. 2016, 194, 279–283. [Google Scholar] [CrossRef]
- Donlan, C.J.; Luque, G.M. Exploring the causes of seafood fraud: A meta-analysis on mislabeling and price. Mar. Policy 2019, 100, 258–264. [Google Scholar] [CrossRef]
- Grassi, S.; Casiraghi, E.; Alamprese, C. Handheld NIR device: A non-targeted approach to assess authenticity of fish fillets and patties. Food Chem. 2018, 243, 382–388. [Google Scholar] [CrossRef] [PubMed]
- O’Brien, N.; Hulse, C.A.; Pfeifer, F.; Siesler, H.W. Near infrared spectroscopic authentication of seafood. J. Near Infrared Spectrosc. 2013, 21, 299–305. [Google Scholar] [CrossRef]
- Sciuto, S.; Esposito, G.; Dell’Atti, L.; Rossi, F.; Riina, M.V.; Merlo, G.; Magnani, L.; Benso, A.; Bozzetta, E.M.; Acutis, P.L. A New approach against food frauds: The portable near-infrared device for fish fillets identification. Sch. J. Food Nutr. 2021, 4, 442–447. [Google Scholar] [CrossRef]
- Shimamoto, J.; Hiratsuka, S.; Hasegawa, K.; Sato, M.; Kawano, S. Rapid non-destructive determination of fat content in frozen skipjack using a portable near infrared spectrophotometer. Fish. Sci. 2003, 69, 856–860. [Google Scholar] [CrossRef]
- Gonçalves, D.B.; Santos, C.S.P.; Pinho, T.; Queirós, R.; Vaz, P.D.; Bloore, M.; Satta, P.; Kovács, Z.; Casal, S.; Hoffmann, I. Near infrared reflectance spectroscopy coupled to chemometrics as a cost-effective, rapid, and non-destructive tool for fish fraud control: Monitoring source, condition, and nutritional value of five common whitefish species. J. AOAC Int. 2021, 104, 53–60. [Google Scholar] [CrossRef]
- Nieto-Ortega, S.; Olabarrieta, I.; Saitua, E.; Arana, G.; Foti, G.; Melado-Herreros, A. Improvement of oil valorization extracted from fish by-products using a handheld near infrared spectrometer coupled with chemometrics. Foods 2022, 11, 1092. [Google Scholar] [CrossRef]
- Pennisi, F.; Giraudo, A.; Cavallini, N.; Esposito, G.; Merlo, G.; Geobaldo, F.; Acutis, P.L.; Pezzolato, M.; Savorani, F.; Bozzetta, E. Differentiation between fresh and thawed cephalopods using NIR spectroscopy and multivariate data analysis. Foods 2021, 10, 528. [Google Scholar] [CrossRef]
- Schmutzler, M.; Huck, C.W. Simultaneous detection of total antioxidant capacity and total soluble solids content by Fourier transform near-infrared (FT-NIR) spectroscopy: A quick and sensitive method for on-site analyses of apples. Food Cont. 2016, 66, 27–37. [Google Scholar] [CrossRef]
- Sánchez, M.T.; de la Haba, M.J.; Benítez-López, M.; Fernández-Novales, J.; Garrido-Varo, A.; Pérez-Marín, D. Non-destructive characterization and quality control of intact strawberries based on NIR spectral data. J. Food Eng. 2012, 110, 102–108. [Google Scholar] [CrossRef]
- Torres, I.; Pérez-Marín, D.; De la Haba, M.J.; Sánchez, M.T. Developing universal models for the prediction of physical quality in citrus fruits analysed on-tree using portable NIRS sensors. Biosyst. Eng. 2017, 153, 140–148. [Google Scholar] [CrossRef]
- Amuah, C.L.Y.; Teye, E.; Lamptey, F.P.; Nyandey, K.; Opoku-Ansah, J.; Osei-Wusu Adueming, P. Feasibility study of the use of handheld NIR spectrometer for simultaneous authentication and quantification of quality parameters in intact pineapple fruits. J. Spectrosc. 2019, 2019, 5975461. [Google Scholar] [CrossRef]
- Pérez-Marín, D.; Paz, P.; Guerrero, J.-E.; Garrido-Varo, A.; Sánchez, M.-T. Miniature handheld NIR sensor for the on-site non-destructive assessment of post-harvest quality and refrigerated storage behavior in plums. J. Food Eng. 2010, 99, 294–302. [Google Scholar] [CrossRef]
- Malegori, C.; Nascimento Marques, E.J.; de Freitas, S.T.; Pimentel, M.F.; Pasquini, C.; Casiraghi, E. Comparing the analytical performances of Micro-NIR and FT-NIR spectrometers in the evaluation of acerola fruit quality, using PLS and SVM regression algorithms. Talanta 2017, 165, 112–116. [Google Scholar] [CrossRef] [PubMed]
- Baca-Bocanegra, B.; Hernandez-Hierro, J.M.; Nogales-Bueno, J.; Heredia, F.J. Feasibility study on the use of a portable micro near infrared spectroscopy device for the “in vineyard” screening of extractable polyphenols in red grape skins. Talanta 2019, 192, 353–359. [Google Scholar] [CrossRef]
- Wokadala, O.C.; Human, C.; Willemse, S.; Emmambux, N.M. Rapid non-destructive moisture content monitoring using a handheld portable Vis–NIR spectrophotometer during solar drying of mangoes (Mangifera indica L.). J. Food Meas. Charact. 2020, 14, 790–798. [Google Scholar] [CrossRef]
- Tardaguila, J.; Fernández-Novales, J.; Gutiérrez, S.; Paz Diago, M. Non-destructive assessment of grapevine water status in the field using a portable NIR spectrophotometer. J. Sci. Food Agric. 2017, 97, 3772–3780. [Google Scholar] [CrossRef]
- Ma, Y.; Zhang, G.-Z.; Rita-Cindy, S.A.-A. Quantification of water, protein and soluble sugar in mulberry leaves using a handheld near-infrared spectrometer and multivariate analysis. Molecules 2019, 24, 4439. [Google Scholar] [CrossRef]
- Yan, H.; Xu, Y.-C.; Siesler, H.W.; Han, B.-X.; Zhang, G.-Z. Hand-held near-infrared spectroscopy for authentication of fengdous and quantitative analysis of mulberry fruits. Front. Plant Sci. 2019, 10, 1548. [Google Scholar] [CrossRef]
- Pérez-Marín, D.; Torres, I.; Entrenas, K.A.; Vega, M.; Sánchez, M.T. Pre-harvest screening on-vine of spinach quality and safety using NIRS technology. Spectrochim. Acta A 2019, 207, 242–250. [Google Scholar] [CrossRef]
- Sánchez, M.T.; Entrenas, J.A.; Torres, I.; Vega, M.; Pérez-Marín, D. Monitoring texture and other quality parameters in spinach plants using NIR spectroscopy. Comput. Electron. Agric. 2018, 155, 446–452. [Google Scholar] [CrossRef]
- Borba, K.R.; Aykas, D.P.; Milani, M.I.; Colnago, L.A.; Ferreira, M.D.; Rodriguez-Saona, L.E. Portable near infrared spectroscopy as a tool for fresh tomato quality control analysis in the field. Appl. Sci. 2021, 11, 3209. [Google Scholar] [CrossRef]
- Castrignanò, A.; Buttafuoco, G.; Malegori, C.; Genorini, E.; Iorio, R.; Stipic, M.; Girone, G.; Venezia, A. Assessing the feasibility of a miniaturized near-infrared spectrometer in determining quality attributes of San Marzano tomato. Food Anal. Methods 2019, 12, 1497–1510. [Google Scholar] [CrossRef]
- Henn, R.; Schwab, A.; Huck, C.W. Evaluation of benchtop versus portable near-infrared spectroscopic method combined with multivariate approaches for the fast and simultaneous quantitative analysis of main sugars in syrup formulations. Food Control 2016, 68, 97–104. [Google Scholar] [CrossRef]
- Henn, R.; Kirchler, C.G.; Huck, C.W. Miniaturized NIR spectroscopy for the determination of main carbohydrates in syrup. NIR News 2017, 28, 3–6. [Google Scholar] [CrossRef]
- Wang, J.; Zareef, M.; He, P.; Sun, H.; Chen, Q.; Li, H.; Ouyang, Q.; Guo, Z.; Zhang, Z.; Xu, D. Evaluation of matcha tea quality index using portable NIR spectroscopy coupled with chemometric algorithms. J. Sci. Food Agric. 2019, 99, 5019–5027. [Google Scholar] [CrossRef]
- Wang, Y.-J.; Li, T.-H.; Li, L.-Q.; Ning, J.-M.; Zhang, Z.-Z. Micro-NIR spectrometer for quality assessment of tea: Comparison of local and global models. Spectrochim. Acta A 2020, 237, 118403. [Google Scholar] [CrossRef]
- Correia, R.M.; Tosato, F.; Domingos, E.; Rodrigues, R.R.T.; Aquino, L.F.M.; Filgueiras, P.R.; Lacerd, V., Jr.; Romão, W. Portable near infrared spectroscopy applied to quality control of Brazilian coffee. Talanta 2018, 176, 59–68. [Google Scholar] [CrossRef]
- Jiang, W.; Marini, G.; van Berkel, N.; Sarsenbayeva, Z.; Tan, Z.; Luo, C.; He, X.; Dingler, T.; Goncalves, J.; Kawahara, Y.; et al. Probing sucrose contents in everyday drinks using miniaturized near-infrared spectroscopy scanners. Proc. ACM Interact. Mob. Wearable Ubiquitous Technol. 2019, 3, 1–25. [Google Scholar] [CrossRef]
- Li, H.; Takahashi, Y.; Kumagai, M.; Fujiwara, K.; Kikuchi, R.; Yoshimura, N.; Amano, T.; Lin, J.; Ogawa, N. A chemometrics approach for distinguishing between beers using near infrared spectroscopy. J. Near Infrared Spectrosc. 2009, 17, 69–76. [Google Scholar] [CrossRef]
- Sato, T.; Kumagai, M.; Amano, T.; Ogawa, N. Discrimination of japanese sake using a portable near-infrared spectrometer and chemometrics. Bunseki Kagaku 2003, 52, 653–660. [Google Scholar] [CrossRef]
- Zareef, M.; Chen, Q.S.; Ouyang, Q.; Arslan, M.; Hassan, M.M.; Ahmad, W.; Viswadevarayalu, A.; Wang, P.; Ancheng, W. Rapid screening of phenolic compounds in congou black tea (Camellia sinensis) during in vitro fermentation process using portable spectral analytical system coupled chemometrics. J. Food Process. Preserv. 2019, 43, e13996. [Google Scholar] [CrossRef]
- Oliveira, M.M.; Cruz-Tirado, J.P.; Roque, J.V.; Teófilo, R.F.; Barbin, D.F. Portable near-infrared spectroscopy for rapid authentication of adulterated paprika powder. J. Food Compos. Anal. 2020, 87, 103403. [Google Scholar] [CrossRef]
- Coronel-Reyes, J.; Ramirez-Morales, I.; Fernandez-Blanco, E.; Rivero, D.; Pazos, A. Determination of egg storage time at room temperature using a low-cost NIR spectrometer and machine learning techniques. Comput. Electron. Agric. 2018, 145, 1–10. [Google Scholar] [CrossRef]
- Yu, H.; Liu, H.; Wang, Q.; van Ruth, S. Evaluation of portable and benchtop NIR for classification of high oleic acid peanuts and fatty acid quantitation. LWT 2020, 128, 109398. [Google Scholar] [CrossRef]
- Basri, K.N.; Hussain, M.N.; Bakar, J.; Sharif, Z.; Khir, M.F.A.; Zoolfakar, A.S. Classification and quantification of palm oil adulteration via portable NIR spectroscopy. Spectrochim. Acta A 2017, 173, 335–342. [Google Scholar] [CrossRef]
- You, H.; Kim, Y.; Lee, J.H.; Choi, S. Classification of food powders using handheld NIR spectrometer. In Proceedings of the 9th International Conference on Ubiquitous and Future Networks (ICUFN), Milan, Italy, 4–7 July 2017; pp. 732–734. [Google Scholar] [CrossRef]
- Neves, M.D.G.; Poppi, R.J.; Siesler, H.W. Rapid determination of nutritional parameters of pasta/sauce blends by handheld near-infrared spectroscopy. Molecules 2019, 24, 2029. [Google Scholar] [CrossRef]
- Modroño, S.; Soldado, A.; Martínez-Fernández, A.; De la Roza-Delgado, B. Handheld NIRS sensors for routine compound feed quality control: Real time analysis and field monitoring. Talanta 2017, 162, 597–603. [Google Scholar] [CrossRef]
- Rukundo, I.R.; Danao, M.G.C.; MacDonald, J.C.; Wehling, R.L.; Weller, C.L. Performance of two handheld NIR spectrometers to quantify crude protein of composite animal forage and feedstuff. AIMS Agric. Food 2021, 6, 462–477. [Google Scholar] [CrossRef]
- Kosmowski, F.; Worku, T. Evaluation of a miniaturized NIR spectrometer for cultivar identification: The case of barley, chickpea and sorghum in Ethiopia. PLoS ONE 2018, 13, e0193620. [Google Scholar] [CrossRef]
- Teye, E.; Amuah, C.L.Y.; McGrath, T.; Elliot, C. Innovative and rapid analysis for rice authenticity using hand-held NIR spectrometry and chemometrics. Spectrochim. Acta A 2019, 217, 147–154. [Google Scholar] [CrossRef] [PubMed]
- McVey, C.; Gordon, U.; Haughey, S.A.; Elliott, C.T. Assessment of the analytical performance of three near-infrared spectroscopy instruments (benchtop, handheld and portable) through the investigation of coriander seed authenticity. Foods 2021, 10, 956. [Google Scholar] [CrossRef] [PubMed]
- Barthet, V.J.; Petryk, M.W.P.; Siemens, B. Rapid nondestructive analysis of intact canola seeds using a handheld near-infrared spectrometer. J. Am. Oil. Chem. Soc. 2020, 97, 577–589. [Google Scholar] [CrossRef]
- Wiedemair, V.; Huck, C.W. Investigating the total antioxidant capacity of gluten-free grains with miniaturized near-infrared spectrometer. NIR News 2019, 30, 35–38. [Google Scholar] [CrossRef]
- Giussani, B.; Escalante-Quiceno, A.T.; Boque, R.; Riu, J. Measurement strategies for the classification of edible oils using low-cost miniaturised portable NIR instruments. Foods 2021, 10, 2856. [Google Scholar] [CrossRef]
- Borràs, E.; Ferré, J.; Boqué, R.; Mestres, M.; Aceña, L.; Busto, O. Data fusion methodologies for food and beverage authentication and quality assessment—A review. Anal. Chim. Acta 2015, 891, 1–14. [Google Scholar] [CrossRef]
- Bodor, Z.; Kovacs, Z.; Benedek, C.; Hitka, G.; Behling, H. Origin identification of hungarian honey using melissopalynology, physicochemical analysis, and near infrared spectroscopy. Molecules 2021, 26, 7274. [Google Scholar] [CrossRef]
- Cavallini, N.; Giraudo, A.; Pennisi, F.; Esposito, G.; Pezzolato, M.; Savorani, F. Exploring common and distinct information among three different kinds of NIR instruments by means of chemometrics. In Proceedings of the NIRItalia, Online, 24–25 February 2021. [Google Scholar] [CrossRef]
- Roger, J.M.; Palagos, B.; Bertrand, D.; Fernandez-Ahumada, E. CovSel: Variable selection for highly multivariate and multi-response calibration. Application to IR spectroscopy. Chemom. Intell. Lab. Syst. 2011, 106, 216–223. [Google Scholar] [CrossRef]
- Cariou, V.; Jouan-Rimbaud Bouveresse, D.; Qannari, E.M.; Rutledge, D.N. ComDim methods for the analysis of multiblock data in a data fusion perspective. In Data Handling in Science and Technology; Elsevier Ltd.: Amsterdam, The Netherlands, 2019; pp. 179–204. [Google Scholar] [CrossRef]
- Mishra, P.; Roger, J.M.; Marini, F.; Biancolillo, A.; Rutledge, D.N. Parallel pre-processing through orthogonalization (PORTO) and its application to near-infrared spectroscopy. Chemom. Intell. Lab. Syst. 2021, 212, 104190. [Google Scholar] [CrossRef]
- Feudale, R.N.; Woody, N.A.; Tan, H.; Myles, A.J.; Brown, S.D.; Ferré, J. Transfer of multivariate calibration models: A review. Chemom. Intell. Lab. Syst. 2002, 64, 181–192. [Google Scholar] [CrossRef]
- Pierna, J.A.F.; Vermeulen, P.; Lecler, B.; Baeten, V.; Dardenne, P. Calibration transfer from dispersive instruments to handheld spectrometers. App. Spectr. 2010, 64, 644–648. [Google Scholar] [CrossRef] [PubMed]


Publisher’s Note: MDPI stays neutral with regard to jurisdictional claims in published maps and institutional affiliations. |
© 2022 by the authors. Licensee MDPI, Basel, Switzerland. This article is an open access article distributed under the terms and conditions of the Creative Commons Attribution (CC BY) license (https://creativecommons.org/licenses/by/4.0/).