Article

Chemical Composition Analysis and Antioxidant Activity of Coffea robusta Monofloral Honeys from Vietnam

1
Institute of Biotechnology and Food Technology, Industrial University of Ho Chi Minh City, Ho Chi Minh 700000, Vietnam
2
School of Pharmacy, College of Medicine, National Cheng Kung University, Tainan 701, Taiwan
3
Institute of Applied Technology, Thu Dau Mot University, Thu Dau Mot 820000, Vietnam
4
College of Agriculture and Applied Biosciences, Can Tho University, Can Tho 94000, Vietnam
5
Department of Food Technology, Ho Chi Minh City University of Technology, Vietnam National University-Ho Chi Minh City, Ho Chi Minh 700000, Vietnam
6
R&D Department, Vietnam Dairy Products J.S Company, Ho Chi Minh 700000, Vietnam
*
Author to whom correspondence should be addressed.
These authors contributed equally to this work.
Foods 2022, 11(3), 388; https://doi.org/10.3390/foods11030388
Submission received: 5 January 2022 / Revised: 17 January 2022 / Accepted: 23 January 2022 / Published: 29 January 2022

Abstract

:
Monofloral honey samples (Coffea robusta) from Vietnam were determined for their chemical compositions. This is the first report on the chemical composition and antioxidant activity of coffee honey from Vietnam. These samples were characterized by their high contents of total and reducing sugars, total phenolic contents, and total flavonoid contents. The contents of seven phenolic acids (PAs) were quantified by high performance liquid chromatography (HPLC) and analyzed with the assistance of principle component analysis (PCA) to differentiate the honey samples into groups. The hydroxymethylfurfural (HMF) (0.048–2.933 mg/kg) and free acid contents (20.326–31.163 meq/kg) of coffee honey were lower in Nepal, which reflected the freshness of the honey when conducting this survey. The coffee honey had total sugar and reducing sugar contents 831.711 g/kg and 697.903 g/kg, respectively. The high level of total phenolic (0.642 mg GAE/g) and flavonoid (0.0341 mg GE/g) contents of coffee honey contributed to their antioxidant activity of this honey sample. Among the coffee honey tested, the IC50 of DPPH radical-scavenging activities value was 1.134–17.031 mg/mL, while the IC50 of ABTS radical-scavenging activities value was 115.381–213.769 mg/mL. The phenolic acids composition analysis displayed that gallic acid appeared in high concentrations in all studied honey samples, ranging from 0.037–1.015 mg/kg, and ferulic acid content ranged from 0.193 to 0.276 mg/kg. The content of trigonelline and caffeine in coffee honey samples ranged from 0.314–2.399 mg/kg and 8.946–37.977 mg/kg. The data in this article highlight the relevance of coffee honey as a healthy substance.

1. Introduction

Honey is a popular food product around the world. The characteristic features of honey are its sweet taste, pleasant aroma, nutritional properties, and antibacterial and antioxidant activity. Its composition contains over 200 different chemical compounds, including sugar, minerals, proteins, amino acids, and vitamins, and other bioactive ingredients, such as phenolics, flavonoids, etc. The varied characteristic features of honey are derived from the types of floral sources of the crops surrounding the beehives. In addition, the physical and chemical properties of honey are also dependent on the climatic conditions and geographical origin [1]. Many current studies also showed that bioactive compounds in honey, which provide benefits such as antioxidant, anti-inflammatory, antibacterial, antiviral, antidiabetic, and anticancer properties [2,3,4,5,6,7].
Recently, researchers have been interested in the findings of the contents of bioactive compounds from coffee honey. Previous studies reported that coffee honey contains a high content of ascorbic acid and a low content of total flavonoids. Moreover, the caffeine content in honey is eight times higher than that in coffee nectar [8]. However, other researchers have reported a high degree of flavonoids and phenolic contents in samples of Thailand coffee honey. This study also evidenced its antibacterial activity against Staphylococcus aureus, Propionibacterium acnes, and Corynebacterium sp. which usually causes skin diseases, and its significant antioxidant and anti-tyrosinase activities [9]. Therefore, this honey could be applied for the treatment of cold, flu, and skin diseases, and as an immune system booster.
In Vietnam, along with the development of coffee industry, beekeeping for honey in Dak Lak is developing quickly towards industrial farming. Currently, the composition of Coffea robusta monofloral honey in Vietnam has not been studied, especially the quality of honey raised in different regions in Dak Lak. In continuation of our ongoing research projects on the chemical composition of coffee honey, this study focused on determining the physicochemical characteristics, total polyphenol content, total flavonoid content, phenolic acids, alkaloids, and antioxidant activity in the honey grown in beekeeping facilities in some communes of Dak Lak province in Vietnam. In addition, the physicochemical parameters and the contents of phenolic acids and alkaloids were analyzed with the assistance of principle component analysis (PCA) to differentiate the honey samples into groups. The results of this study will provide a basis for the judgement of the quality of coffee honey from other regions.

2. Materials and Methods

2.1. Chemicals and Reagents

The phenolic standards (gallic acid, cinnamic acid, chlorogenic acid, caffeic acid, coumaric acid, ferulic acid, 2,4-dihydroxybenzoic acid), quercetin, caffein, trigonelline, 2,2-diphenyl-1-picrylhydrazyl (DPPH), 2,2′-azino-bis (3-ethylbenzothiazoline-6-sulfonic acid) (ABTS) and Folin–Ciocalteu’s reagent were purchased from Sigma–Aldrich (St. Louis, MO, USA). Chemicals used for the physicochemical analysis were purchased from Merck (Darmstadt, Germany). All chemicals used were analytical grade unless specified. All samples were stored in sealed glass jars and at room temperature (20–30 °C) until analysis

2.2. Collection of Coffee Honey Samples

Coffee honey samples were collected at the end of the coffee blossom (March 2021) at seven beekeeping establishments in Cu Kuin district (CoffeeHC 1, CoffeeHC 2, CoffeeHC 3), Buon Me Thuot City (CoffeeHB 1, CoffeeHB 2) and Cu M’gar district (CoffeeHM 1, CoffeeHM 2) of Dak Lak province, Vietnam. In addition, there are three commercial coffee honey samples (Commercial T, Commercial K, Commercial H) purchased in a supermarket and three honey samples of other origins (forest honey (FH), Tithonia diversifolia honey (TH) and longan honey (LH)) purchased in a local market, which were used for comparison. All samples were stored in sealed glass jars and at room temperature (20–30 °C) until analysis.

2.3. Physicochemical Analysis

Honey samples were analyzed based on the criteria of total sugar determination by phenol-sulfuric acid method and free reducing sugar contents by DNS method according to the previously reported literature [10]. Hydroxymethylfurfural (HMF) and free acid contents were determined using spectrophotometric method [11], mineral content was quantified by calcination method [12].

2.3.1. Total Sugar and Free Reducing Sugar Contents

Total sugar was determined by the phenol-sulfuric method. Honey (0.5 g) was dissolved in 20 mL of water and then made up to 100 mL with distilled water. The solution was filtered through an 11 µm filter paper. The filtrate (1 mL) was titrated to 100 mL with distilled water. The solution (1 mL) was added with phenol 5% (1 mL) and mixed well, then concentrated H2SO4 (5 mL) was added and mixed well. After leaving the reaction for 10 min at 24 °C, we continued to cool the solution in a thermostatic bath at 25 °C for 10 min and then measured it photometrically at 490 nm. The experiment was repeated 3 times. Glucose was used to construct the calibration curve with a concentration scale of 0; 1; 2.5; 5; 10; 25; 50; 100 ppm. Total sugar in honey was determined through the standard curve of glucose according to the following formula:
Total   sugar   content   ( % ) = C × V 1 × V 2 × 100 10 6 × V × W
  • C: Total sugar concentration from the calibration curve (ppm);
  • W: Weight of sample (g);
  • V1: 1st titration volume (mL);
  • V2: Second titration volume (mL);
  • 106: Convert ppm concentration to g/mL;
  • V: Analytical sample volume (mL).
The free reducing sugars present in honey were determined by the DNS method. Honey (0.5 g) was dissolved in 20 mL of water and then made up to 50 mL with distilled water. The solution was filtered through an 11 µm filter paper. The filtrate (1 mL) was titrated to 25 mL with distilled water. The solution (2 mL) had DNS (1 mL) added to it. The reaction solution was kept in a thermostatic bath at 90 °C until a reddish-brown color appeared. Then it was allowed to cool for 10 min. Then, the reaction solution had distilled water (7 mL) added to it. The absorbance was determined with a spectrophotometer at 540 nm. The experiment was repeated 3 times. Glucose was used to construct the calibration curve with a concentration scale of 0; 1; 2.5; 5; 10; 25; 50; 100 ppm. The reducing sugar content of honey was determined through the standard curve of glucose according to the following formula:
glu ( % ) = C × V 1 × V 2 × 10 × 100 10 6 × V × W
  • C: Concentration from the calibration curve (ppm);
  • V1: Volumetric first time (mL);
  • V2: Second titration volume (mL);
  • 106: Convert concentration (ppm) to (g/mL);
  • V: Analytical sample volume (mL);
  • W: Weight of sample (g).

2.3.2. Hydroxymethylfurfural (HMF)

Honey (5 g) was dissolved in 25 mL of distilled water. The absorbance was measured at 284 and 336 nm against a filtered solution treated with NaHSO3. The hydroxymethylfurfural (HMF) content was calculated using the following formula:
HMF = ( A 284 A 336 ) × 149.7 × 5 × D W
  • D: dilution factor;
  • W: sample weight (g).

2.3.3. Free Acid Contents

Honey (10 g) was added to 75 mL of distilled water, and then the solution was stirred with a magnetic stirrer until the solution was completely dissolved. The solution was titrated with 0.1 N NaOH to pH = 8.30, recording the volume of NaOH consumed.
Free   acid   contents   ( mqe / kg ) = 0.1 × V N a O H × 1000 W
  • VNaOH: volume of NaOH (ml);
  • W: sample weight (g).

2.3.4. Mineral Content

Honey sample (1 g) was put in a crucible, heated at 550 °C for 6 h.

2.4. Determination of Total Phenolic Content (TPC) and Flavonoid Content (TFC)

The total polyphenol content (TPC) was determined by Folin–Ciocalteu method [13]. The standard gallic acid solutions (0.01, 0.03, 0.05, 0.07 and 0.09 mg/mL) were used to validate the method. The gallic acid solution (0.01, 0.03, 0.05, 0.07 and 0.09 mg/mL) (1 mL) was incubated with the 10% Folin-Ciocalteu’s reagent (5 mL) for 5 min, and then a Na2CO3 solution (4 mL, 75 g/L) was further added to the solution. The reaction was maintained at room temperature for 30 min. The absorbance was determined with a spectrophotometer at 765 nm, which was plotted against the corresponding standard concentrations. The honey sample (2.5 g) was mixed with 50 mL of distilled water to reach the concentration of 0.05 mg/mL. It was prepared similarly to that of standard gallic acid solution. The TPC was expressed in mg of gallic acid equivalents (mg GAE/g of honey). The experiments were performed in triplicate.
A = 11.703 × C + 0.039   ( R 2 = 0.9963 )
where: A: absorbance; C: concentration.
The total flavonoid content (TFC) was determined by the spectroscopic method according to Jia Zhishen et al. [14]. The quercetin solutions (0.025, 0.050, 0.075, 0.100 and 0.150 mg/mL) were used as the standards to construct a calibration curve. The standard solution (0.5 mL) was incubated with 2.5 mL distilled water and 0.15 mL 5% NaNO2 for 5 min, and then it reacted with 0.3 mL of 10% AlCl3 for another 6 min. Finally, the mixture was added to 1 mL of 1 M NaOH and 0.55 mL of distilled water. The absorbance was determined with a spectrophotometer at 510 nm. The honey solutions (0.05 mg/mL) were prepared similarly to that of standard gallic acid solution. The TFC was expressed in mg of quercetin equivalents (mg QE/g of honey). The experiments were performed in triplicate.
A = 0.0101 × C + 0.0248   ( R 2 = 0.9961 )
where: A: absorbance; C: concentration.

2.5. Antioxidant Activity

2.5.1. DPPH Free Radical Scavenging Assay

Honey was dissolved in methanol. The range of investigated concentrations was 1–50 mg/mL. The honey extract (1 mL) was mixed with 3 mL of methanolic solutions containing DPPH radicals (0.01 mM). The mixtures were shaken and left for 30 min in the dark at 24 °C. Then the absorbances were measured at 517 nm. The blank was performed with methanol instead of methanolic extract. The radical-scavenging activity (RSA) was calculated as the percentage of DPPH discoloration using the equation:
%   R S A = A 0 A S A 0 × 100
where: A0 and AS are the absorbances of the blank and the sample, respectively.

2.5.2. ABTS Free Radical Scavenging Assay

ABTS was dissolved in methanol to a 7 mM concentration. ABTS radical cation (ABTS•+) was produced by reacting ABTS stock solution with potassium persulfate (2.45 mM) at a ratio of 1:1. The mixture was left in the dark at 24 °C for 12–16 h before use. The ABTS•+ solution was diluted with methanol to obtain an absorbance of 0.70 (±0.02) at 734 nm. Honey was dissolved in methanol to a range of investigated concentrations, which were 100–300 mg/mL. The honey solution (0.5 mL) was mixed with 5 mL of the dilute ABTS•+ solution, and the absorbance was measured after 6 min relative to a blank (water) at 734 nm. The radical-scavenging activity (RSA) was calculated as the percentage of ABTS+• discoloration using the Equation (7).
Ascorbic acid (AA) was used as a reference. The IC50 was determined as the concentration of the tested honey sample causing 50% reduction of the initial DPPH or ABTS•+ concentration, measured from the linear regression concentration curve of the test extract (mg/mL) against the percentage of the radical scavenging inhibition.

2.6. Phenolic Analysis

2.6.1. Extraction of Phenolic Compounds

The phenolic compounds were extracted by the method described by Stanek [15] and Oroian [16]. Honey (1.0 g) was dissolved in 5 mL 50% methanol in acidified water (formic acid, pH 2.2), which homogenized in an ultrasonic bath for 30 min. The resulted solutions were filtered by a SPE C18 cartridge, which was previously activated and equilibrated with methanol (3.0 mL) and acidified deionized water (3.0 mL, pH 2.2). The honey solution (5.0 mL) was taken into the treated cartridge and passed at 1.0 mL/min, and the solid-phase extraction (SPE) cartridges were further washed with 6.0 mL acidified deionized water (pH 2.2) to remove the honey matrices. Finally, the polyphenols remaining in the cartridge were eluted with 6.0 mL methanol and adjusted to the volume of 10.0 mL. The methanol fraction was filtered through a 0.45 µm membrane and stored at −20 °C until further analysis by the liquid chromatographic system.

2.6.2. Preparation of Phenolic Acid Standard Solutions

The standards used to quantify phenolic acids include gallic acid, cinnamic acid, chlorogenic acid, caffeic acid, coumaric acid, ferulic acid, and 2,4-dihydroxybenzoic acid. The standard was prepared at the concentration range between 0.1 and 5.0 ppm. The PA standard (1.0 mg) was dissolved with a mixture of methanol:water (50:50, pH = 2.2) with equal volume of formic acid in a 10 mL volumetric flask. Standard mixture (100 ppm) was prepared by mixing seven PAs in 100 mL volumetric flask. The resulting solution was diluted to the mark with a mixture of methanol:water (50:50, pH = 2.2) using an equal volume of formic acid. The working standard solutions were established at the concentrations of 0.1, 0.25, 0.5, 1, 2.5, 5.0 ppm. The standard solutions were filtered over a 0.45 µm disc.

2.6.3. HPLC Analysis

HPLC was performed on a Shimadzu LC-2030C 3D liquid chromatographic system (Shimadzu, Japan), equipped with a Photodiode array (PDA) detector. The analytical column used was a VertiSep™ GES C18 HPLC column (250 mm × 4.6 mm, 5.0 µm). The operating conditions were as follows: column temperature, 30 °C; flow rate, 0.80 mL/min; injection volume, 10 µL; monitoring wavelength range, 190–450 nm. The elution solvent system consisted of methanol (A) and water/formic acid (pH 2.2) (B) with a concentration gradient program of: 25% A for 3 min, 25–40% A for 5 min, hold 40% A for 5 min, 40–60% A until 16 min, 60% A for 5 min, 60–80% A for 3 min, 80% A for 3 min, then lower to 25% A to the 35th min [17].

2.7. Trigonelline and Caffein Analysis

2.7.1. Extraction of Alkaloid Compounds

The honey sample (2 g) was dissolved in 10 mL of distilled water and homogenized in an ultrasonic bath at 40 degrees for 30 min. Then, the solution was extracted liquid–liquid with chloroform (25 mL) and shaken for 12 h. The chloroform was recovered and dried by nitrogen blowing. The dry residue was re-dissolved with methanol (1 mL). Then, the methanol fraction was filtered through a 0.45 µm membrane and injected into the chromatographic system [8].

2.7.2. HPLC analysis

Liquid chromatography was performed on a Shimadzu LC-2030C 3D liquid chromatographic system (Shimadzu, Japan), equipped with a Photodiode array (PDA) detector. The analytical column used was a VertiSep™ GES C18 HPLC column (250 mm × 4.6 mm, 5.0 µm). The solvent system was methanol:water (45:55), the flow rate was 0.4 mL/min and the injection volume was 10 µL. Spectral data from all peaks were collected in the range of 200–400 nm and trigonelline and caffeine was detected at 272 nm.

2.8. Data Analysis

The results were reported as mean ± standard deviation (SD). One-way Analysis of Variance (ANOVA) with Tukey’s HSD post hoc test was used to evaluate the differences between all the physio-chemical parameters and content of seven phenolic acids of honey samples. Besides this, Principal component analysis (PCA) method was performed with FactoMineR packages (R software version 4.0, http://factominer.free.fr (accessed on 1 September 2021)) to classify honey groups with specific physicochemical parameters of each group. Finally, linear regression analysis method was used to set up the linear equation standard form of total polyphenol and total flavonoid contents.

3. Results

3.1. Physicochemical Parameters

In all the analyzed honey samples, the total sugar contents ranged from 742.860 to 884.718 g/kg, among which the average total sugar content of the coffee honey samples was 831.711 g/kg (Table 1). The total sugar content of coffee honey was comparable to that of some honeys from Algeria [18], which are higher than those of honey collected in Pakistan [19] and Benin [20]. The sugar content is responsible for properties such as viscosity, hygroscopicity, and energy value of honey. Honey is an important natural sweetener, having a low glycemic index with almost 80% simple sugars from the total chemical composition (35–40% fructose and 30–35% glucose). Sugar from honey has demonstrated effects on both healthy and diabetic subjects [21], and it has also raised the insulin levels of diabetic humans [22]. Therefore, coffee honey with total sugar content will be able to be a good source of sweetening for diabetic patients.
The reducing sugar contents in the studied honey samples ranged from 625.620 to 757.769 g/kg (Table 1). As compared with previous studies, the average free reducing sugar content of coffee honey (697.903 g/kg) was higher than that in Malaysian honey (655.3 g/kg) [23] or honey in Benin (580–600 g/kg) [20], so it can be concluded briefly that the free reducing sugar content in coffee honey is relatively high. The higher the reducing sugar content in honey, the more beneficial to health the honey is, especially for diabetics because the main reducing sugar in honey is fructose, which has been shown to reduce the index blood sugar [24], regulate hormone production in the pancreas, and promote its hepatic actions for diabetic patients [25,26]. Thus, the coffee honey contained a relatively high content of total sugar and reducing sugars within the limits of acceptable values and also promises to bring many benefits to consumers, especially diabetic patients. Among the samples of coffee honey, there was a significant difference observed for the total and free reducing sugar content. The sugar content and composition of honey highly depended on the regions and the origins of flowers where honey was collected. With a relatively high content of total and free reducing sugars, coffee honey not only provides an abundant source of energy, but this also serves as an outstanding feature that can be used to distinguish it from other honey samples on the market.
The hydroxymethylfurfural (HMF) is one of the important parameters to determine the freshness of honey, as well as the storage duration and conditions, and it tends to increase during processing and/or aging of the product [27,28]. Several factors have been reported to influence the levels of HMF, such as temperature and time of heating, storage conditions, pH, and floral sources, therefore the content of HMF provides an indication of overheating and storage in poor conditions [29]. The results showed that the 13 honey samples surveyed had HMF contents ranging from 0.049 to 2.933 mg/kg (Table 1). The CoffeeHC 3 sample had the highest HMF content (2.933 ± 0.022 mg/kg) but was still lower than the honey in Nepal (49.5 mg/kg) [30] or the honey from Melipona subnitida (7.56 mg/kg) and Apis mellifera (10.82 mg/kg) [11]. The contents of HMF in the honey samples were relatively low because the samples were analyzed immediately after being brought to the laboratory and the correct transportation and storage processes also maintained the honey as fresh samples.
The lowest free acid content was detected in the Longan Honey sample (15.220 meq/kg) and the highest in the CoffeeHM 1 sample (31.163 meq/kg) (Table 1). In the coffee honey samples, the free acid content had a statistically significant difference among the samples. The lowest free acid content was detected in sample CoffeeHC 1 (20.164 meq/kg) and the highest in the CoffeeHM 1 sample (31.163 meq/kg). Most of the samples have a statistically significant difference; only samples CoffeeHC 2 and CoffeeHB 2 did not show a statistically significant difference. The acid content of honey is influenced by many factors, such as the time and manner of honey being stored, the presence of different organic acids in the flower, geographical origin, harvest season, etc. Therefore, the difference in free acid content in coffee honey samples can be elucidated well. The average free acid content of coffee honey (26.336 meq/kg) was higher than those of commercial coffee honey (21.8 meq/kg) and other flower honeys (19.729 meq/kg). As compared with the mean free acid content in some previous publications, acacia honey was found to have a very low concentration (5.44 meq/kg); however, luso-type honey (31.2 meq/kg) [31] and honey in Algeria (50.4 meq/kg) [32] had relatively high concentrations. The free acid content in coffee honey is in the average range and may be taken to be indicative of honey freshness because the free acid value can indicate the occurrence of fermentation [33]. The free acids in honey contribute to the flavor and are partially responsible for the antimicrobial activity [34].
The mineral contents in the investigated honey samples ranged from 0.026 to 0.138% (Table 1), consistent with the previous report of Vanhanen et al. [35] about the mineral content in honey fluctuating in the range of 0.04 to 0.2%. The highest mineral content, found in CoffeeHC 3 sample (0.13%), was 3.4 times higher than that of the lowest sample of Forest Honey (0.026%). The average mineral content of the coffee honey (0.09%) was higher than the average mineral content of the commercial coffee honey (0.068%) and the mineral content of other flower honey groups (0.071%). Although there was a difference between the groups in mineral contents, the difference between them was not statistically significant. The previous reports on the mineral content in some types of honey are very high (up to 0.4%, honeydew honey), which is 45 times higher than that of coffee honey, and there are also low grades such as Viper’s bugloss honey (0.013%) that is 6.9 times lower. Compared to the range of mineral content of other honey samples reported previously (0.04 to 0.2%), the mineral content in Dak Lak coffee honey was assessed to be in the medium range.

3.2. Total Phenolic Contents (TPC) and Total Flavonoid Contents (TFC)

In the coffee honey samples, the polyphenol contents of CoffeeHC 3 (0.704 mg GAE/g), CoffeeHM 1 (0.749 mg GAE/g), and CoffeeHB 1 (0.730 mg GAE/g) samples were similar and different from the other samples, in which CoffeeHC 1 sample (0.519 mg GAE/g) had the lowest polyphenol content (Table 2). It has already been demonstrated that the polyphenol contents varied due to many factors caused by their growing geographical regions including the temperature, rainfall, flora, and soil [36]. The polyphenol content in honey has been reported previously as being as low as Tulang honey in Malaysia (0.015–0.042 mg GAE/g) [37], honey in southern Italy (0.120 mg GAE/g) [38], Slovenian honey (0.045–0.232 mg GAE/g) [39], or Polish honey (0.13–0.69 mg GAE/g) [15]; and also as very high, such as in Sicilian black honey 0.165–1.33 mg GAE/g [40]. In general, the average polyphenol content in the coffee honey group (0.642 mg GAE/g) is relatively high. This fact was supported by some previous publications on the effect of altitude on polyphenol contents, in that polyphenol content is positively correlated with altitude [41]. It has been found that a favorable correlation agreement between total polyphenols and antioxidant potential exists in 15 grain samples of Western Himalayan high-altitude buckwheat [41]. The coffee honey was obtained from coffee flowers in Dak Lak grown at an average altitude of 400–800 m above sea level and this may be a factor affecting the polyphenol content. Several previous studies have also proven that when plants are exposed to oxidizing agents, their antioxidant functions can be enhanced to protect plants from free radical damage. Higher altitudes, lower temperatures, and higher UV-B radiation meant that more polyphenols in plants can be accumulated. This may be the reason why the coffee honey samples surveyed had quite high polyphenol contents.
The flavonoid contents in honey samples were investigated with differences between samples. The sample with the highest flavonoid content detected was the CoffeeHC 2 sample (0.037 mg QE/g) and the lowest was in sample Commercial K (0.026 mg QE/g) (Table 2). Similarly to polyphenols, flavonoid content is also affected by the factors such as temperature, precipitation, flora, and soil, etc. Different regions and geographical conditions will result in different flavonoid contents in the coffee honey samples [36]; therefore, there is a statistically significant difference in the flavonoid contents between coffee honey and the commercial coffee honey group, and also a statistically significant difference between coffee honey and other flower honey groups. The average flavonoid content of the coffee honey group (0.034 mg GE/g) was higher than the average content of commercial coffee honey (0.029 mg GE/g) and the other flower honey group (0.029 mg GE/g). The coffee honey group is more prominent than the other groups in terms of flavonoid contents reported in Phacelica honey (0.003–0.014 mg GE/g) [15] and Tulang honey (0.011–0.02 mg GE/g) [37], and this can be considered to be a unique characteristic of coffee honey and contributes to affirming its quality. The high level of total phenolic and flavonoid contents of honey will greatly contribute to the antioxidant activity of these honey samples and alleviate several diseases directly or indirectly related to oxidative stress [5].

3.3. Antioxidant Activity

Antioxidant activity is shown by the honeys’ antioxidant activity against DPPH and ABTS•+ radicals. IC50 value is a widely used parameter for measuring antioxidant activity. A lower IC50 indicates higher antioxidant activity. There were significant differences among the honey samples in terms of their scavenging abilities expressed as IC50 of the DPPH and ABTS radical-scavenging activities (Table 2). Commercial H showed the lowest IC50 value (17.031 ± 0.27 mg/mL for DPPH, 213.769 ± 1.614 mg/mL for ABTS•+), and Commercial T displayed the highest value for DPPH (1.134 ± 0.34 mg/mL) and Forest Honey for ABTS•+ (90.0196 ± 1.188 mg/mL). Among the coffee honey tested, the IC50 of DPPH radical-scavenging activities value ranged from 1.134 to 17.031 mg/mL, while the IC50 of ABTS radical-scavenging activities value ranged from 115.381 to 213.769 mg/mL. The present analysis had characterized coffee honey as having high contents of total sugar, reducing sugar, TPC and TFC compared to the previous studies. These demonstrate this honey’s ability to scavenge free radicals and its antioxidant activity to create many health benefits for human beings. The results of this study are consistent with the observations made in previously reported studies. These antioxidant activities are reported largely due to the main responsible phenolic components and flavonoids [5,37,42]. Based on the previous studies, honey is known for its contribution to the prevention of a number of acute disorders such as inflammation, cardiovascular disease, diabetes, cancer, helping to protect the liver, pancreas, and eyes [5,43]. These benefits of honey are resulted from their ability to improve the oxidation of tissues, organs, body fluids [44] along with the benefits of low glycemic index sugars in honey. Data on the antioxidant activity also evidence that honey is a rich source of antioxidants [44].

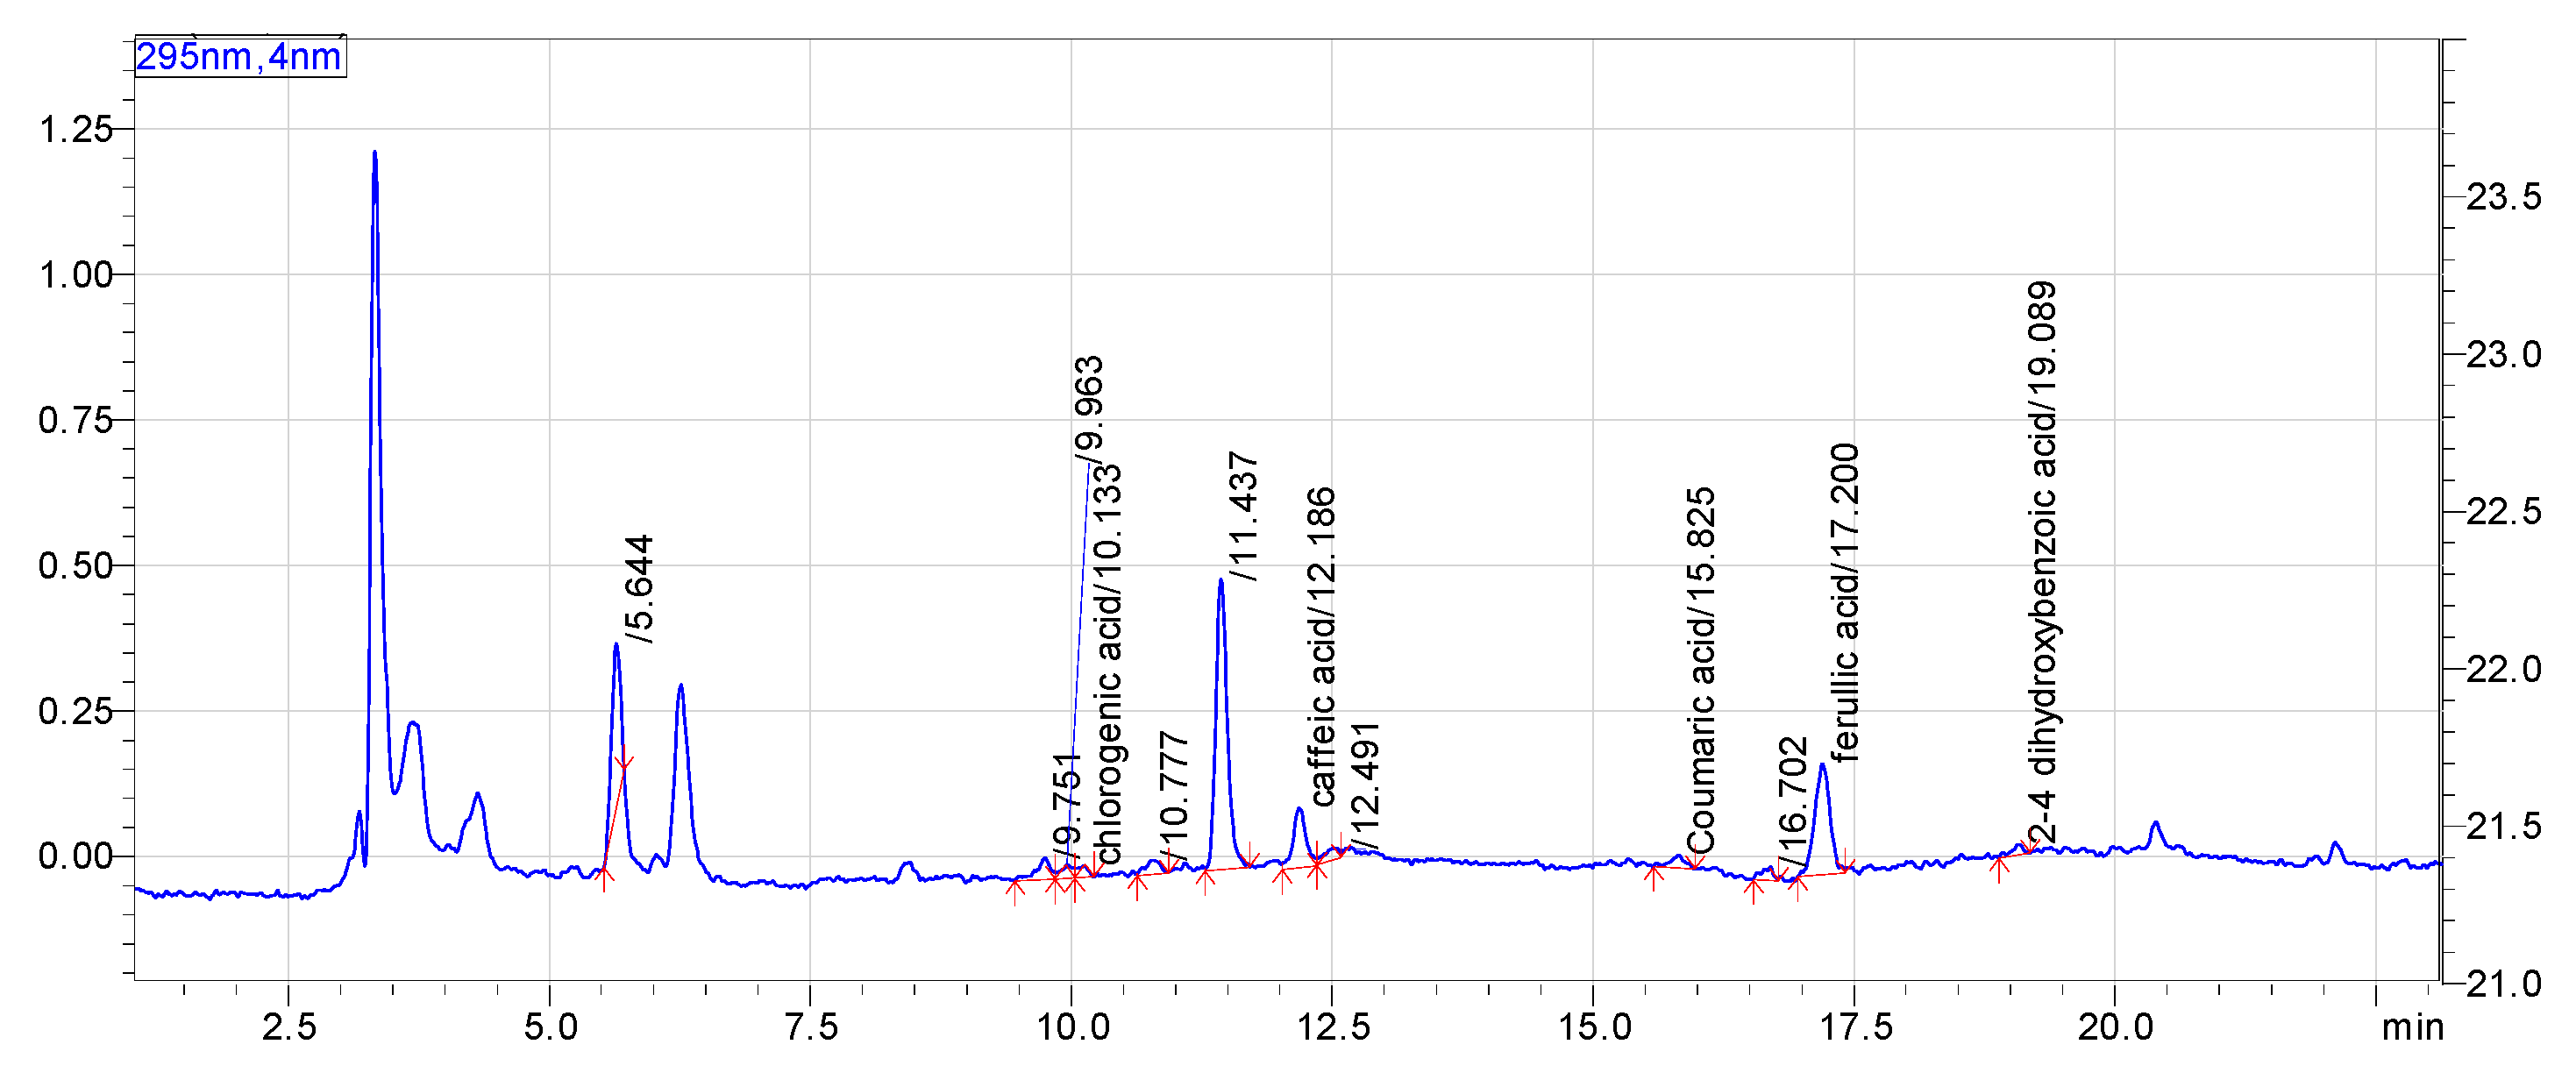
3.4. Phenolic Acids Analysis

The contents of phenolic acids were analyzed by HPLC (Figure 1) and the analytical parameters were performed according to the published methods with a few modifications. A fairly good performance was obtained in the prediction of the concentrations of the calibration set data, with the linear coefficient of determination (R2) varying from 0.9989 to 0.9998 for all the substances, as shown in Table 3.
Most of the 13 honey samples surveyed had all seven phenolic acid components. Gallic acid appeared in high concentrations in all studied honey samples, ranging from 0.037–1.015 mg/kg (Table 4). Among these, the Commercial T sample has the highest content of gallic acid, which is consistent with the results of physicochemical properties and total polyphenols detected (1.015 mg GAE/kg). In addition, the ferulic acid content was also found to be high, in the range of 0.023–0.297 mg/kg. The coffee honey group in Dak Lak had a similarity in ferulic acid content, ranging from 0.193 to 0.276 mg/kg. The Commercial K sample did not have cinnamic acid and the Commercial H sample did not have ferulic acid. The remaining acids were low in contents and did not show predominance. Complete quantitative analytical results are presented in Table 4. In general, the coffee honey samples have all seven quantified phenolic acids, in which the compositions of gallic acid and ferulic acid are quite high and similar. Other phenolic components such as caffeic acid, cinnamic acid, and 2,4-dihydroxybenzoic acid can be considered as non-specific components.

3.5. Trigonelline and Caffeine Analysis
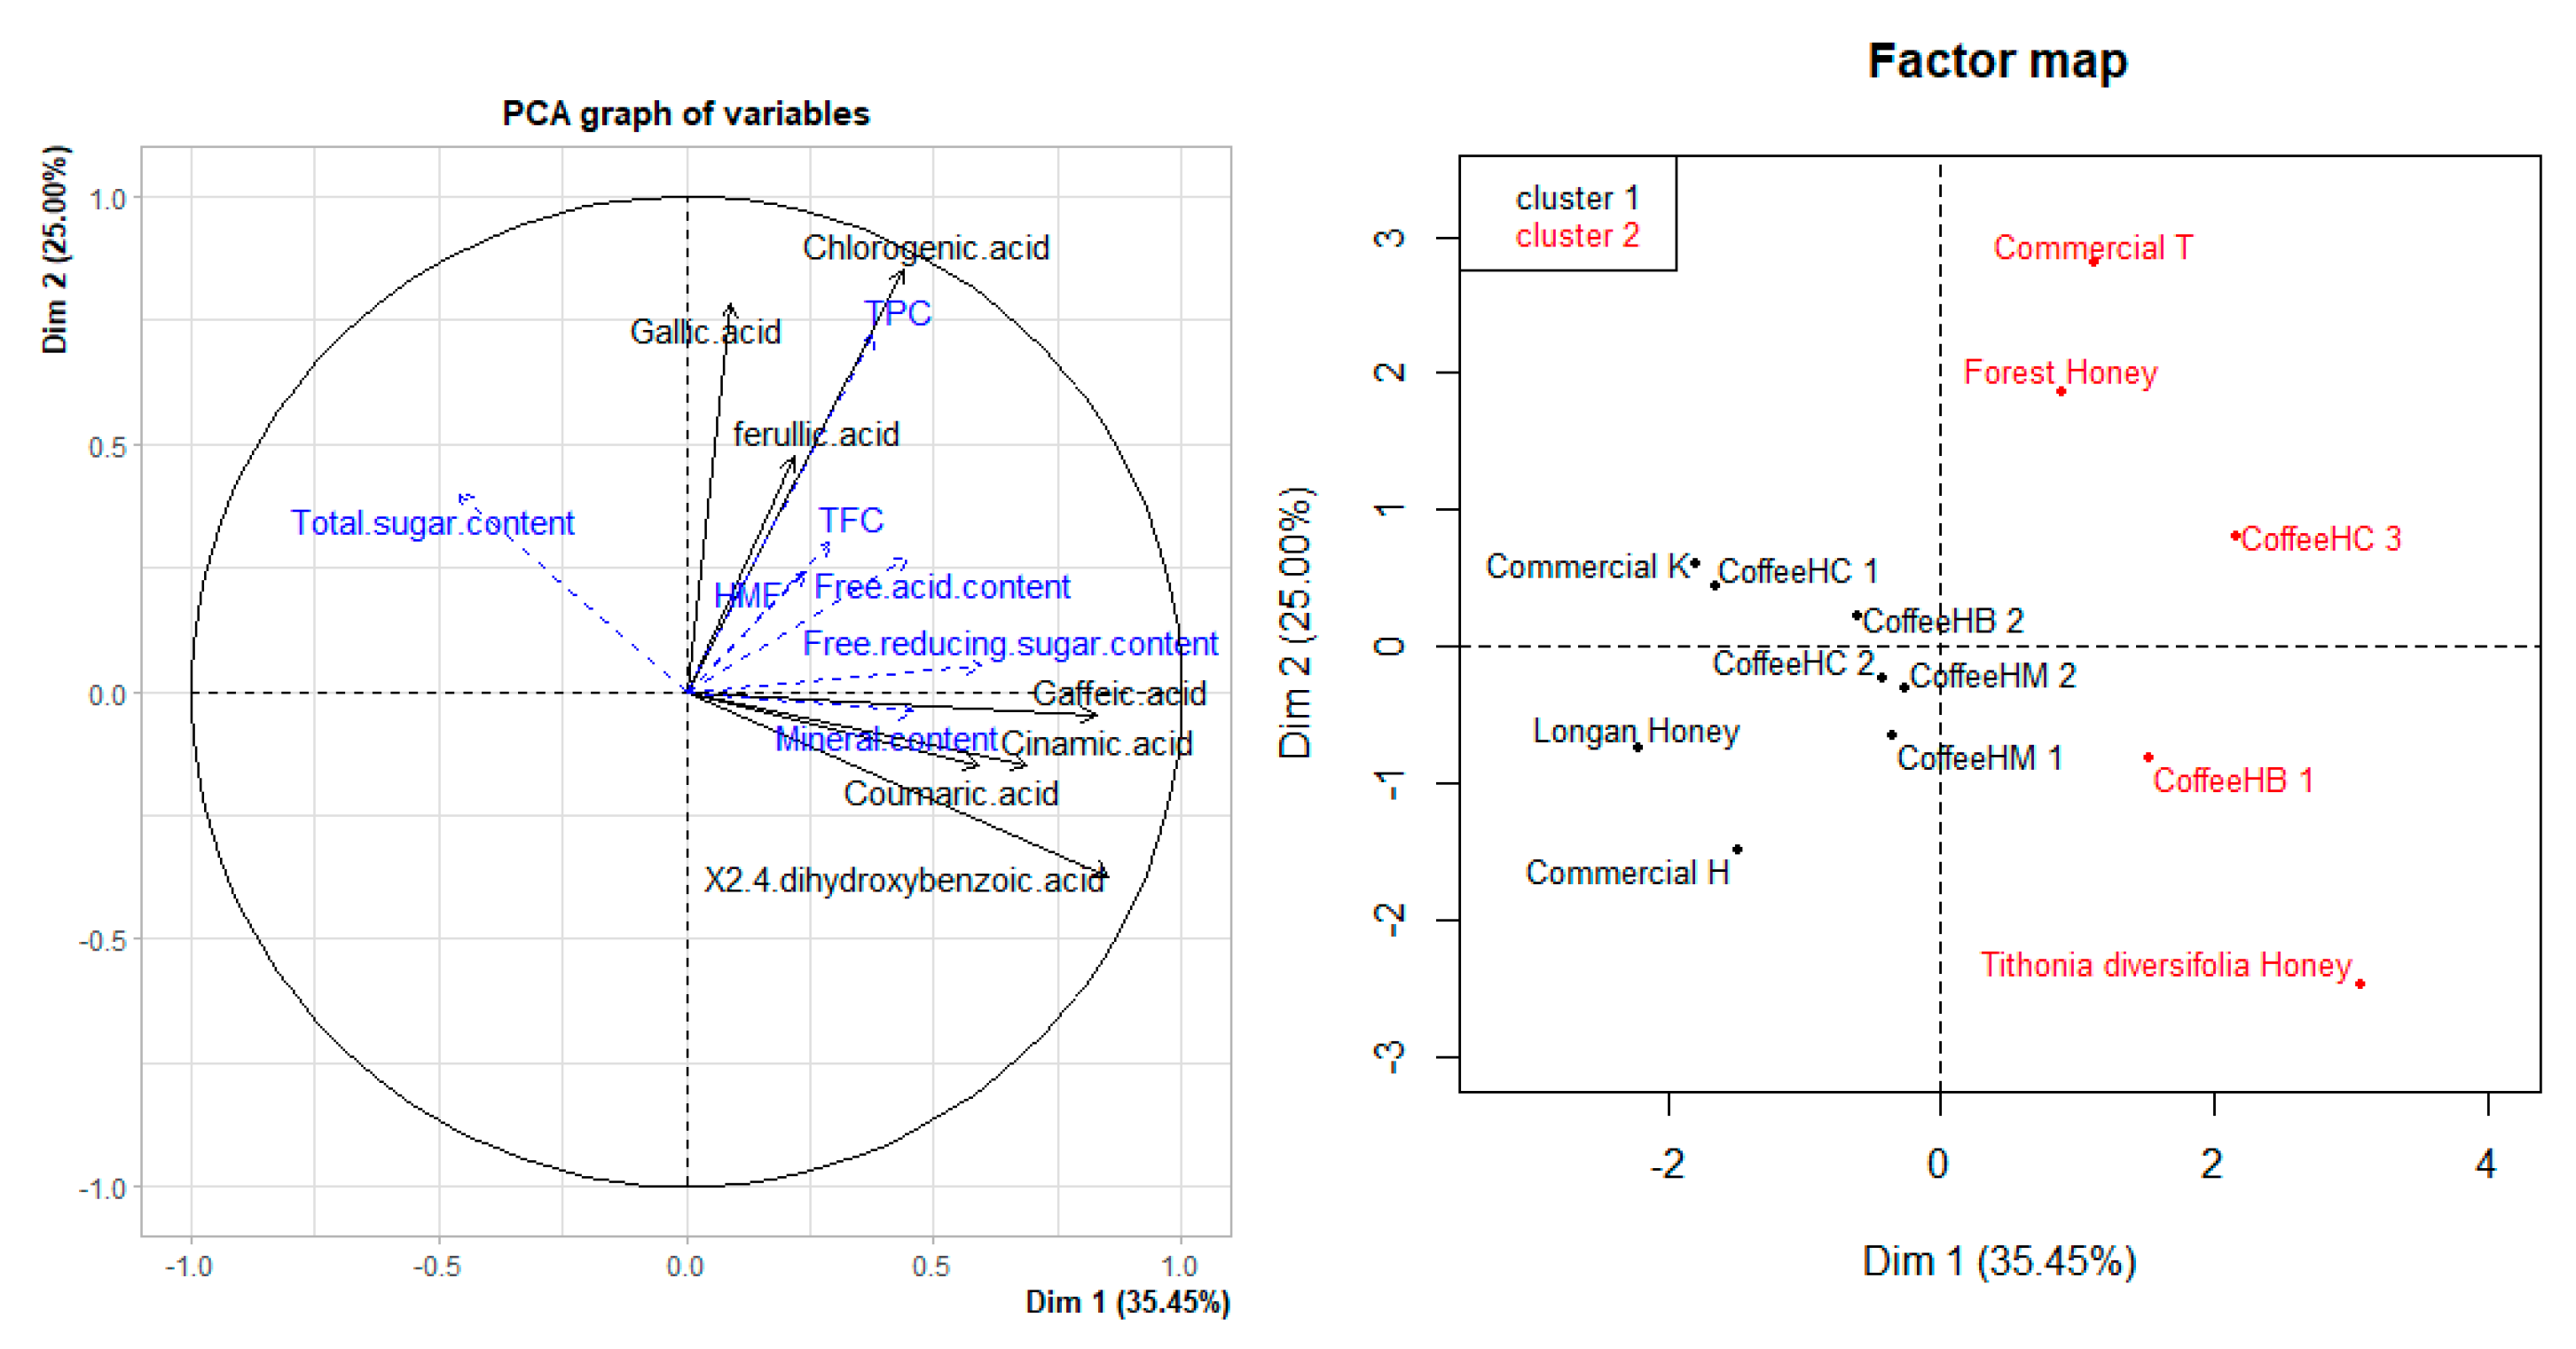
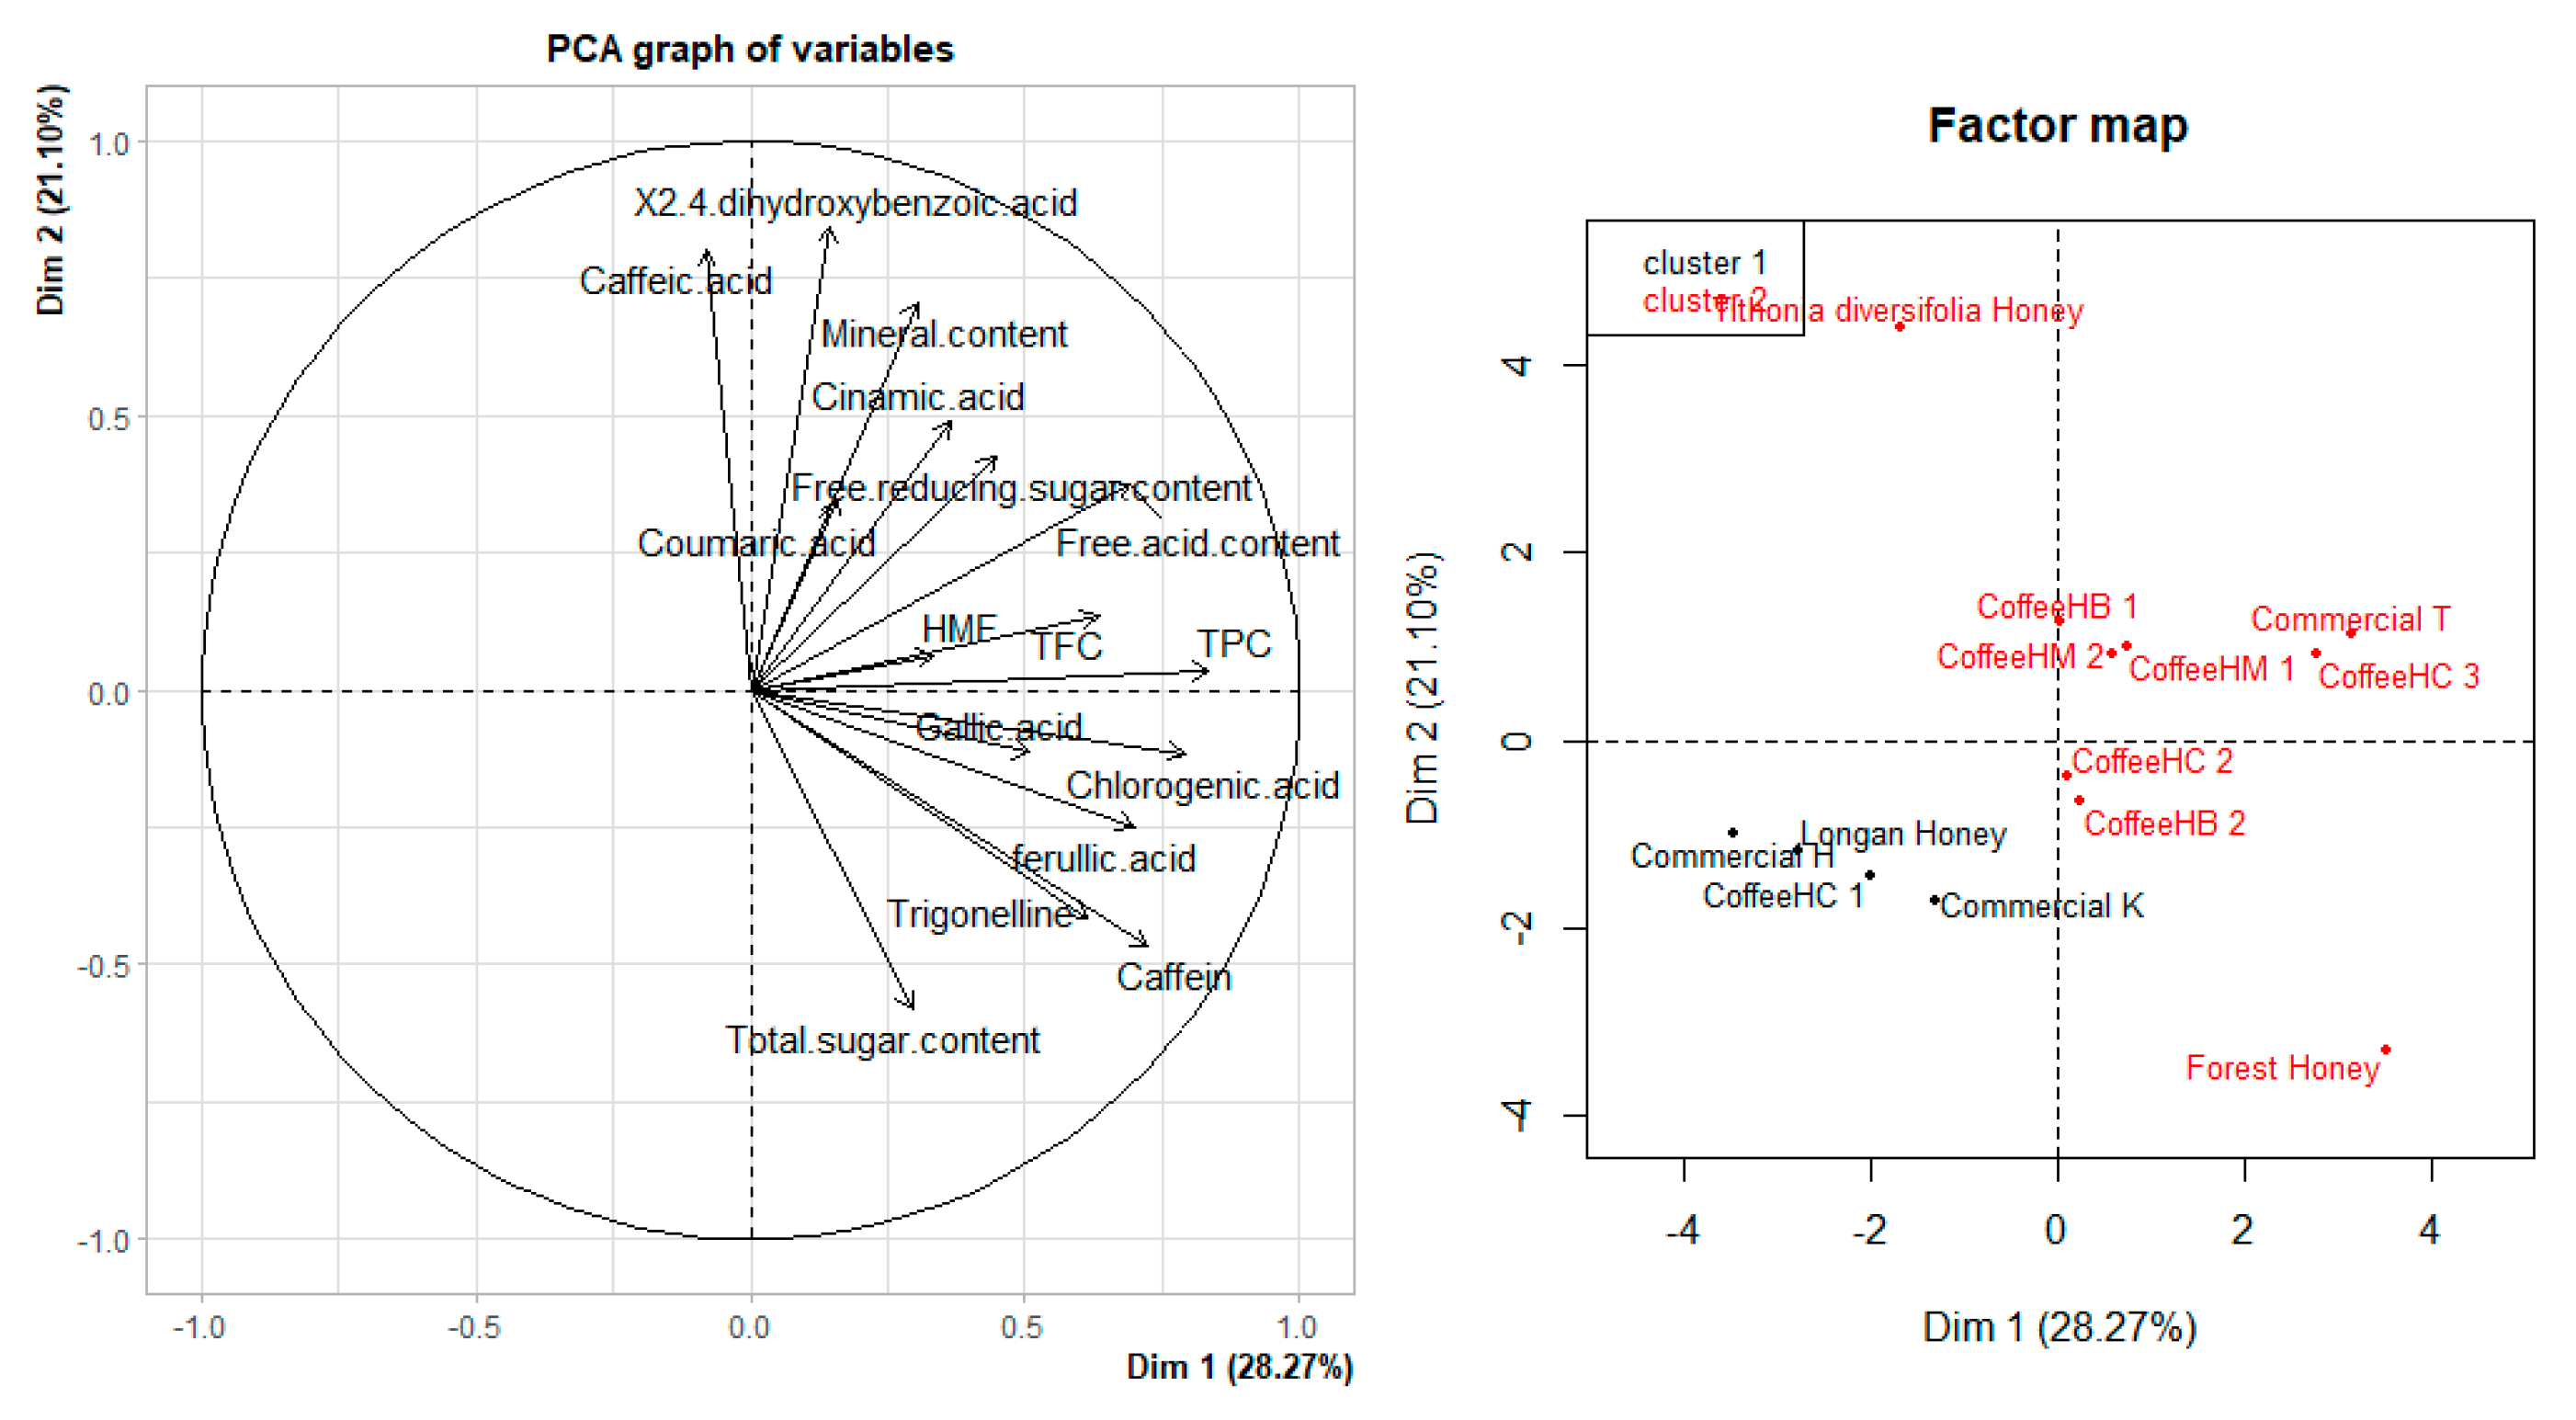
Trigonelline and caffeine were detected in all coffee flower honey samples and three other floral honeys were analyzed (Table 5). The content of trigonelline and caffeine in coffee honey samples ranged from 0.314–2.399 mg/kg and 8.946–37.977 mg/kg. Among the analyzed coffee flower honey samples, Coffee HC3 had the highest trigonelline (37.977 mg/kg) and CoffeeHB 2 had the highest caffeine content (2.399 mg/kg). In the group of honeys other than coffee flower honey, the forest honey with the highest trigonelline and caffeine content among the analyzed honeys was 4.541 ± 0.032 and 90.258 ± 0.07, respectively. According to previous scientific reports, the content of trigonelline and caffeine in honey in Vietnam is much lower than that of Colombian coffee flower honey (55.4–85.7 mg/kg, 52–97.7 mg/kg) [36]. When compared with Brazilian coffee honey (12.02 ± 0.81 mg/kg) [8], the caffeine content of Vietnamese coffee honey is higher.

3.6. PCA Analysis

According to the results of phenolic composition (Figure 2), honey samples can be divided into two groups. Group 1 is the coffee flower honey samples including two commercial and four coffee honey samples from Dak Lak, and they have similar compositions and contents of caffeic acid, chlorogenic acid, 2,4-dihydroxybenzoic acid, cinnamic acid, gallic acid, and ferulic acid comparable with the Longan honey sample. The average contents of gallic acid and ferulic acid are high, while the phenolic components are quite low, and there were not any specific acids observed in these samples.
The other group consisted of samples with a distinct predominance of one or more quantified phenolic acids. Among these, Commercial T and CoffeeHC 3 were similar in gallic acid, chlorogenic acid, and ferulic acid composition, and commercial sample T stood out with the highest quantity of gallic acid. In this group, the Tithonia diversifolia honey and CoffeeHB 1 honey samples were significantly different from the other honey samples. These two samples have similar coumaric acid contents. The unique feature of Tithonia diversifolia honey is its presence of 2,4-dihydroxybenzoic acid.
The PCA results for all physicochemical parameters with the content of seven phenolics and two alkaloids in this study were shown in Figure 3, so that the honey samples can be grouped into two different groups with the value of 50.00%. Based on the similarity of physicochemical parameters and the quantified contents of seven phenolic acids, two alkaloid all-honey samples could be divided into two groups. Group 1 included most of the coffee honey, along with the forest honey and Tithonia diversifolia honey. The coffee honey samples in group 1 showed that the factors contributing to the characteristics of coffee honey were high contents of phenolic acids, such as gallic acid, chlorogenic acid, and ferulic acid. In addition, the average caffeine content in coffee honey samples is also a prominent feature of this honey. Meanwhile, the remaining phenolic acid components quantified in the study are not specific for coffee honey. The total polyphenol and total flavonoid contents of the coffee honey studied in this study were high, indicating the diverse occurrences of other phenolic compounds. The high phenolic and flavonoid content of coffee honey as a characteristic shows its high health value to humans. When compared with honey from other countries, such as Cuban honey (0.213–0.595 GAEmg/g) [45] or Slovenian honey (0.0448–0.2414 GAEmg/g) [46], the relatively high phenolic content in coffee honey will bring much greater health benefits. The content of phenolics and flavonoids of Vietnamese coffee honey is also higher than that of Brazil coffee honey [8] or the phacelia honeys of Poland [15], Rhododendron honeys [47], which indicates that this honey is more valuable than other types of honey or coffee honey from other countries. The physicochemical analysis also showed that coffee honey can be a source of relatively high levels of total and reducing sugars. Meanwhile, group 2 included Commercial K, Commercial H, Longan Honey, and CoffeeHC 1, in which physicochemical indexes and the content of seven phenolic acids were usually low and had no outstanding criteria or components.

4. Conclusions

This study determined the physicochemical properties, total phenolic contents, and total flavonoid contents, as well as quantified seven individual phenolic acids presented in coffee honey from Vietnam and some other types of flower honey. It was shown that Vietnamese coffee honey samples are characterized by higher gallic acid, ferulic acid and caffeine contents, as well as high levels of phenolic and flavonoids contents. The presences of all seven phenolic acids and the contents of total and reducing sugars are also interesting factors. The results obtained show the high quality of Vietnamese coffee honey. These specific characteristics of Vietnamese coffee honey mean that they could be a potential energy source because of their relatively high content of total and reducing sugars, along with a good supply of nutrients. The high antioxidant activity confers benefits to human health. The data in this article highlight the relevance of Vietnamese coffee honey as a healthy substance.

Author Contributions

N.N.T. and T.D.T.: conceptualization, formal analysis, methodology, investigation, writing—original draft. N.T.N.T.: formal analysis, investigation, writing—review and editing. P.-C.K.: formal analysis, writing—review and editing. N.B.T., L.N.T. and L.N.A.: formal analysis, software. L.H.T.: investigation. T.H.D.N., D.C.V. and T.L.H.: resources. N.T.T.T.: visualization. All authors have read and agreed to the published version of the manuscript.

Funding

This research was funded by Industrial University of Ho Chi Minh City grant number [HĐ2022].

Institutional Review Board Statement

Not applicable.

Informed Consent Statement

Not applicable.

Data Availability Statement

Not applicable.

Acknowledgments

This work was supported by a grant from the Internal board of the Industrial University of Ho Chi Minh City.

Conflicts of Interest

All authors declare no conflict of financial interest.

References

  1. Wang, J.; Kliks, M.M.; Jun, S.; Li, Q.X. Residues of organochlorine pesticides in honeys from different geographic regions. Food Res. Int. 2010, 43, 2329–2334. [Google Scholar] [CrossRef]
  2. Omotayo, E.O.; Gurtu, S.; Sulaiman, S.A.; Wahab, M.S.A.; Sirajudeen, K.N.S.; Salleh, M.S.M. Hypoglycemic and antioxidant effects of honey supplementation in streptozotocin-induced diabetic rats. Int. J. Vitam. Nutr. Res. 2010, 80, 74–82. [Google Scholar] [CrossRef] [PubMed]
  3. Meo, S.A.; Al-Asiri, S.A.; Mahesar, A.L.; Ansari, M.J. Role of honey in modern medicine. Saudi J. Biol. Sci. 2017, 24, 975–978. [Google Scholar] [CrossRef] [PubMed]
  4. Khan, F.R.; Abadin, Z.U.; Rauf, N. Honey: Nutritional and medicinal value. Int. J. Clin. Pract. 2007, 61, 1705–1707. [Google Scholar] [CrossRef] [PubMed]
  5. Alvarez-Suarez, J.; Giampieri, F.; Battino, M. Honey as a Source of Dietary Antioxidants: Structures, Bioavailability and Evidence of Protective Effects against Human Chronic Diseases. Curr. Med. Chem. 2013, 20, 621–638. [Google Scholar] [CrossRef]
  6. Schramm, D.D.; Karim, M.; Schrader, H.R.; Holt, R.R.; Cardetti, M.; Keen, C.L. Honey with high levels of antioxidants can provide protection to healthy human subjects. J. Agric. Food Chem. 2003, 51, 1732–1735. [Google Scholar] [CrossRef]
  7. Rebane, R.; Herodes, K. Evaluation of the botanical origin of Estonian uni- and polyfloral honeys by amino acid content. J. Agric. Food Chem. 2008, 56, 10716–10720. [Google Scholar] [CrossRef]
  8. Kadri, S.M.; Zaluski, R.; Lima, G.P.P.; Mazzafera, P.; Orsi, R.d. Characterization of Coffea arabica monofloral honey from Espírito Santo, Brazil. Food Chem. 2016, 203, 252–257. [Google Scholar] [CrossRef]
  9. Jantakee, K.; Tragoolpua, Y. Activities of different types of thai honey on pathogenic bacteria causing skin diseases, tyrosinase enzyme and generating free radicals. Biol. Res. 2015, 48, 1–11. [Google Scholar] [CrossRef] [Green Version]
  10. Nielsen, S.S. Phenol-Sulfuric Acid Method for Total Carbohydrates. In Food Analysis Laboratory Manual; Springer: Boston, MA, USA, 2010; pp. 47–53. [Google Scholar] [CrossRef]
  11. de Almeida-Muradian, L.B.; Stramm, K.M.; Horita, A.; Barth, O.M.; de Freitas, A.d.; Estevinho, L.M. Comparative study of the physicochemical and palynological characteristics of honey from Melipona subnitida and Apis mellifera. Int. J. Food Sci. Technol. 2013, 48, 1698–1706. [Google Scholar] [CrossRef] [Green Version]
  12. Finola, M.S.; Lasagno, M.C.; Marioli, J.M. Microbiological and chemical characterization of honeys from central Argentina. Food Chem. 2007, 100, 1649–1653. [Google Scholar] [CrossRef]
  13. Folin, O.; Ciocalteau, V. Tyrosine and Tryptophane in Proteins. J. Biol. Chem. 1927, 73, 627–648. [Google Scholar] [CrossRef]
  14. Zhishen, J.; Mengcheng, T.; Jianming, W. The determination of flavonoid contents in mulberry and their scavenging effects on superoxide radicals. Food Chem. 1999, 64, 555–559. [Google Scholar] [CrossRef]
  15. Stanek, N.; Teper, D.; Kafarski, P.; Jasicka-Misiak, I. Authentication of phacelia honeys (Phacelia tanacetifolia) based on a combination of HPLC and HPTLC analyses as well as spectrophotometric measurements. LWT 2019, 107, 199–207. [Google Scholar] [CrossRef]
  16. Oroian, M.; Ropciuc, S. Honey authentication based on physicochemical parameters and phenolic compounds. Comput. Electron. Agric. 2017, 138, 148–156. [Google Scholar] [CrossRef]
  17. Melendez-Martinez, A.J.; Stinco, C.M.; Liu, C.; Wang, X.-D. Fast HPLC-DAD quantification of nine polyphenols in honey by using second-order calibration method based on trilinear decomposition algorithm. Food Chem. 2013, 138, 62–69. [Google Scholar] [CrossRef]
  18. Doukani, K.; Gacem, N.; Benlarbi, H. Physicochemical and Phytochemical Characterization of Some Algerian Honeys Types. Int. J. Appl. Phys. Bio Chem. Res. (IJAPBCR) 2014, 4, 1–16. Available online: http://www.tjprc.org/view-archives.php?year=2014_48_2&id=46&jtype=2&page=2 (accessed on 1 December 2014).
  19. Fahim, H.; Dasti, J.I.; Ali, I.; Ahmed, S.; Nadeem, M. Physico-chemical analysis and antimicrobial potential of Apis dorsata, Apis mellifera and Ziziphus jujube honey samples from Pakistan. Asian Pac. J. Trop. Biomed. 2014, 4, 633–641. [Google Scholar] [CrossRef] [Green Version]
  20. Azonwade, F.E.; Paraiso, A.; Agbangnan Dossa, C.P.; Dougnon, V.T.; N’tcha, C.; Mousse, W.; Baba-Moussa, L. Physicochemical Characteristics and Microbiological Quality of Honey Produced in Benin. J. Food Qual. 2018, 2018, 1896057. [Google Scholar] [CrossRef] [Green Version]
  21. Bahrami, M.; Ataie-Jafari, A.; Hosseini, S.; Foruzanfar, M.H.; Rahmani, M.; Pajouhi, M. Effects of natural honey consumption in diabetic patients: An 8-week randomized clinical trial. Int. J. Food Sci. Nutr. 2009, 60, 618–626. [Google Scholar] [CrossRef]
  22. Ramli, N.Z.; Chin, K.Y.; Zarkasi, K.A.; Ahmad, F. A review on the protective effects of honey against metabolic syndrome. Nutrients 2018, 10, 9. [Google Scholar] [CrossRef] [PubMed] [Green Version]
  23. Moniruzzaman, M.; Khalil, M.I.; Sulaiman, S.A.; Gan, S.H. Physicochemical and antioxidant properties of Malaysian honeys produced by Apis cerana, Apis dorsata and Apis mellifera. BMC Complementary Altern. 2013, 13, 43. [Google Scholar] [CrossRef] [PubMed] [Green Version]
  24. Kwon, S.; Kim, Y.J.; Kim, M.K. Effect of fructose or sucrose feeding with different levels on oral glucose tolerance test in normal and type 2 diabetic rats. Nutr. Res. Pract. 2008, 2, 252. [Google Scholar] [CrossRef] [PubMed] [Green Version]
  25. Erejuwa, O.O.; Sulaiman, S.A.; Wahab, M.S.; Sirajudeen, K.N.S.; Salleh, M.S.M.D.; Gurtu, S. Action protectrice anti-oxydante du miel malésien Tualang sur le pancréas de rats normaux ou diabétiques induits par la streptozotocine. Ann. Endocrinol. 2010, 71, 291–296. [Google Scholar] [CrossRef] [PubMed]
  26. Bobiş, O.; Dezmirean, D.S.; Moise, A.R. Honey and Diabetes: The Importance of Natural Simple Sugars in Diet for Preventing and Treating Different Type of Diabetes. Oxidative Med. Cell. Longev. 2018, 4757893. [Google Scholar] [CrossRef] [PubMed] [Green Version]
  27. Shapla, U.M.; Solayman, M.; Alam, N.; Khalil, M.I.; Gan, S.H. 5-Hydroxymethylfurfural (HMF) levels in honey and other food products: Effects on bees and human health. Chem. Cent. J. 2018, 12, 1–18. [Google Scholar] [CrossRef]
  28. Gomes, S.; Dias, L.G.; Moreira, L.L.; Rodrigues, P.; Estevinho, L. Physicochemical, microbiological and antimicrobial properties of commercial honeys from Portugal. Food Chem. Toxicol. 2010, 48, 544–548. [Google Scholar] [CrossRef] [Green Version]
  29. Fallico, B.; Arena, E.; Verzera, A.; Zappalà, M. The European Food Legislation and its impact on honey sector. Accredit. Qual. Assur. 2006, 11, 49–54. [Google Scholar] [CrossRef]
  30. Bhattarai, S.; Subedi, U.; Bhattarai, U.K.; Karki, R.; Ojha, P. Study on Chemical and Bioactive Components of Different Floral Sources’ Honey in Nepal. J. Food Sci. Technol. Nepal 2019, 11, 51–59. [Google Scholar] [CrossRef]
  31. Živkov Baloš, M.; Popov, N.; Vidakovic, S.; Ljubojevic-Pelic, D.; Pelic, M.; Mihaljev, Z.; Kaksic, S. Electrical conductivity and acidity of honey. Arch. Vet. Med. 2018, 11, 91–101. [Google Scholar] [CrossRef]
  32. Benaziza-Bouchema, D.; Schweitzer, P. Caractérisation des principaux miels des régions du Nord de l’Algérie. Cah. Agric. 2010, 19, 432–438. [Google Scholar] [CrossRef]
  33. Ajlouni, S.; Sujirapinyokul, P. Hydroxymethylfurfuraldehyde and amylase contents in Australian honey. Food Chem. 2010, 119, 1000–1005. [Google Scholar] [CrossRef]
  34. Belay, A.; Solomon, W.K.; Bultossa, G.; Adgaba, N.; Melaku, S. Physicochemical properties of the Harenna forest honey, Bale, Ethiopia. Food Chem. 2013, 141, 3386–3392. [Google Scholar] [CrossRef] [PubMed]
  35. Vanhanen, L.P.; Emmertz, A.; Savage, G.P. Mineral analysis of mono-floral New Zealand honey. Food Chem. 2011, 128, 236–240. [Google Scholar] [CrossRef]
  36. Schievano, E.; Finotello, C.; Mammi, S.; Belci, A.I.; Colomban, S.; Navarini, L. Preliminary Characterization of Monofloral Coffea spp. Honey: Correlation between Potential Biomarkers and Pollen Content. J. Agric. Food Chem. 2015, 63, 5858–5863. [Google Scholar] [CrossRef]
  37. Khalil, M.I.; Alam, N.; Moniruzzaman, M.; Sulaiman, S.A.; Gan, S.H. Phenolic Acid Composition and Antioxidant Properties of Malaysian Honeys. J. Food Sci. 2011, 76, 921–928. [Google Scholar] [CrossRef]
  38. Perna, A.; Intaglietta, I.; Simonetti, A.; Gambacorta, E. A comparative study on phenolic profile, vitamin C content and antioxidant activity of Italian honeys of different botanical origin. Int. J. Food Sci. Technol. 2013, 48, 1899–1908. [Google Scholar] [CrossRef]
  39. Bertoncelj, J.; Golob, T.; Kropf, U.; Korošec, M. Characterisation of Slovenian honeys on the basis of sensory and physicochemical analysis with a chemometric approach. Int. J. Food Sci. Technol. 2011, 46, 1661–1671. [Google Scholar] [CrossRef]
  40. Attanzio, A.; Tesoriere, L.; Allegra, M.; Livrea, M.A. Monofloral honeys by Sicilian black honeybee (Apis mellifera ssp. sicula) have high reducing power and antioxidant capacity. Heliyon 2016, 2, e00193. [Google Scholar] [CrossRef] [Green Version]
  41. Kishore, G.; Ranjan, S.; Pandey, A.; Gupta, S. Influence of altitudinal variation on the antioxidant potential of tartar buckwheat of Western Himalaya. Food Sci. Biotechnol. 2010, 19, 1355–1363. [Google Scholar] [CrossRef]
  42. Kishore, R.K.; Halim, A.S.; Syazana, M.S.N.; Sirajudeen, K.N.S. Tualang honey has higher phenolic content and greater radical scavenging activity compared with other honey sources. Nutr. Res. 2011, 31, 322–325. [Google Scholar] [CrossRef] [PubMed]
  43. Ahmed, S.; Sulaiman, S.A.; Baig, A.A.; Ibrahim, M.; Liaqat, S.; Fatima, S.; Jabeen, S.; Shamim, N.; Othman, N.H. Honey as a Potential Natural Antioxidant Medicine: An Insight into Its Molecular Mechanisms of Action. Oxidative Med. Cell. Longev. 2018, 2018, 8367846. [Google Scholar] [CrossRef] [PubMed] [Green Version]
  44. Erejuwa, O.O.; Sulaiman, S.A.; Wahab, M.S.A. Honey: A novel antioxidant. Molecules 2012, 17, 4400–4423. [Google Scholar] [CrossRef] [PubMed]
  45. Alvarez-Suarez, J.M.; Tulipani, S.; Díaz, D.; Estevez, Y.; Romandini, S.; Giampieri, F.; Battino, M. Antioxidant and antimicrobial capacity of several monofloral Cuban honeys and their correlation with color, polyphenol content and other chemical compounds. Food Chem. Toxicol. 2010, 48, 2490–2499. [Google Scholar] [CrossRef]
  46. Bertoncelj, J.; Dobersek, U.; Jamnik, M.; Golob, T. Evaluation of the phenolic content, antioxidant activity and colour of Slovenian honey. Food Chem. 2007, 105, 822–828. [Google Scholar] [CrossRef]
  47. Silici, S.; Sagdic, O.; Ekici, L. Total phenolic content, antiradical, antioxidant and antimicrobial activities of Rhododendron honeys. Food Chem. 2010, 121, 238–243. [Google Scholar] [CrossRef]
Figure 1. HPLC chromatogram of phenolic acids in coffee honey.
Foods 11 00388 g001
Figure 2. PCA analysis results of seven phenolic acid components of honey samples.
Foods 11 00388 g002
Figure 3. Results of PCA analysis of physicochemical parameters, content of seven phenolic acids and trigonelline, caffein of honey samples.
Foods 11 00388 g003
Table 1. Results of physicochemical parameters of honey sample.
Name SamplePhysicochemical Parameters
Free Acid Content (mg/kg)Mineral Content (%)HMF (mg/kg)Total Sugar Content (mg/kg)Free Reducing Sugar Content (mg/kg)
CoffeeHC 120.326 ± 0.105 b0.051 ± 0.013 ac0.048 ± 0.016 a811.660 ± 2.746 bc669.964 ± 1.335 bc
CoffeeHC 223.902 ± 0.055 ef0.089 ± 0.044 bce0.245 ± 0.003 b884.718 ± 1.762 e712.129 ± 6.301 d
CoffeeHC 329.485 ± 0.259 h0.131 ± 0.032 e2.933 ± 0.022 h804.128 ± 9.591 ab722.881 ± 5.844 de
CoffeeHB 125.692 ± 0.122 g0.064 ± 0.003 acd0.108 ± 0.056 a814.759 ± 3.719 bc741.375 ± 17.496 ef
CoffeeHB 224.327 ± 0.031 f0.097 ± 0.026 ce2.722 ± 0.017 fg848.308 ± 1.093 be655.251 ± 4.348 b
CoffeeHM 131.163 ± 0.779 i0.095 ± 0.003 bce2.113 ± 0.047 d879.702 ± 7.681 de757.769 ± 1.339 f
CoffeeHM 229.455 ± 0.564 h0.101 ± 0.003 ce2.037 ± 0.017 d818.946 ± 15.456 bcd685.185 ± 2.500 c
Commercial H16.142 ± 0.296 a0.041 ± 0.011 ab2.607 ± 0.036 f795.115 ± 0.994 ab625.62 ± 15.746 a
Commercial K23.185 ± 0.254 de0.054 ± 0.005 acd2.712 ± 0.022 fg828.385 ± 56.895 be666.972 ± 5.335 bc
Commercial T26.140 ± 0.179 g0.107 ± 0.003 de2.781 ± 0.037 g831.394 ± 18.746 be741.878 ± 5.685 ef
Forest Honey22.318 ± 0.172 cd0.026 ± 0.007 a2.624 ± 0.008 f870.097 ± 12.347 ce745.118 ± 2.3 ef
Tithonia diversifolia Honey21.647 ± 0.526 c0.106 ± 0.013 de2.449 ± 0.038 e742.860 ± 14.554 a760.964 ± 1.375 f
Longan Honey15.220 ± 0.146 a0.079 ± 0.005 ace1.123 ± 0.091 c868.913 ± 37.668 ce741.414 ± 2.295 ef
The values are mean values of four replicate samples ± standard error of mean and the values with different alphabetical letters represents values significantly different at the 0.05 level of probability according to the ANOVA.
Table 2. Total polyphenol and flavonoid contents and antioxidant properties of honey samples.
Name SampleTotal Polyphenol
(mg GAE/g)
Total Flavonoid
(mg QE/g)
IC50 of DPPH Inhibition (mg/mL)IC50 of ABTS Inhibition (mg/mL)
CoffeeHC 10.519 ± 0.0083 a0.032 ± 0.0005 d9.769 ± 0.83 f175.519 ± 1.440 i
CoffeeHC 20.596 ± 0.0048 b0.037 ± 0.0021 f10.235 ± 0.86175.776 ± 1.665 i
CoffeeHC 30.704 ± 0.016 d0.037 ± 0.001 f4.753 ± 0.60 d142.955 ± 2.835 f
CoffeeHB 10.730 ± 0.025 de0.030 ± 0.0005 c3.587 ± 0.89 cd130.424 ± 1.570 e
CoffeeHB 20.657 ± 0.014 c0.033 ± 0.0007 d9.669 ± 0.73 f167.471 ± 2.001 h
CoffeeHM 10.749 ± 0.003 e0.036 ± 0.0003 ef2.831 ± 0.44 bcd128.616 ± 0.668 e
CoffeeHM 20.863 ± 0.012 f0.034 ± 0.0003 de1.589 ± 0.38 abc123.013 ± 0.721 d
Commercial H0.508 ± 0.010 a0.028 ± 0.0003 ac17.031 ± 0.27 g213.769 ± 1.614 k
Commercial K0.699 ± 0.008 cd0.026 ± 0.0005 a10.135 ± 0.516 f158.65 ± 0.286 g
Commercial T1.090 ± 0.034 h0.033 ± 0.0005 d1.134 ± 0.34 ab115.381 ± 1.665 c
Forest Honey0.913 ± 0.0053 g0.032 ± 0.0003 d1.255 ± 0.236 ab90.0196 ± 1.188 b
Tithonia diversifolia Honey0.570 ± 0.0025 b0.029 ± 0.0003 bc11.855 ± 0.88 f159.11 ± 1.363 g
Longan Honey0.512 ± 0.0026 a0.027 ± 0.0003 ab15.645 ± 0.572 g158.535 ± 0.881 g
Ascorbic acid--0.0000234667 ± 0.00005 a0.0000164333 ± 0.0000083 a
The values are mean values of four replicate samples (n = 3) ± standard error of mean and the values with different alphabetical letters represents values significantly different at the 0.05 level of probability according to the ANOVA.
Table 3. Validation parameters include linear range, coefficient of determination (R2), limit of detection (LOD) and limit of quantitation (LOQ) for each analyte.
Peak NumberPhenolic AcidLinear Range (mg/L)R2LOD
(mg/L)
LOQ
(mg/L)
1gallic acid0.1–50.99960.00630.0191
2chlorogenic acid0.1–50.99890.00660.020
3caffeic acid0.1–50.99970.00480.0146
4coumaric acid0.1–50.99980.00400.0123
5ferulic acid0.1–50.99900.00490.0149
62,4-dihydroxy-benzoic acid0.1–50.99920.03220.0977
7cinnamic acid0.1–50.99940.00210.0066
Table 4. Phenolic acid contents in honey samples.
Name SamplePhenolic Acids Concentration (mg/kg)
Gallic AcidCinnamic AcidChlorogenic AcidCaffeic AcidCoumaric AcidFerulic Acid2,4 Dihydroxy-benzoic Acid
CoffeeHC 11.067 ± 0.005 ac0.074 ± 0.001 ab0.794 ± 0.009 b0.521 ± 0.007 ab0.223 ± 0.006 ab1.927 ± 0.015 c0.406 ± 0.010 a
CoffeeHC 21.213 ± 0.008 ac0.089 ± 0.002 ac0.44 ± 0.007 ab1.082 ± 009 ce0.278 ± 0.011 ab2.701 ± 0.013 de0.68 ± 0.003 a
CoffeeHC 31.857 ± 0.02 cd0.134 ± 0.002 bc1.285 ± 0.02 c0.220 ± 0.025 f0.561 ± 0.005 b2.766 ± 0.013 e0.858 ± 0.026 ab
CoffeeHB 11.935 ± 0.046 cd0.158 ± 0.003 bc0.501 ± 0.019 ab0.996 ± 0.01 cd1.11 ± 0.005 c2.141 ± 0.016 cd0.79 ± 0.036 ab
CoffeeHB 21.645 ± 0.027 bc0.092 ± 0.004 ac0.79 ± 0.020 b0.965 ± 0.02 cd0.279 ± 0.007 ab1.866 ± 0.013 c0.59 ± 0.009 a
CoffeeHM 11.333 ± 0.034 ac0.118 ± 0.001 ac0.344 ± 0.005 ab1.436 ± 0.005 e0.149 ± 0.004 a2.036 ± 0.011 c0.638 ± 0.010 a
CoffeeHM 21.087 ± 0.021 ac0.133 ± 0.003 bc0.525 ± 0.024 ab1.178 ± 0.009 de0.142 ± 0.0008 a2.147 ± 0.016 cd0.687 ± 0.025 a
Commercial H0.560 ± 0.012 ab0.147 ± 0.002 bc0.329 ± 0.002 ab0.258 ± 0.001 a0.144 ± 0.009 aNA0.578 ± 0.012 a
Commercial K3.846 ± 0.029 eNA0.63 ± 0.018 ab0.448 ± 0.0063 ab0.316 ± 0.01 ab1.599 ± 0.011 bc0.58 ± 0.006 a
Commercial T10.124 ± 0.145 f0.214 ± 0.006 c1.584 ± 0.02 c0.695 ± 0.014 bc0.221 ± 0.0006 ab1.133 ± 0.02 b0.761 ± 0.007 ab
Forest Honey3.796 ± 0.019 e0.096 ± 0.008 ac1.294 ± 0.022 c0.204 ± 0.036 f0.297 ± 0.001 ab2.977 ± 0.014 e0.615 ± 0.009 a
Tithonia diversifolia Honey0.367 ± 0.014 a0.119 ± 0.009 bc0.498 ± 0.002 ab2.381 ± 0.17 f0.477 ± 0.05 ab0.377 ± 0.030 a1.349 ± 0.005 b
Longan Honey2.981 ± 0.009 de0.089 ± 0.002 ac0.23 ± 0.009 a0.202 ± 0.004 a0.13 ± 0.004 a0.236 ± 0.005 a0.497 ± 0.014 a
The values are mean values of four replicate samples (n = 3) ± standard error of mean and the values with different alphabetical letters represents values significantly different at the 0.05 level of probability according to the ANOVA.
Table 5. Trigonelline and caffeine contents in honey samples (mg/kg).
Name SampleTrigonellineCaffein
CoffeeHC 10.314 ± 0.003 a8.946 ± 0.227 d
CoffeeHC 21.244 ± 0.012 f25.736 ± 0.008 j
CoffeeHC 32.327 ± 0.007 g37.977 ± 0.003 l
CoffeeHB 10.579 ± 0.013 b29.954 ± 0.103 k
CoffeeHB 22.399 ± 0.007 h22.319 ± 0.025 i
CoffeeHM 10.353 ± 0.015 a16.597 ± 0.026 e
CoffeeHM 20.678 ± 0.020 c19.163 ± 0.002 g
Commercial H0.627 ± 0.017 bc4.556 ± 0.003 c
Commercial K0.803 ± 0.008 d21.94 ± 0.010 h
Commercial T0.928 ± 0.005 e17.412 ± 0.028 f
Forest Honey4.541 ± 0.032 i90.258 ± 0.07 m
Tithonia diversifolia Honey0.957 ± 0.007 e0.591 ± 0.004 a
Longan Honey0.763 ± 0.049 d0.915 ± 0.015 b
The values are mean values of four replicate samples (n = 3) ± standard error of mean and the values with different alphabetical letters represents values significantly different at the 0.05 level of probability according to the ANOVA.
Publisher’s Note: MDPI stays neutral with regard to jurisdictional claims in published maps and institutional affiliations.

