Unveiling Optimal Synthesis and Structural Insights of Starch Ferulate via the Mechanoenzymatic Method

Abstract
:1. Introduction
2. Materials and Methods
2.1. Materials
2.2. Preparation of Starch Ferulate
2.3. Single-Factor Experiment
2.3.1. Effect of Ferulic Acid Addition on the Degree of Substitution
2.3.2. Effect of Extrusion Temperature on the Degree of Substitution
2.3.3. Effect of Lipase Addition on the Degree of Substitution
2.4. Response Surface Test
2.5. Degree of Substitution Determination
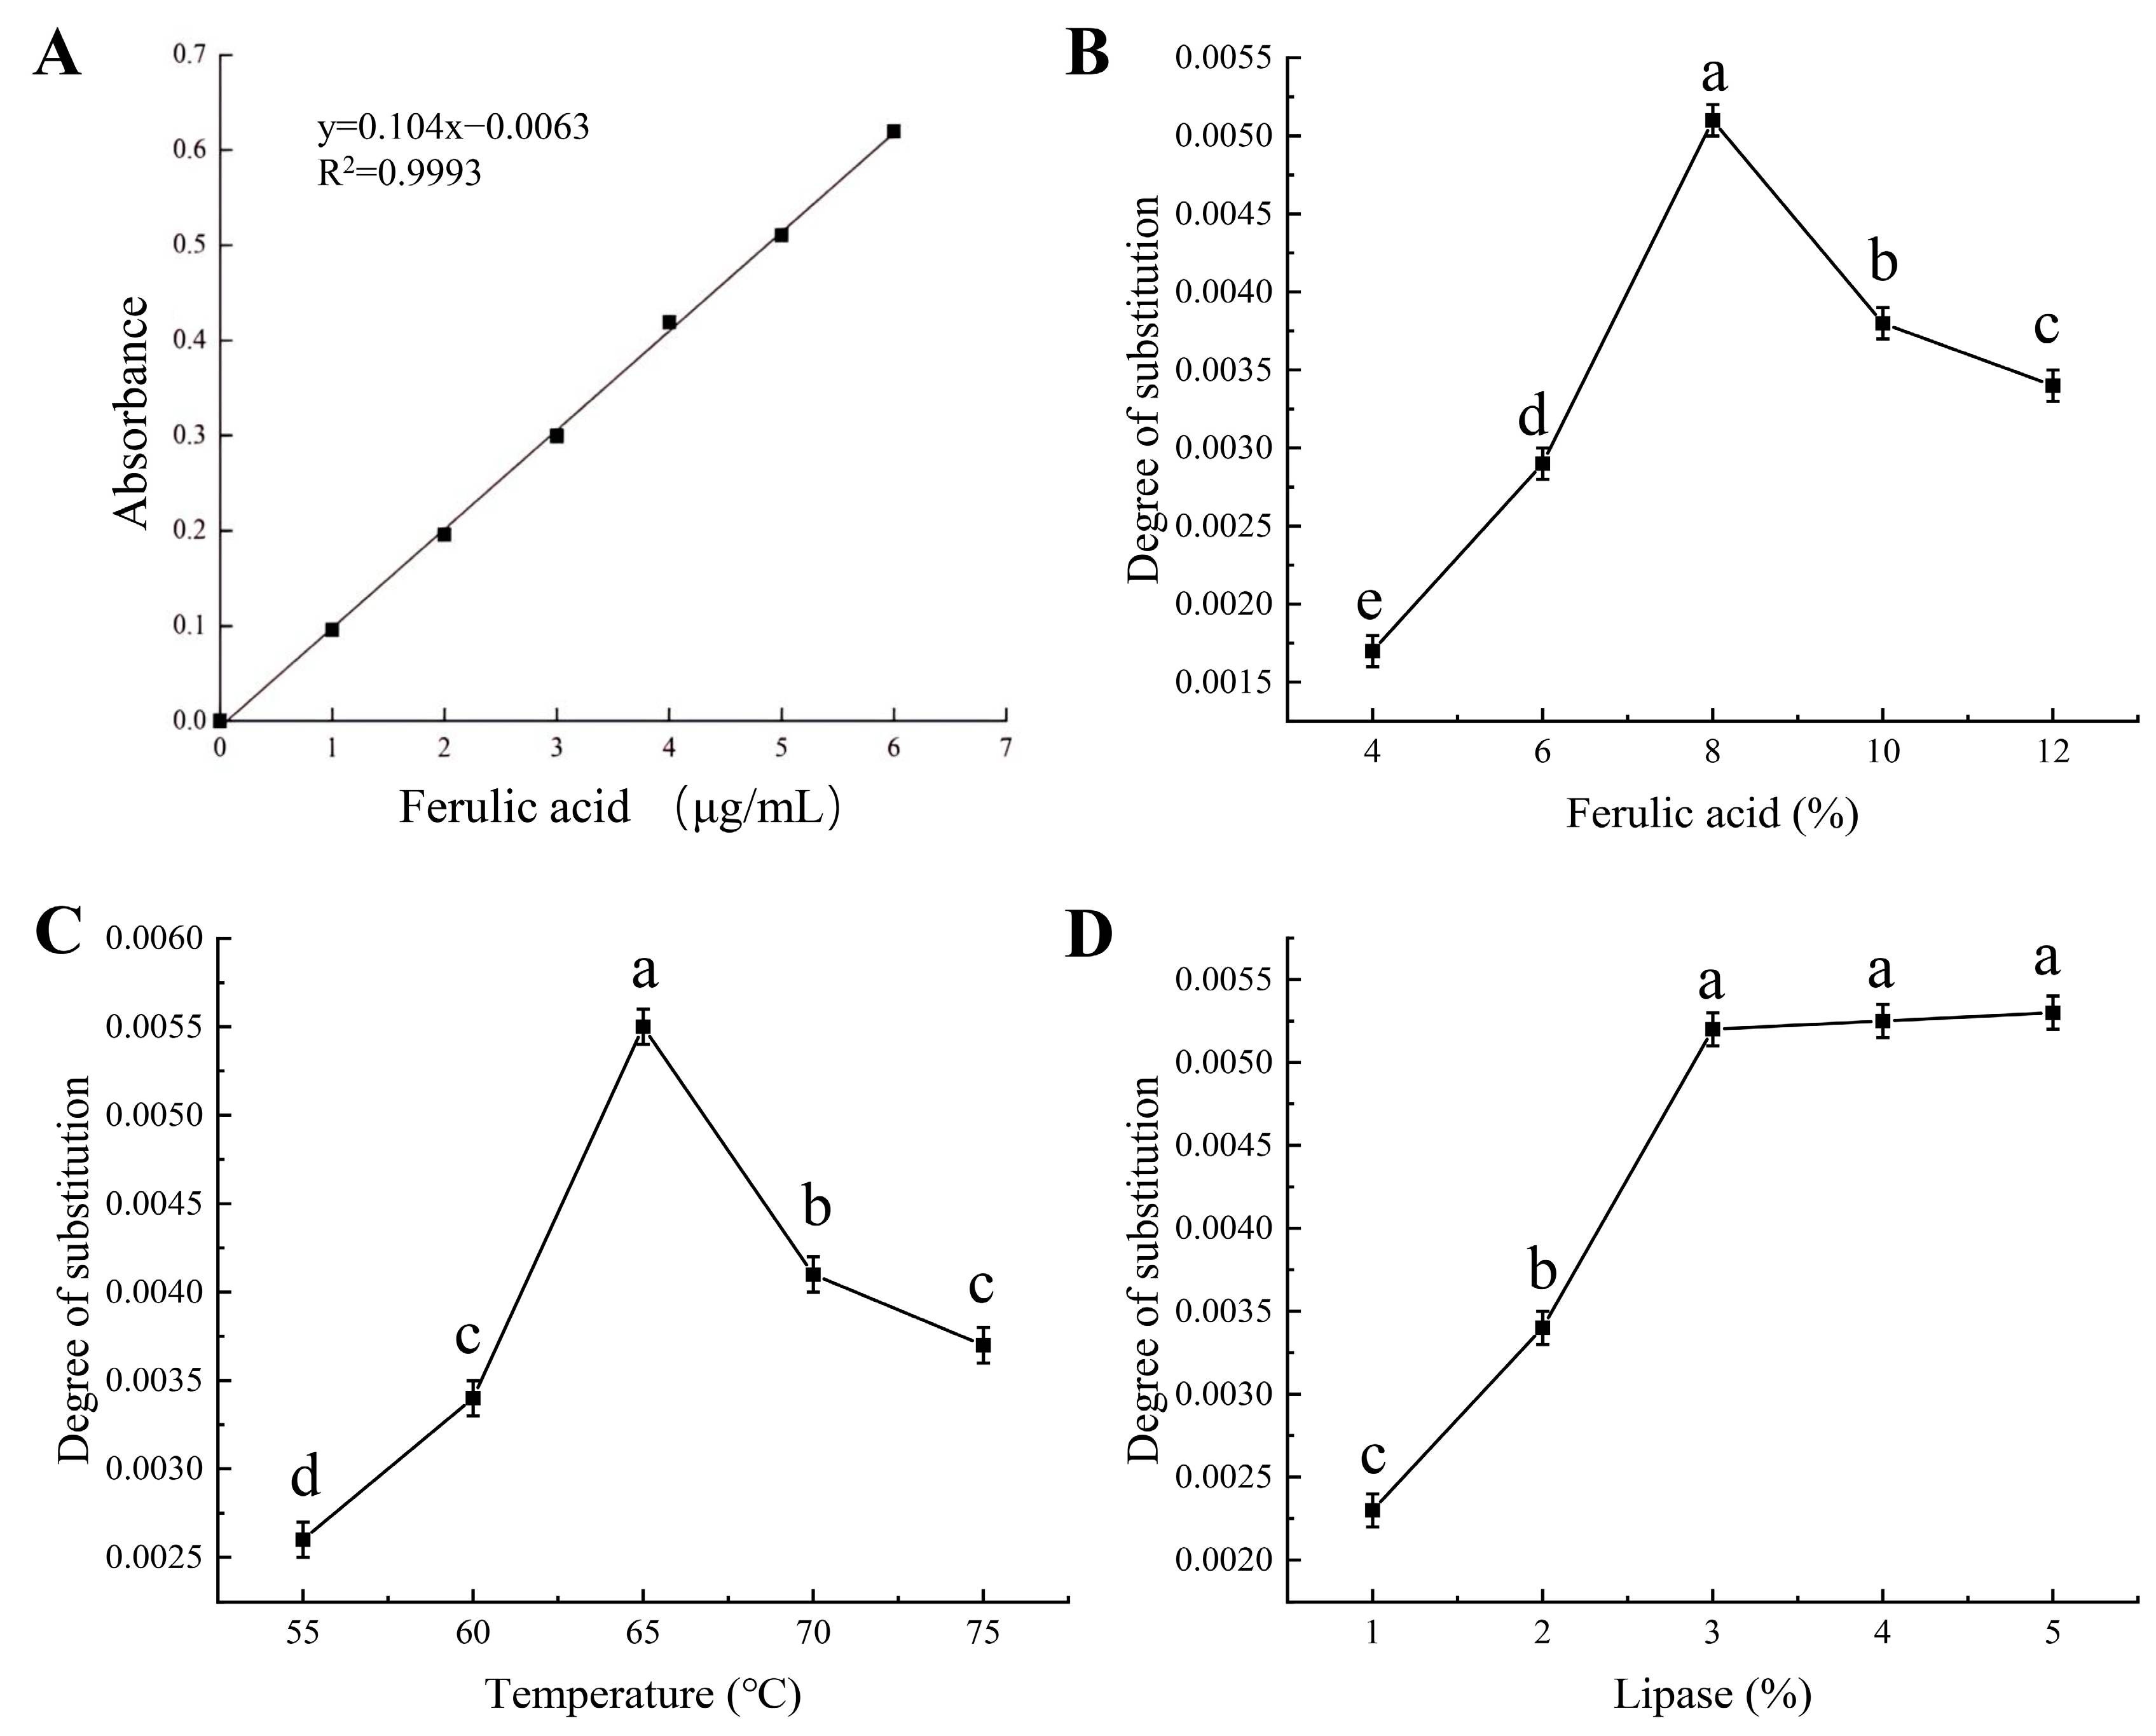
2.6. Plotting of Standard Curves
2.7. Hydrolysis of Starch Ferulate
2.8. Calculation of Degree of Substitution
2.9. Determination of Free Ferulic Acid in Reaction Products
2.10. Detection of Free Ferulic Acid by UV Spectroscopy
2.11. Fourier Transform Infrared Spectroscopy (FTIR) Analysis
2.12. X-ray Diffraction (XRD) Analysis
2.13. Scanning Electron Microscope (SEM) Analysis
2.14. Confocal Laser Scanning Microscopy (CLSM) Analysis
2.15. Data Statistics and Analysis
3. Results and Discussion
3.1. Single-Factor Experiment
3.1.1. Effect of Ferulic Acid Addition on Degree of Substitution
3.1.2. Effect of Extrusion Temperature on Degree of Substitution
3.1.3. Effect of Lipase Addition on Degree of Substitution
3.2. Box–Behnken Experimental Design and Analysis
− 3.028 × 10⁻⁴AC + 2.520 × 10⁻⁴BC − 8.588 × 10⁻⁴A2 − 9.151 × 10⁻⁴B2 − 9.733 ×
10−4C2.
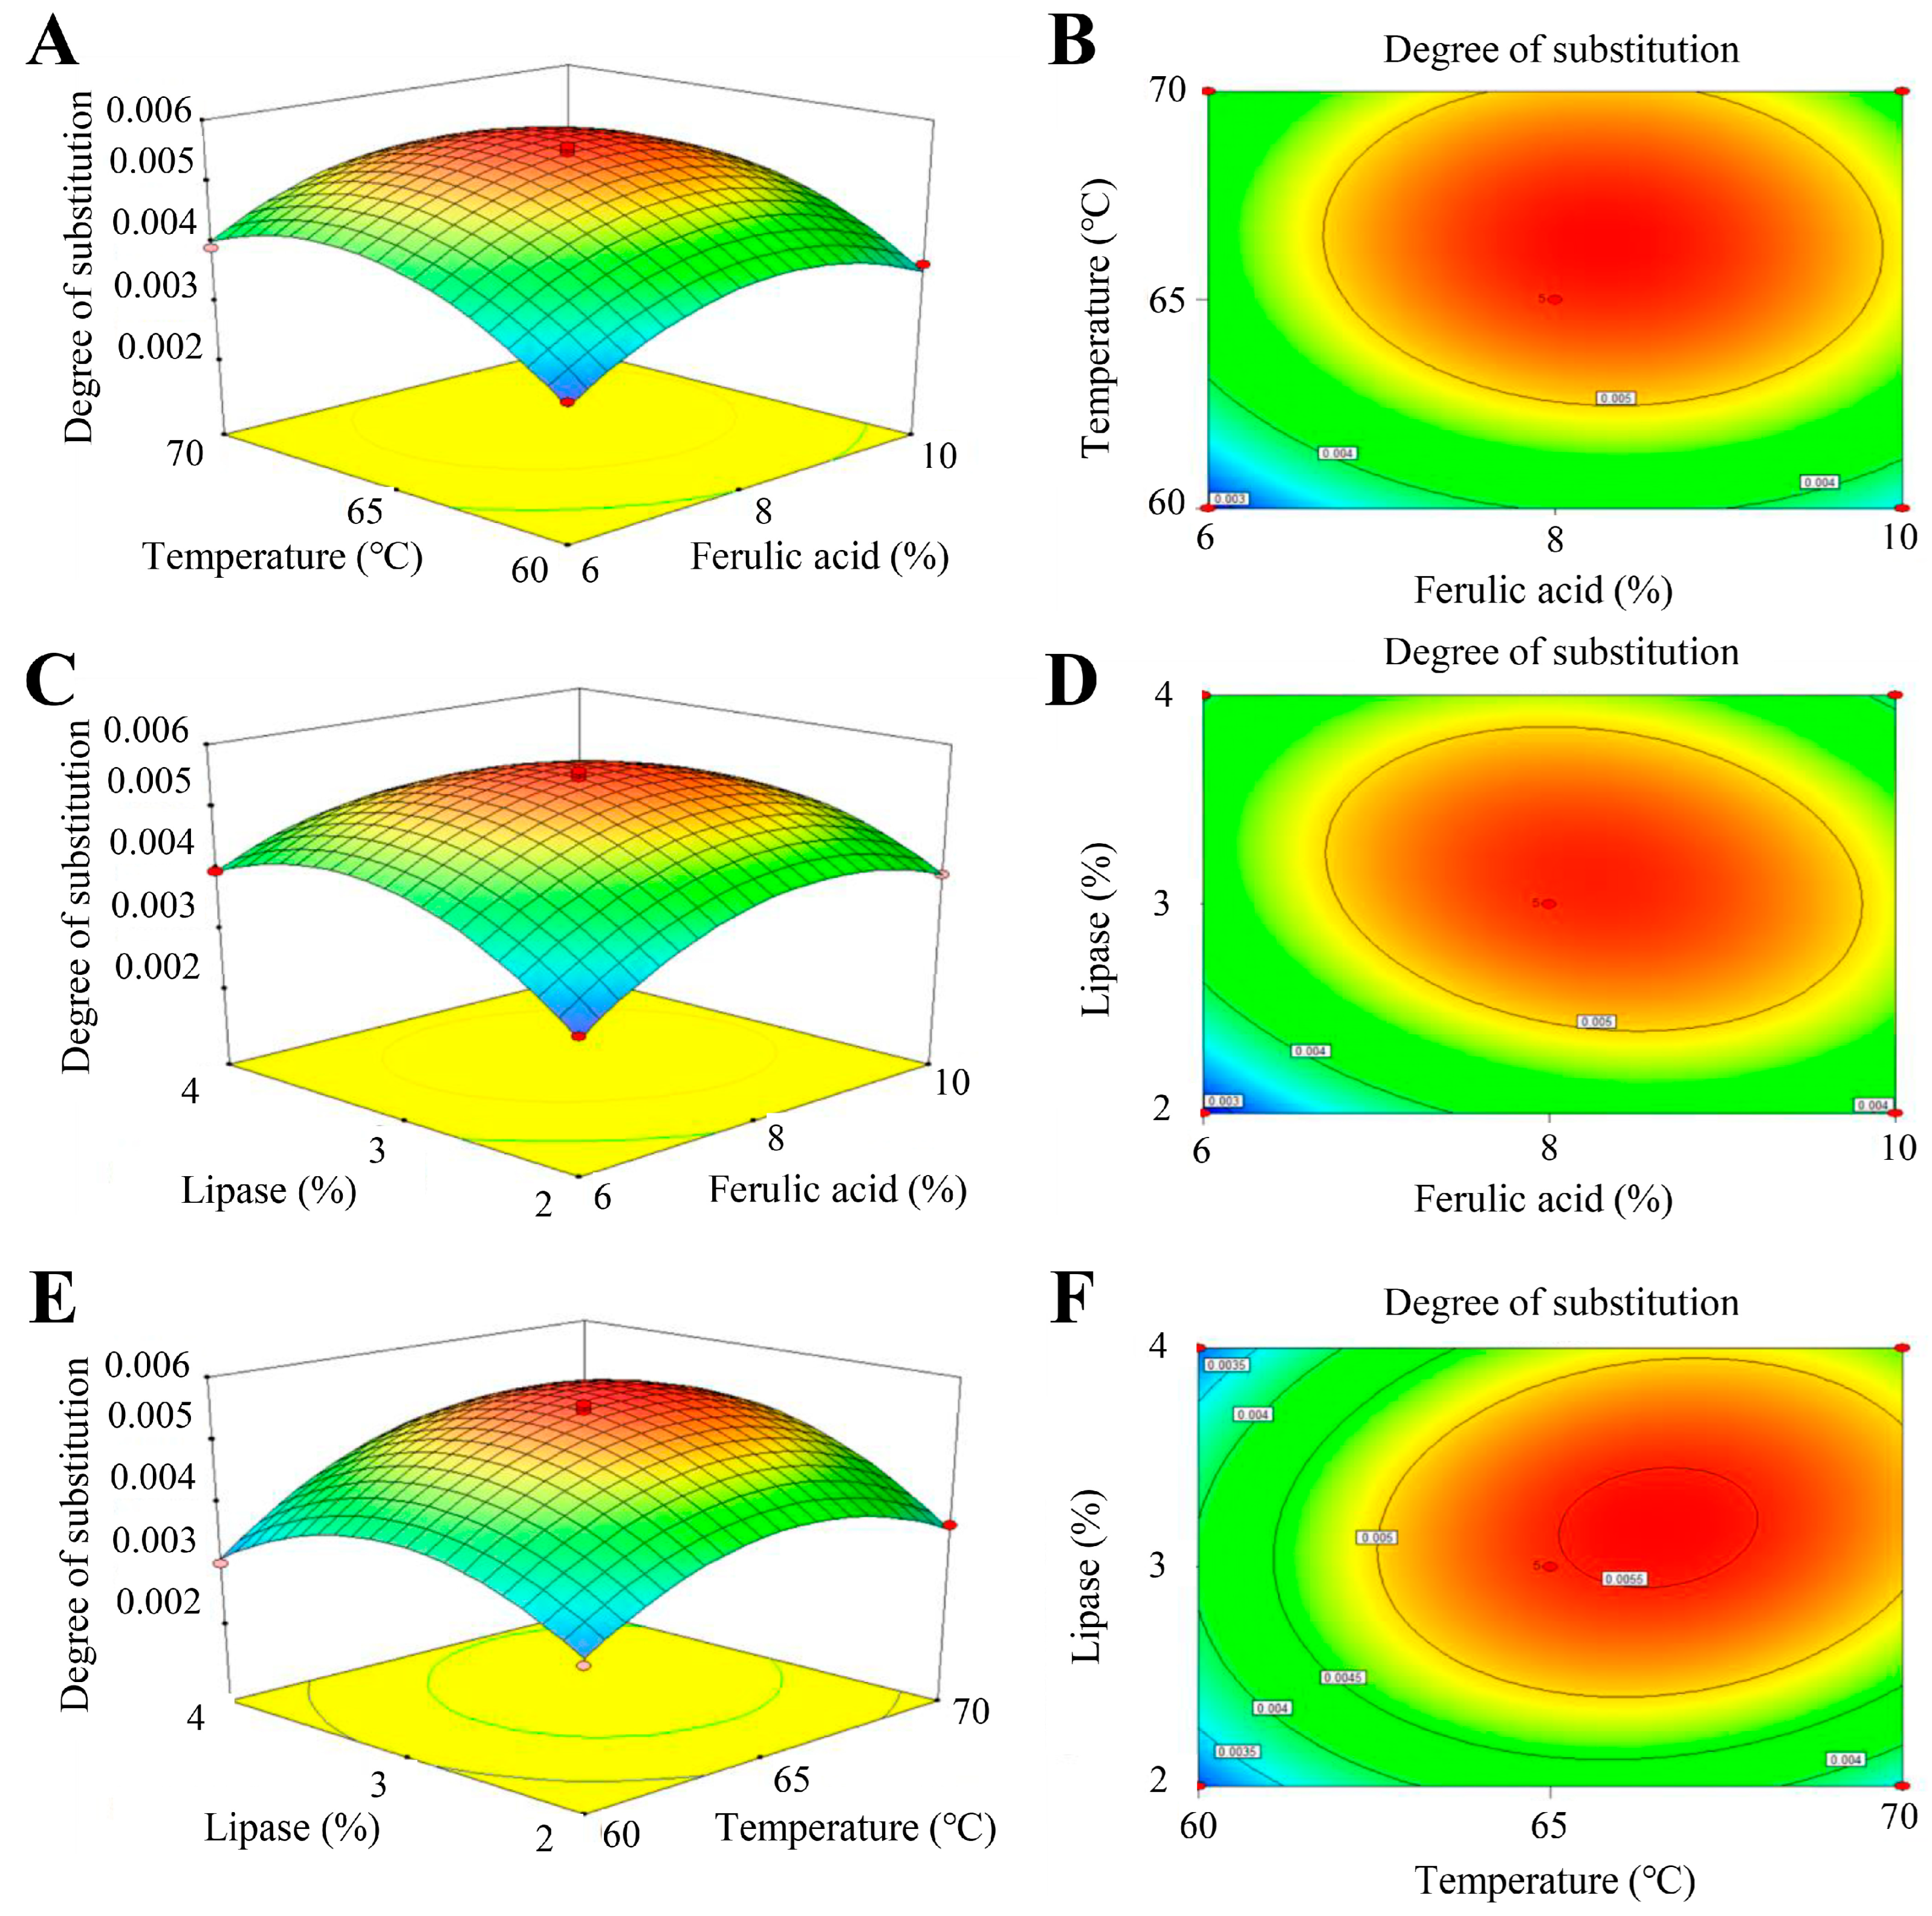
3.3. Effect of Interaction of Factors on Degree of Substitution
3.4. Optimization of Process Parameters
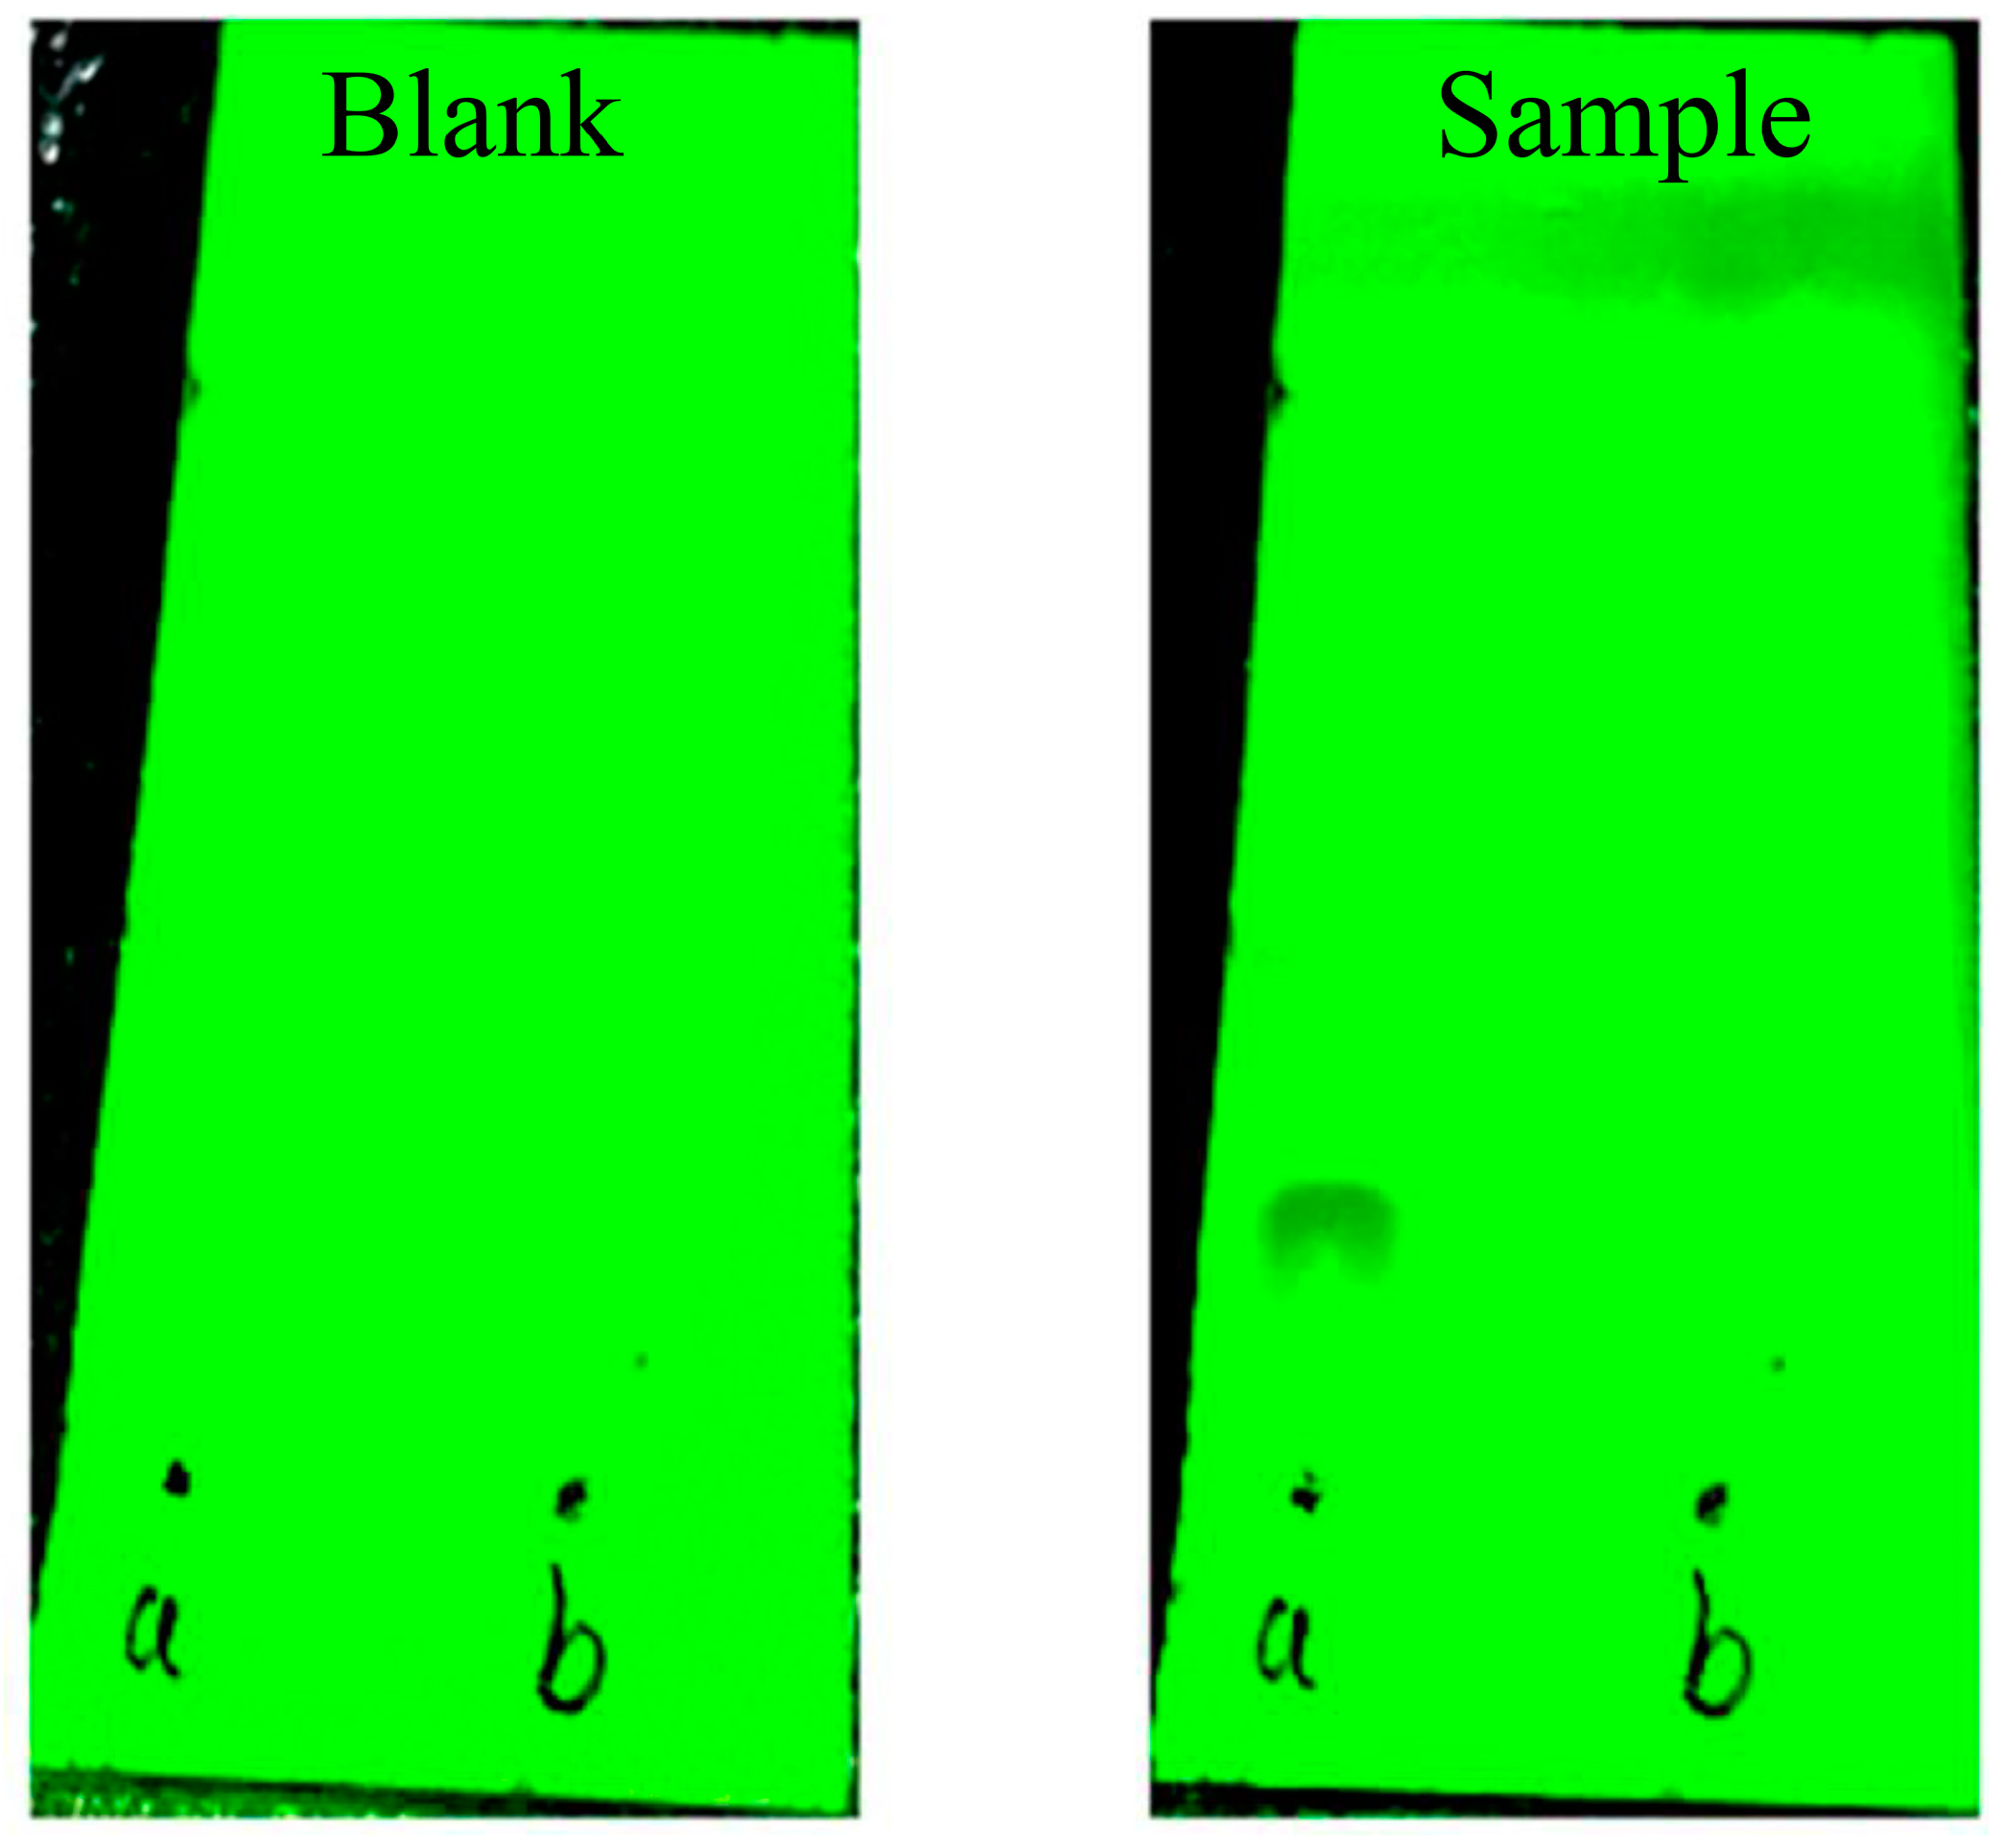
3.5. TLC Determination
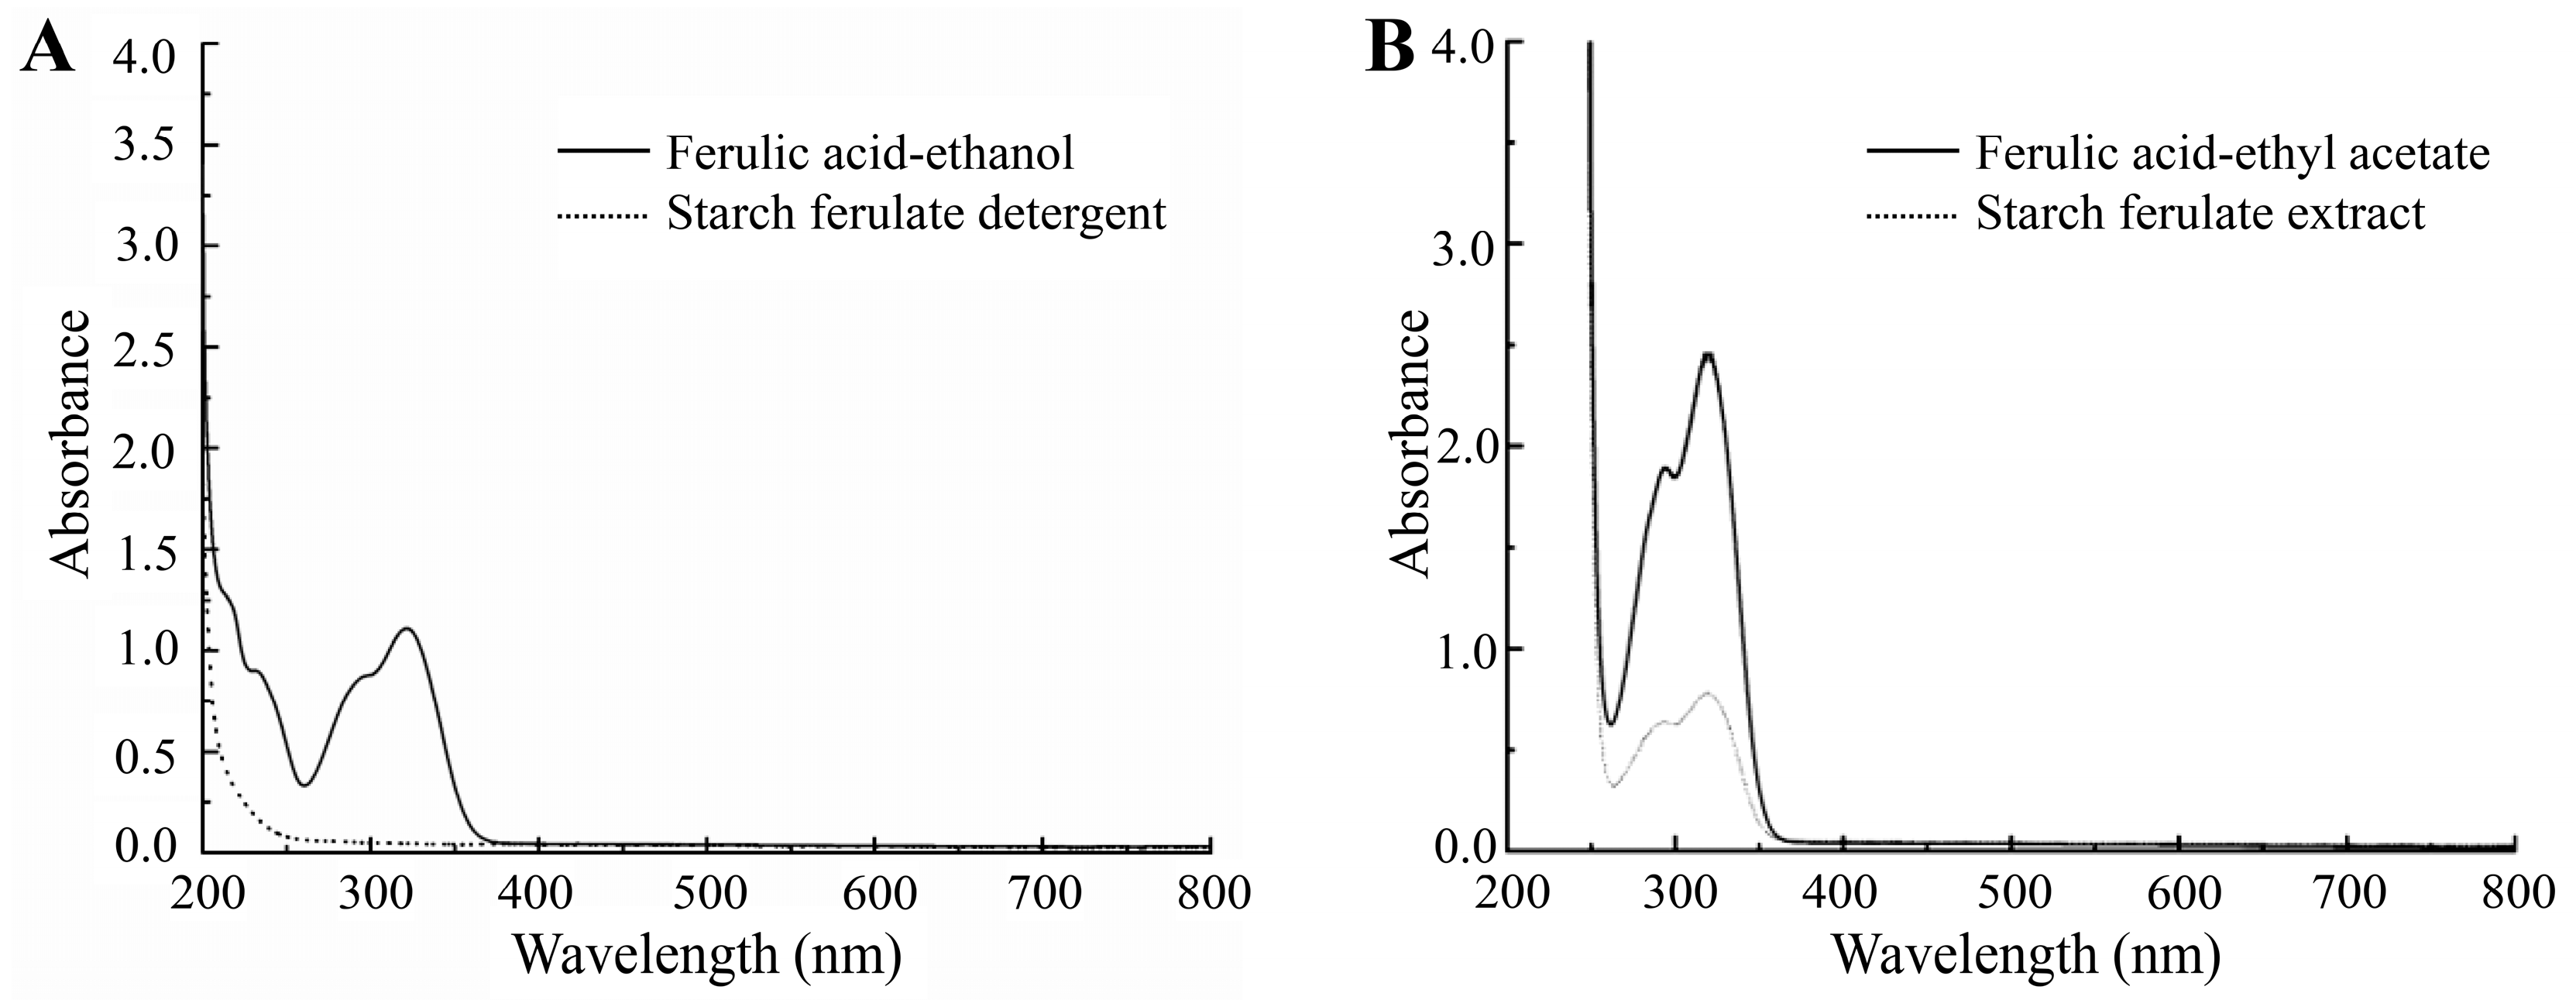
3.6. UV Spectral Determination
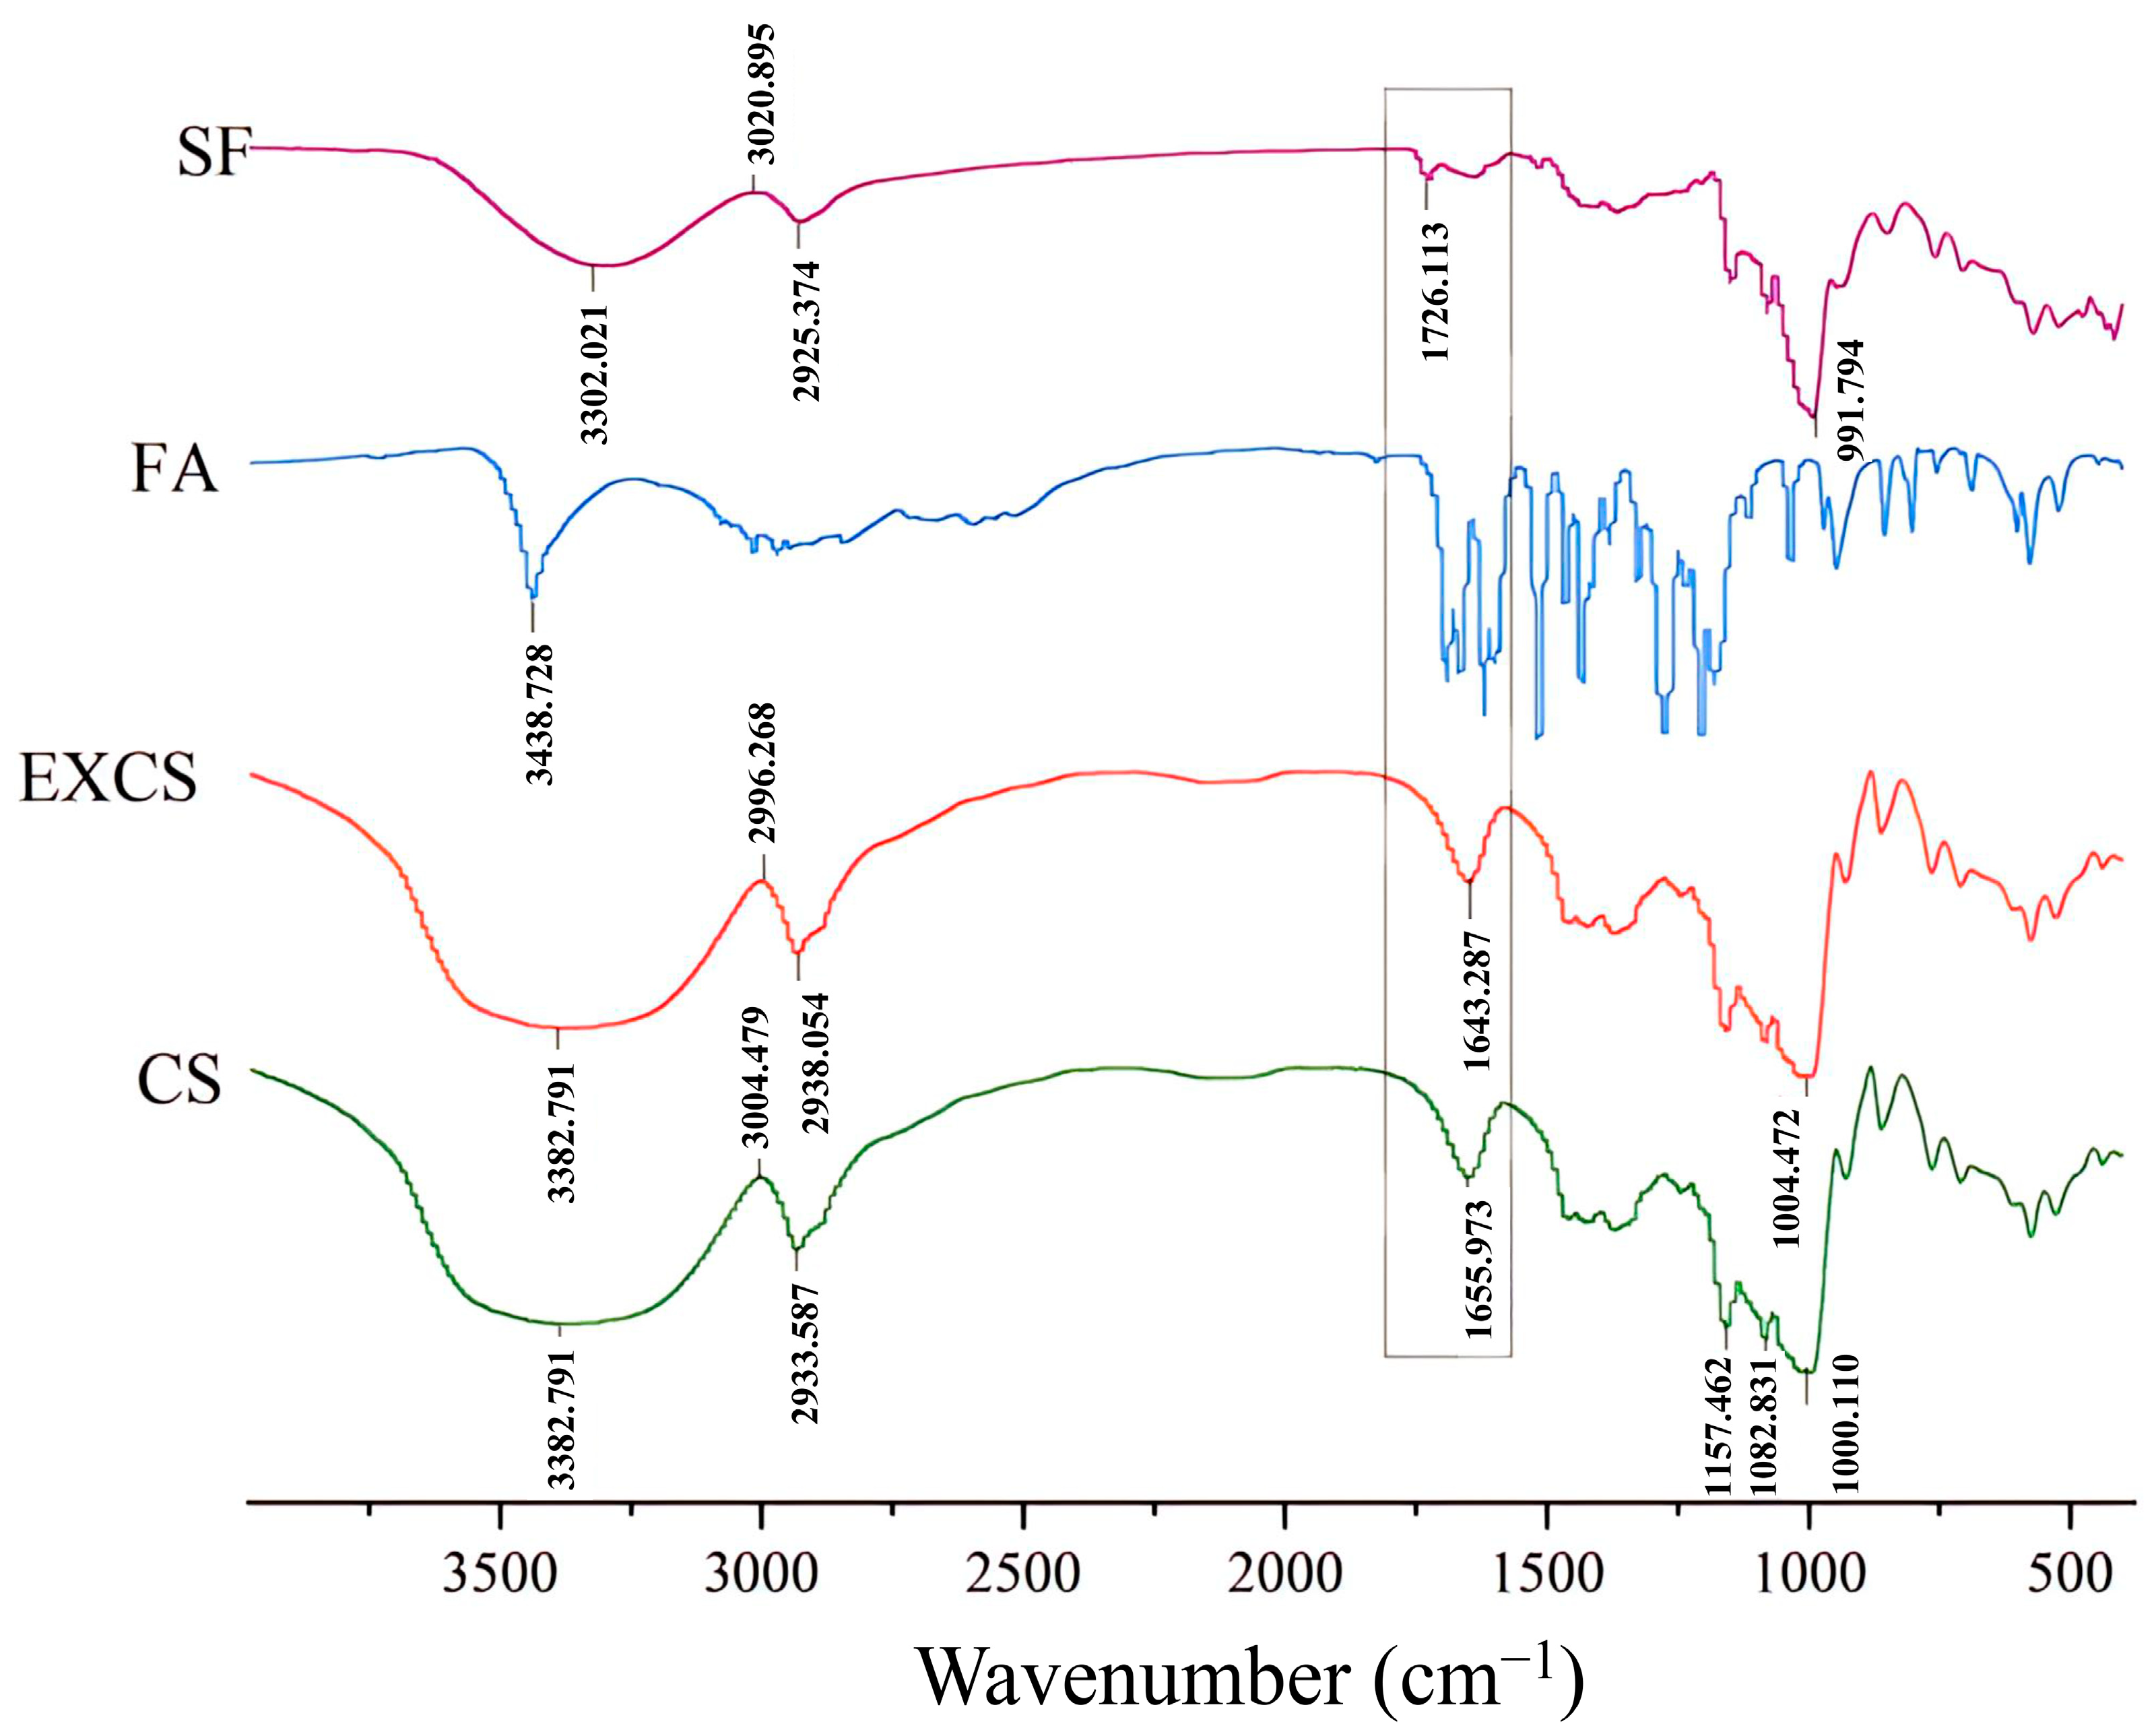
3.7. FTIR Spectroscopy Analysis
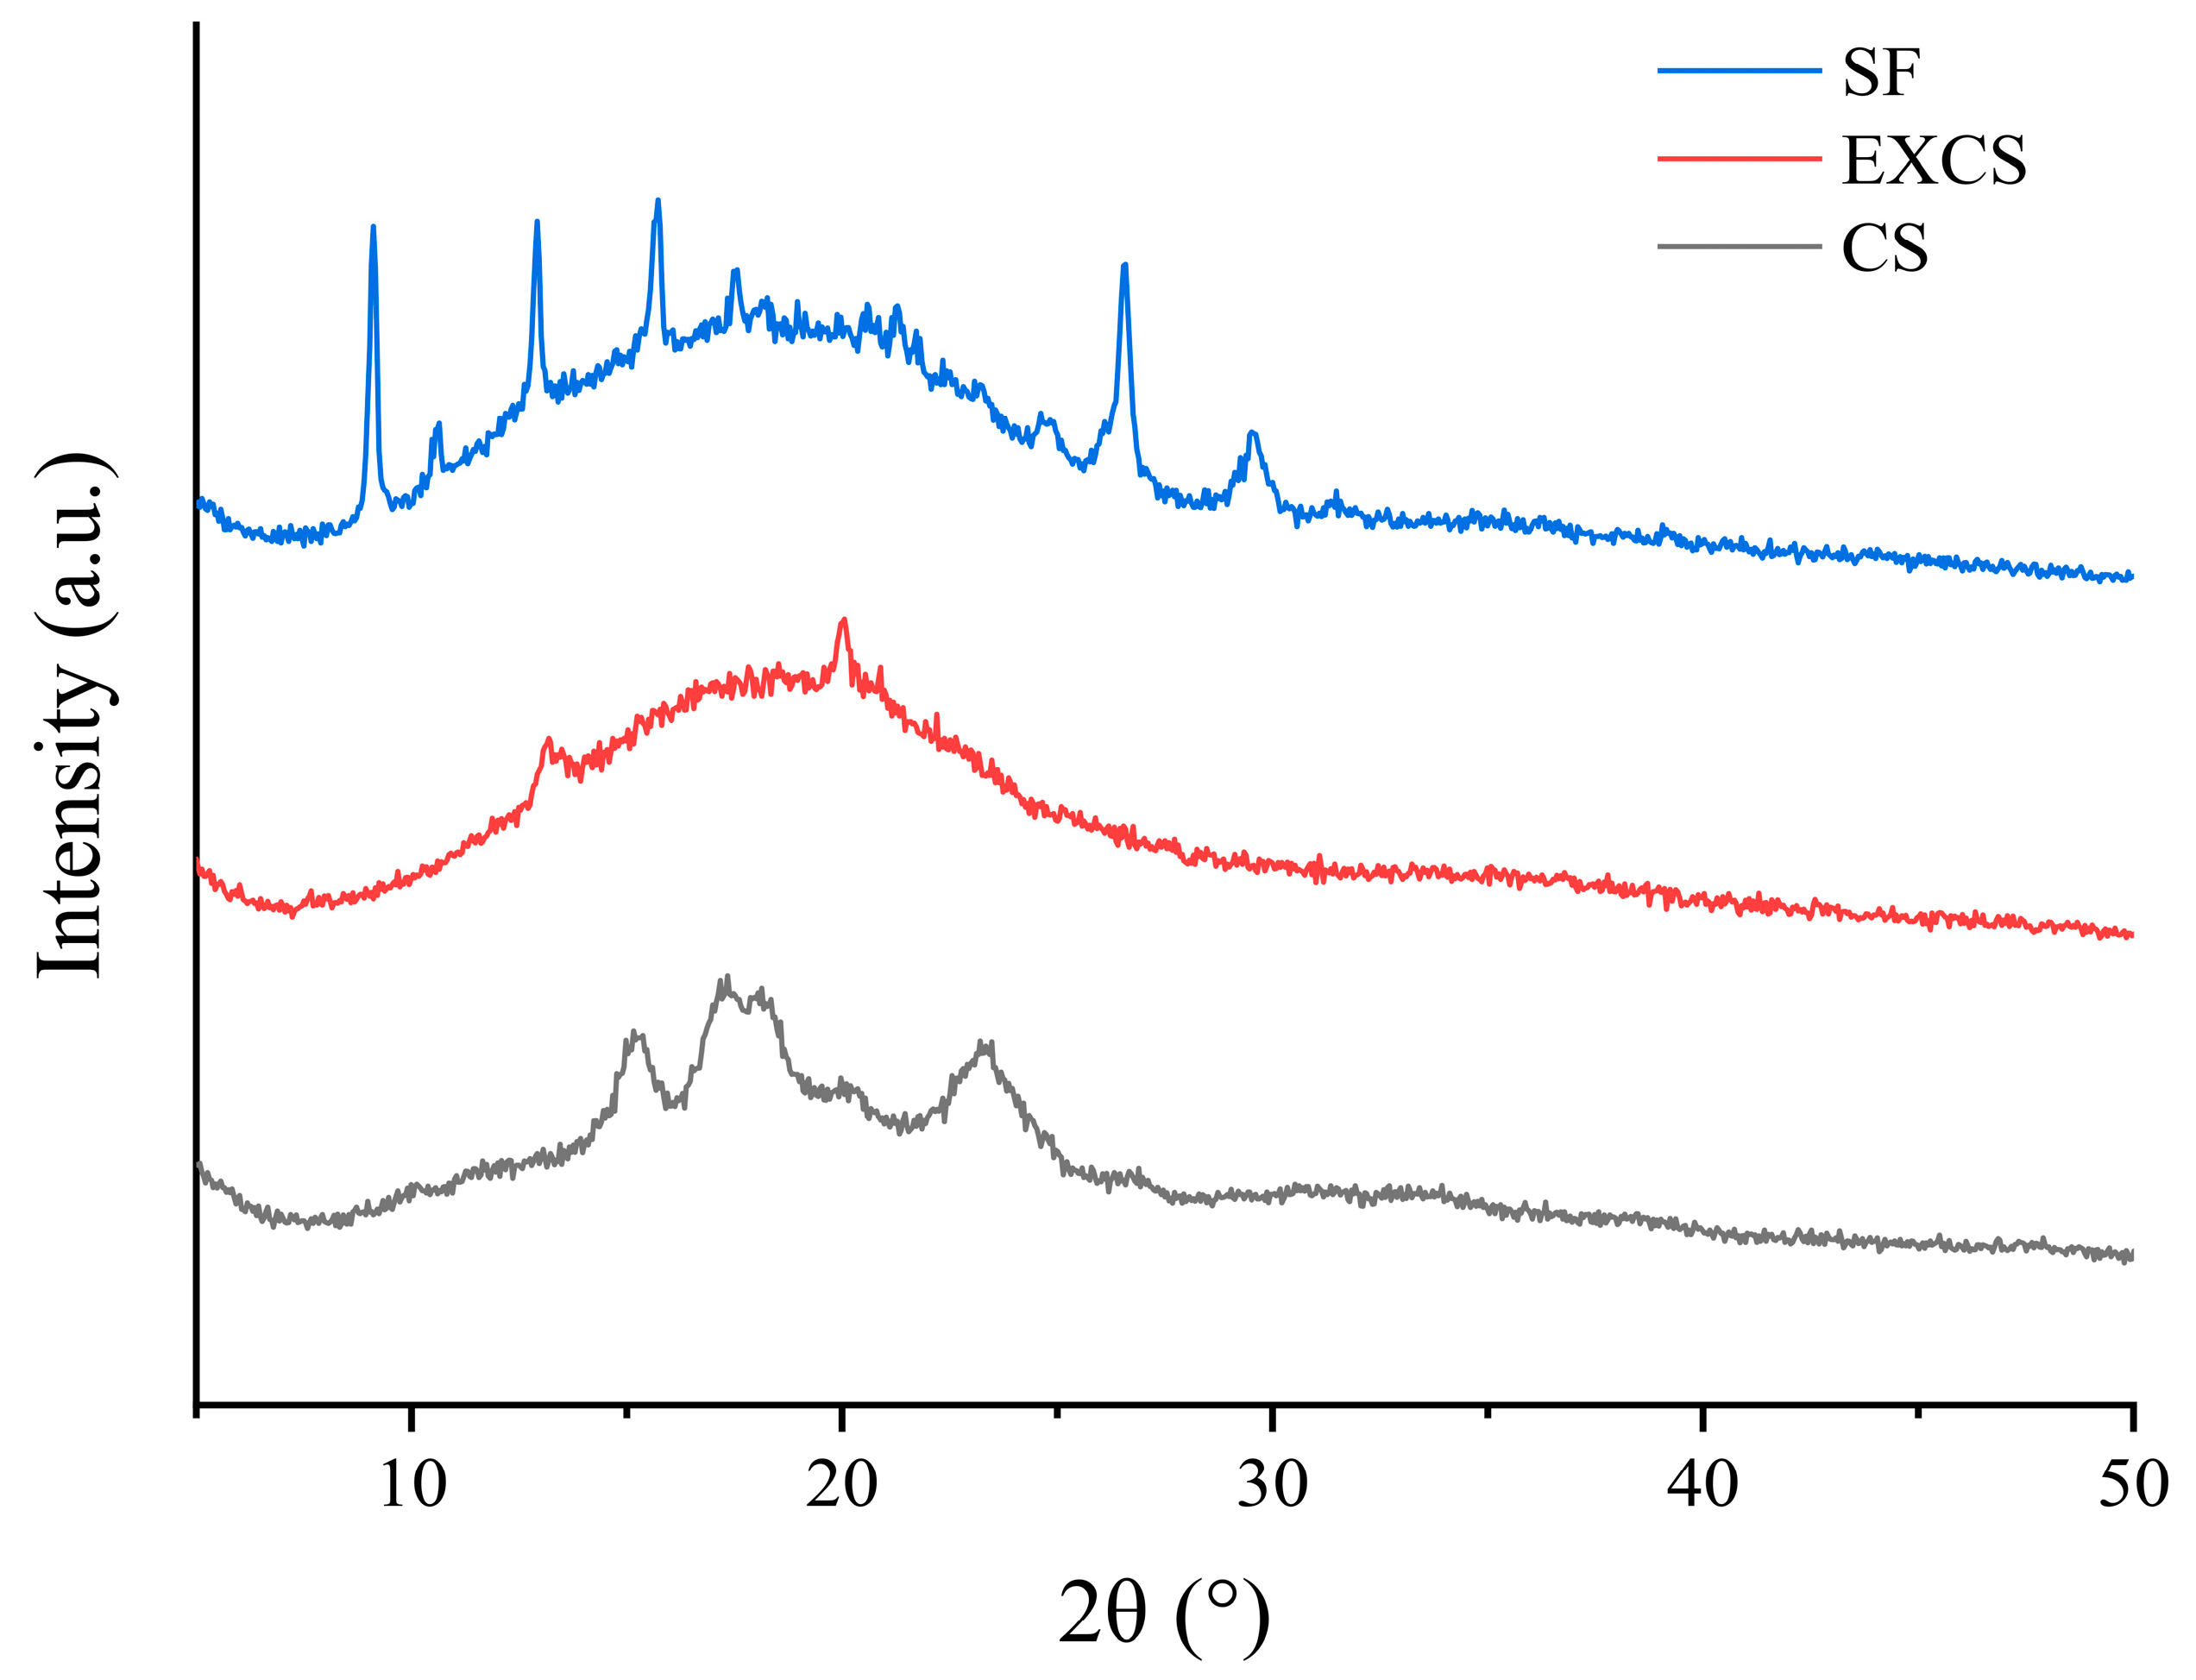
3.8. XRD Analysis
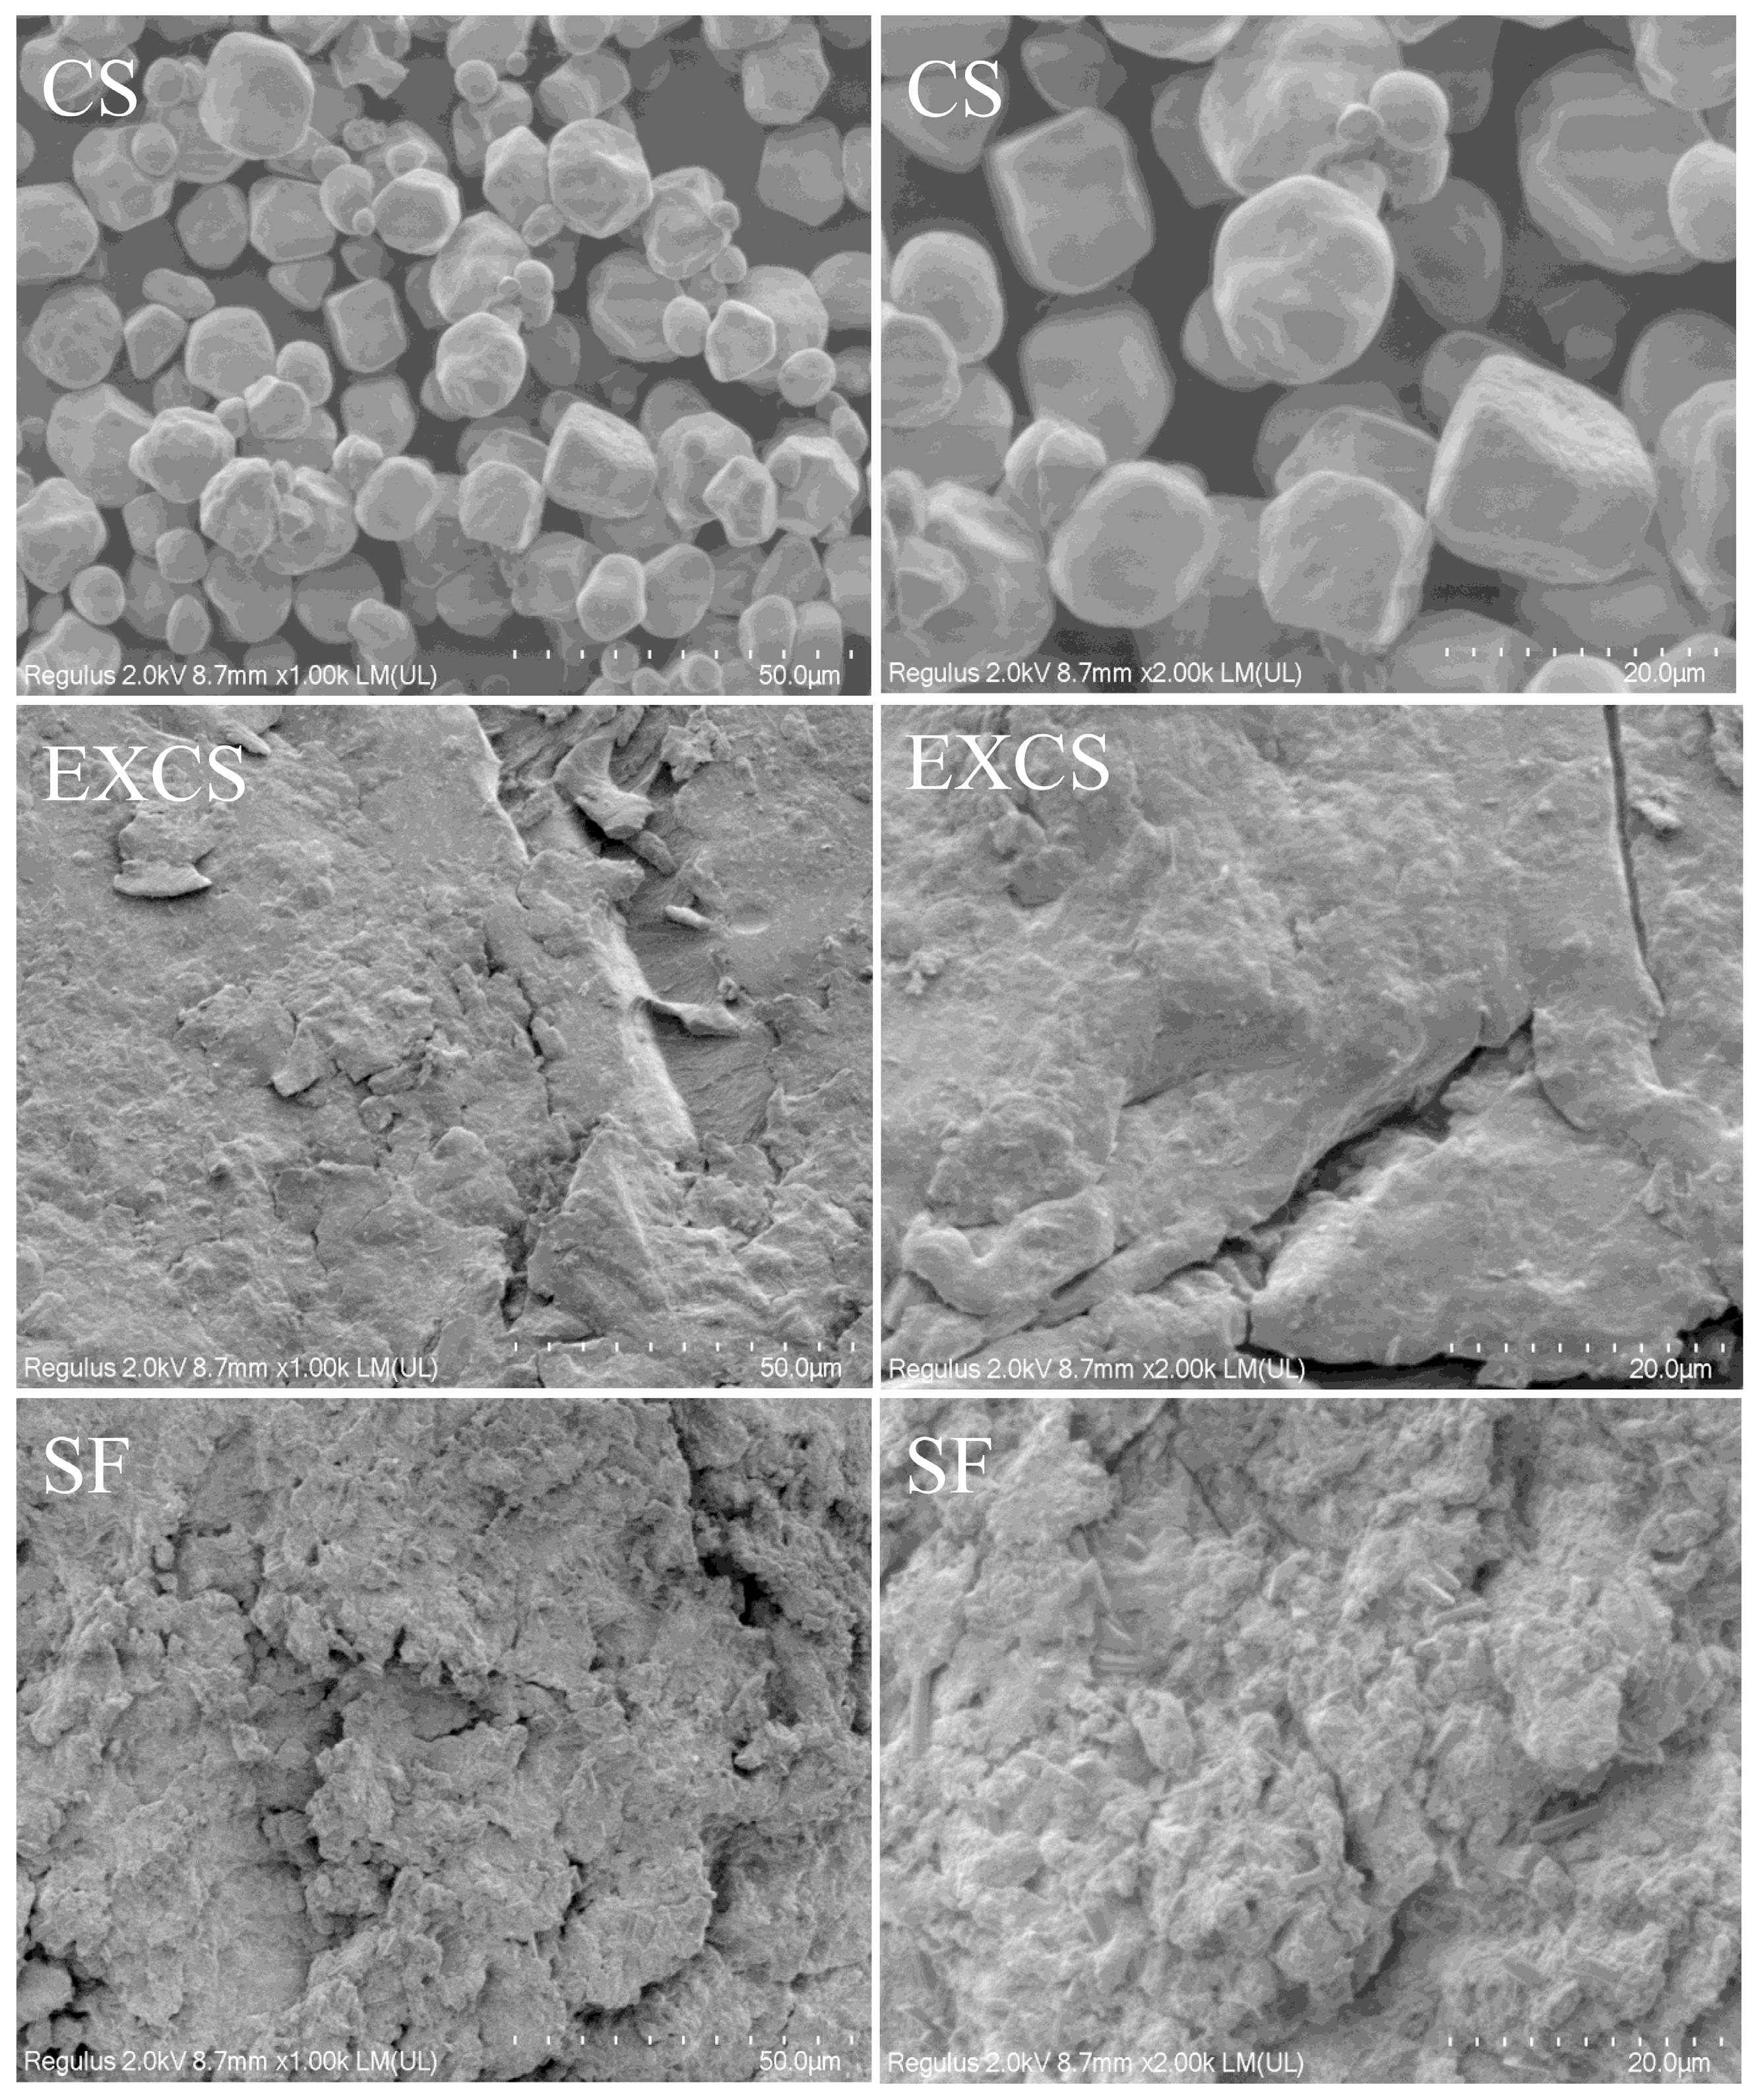
3.9. SEM Analysis
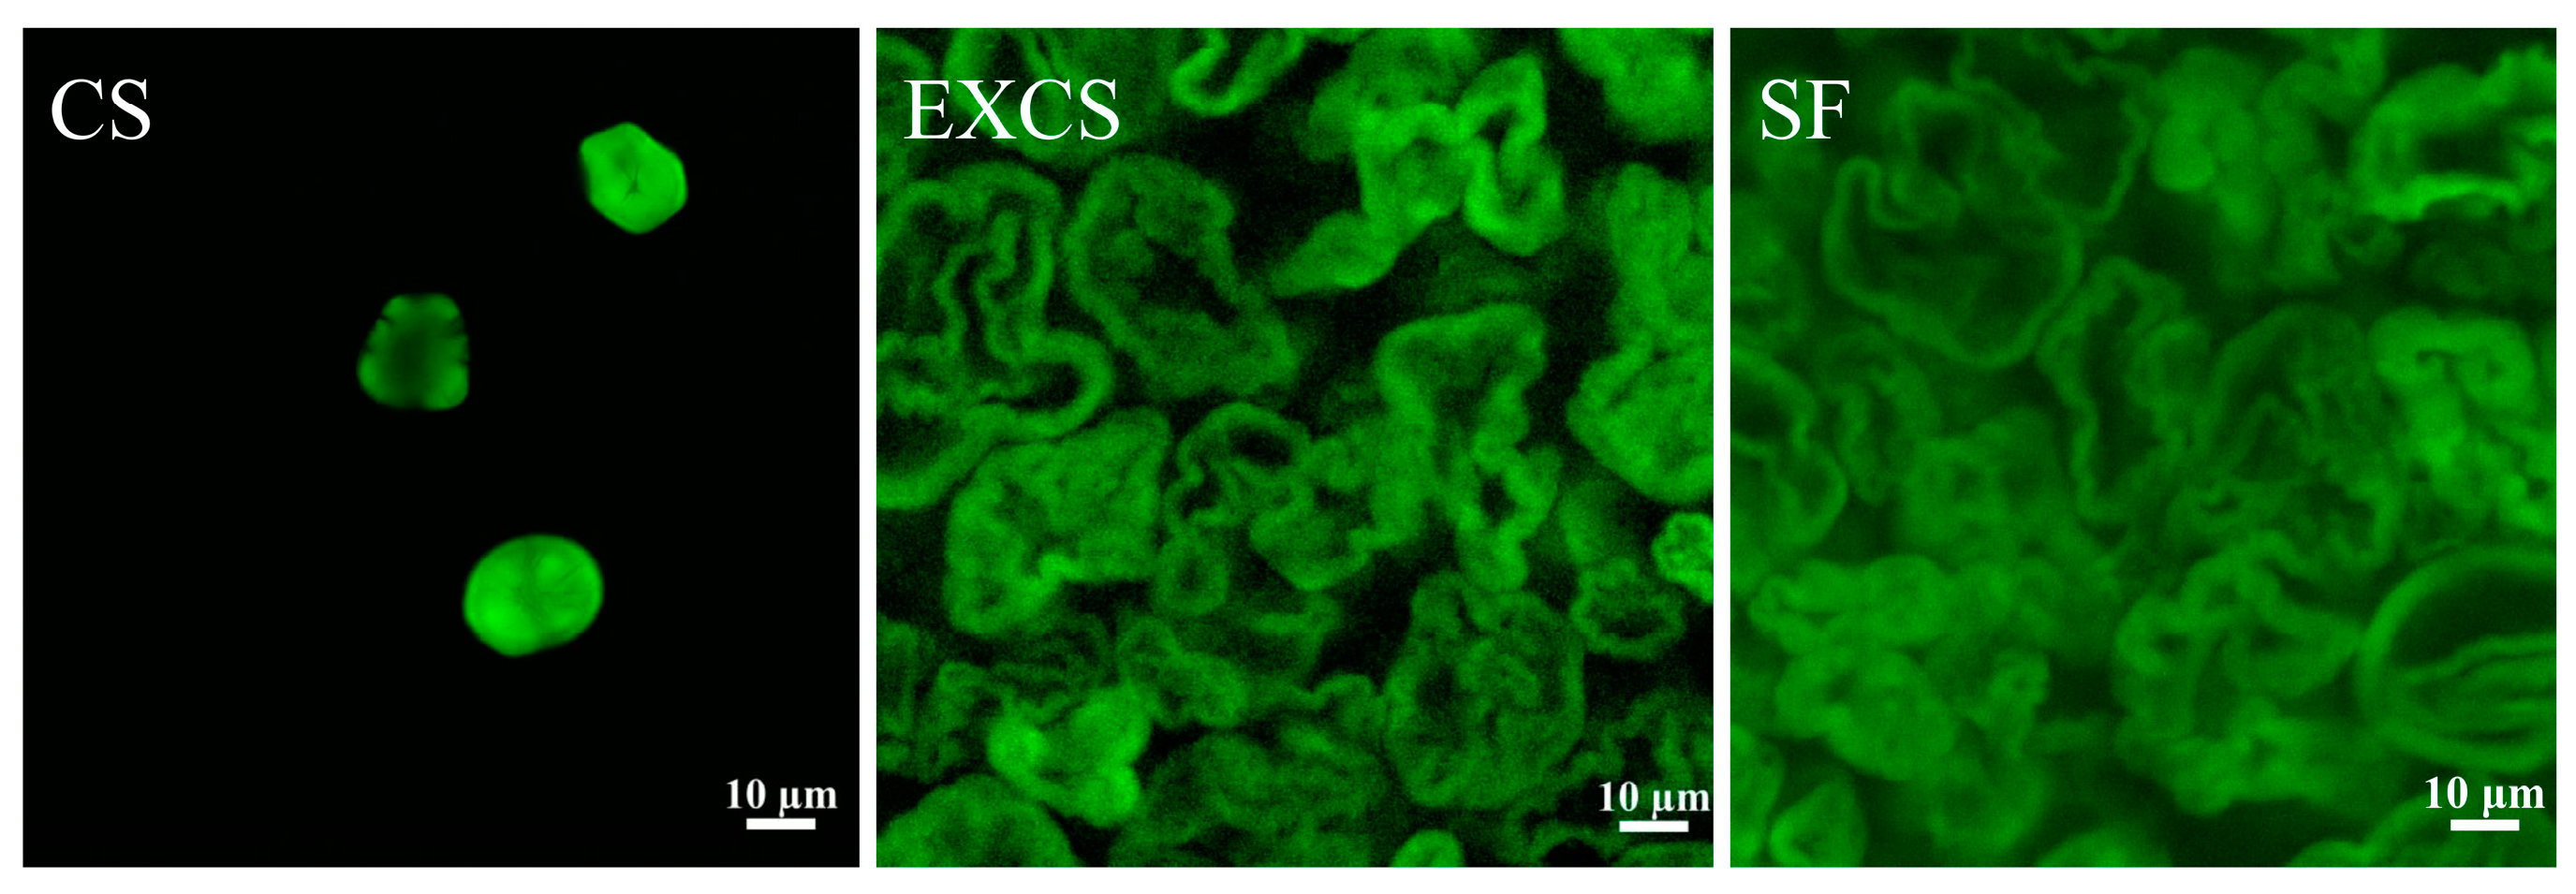
3.10. CLSM Analysis
4. Conclusions
Author Contributions
Funding
Data Availability Statement
Conflicts of Interest
References
- Wu, H.; Sang, S.; Weng, P.; Pan, D.; Wu, Z.; Yang, J.; Liu, L.; Farag, M.A.; Xiao, J.; Liu, L. Structural, rheological, and gelling characteristics of starch-based materials in context to 3D food printing applications in precision nutrition. Compr. Rev. Food Sci. Food Saf. 2023, 1–25. [Google Scholar] [CrossRef]
- Wang, C.; He, X.; Fu, X.; Luo, F.; Huang, Q. High-speed shear effect on properties and octenylsuccinic anhydride modification of corn starch. Food Hydrocoll. 2015, 44, 32–39. [Google Scholar]
- Lopez-Silva, M.; Bello-Perez, L.A.; Agama-Acevedo, E.; Alvarez-Ramirez, J. Effect of amylose content in morphological, functional and emulsification properties of OSA modified corn starch. Food Hydrocoll. 2019, 97, 105212. [Google Scholar]
- Duan, X.; Dai, Y.; Zhang, T. Characterization of Feruloyl Esterase from Bacillus pumilus SK52.001 and Its Application in Ferulic Acid Production from De-Starched Wheat Bran. Foods 2021, 10, 1229. [Google Scholar] [PubMed]
- Li, Y.; Qin, C.; Dong, L.; Zhang, X.; Wu, Z.; Liu, L.; Yang, J.; Liu, L. Whole grain benefit: Synergistic effect of oat phenolic compounds and β-glucan on hyperlipidemia via gut microbiota in high-fat-diet mice. Food Funct. 2022, 13, 12686–12696. [Google Scholar] [PubMed]
- Maibam, B.D.; Nickhil, C.; Deka, S.C. Preparation, physicochemical characterization, and in vitro starch digestibility on complex of Euryale ferox kernel starch with ferulic acid and quercetin. Int. J. Biol. Macromol. 2023, 250, 126178. [Google Scholar]
- Borowiecki, P.; Zdun, B.; Dranka, M. Chemoenzymatic enantioselective and stereo-convergent syntheses of lisofylline enantiomers via lipase-catalyzed kinetic resolution and optical inversion approach. Mol. Catal. 2021, 504, 111451. [Google Scholar]
- Mathew, S.; Abraham, T.E. Physico-chemical characterization of starch ferulates of different degrees of substitution. Food Chem. 2007, 105, 579–589. [Google Scholar] [CrossRef]
- Hollenbach, R.; Delavault, A.; Gebhardt, L.; Soergel, H.; Muhle-Goll, C.; Ochsenreither, K.; Syldatk, C. Lipase-Mediated Mechanoenzymatic Synthesis of Sugar Esters in Dissolved Unconventional and Neat Reaction Systems. ACS Sustain. Chem. Eng. 2022, 10, 10192–10202. [Google Scholar]
- Ardila-Fierro, K.J.; Crawford, D.E.; Körner, A.; James, S.L.; Bolm, C.; Hernández, J.G. Papain-catalysed mechanochemical synthesis of oligopeptides by milling and twin-screw extrusion: Application in the Juliá–Colonna enantioselective epoxidation. Green Chem. 2018, 20, 1262–1269. [Google Scholar]
- Shokri, Z.; Seidi, F.; Saeb, M.R.; Jin, Y.; Li, C.; Xiao, H. Elucidating the impact of enzymatic modifications on the structure, properties, and applications of cellulose, chitosan, starch and their derivatives: A review. Mater. Today Chem. 2022, 24, 100780. [Google Scholar]
- Jiali, L.; Wu, Z.; Liu, L.; Yang, J.; Wang, L.; Li, Z.; Liu, L. The research advance of resistant starch: Structural characteristics, modification method, immunomodulatory function, and its delivery systems application. Crit. Rev. Food Sci. Nutr. 2023, 1–18, (advance online publication). [Google Scholar] [CrossRef]
- Fang, K.; He, W.; Jiang, Y.; Li, K.; Li, J. Preparation, characterization and physicochemical properties of cassava starch-ferulic acid complexes by mechanical activation. Int. J. Biol. Macromol. 2020, 160, 482–488. [Google Scholar] [PubMed]
- Lu, K.; Miao, M.; Ye, F.; Cui, S.W.; Li, X.; Jiang, B. Impact of dual-enzyme treatment on the octenylsuccinic anhydride esterification of soluble starch nanoparticle. Carbohydr. Polym. 2016, 147, 392–400. [Google Scholar]
- Han, M.; Wu, X.; Peng, Y.; Yu, H. Preparation of low degree of substitution octenyl succinic starch ester by response surface methodology and its property analysis. J. Food Process. Preserv. 2021, 46, e16125. [Google Scholar]
- Chen, J.; Wang, Y.; Liu, J.; Xu, X. Preparation, characterization, physicochemical property and potential application of porous starch: A review. Int. J. Biol. Macromol. 2020, 148, 1169–1181. [Google Scholar] [PubMed]
- Chen, Q.; Yu, H.; Wang, L.; ul Abdin, Z.; Chen, Y.; Wang, J.; Zhou, W.; Yang, X.; Khan, R.U.; Zhang, H.; et al. Recent progress in chemical modification of starch and its applications. RSC Adv. 2015, 5, 67459–67474. [Google Scholar]
- Thitisomboon, W.; Opaprakasit, P.; Jaikaew, N.; Boonyarattanakalin, S. Characterizations of modified cassava starch with long chain fatty acid chlorides obtained from esterification under low reaction temperature and its PLA blending. J. Macromol. Sci. Part A 2018, 55, 253–259. [Google Scholar]
- Wang, W.; Hu, A.; Liu, S.; Yan, J.; Li, Y.; Zheng, J. Physicochemical properties and structure of starch ester/copolymer/complex synthesized by combination of microwave and acid (anhydride): A review. Trends Food Sci. Technol. 2023, 138, 539–550. [Google Scholar]
- Sousa, R.R.; Silva, A.S.A.; Fernandez-Lafuente, R.; Ferreira-Leitão, V.S. Solvent-free esterifications mediated by immobilized lipases: A review from thermodynamic and kinetic perspectives. Catal. Sci. Technol. 2021, 11, 5696–5711. [Google Scholar]
- Altuna, L.; Herrera, M.L.; Foresti, M.L. Synthesis and characterization of octenyl succinic anhydride modified starches for food applications. A review of recent literature. Food Hydrocoll. 2018, 80, 97–110. [Google Scholar]
- Zhang, Q.; Lu, Z.; Su, C.; Feng, Z.; Wang, H.; Yu, J.; Su, W. High yielding, one-step mechano-enzymatic hydrolysis of cellulose to cellulose nanocrystals without bulk solvent. Bioresour. Technol. 2021, 331, 125015. [Google Scholar]
- Masina, N.; Choonara, Y.E.; Kumar, P.; du Toit, L.C.; Govender, M.; Indermun, S.; Pillay, V. A review of the chemical modification techniques of starch. Carbohydr. Polym. 2017, 157, 1226–1236. [Google Scholar] [PubMed]
- Chen, X.; He, X.; Huang, Q. Effects of hydrothermal pretreatment on subsequent octenylsuccinic anhydride (OSA) modification of cornstarch. Carbohydr. Polym. 2014, 101, 493–498. [Google Scholar] [PubMed]
- Vanmarcke, A.; Leroy, L.; Stoclet, G.; Duchatel-Crépy, L.; Lefebvre, J.-M.; Joly, N.; Gaucher, V. Influence of fatty chain length and starch composition on structure and properties of fully substituted fatty acid starch esters. Carbohydr. Polym. 2017, 164, 249–257. [Google Scholar]
- Simsek, S.; Ovando-Martinez, M.; Marefati, A.; Sjöö, M.; Rayner, M. Chemical composition, digestibility and emulsification properties of octenyl succinic esters of various starches. Food Res. Int. 2015, 75, 41–49. [Google Scholar]
- Tong, F.; Deng, L.; Sun, R.; Zhong, G. Effect of octenyl succinic anhydride starch ester by semi-dry method with vacuum-microwave assistant. Int. J. Biol. Macromol. 2019, 141, 1128–1136. [Google Scholar]
- Wang, J.; Ren, F.; Yu, J.; Wang, S.; Copeland, L.; Wang, S. Novel Green Synthesis of Octenyl Succinic Anhydride Esters of Granular Starch. ACS Sustain. Chem. Eng. 2020, 8, 16503–16514. [Google Scholar]
- Wen, Y.; Ye, F.; Zhu, J.; Zhao, G. Corn starch ferulates with antioxidant properties prepared by N,N′-carbonyldiimidazole-mediated grafting procedure. Food Chem. 2016, 208, 1–9. [Google Scholar]
- Zhang, K.; Cheng, F.; Zhang, K.; Hu, J.; Xu, C.; Lin, Y.; Zhou, M.; Zhu, P. Synthesis of long-chain fatty acid starch esters in aqueous medium and its characterization. Eur. Polym. J. 2019, 119, 136–147. [Google Scholar]
- Arciszewski, J.; Auclair, K. Mechanoenzymatic Reactions Involving Polymeric Substrates or Products. ChemSusChem 2022, 15, e202102084. [Google Scholar]

| Run | Factor | |||
|---|---|---|---|---|
| Ferulic Acid (%) | Extrusion Temperature (°C) | Lipase (%) | Degree of Substitution | |
| 1 | −1 | −1 | 0 | 0.002916 |
| 2 | 1 | −1 | 0 | 0.003632 |
| 3 | −1 | 1 | 0 | 0.003914 |
| 4 | 1 | 1 | 0 | 0.004316 |
| 5 | −1 | 0 | −1 | 0.002841 |
| 6 | 1 | 0 | −1 | 0.003913 |
| 7 | −1 | 0 | 1 | 0.003965 |
| 8 | 1 | 0 | 1 | 0.003826 |
| 9 | 0 | −1 | −1 | 0.002936 |
| 10 | 0 | 1 | −1 | 0.003644 |
| 11 | 0 | −1 | 1 | 0.003012 |
| 12 | 0 | 1 | 1 | 0.004728 |
| 13 | 0 | 0 | 0 | 0.005478 |
| 14 | 0 | 0 | 0 | 0.005543 |
| 15 | 0 | 0 | 0 | 0.005314 |
| 16 | 0 | 0 | 0 | 0.005418 |
| 17 | 0 | 0 | 0 | 0.005589 |
| Factors | df | SS | MS | F-Value | p-Value | Significance |
|---|---|---|---|---|---|---|
| A | 1 | 5.258 × 10⁻⁷ | 5.258 × 10⁻⁷ | 30.28 | 0.0009 | ** |
| B | 1 | 2.107 × 10⁻⁶ | 2.107 × 10⁻⁶ | 121.34 | <0.0001 | ** |
| C | 1 | 6.034 × 10⁻⁷ | 6.034 × 10⁻⁷ | 34.74 | 0.0006 | ** |
| AB | 1 | 2.465 × 10⁻⁸ | 2.465 × 10⁻⁸ | 1.42 | 0.2723 | / |
| AC | 1 | 3.666 × 10⁻⁷ | 3.666 × 10⁻⁷ | 21.11 | 0.0025 | ** |
| BC | 1 | 2.540 × 10⁻⁷ | 2.540 × 10⁻⁷ | 14.63 | 0.0065 | ** |
| A2 | 1 | 3.106 × 10⁻⁶ | 3.106 × 10⁻⁶ | 178.82 | <0.0001 | ** |
| B2 | 1 | 3.526 × 10⁻⁶ | 3.526 × 10⁻⁶ | 203.01 | <0.0001 | ** |
| C2 | 1 | 3.989 × 10⁻⁶ | 3.989 × 10⁻⁶ | 229.68 | <0.0001 | ** |
| Model | 9 | 1.575 × 10⁻⁵ | 1.750 × 10⁻⁶ | 100.74 | <0.0001 | ** |
| Error | 7 | 1.216 × 10⁻⁷ | 1.737 × 10⁻⁸ | |||
| Lack of fit | 3 | 7.499 × 10⁻⁸ | 2.500 × 10⁻⁸ | 2.15 | 0.2371 | / |
| Pure error | 4 | 4.658 × 10⁻⁸ | 1.165 × 10⁻⁸ | |||
| Sum | 16 | 1.587 × 10⁻⁵ |
| Mean | R2 (%) | R2Adj (%) | COV (%) |
|---|---|---|---|
| 4.176 × 10⁻³ | 99.23 | 98.25 | 3.16 |
Disclaimer/Publisher’s Note: The statements, opinions and data contained in all publications are solely those of the individual author(s) and contributor(s) and not of MDPI and/or the editor(s). MDPI and/or the editor(s) disclaim responsibility for any injury to people or property resulting from any ideas, methods, instructions or products referred to in the content. |
© 2023 by the authors. Licensee MDPI, Basel, Switzerland. This article is an open access article distributed under the terms and conditions of the Creative Commons Attribution (CC BY) license (https://creativecommons.org/licenses/by/4.0/).
Share and Cite
Liu, J.; Gao, T.; Xin, J.; Xia, C. Unveiling Optimal Synthesis and Structural Insights of Starch Ferulate via the Mechanoenzymatic Method. Foods 2023, 12, 3715. https://doi.org/10.3390/foods12203715
Liu J, Gao T, Xin J, Xia C. Unveiling Optimal Synthesis and Structural Insights of Starch Ferulate via the Mechanoenzymatic Method. Foods. 2023; 12(20):3715. https://doi.org/10.3390/foods12203715
Chicago/Turabian StyleLiu, Jingxue, Tingting Gao, Jiaying Xin, and Chungu Xia. 2023. "Unveiling Optimal Synthesis and Structural Insights of Starch Ferulate via the Mechanoenzymatic Method" Foods 12, no. 20: 3715. https://doi.org/10.3390/foods12203715
APA StyleLiu, J., Gao, T., Xin, J., & Xia, C. (2023). Unveiling Optimal Synthesis and Structural Insights of Starch Ferulate via the Mechanoenzymatic Method. Foods, 12(20), 3715. https://doi.org/10.3390/foods12203715