3.1. Drying Kinetics and Modelling
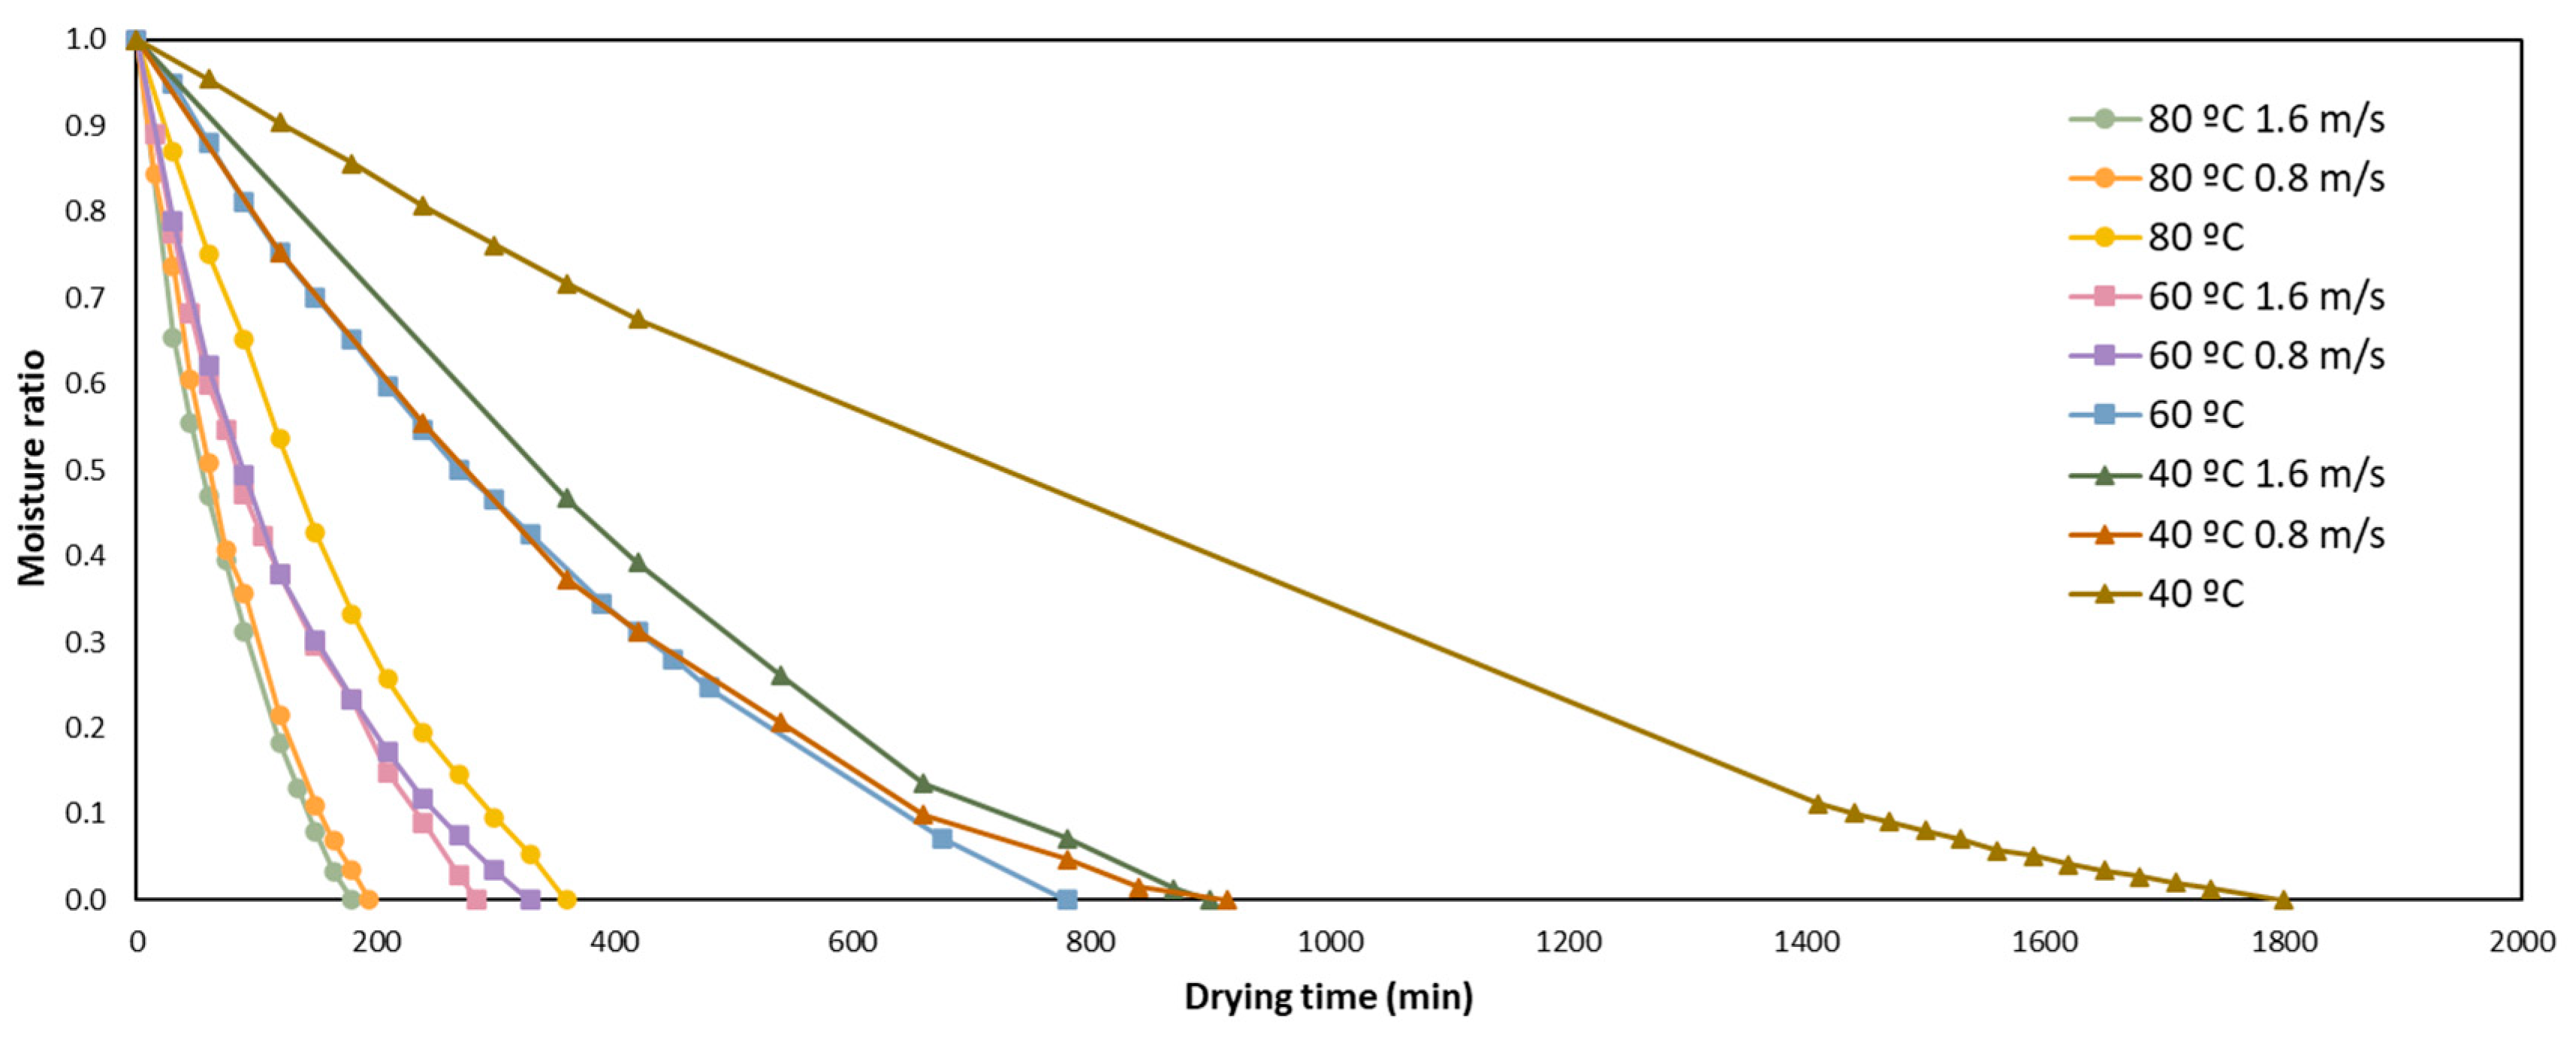
The drying curve of orange by-product is shown in
Figure 1; the changes of the moisture ratio of the orange peel through the drying time at different temperatures (40, 60 and 80 °C) and air flows (0, 0.8 and 1.2 m/s) are reported.
Without air flow, the drying time required to achieve the final moisture were 360, 720 and 1800 min, at 80, 60 and 40 °C, respectively. The temperature had a high influence on the drying of orange by-product. As expected, using higher temperature for less time was needed to reach the lower moisture-ratio. In the same way, the air flow was demonstrated to affect the drying. Using an air flow of 1.6 m/s, the time reduction was of 50% at all the temperatures tested, compared to not using air flow. There were not significative (p < 0.05) differences in time reduction with an air flow of 0.8 or 1.6 m/s. As a combination of temperature and air flow, drying at 80 °C with an air flow of 1.6 m/s was the quickest, needing only 180 min. However, to evaluate and select the best drying conditions, other parameters should be measured.
Figure 2 shows the average drying rates of the orange peels dried at three different temperatures and airflows, against time. Depending on the drying conditions, the initial drying rate reached the maximum value at 30–45 min. The drying rate declined rapidly after this time. These facts can be due to the rapid evaporation of the surface moisture occurring in the first hour and, after that, to the evaporation of the internal moisture. This tendency has been previously reported by other authors in other matrices such as mentha [
48], rosemary [
49] and thyme [
50]. The increase in temperature enhanced the drying rate considerably. In fact, without airflow, the drying rate increased 78.6% when drying at 80 °C, compared to drying at 40 °C. Furthermore, a consistent effect was found with the airflow. The highest impact on the drying rate with the airflow was at 80 °C (an increase of 61.1% when using 1.6 m/s of airflow). However, higher increases were also found with the airflow when drying at 60 °C (69.6%) and 40 °C (57.2%).
Figure 2 shows that the samples dried at 80 °C using airflow reached the highest drying rate among all the tested conditions.
As regards the kinetics of drying, in
Figure 1 it can be clearly appreciated that there are two stages of drying. The first one is the most rapid phase, and is majorly linear. In this step we appreciate the evaporation of the water of the superficial layers of the orange by-product. The second one is an exponential phase that usually takes longer, and is when the remaining water content diffuses to the surface. Therefore, the mathematical modelling of the drying curves is important for a better control of the drying process and better quality of the orange by-product.
To evaluate which model predicts the best drying kinetics of the orange by-product, the statistical parameters presented in
Table 2 such as R
2, X
2, RMSE, P
0 and MAE were taken into account. Overall, these terms indicate how the experimental and the prediction data are comparable. They were calculated at all the three temperatures at the three different air flows for the five proposed mathematical models.
The model is considered to have a high-quality fit, as the R
2 value is closer to 1 and the X
2, SEE, RMSE, P
0 and MAE values are closer to 0. In general, all the models gave satisfactory results, with high coefficients of determination (R
2 > 0.85). Among the five tested mathematical models when not using air flow and with an air flow of 0.8 m/s, the Page model fitted better at all the three temperatures, giving R
2 values from 0.9784 to 0.9950. When using an air flow of 0.8, the best model adjustment changed, depending on the temperature. At 40 and 60 °C, the Page model reported the highest values of R
2, keeping X
2, SEE, RMSE and MAE the lowest. However, at 80 °C the Lewis model was found to have a better fitting with the experimental data. These results demonstrated that, depending on the temperature and air flow used when drying the orange by-product by convective drying, the drying kinetics vary. Additionally, the values obtained for all the constants of the five methods are exposed in
Table 3, such as the drying-rate constants (k), the a for the Henderson and Pabis model, the N for the Page model, a and c for the logarithmic model, and a, b and n for the Weibull model. None of these parameters were constant, and exhibited temperature and air-flow dependence in concordance with other authors [
14,
41].
The effective moisture diffusivity (D
eff) was calculated according to the Fick’s second law of diffusion for the three different drying temperatures and air flows for the five mathematical models tested. The obtained values ranged between 10
−5 and 10
−9 m
2/s in concordance with the ranges reported by other authors [
14,
16,
22,
51,
52,
53].
The activation energy (Ea) is the required energy for the initialization of the moisture diffusion from inside to the outside of the sample. The activation energy and the pre-exponential factors for the five studied models at the three different air flows were calculated using the Arrhenius equation from the plot of ln(k) versus 1/T, and the results are exposed in
Table 4. In all cases, the Ea was calculated in the temperature range from 313 to 353 K.
For the orange by-product dried with an air flow of 1.6 m/s, 0.8 m/s or without air flow, the Ea value ranges were 41.98–139.57, 31.16–60.60 and 30.68–55.82, respectively. Those results were in concordance with the data reported in other matrices [
14,
16,
41]. In addition, Afrin et al. [
10] reported for a modified Page model an activation energy of 53.07 kJ/mol when drying orange pomace without air flow in the range of 323–343 K, a value very similar to the one reported here. It is clear that with an air flow of 1.6 m/s, higher activation-energy is necessary, while without airflow, the Ea needed to start the moisture diffusion is lower. In all cases, the Page model gave the highest values of Ea. Comparing the five models, the Lewis and logarithmic models predicted the lowest energy of activation without air flow.
3.2. Effect of Drying on the Phenolic Content Measured by HPLC-MS
The effect of drying orange by-products on the phenolic content has been evaluated. Phenolic compounds were all identified and quantified according to previous research [
54]. The results obtained for the phenolic compounds in the orange by-product treated at the three different temperatures and air-flows are reported in
Table 5.
Regarding the phenolic acids, it can be appreciated that total feruloyl-isocitric acid and caffeoylmalic acid are at the highest concentration without air flow and at 40 °C, demonstrating them to be highly sensitive to high temperatures and oxygen exposure. In contrast, total feruloyl-galactaric-acid content increased when air flow was used. In general, at the three temperatures, the content of ferulic-acid derivatives was the highest at air flow 1.6 m/s and the lowest at air flow 0.8 m/s. In contrast, sinapic acid-O-glucuronide was higher at 0.8 m/s when drying the orange by-products at 40 and 80 °C. However, the highest concentration of this compound was found when drying at 60 °C with 1.6 m/s air flow. Therefore, the total content of phenolic acids was 3.5, 6.8 and 7.7% higher at 40, 60 and 80 °C, respectively, when drying at 1.6 m/s compared with without air flow. Pectolinarigenin is the major flavonoid found in these samples of orange by-product, and it is a flavone aglycone known for a series of biological properties including anti-inflammatory, antidiabetic and especially anticancer, against breast cancer [
55]. Therefore, for pectolinaringenin and for total apigenin derivatives it has been seen that at 40 and 60 °C the content increased when increasing the air flow but at 80 °C it was the opposite, and the content decreased when increasing the air flow. It is due to the fact that at moderate temperature when introducing air, the time needed for drying is reduced, so the exposure to temperature is lower. However, in contrast, when increasing the temperature up to 80 °C and including air flow, although the time is even lower, the content degrades the most. A different tendency was appreciated for total rutin and total isorhamnetin-3-O-rutinoside. In this case the concentrations were higher in orange by-product treated without air circulation, demonstrating them to be more oxygen-sensitive. Regarding flavanones, the highest recovery was found when drying at 60 °C and 1.6 m/s of air flow and, in fact, the highest concentration of hesperidin, naringenin and naringin hydrate was achieved. Those compounds which have especially been extensively demonstrated to have several bioactivities in human health are those such as anti-cancer in lung and breast cancer [
56,
57,
58], antidiabetic [
59], anti-inflammatory [
60], cardioprotective and anti-chloresterolemic [
61,
62,
63,
64,
65,
66,
67,
68], among others. In contrast, there were no significative changes in the content of hesperidin and narirutin at 80 °C, despite the different air flows. Regarding the total content of flavonoids, it was appreciated that there was a content of 6.2, 7.9 and 6.5% higher when drying at 40, 60 and 80 °C, respectively, at 1.6 m/s compared with without air flow. Therefore, in general, at all the temperatures tested it can be appreciated that the phenolic-compound content is higher when increasing the air flow, demonstrating that it has a huge impact on the phenolic-compound content. This is because when the air circulation is introduced, the time needed to achieve the final moisture is also reduced and, in consequence, the time of thermal exposure is lower. All these results are also statistically confirmed. A significant moderately strong negative-correlation has been found between the total phenolic acids, total flavonoids, and total phenolic compounds with temperature (r = −0.6222, −0.5219 and −0.6172, respectively). In contrast, a moderately strong positive-correlation of the phenolic compounds was found with the air flow being strongest, in the case of total flavonoids (r = 0.6679) and specifically total flavanones (r = 0.5832) and narirutin (r = 0.7190). There is a clear tendency of an increment in the total phenolic-compound content when increasing the air flow. However, although this tendency is still taking place when drying at 80 °C, there is a higher reduction in the phenolic content, mainly attributable to the case-hardening process previously reported by other authors in other matrices. In contrast to us, Chen et al. (2011) [
69] reported achieving higher amounts of phenolic compounds such as naringin, hesperidin, kaempferol and rutin in a linear way, when increasing the temperature from 50 to 100 °C for drying orange-peel extracts. Despite this, the results obtained here for these compounds are in the same range of magnitude.
3.3. Effect of Drying on the Vitamin C Content
The content of ascorbic acid in the orange by-products dried at the three different temperatures and air flows was measured using HPLC-UV/VIS, and the results are shown in
Table 6. Briefly, the high correlation between ascorbic-acid content and the total content of vitamin C (r = 0.9656), confirmed that AA was the main compound that constitutes vitamin C.
The highest recovery was obtained when orange by-products were dried at 40 °C and with an air flow of 1.6 m/s. Indeed, a significant (
p < 0.05) negative, strong correlation between the content of vitamin C and the temperature (r = −0.6790) was detected. In contrast, a significative (
p < 0.1) positive, moderate correlation was found between the total vitamin C and the air flow (r = 0.5215). Therefore, it is revealed that there is a lower reduction of the content of vitamin C when increasing the air flow, but at the lower temperature. The vitamin C content of the orange by-product, and especially the ascorbic acid as the major form, has been demonstrated to be highly sensitive to the exposure to temperature with the time that can be reduced by using air circulation being the factor that determines the avoidance of the biggest degradations. Within this context, there was a reduction of approximately 13.5% when drying at 80 °C, or 6% when drying at 60 °C compared with drying at 40 °C. Similar results were reported by Afrin et al. [
10], who also had an ascorbic-acid reduction of 7.6% when drying orange pomace at 70 °C, compared with drying at 50 °C. This tendency has been also seen in other fruit and vegetables such as tomatoes, where a reduction of around 30% in the ascorbic acid content was reported when drying at 70 °C, compared with drying at 50 °C [
70]. In addition, when a temperature of 60 °C with air flow of 1.6 m/s was applied, the highest ascorbic/dehydroascorbic ratio was observed, with no significative differences with the ratio observed at 40 °C and 0.8 m/s air flow. Through these trials, it can be confirmed that the oxygen exposure with the air flow of the samples during drying entails a higher oxidation of ascorbic acid to dehydroascorbic acid but no decrease in its total vitamin C content.
3.4. Effect of Drying on the Antioxidant Activity
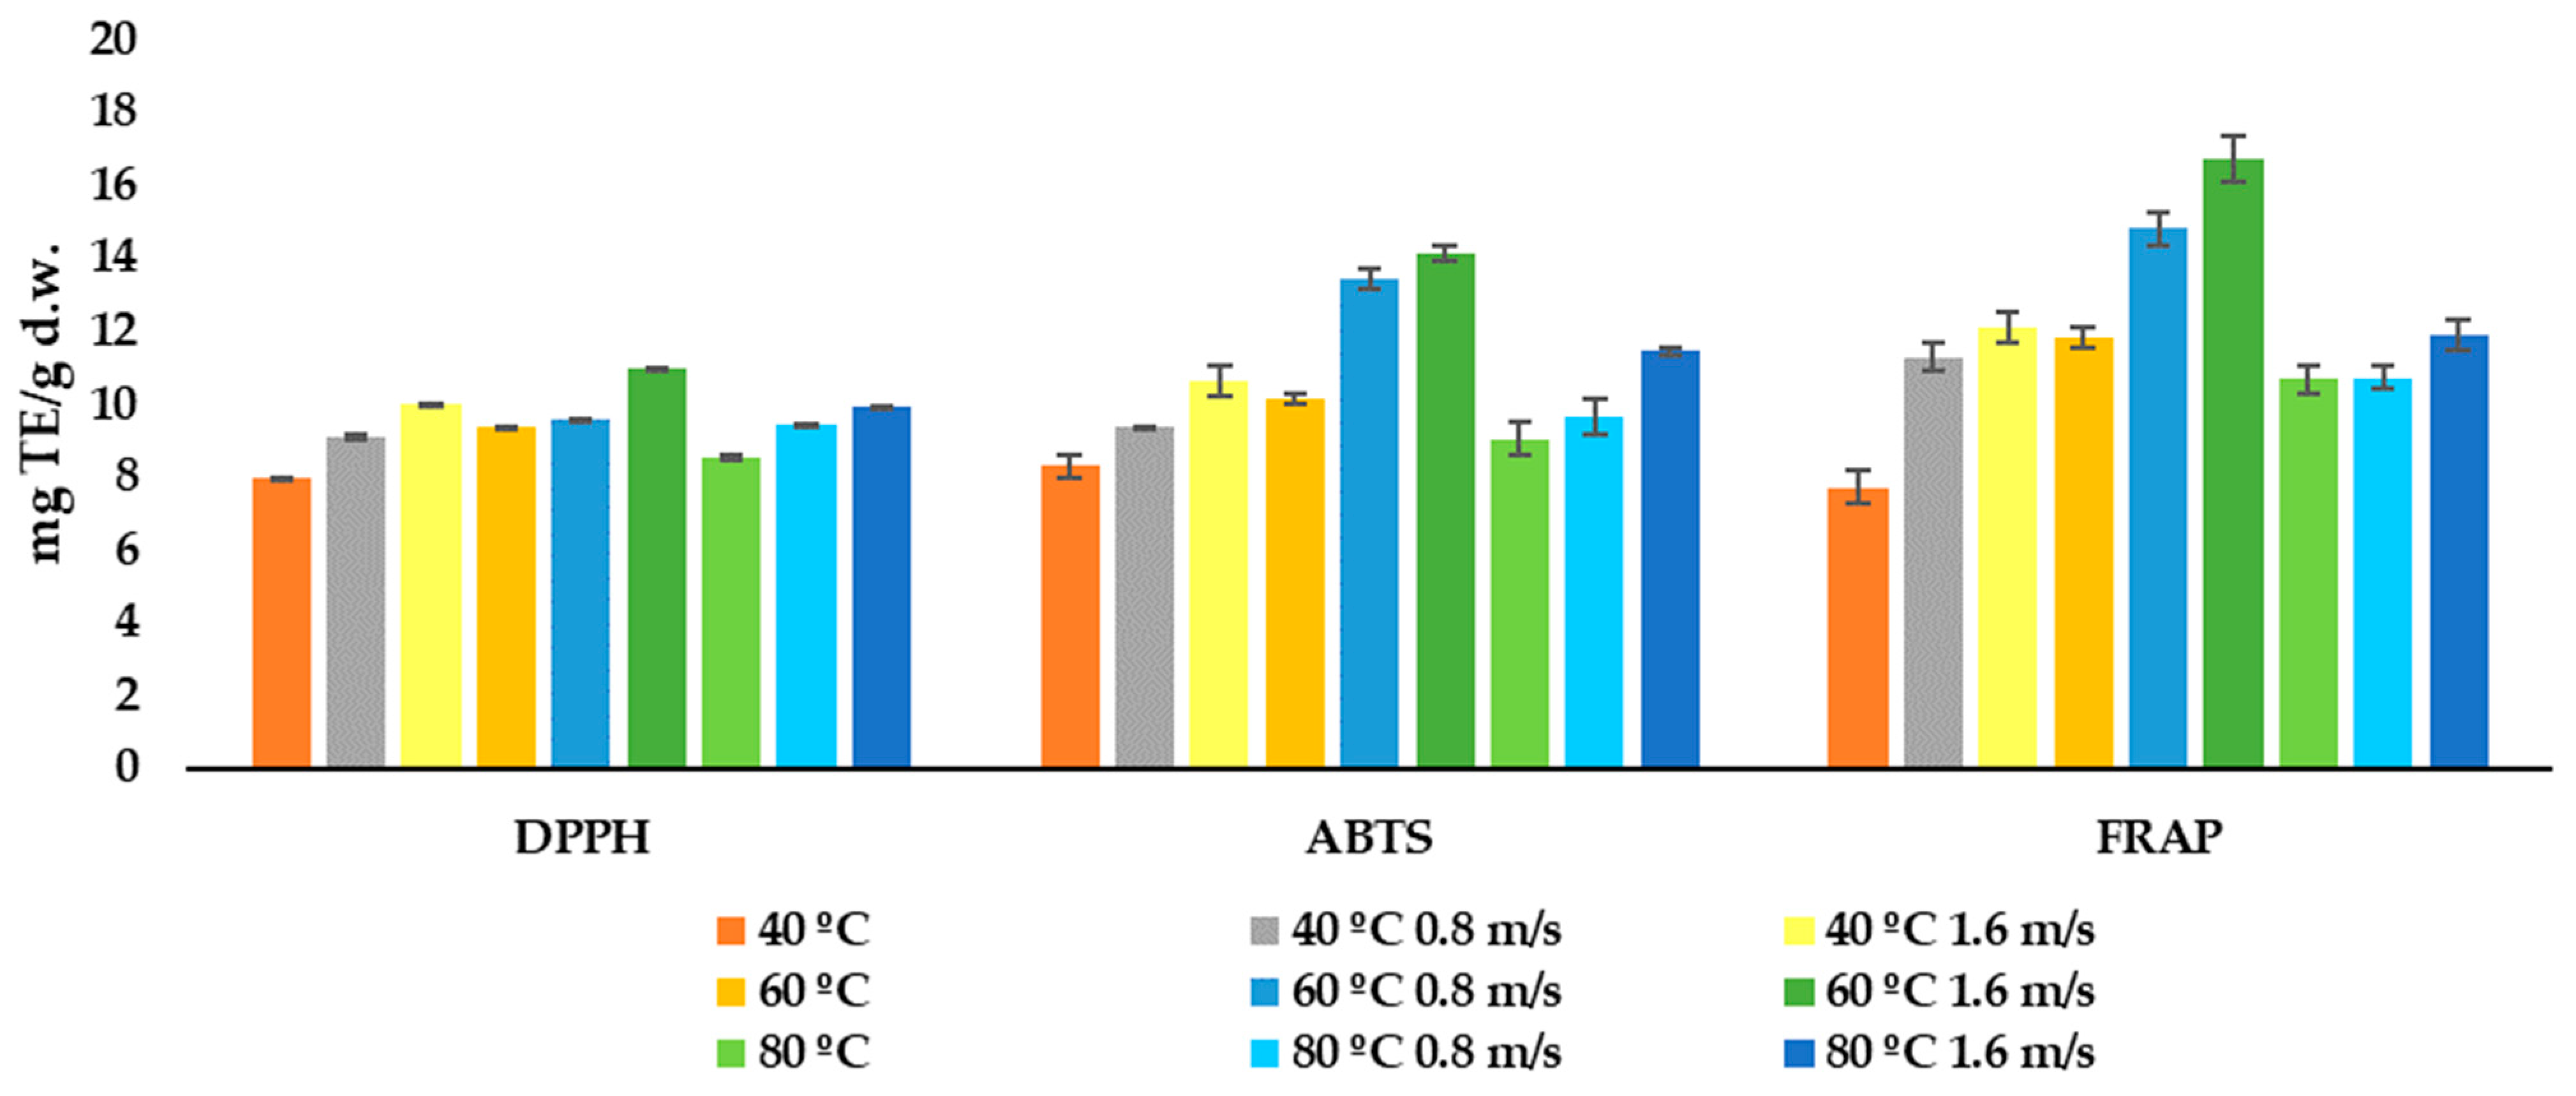
The antioxidant activity of the orange by-products dried at the three different temperatures and air flows was measured using three different methods, DPPH, ABTS and FRAP, and the results are shown in
Figure 3. The result ranges were 7.97–10.99, 8.27–14.13 and 7.70–16.69 mg TE/g d.w. for the DPPH, ABTS and FRAP assays, respectively. All methods showed a significant (
p < 0.05) strong, positive correlation between each other (DPPH vs. ABTS r = 0.8357; DPPH vs. FRAP r = 0.8643; ABTS vs. FRAP r = 0.9512).
All the three methods had a strong positive correlation (
p < 0.05), with the total content of flavonoids being the strongest in the case of DPPH. Going further, this positive correlation is the highest for the total flavanones, and especially for hesperidin and narirutin. Moreover, when fixing a significance level of
p < 0.1, a moderately strong, positive correlation between the total phenolic acid content and the antioxidant-activity results for ABTS and FRAP was found. For the three tested methods at the three temperatures, it can be appreciated that the highest antioxidant activity was obtained for the orange by-product dried with an air flow of 1.6 m/s. This is statistically confirmed by a correlation between the antioxidant activity measured by the three methods and the air flow (r > 0.5921). Moreover, a significant (
p < 0.1) moderately negative correlation with time was found for the DPPH (r = −0.5958), ABTS (r = −0.5539) and FRAP (r = −0.6156) assays. These data agreed with those of Deng et al. [
9], which stated that drying the orange peel at a temperature between 50 and 70 °C achieved the highest antioxidant recoveries, measured by DPPH and FRAP at 65 °C. In addition, Chen et al. [
53] reported the highest radical scavenging activity when orange peel extracts were dried at 100 °C.


 ,
, 


