Comparison of Sensory Profiling by Descriptive Analysis, Free-Choice Profiling, and Polarized Sensory Positioning on Bottled Water
Abstract
1. Introduction
2. Materials and Methods
2.1. Sample and Sample Preparation
2.2. Chemical Analysis of Samples
2.3. Procedures
2.3.1. Descriptive Analysis
2.3.2. Free-Choice Profiling
2.3.3. Polarized Sensory Positioning
2.4. Statistical Analysis
3. Results
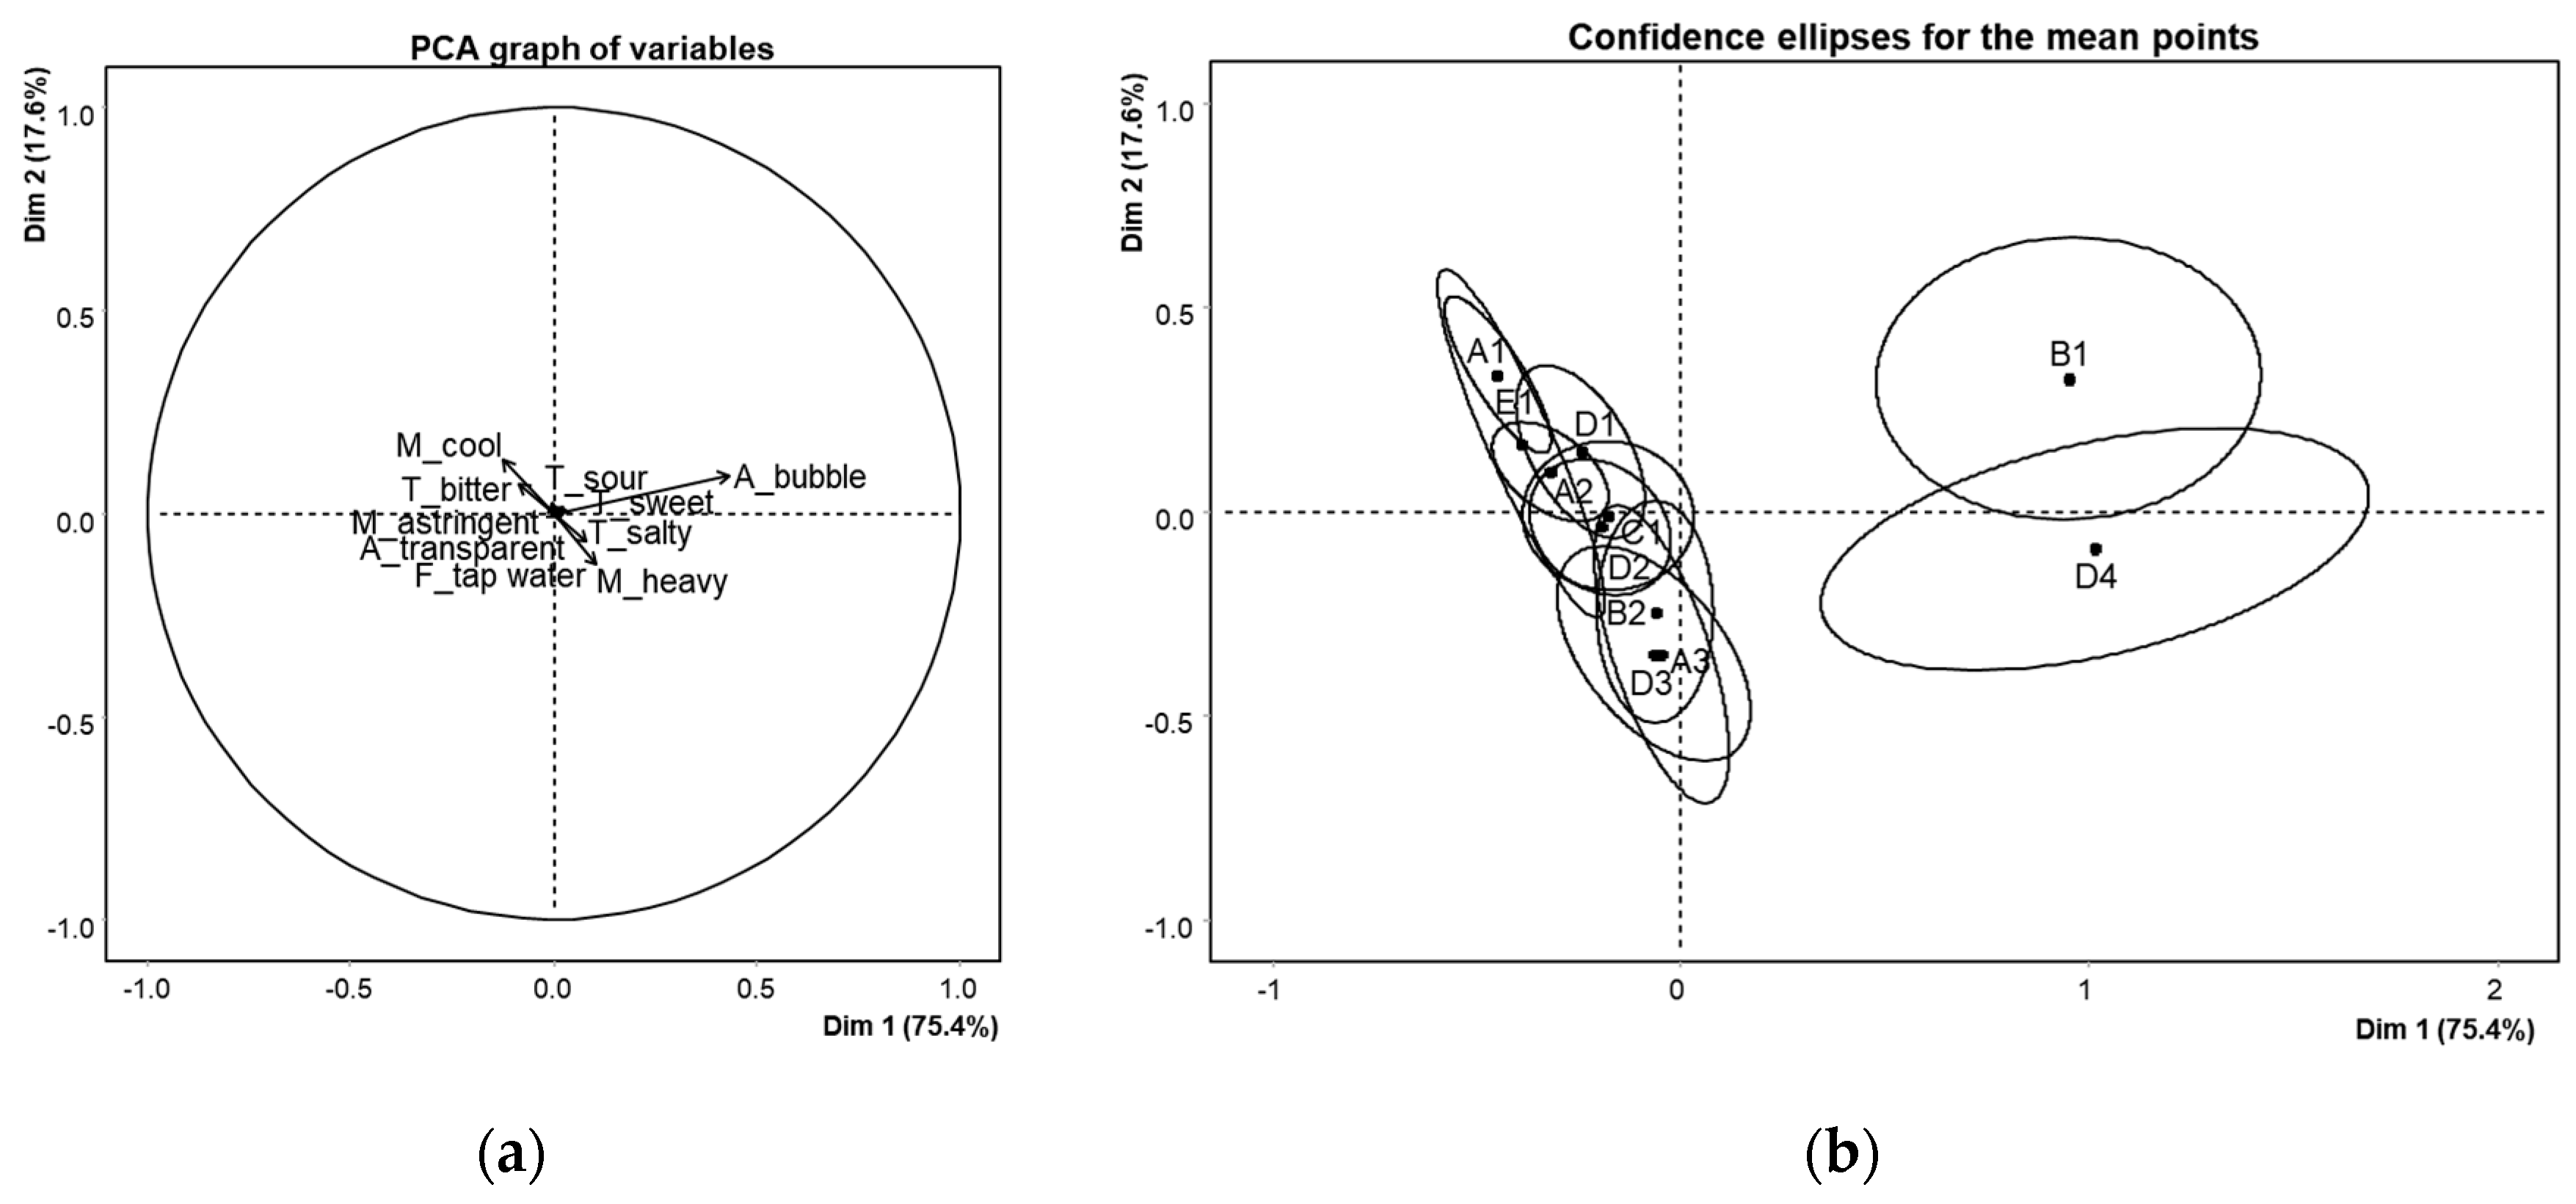
3.1. DA Results
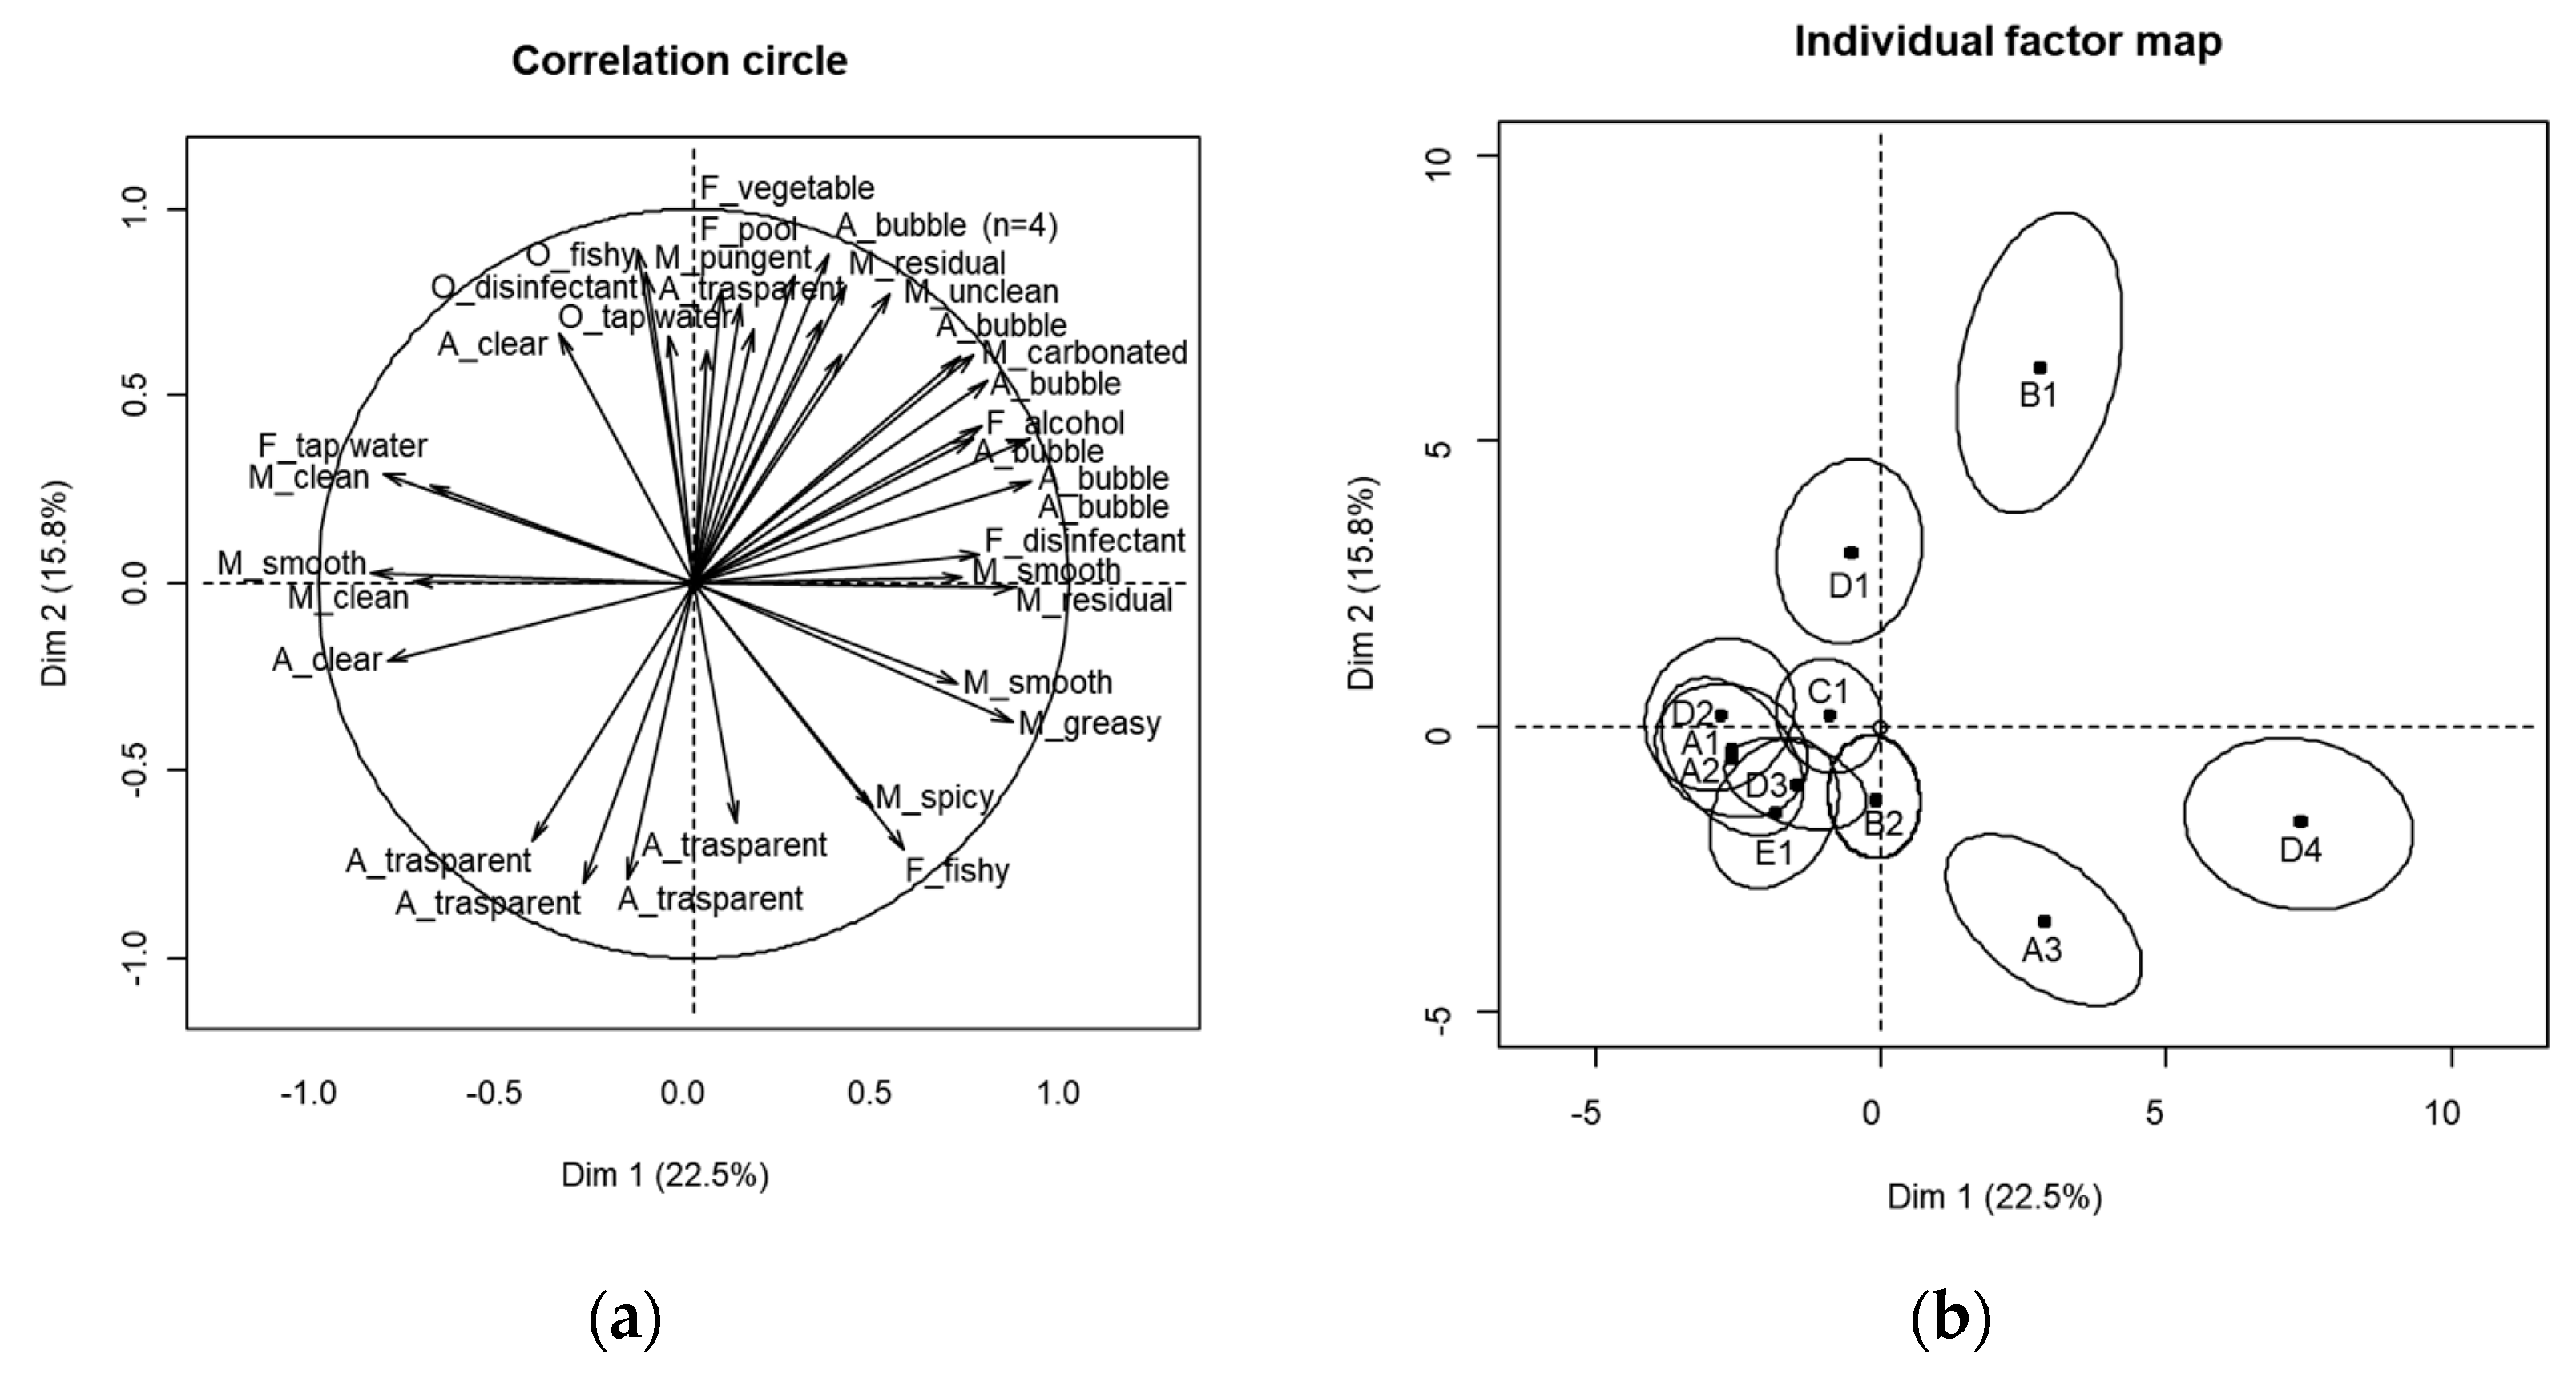
3.2. FCP Results
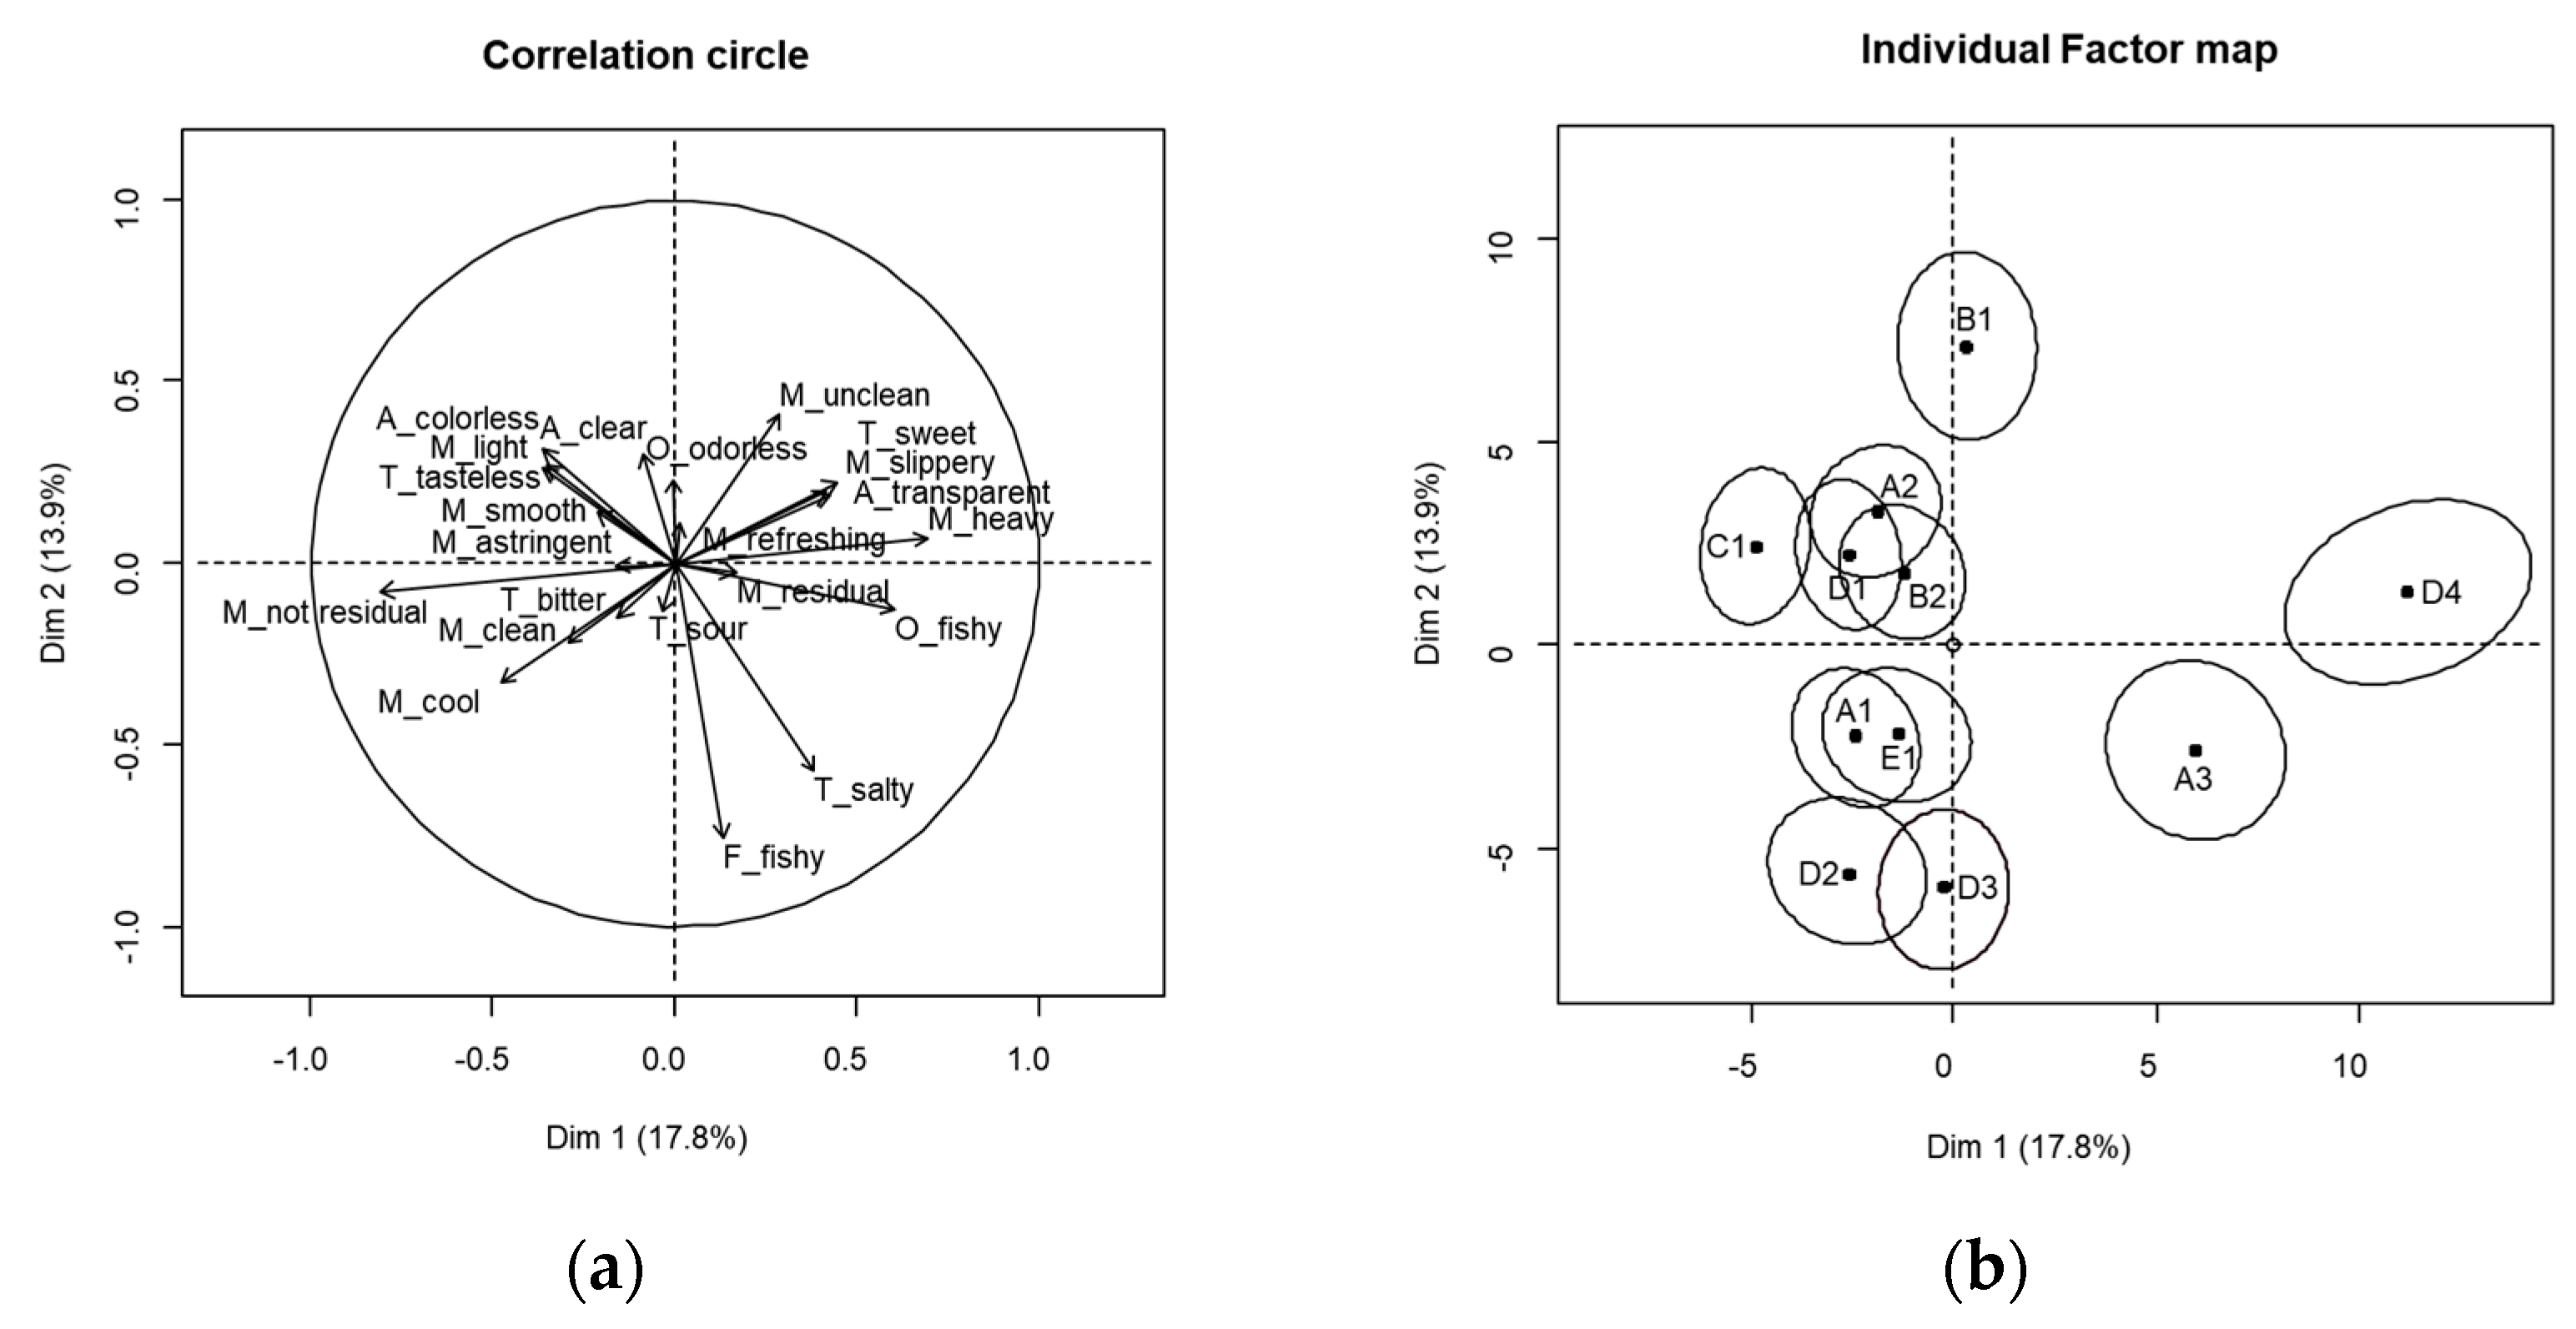
3.3. PSP Results
3.4. Comparison of Three Methodologies
4. Discussion
5. Conclusions
Author Contributions
Funding
Institutional Review Board Statement
Informed Consent Statement
Data Availability Statement
Conflicts of Interest
References
- Ruiz-Capillas, C.; Herrero, A.M.; Pintado, T.; Delgado-Pando, G. Sensory analysis and consumer research in new meat products development. Foods 2021, 10, 429. [Google Scholar] [CrossRef] [PubMed]
- Esmerino, E.A.; Tavares Filho, E.R.; Carr, B.T.; Ferraz, J.P.; Silva, H.L.A.; Pinto, L.P.F.; Freitas, M.Q.; Cruz, A.G.; Bolini, H.M.A. Consumer-based product characterization using pivot profile, projective mapping and check-all-that-apply (CATA): A comparative case with Greek yogurt samples. Food Res. Int. 2017, 99, 375–384. [Google Scholar] [CrossRef] [PubMed]
- Jantzi, H.; Hayward, L.; Barton, A.; Richardson, C.D.; McSweeny, M.B. Investigating the effect of extrinsic cues on consumers’ evaluation of red wine using a projective mapping task. J. Sens. Stud. 2020, 35, e12568. [Google Scholar] [CrossRef]
- Wang, S.; Ng, K.H.; Yee, K.H.; Tang, Y.; Meng, R.; He, W. Comparison of pivot profile, CATA, and pivot-CATA for the sensory profiling of instant black coffee. Food Qual. Prefer. 2023, 104858, in press. [Google Scholar] [CrossRef]
- Harwood, W.S.; McLean, K.G.; Ennis, J.M.; Ennis, D.M.; Drake, M. Comparison of preference mapping with projective mapping for characterizing consumer perception of brewed black coffees. J. Sens. Stud. 2020, 35, e12563. [Google Scholar] [CrossRef]
- Liu, J.; Bredie, W.L.P.; Sherman, E.; Harbertson, J.F.; Heymann, H. Comparison of rapid descriptive sensory methodologies: Free-choice profiling, flash profile and modified flash profile. Food Res. Int. 2018, 106, 892–900. [Google Scholar] [CrossRef]
- Teillet, E.; Schlich, P.; Urbano, C.; Cordelle, S.; Guichard, E. Sensory methodologies and the taste of water. Food Qual. Prefer. 2010, 21, 967–976. [Google Scholar] [CrossRef]
- Fleming, E.E.; Ziegler, G.R.; Hayes, J.E. Check-all-that-apply (CATA), sorting, and polarized sensory positioning (PSP) with astringent stimuli. Food Qual. Prefer. 2015, 45, 41–49. [Google Scholar] [CrossRef]
- Moelich, E.I.; Muller, M.; Kidd, M.; Van der Rijst, M.; Næs, T.; Joubert, E. PSP with trained assessors as alternative for descriptive analysis of a product with a complex sensory profile. Food Qual. Prefer. 2023, 103, 104704. [Google Scholar] [CrossRef]
- Ares, G.; de Saldamando, L.; Vidal, L.; Antúnez, L.; Giménez, A.; Varela, P. Polarized projective mapping: Comparison with polarized sensory positioning approaches. Food Qual. Prefer. 2013, 28, 510–518. [Google Scholar] [CrossRef]
- Aparicio, J.P.; Ángeles Toledano Medina, M.A.T.; Rosales, V.L. Descriptive sensory analysis in different classes of orange juice by a robust free-choice profile method. Anal. Chim. Acta 2007, 595, 238–247. [Google Scholar] [CrossRef]
- Parolari, G. Taste quality of Italian raw ham in a free-choice profile study. Food Qual. Prefer. 1994, 5, 129–133. [Google Scholar] [CrossRef]
- Guàrdia, M.D.; Aguiar, A.P.S.; Claret, A.; Arnau, J.; Guerrero, L. Sensory characterization of dry-cured ham using free-choice profiling. Food Qual. Prefer. 2010, 21, 148–155. [Google Scholar] [CrossRef]
- Williams, A.A.; Arnold, G.M. A comparison of the aromas of six coffees characterised by conventional profiling, free-choice profiling and similarity scaling methods. J. Sci. Food Agri. 1985, 36, 204–214. [Google Scholar] [CrossRef]
- Donaldson, B.R.; Bamforth, C.W.; Heymann, H. Sensory descriptive analysis and free-choice profiling of thirteen hop varieties as whole cones and after dry hopping of beer. J. Am. Soc. Brew. Chem. 2012, 70, 176–181. [Google Scholar] [CrossRef]
- Lazo, O.; Claret, A.; Guerrero, L. A comparison of two methods for generating descriptive attributes with trained assessors: Check-all-that-apply (CATA) vs. free choice profiling (FCP). J. Sens. Stud. 2016, 31, 163–176. [Google Scholar] [CrossRef]
- Stone, H.; Sidel, J.L.; Oliver, S.; Woolsey, A.; Singleton, R.C. Sensory evaluation by quantitative descriptive analysis. Food Technol. 1974, 28, 24–33. [Google Scholar]
- Ministry of Food and Drug Safety. 8.2.2.1 Analysis of mineral contents. In Food Code; Ministry of Food and Drug Safety: Osong-gun, Republic of Korea, 2022. [Google Scholar]
- Williams, E.J. Experimental designs balanced for the estimation of residual effects of treatments. Aust. J. Chem. 1949, 2, 149–168. [Google Scholar] [CrossRef]
- Lee, S.M.; Guinard, J.; Kim, K.O. Exploration of cross-cultural perception of spicy chicken made using hot sauces with differ-ent degrees of flavor familiarity in Korean and US consumers. J. Korean Soc. Food Cult. 2017, 32, 1–9. [Google Scholar] [CrossRef]
- Symoneaux, R.; Galmarini, M.V.; Mehinagic, E. Comment analysis of consumer’s likes and dislikes as an alternative tool to preference mapping. A case study on apples. Food Qual. Prefer. 2012, 24, 59–66. [Google Scholar] [CrossRef]
- Schlich, P. Defining and validating assessor compromises about product distances and attribute correlations. In Multivariate Analysis of Data in Sensory Science; Næs, T., Risvik, E., Eds.; Elsevier Science: New York, NY, USA, 1996; pp. 259–306. [Google Scholar]
- Teillet, E.; Urbano, C.; Cordelle, S.; Schlich, P. Consumer perception and preference of bottled and tap water. J. Sens. Stud. 2010, 25, 463–480. [Google Scholar] [CrossRef]
- Ares, G.; Giménez, A.; Barreiro, C.; Gámbaro, A. Use of an open-ended question to identify drivers of liking of milk desserts. Comparison with preference mapping techniques. Food Qual. Prefer. 2010, 21, 286–294. [Google Scholar] [CrossRef]
- Ares, G.; Varela, P. Trained vs. consumer panels for analytical testing: Fueling a long lasting debate in the field. Food Qual. Prefer. 2017, 61, 79–86. [Google Scholar] [CrossRef]
- Varela, P.; Ares, G. Sensory profiling, the blurred line between sensory and consumer science. A review of novel methods for product characterization. Food Res. Int. 2012, 48, 893–908. [Google Scholar] [CrossRef]
- Lawless, H.T.; Malone, G.J. Comparison of rating scales: Sensitivity, replicates and relative measurement. J. Sens. Stud. 1986, 1, 155–174. [Google Scholar] [CrossRef]


| Sample Code | Ingredients | Manufacturing Location | Mineral Contents (mg/L) 1 | Hardness (mg/L) 2 | ||||
|---|---|---|---|---|---|---|---|---|
| Ca2+ | Na+ | K+ | Mg2+ | F− | ||||
| A1 | Underground bedrock water | Jeju-si, Republic of Korea | 3.5 | 6.1 | 2.7 | 2.6 | 0.0 | 19.8 |
| A2 | Underground bedrock water | Cheongdo-gun, Republic of Korea | 21.1 | 14.7 | 0.7 | 5.8 | 0.3 | 77.1 |
| A3 | Underground bedrock water | Cheonan-si, Republic of Korea | 49.5 | 11.2 | 1.7 | 10.6 | 0.3 | 167.5 |
| B1 | Deep sea drinking water | Sokcho-si, Republic of Korea | 6.1 | 6.1 | 5.6 | 18.1 | 0.0 | 89.0 |
| B2 | Deep sea drinking water | Goseong-gun, Republic of Korea | 5.3 | 7.4 | 5.4 | 14.9 | 0.0 | 74.2 |
| C1 | Purified water, calcium hydrogen carbonate | Jeju-si, Republic of Korea | 4.4 | 5.6 | 37.6 | 3.0 | 0.0 | 22.3 |
| D1 | Underground bedrock water | Jilin, China | 4.3 | 8.4 | 3.2 | 3.9 | 0.7 | 26.4 |
| D2 | Underground bedrock water | Auvergne, France | 12.3 | 11.9 | 6.2 | 8.2 | 0.2 | 62.9 |
| D3 | Underground bedrock water | Viti Levu Yaqara, Fiji | 17.6 | 15.2 | 4.3 | 12.9 | 0.3 | 98.4 |
| D4 | Underground glacial deposits water | Evian, France | 76.8 | 6.7 | 1.0 | 24.7 | 0.0 | 295.0 |
| E1 | Filtered tap water | Jeonju-si, Republic of Korea | 10.8 | 8.8 | 2.1 | 2.3 | 0.1 | 35.7 |
| Descriptors | Definitions | Reference Materials | Intensity of Reference |
|---|---|---|---|
| Appearance | |||
| Transparent | Degree of clearness | Tap water | 15.0 |
| Bubble | Amount of air bubbles in the inner surface of cup | Picture of sparkling water | 7.1 |
| Taste/Flavor | |||
| Sweet | Fundamental sweet taste in sucrose solution | 0.5% (w/w) sucrose solution (CJ Cheiljedang Co., Seoul, Republic of Korea) | 3.4 |
| Sour | Fundamental sour taste in citric acid solution | 0.01% (w/w) citric acid solution (Edentown F&B, Incheon, Republic of Korea) | 3.3 |
| Salty | Fundamental salt taste in NaCl solution | 0.1% (w/w) NaCl solution (Bon salt; Hanju Co., Ulsan, Republic of Korea) | 3.0 |
| Bitter | Fundamental bitter taste in caffeine solution | 0.02% (w/w) caffeine solution (Caffeine; Sigma-Aldrich, St. Louis, MO, USA) | 4.7 |
| Tap water flavor | Tap water flavor related to metallic and disinfectant flavor | 20% (w/w) of tap water in filtered water | 5.3 |
| Mouthfeel | |||
| Astringent | Tongue-shrinking, unclean feeling | 0.02% (w/w) alum solution (Alum; McCormick & Co., Inc., Baltimore, MD, USA) | 4.8 |
| Cool | Cool and refreshing feeling | Filtered water (13 °C) | 8.2 |
| Heavy feeling | Smooth and heavy feeling related to mouth coating | 0.1% (w/w) viscosity controlling agents (Visco-up, Rheosfood, Goyang-si, Republic of Korea; made by 500 rpm for 5 min) | 6.6 |
| Samples | Appearance | Taste/Flavor | Mouthfeel | |||||||
|---|---|---|---|---|---|---|---|---|---|---|
| Clear | Bubble *** 1 | Sweet | Sour | Salty *** | Bitter | Tap Water Flavor | Astringent | Cool | Heavy Feeling ** | |
| A1 | 15.0 ± 0.0 | 0.4 ± 0.3 b2 | 1.5 ± 0.6 | 0.9 ± 0.5 | 0.7 ± 0.3 b | 1.8 ± 0.8 | 0.5 ± 0.4 | 1.7 ± 0.8 | 3.6 ± 1.3 | 1.0 ± 0.8 bc |
| A2 | 15.0 ± 0.1 | 0.4 ± 0.3 b | 1.4 ± 0.5 | 0.9 ± 0.4 | 0.7 ± 0.4 b | 1.5 ± 0.7 | 0.5 ± 0.4 | 1.7 ± 0.7 | 3.4 ± 1.5 | 1.0 ± 0.6 abc |
| A3 | 15.0 ± 0.1 | 0.4 ± 0.4 b | 1.3 ± 0.4 | 1.0 ± 0.4 | 0.9 ± 0.4 ab | 1.4 ± 0.5 | 0.6 ± 0.4 | 1.6 ± 0.7 | 3.1 ± 1.7 | 1.4 ± 0.9 ab |
| B1 | 15.0 ± 0.1 | 1.6 ± 1.5 a | 1.5 ± 0.5 | 1.0 ± 0.5 | 0.8 ± 0.4 b | 1.5 ± 0.5 | 0.6 ± 0.5 | 1.7 ± 0.6 | 3.2 ± 1.6 | 1.2 ± 0.8 abc |
| B2 | 15.0 ± 0.0 | 0.5 ± 0.4 b | 1.4 ± 0.5 | 0.9 ± 0.4 | 0.9 ± 0.5 b | 1.5 ± 0.6 | 0.7 ± 0.5 | 1.7 ± 0.7 | 3.1 ± 1.6 | 1.3 ± 0.7 abc |
| C1 | 15.0 ± 0.0 | 0.5 ± 0.4 b | 1.4 ± 0.6 | 0.9 ± 0.5 | 0.8 ± 0.4 b | 1.7 ± 0.7 | 0.7 ± 0.6 | 1.7 ± 0.7 | 3.2 ± 1.5 | 1.2 ± 0.6 abc |
| D1 | 15.0 ± 0.1 | 0.5 ± 0.4 b | 1.4 ± 0.6 | 0.9 ± 0.5 | 0.7 ± 0.4 b | 1.7 ± 0.7 | 0.6 ± 0.4 | 1.6 ± 0.7 | 3.4 ± 1.5 | 1.1 ± 0.6 abc |
| D2 | 15.0 ± 0.0 | 0.4 ± 0.4 b | 1.4 ± 0.6 | 0.8 ± 0.4 | 0.8 ± 0.5 b | 1.4 ± 0.7 | 0.5 ± 0.4 | 1.7 ± 0.6 | 3.3 ± 1.5 | 1.2 ± 0.7 abc |
| D3 | 15.0 ± 0.1 | 0.4 ± 0.4 b | 1.5 ± 0.6 | 0.8 ± 0.4 | 0.9 ± 0.4 ab | 1.5 ± 0.6 | 0.5 ± 0.4 | 1.6 ± 0.6 | 3.0 ± 1.4 | 1.4 ± 0.7 abc |
| D4 | 15.0 ± 0.1 | 1.5 ± 1.5 a | 1.5 ± 0.6 | 1.0 ± 0.5 | 1.1 ± 0.5 a | 1.4 ± 0.5 | 0.5 ± 0.4 | 1.6 ± 0.6 | 2.9 ± 1.5 | 1.4 ± 0.8 a |
| E1 | 15.0 ± 0.0 | 0.3 ± 0.3 b | 1.3 ± 0.6 | 1.0 ± 0.5 | 0.7 ± 0.3 b | 1.7 ± 0.7 | 0.5 ± 0.4 | 1.8 ± 0.7 | 3.3 ± 1.5 | 0.9 ± 0.4 c |
| DA | FCP | PSP | |
|---|---|---|---|
| DA | 1.00 | 0.74 | 0.65 |
| FCP | 0.74 | 1.00 | 0.94 |
| PSP | 0.65 | 0.94 | 1.00 |
| MFA 1 | 0.82 | 0.98 | 0.96 |
Disclaimer/Publisher’s Note: The statements, opinions and data contained in all publications are solely those of the individual author(s) and contributor(s) and not of MDPI and/or the editor(s). MDPI and/or the editor(s) disclaim responsibility for any injury to people or property resulting from any ideas, methods, instructions or products referred to in the content. |
© 2023 by the authors. Licensee MDPI, Basel, Switzerland. This article is an open access article distributed under the terms and conditions of the Creative Commons Attribution (CC BY) license (https://creativecommons.org/licenses/by/4.0/).
Share and Cite
Heo, J.; Kim, S.S.; Kim, M.-R.; Kwak, H.S. Comparison of Sensory Profiling by Descriptive Analysis, Free-Choice Profiling, and Polarized Sensory Positioning on Bottled Water. Foods 2023, 12, 1579. https://doi.org/10.3390/foods12081579
Heo J, Kim SS, Kim M-R, Kwak HS. Comparison of Sensory Profiling by Descriptive Analysis, Free-Choice Profiling, and Polarized Sensory Positioning on Bottled Water. Foods. 2023; 12(8):1579. https://doi.org/10.3390/foods12081579
Chicago/Turabian StyleHeo, JeongAe, Sang Sook Kim, Mi-Ran Kim, and Han Sub Kwak. 2023. "Comparison of Sensory Profiling by Descriptive Analysis, Free-Choice Profiling, and Polarized Sensory Positioning on Bottled Water" Foods 12, no. 8: 1579. https://doi.org/10.3390/foods12081579
APA StyleHeo, J., Kim, S. S., Kim, M.-R., & Kwak, H. S. (2023). Comparison of Sensory Profiling by Descriptive Analysis, Free-Choice Profiling, and Polarized Sensory Positioning on Bottled Water. Foods, 12(8), 1579. https://doi.org/10.3390/foods12081579


