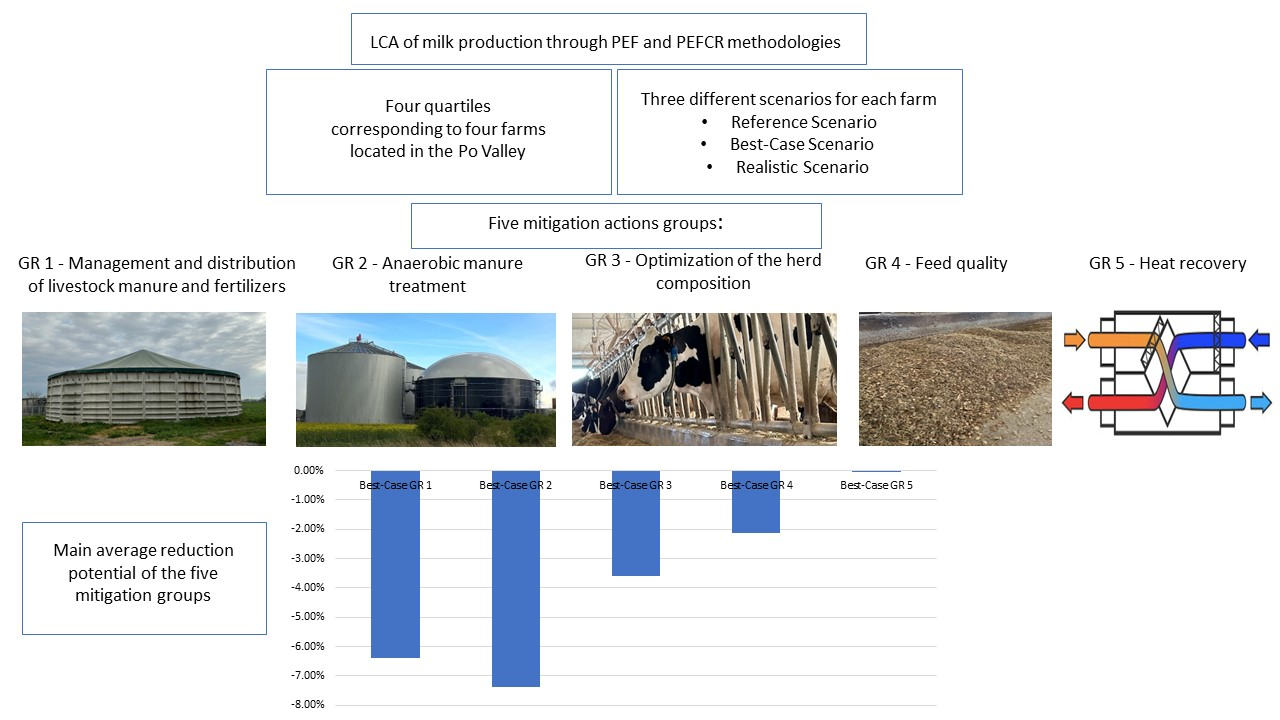
3.3. Mitigation Actions Results for the Four Quartiles Farms
The four farms in this study were designated with Q1, Q2, Q3, and Q4, representing the first, second, third, and fourth quartiles, respectively. For each farm, three scenarios are presented: the reference scenario, the best-case Scenarios applied to each of the five groups of mitigation measures, and the realistic scenario.
Figure 2 reports the results per each representative farm for the different scenarios as a single total score expressed in Pt. Following the farmers’ responses, the reduction in emissions and, consequently, in environmental impact due to adopting mitigation actions, were quantified by forming the realistic scenario.
Table S1 (see Supplementary Materials) reports the numeric weighted results presented in
Figure 2.
Table 4,
Table 5,
Table 6,
Table 7 and
Table 8 present in percentage for each mitigation group, the effect of the best-case scenario on each impact category, and the total impact compared to the reference scenario results.
Table 4 also displays the results for the realistic scenario.
The disparity in the possible reduction among the four quartiles is attributed to the reference farms’ different management systems. For quartile Q1, the mitigation strategies GR 3 and GR 5 were not applicable and considered to be already optimal for this farm.
Overall, as shown in
Table 4,
Table 5,
Table 6 and
Table 7, manure management emissions had the greatest potential for a decrease in this context. At the same time, the mainly affected impact was CC for all three scenarios, except for the best-case scenario GR 2, as noticeable from
Figure 2.
The application of the mitigation GR 1 decreased for the four quartiles the impacts of manure management emissions, barn management emissions, feed purchased, except for Q4, and in-farm feed only for Q3 and Q4, diminishing all the environmental impacts considered by 6–7% in total (
Figure 2). Through the introduction of GR 1, manure management emissions process showed a similar potential reduction in all the four quartiles, ranging between 24–30%, a lesser impact compared to the reference scenario. These results are also confirmed by Sajeev et al., 2018 [
42], who reported reductions in GHG and ammonia (NH
3) emissions along the entire manure management chain. In our conditions, the mitigation strategy lowered the potential impact of A and TE between 46–54% (
Table 4) as a consequence of the NH
3 reduction due to the best agriculture practices for manure spreading [
36] and manure storage [
43], nitrogen fertilizers spreading, and use of slow-release fertilizers for urea [
39]. Similarly, the emissions from barn management could be decreased by 17–19%, reducing the potential impact of POF, referred to the emission of particulate matter (<2.5 µm) and non-methane volatile organic compounds (NMVOC) [
2]. This mitigation action reduced market dependence on feed purchased and raw materials due to a hypothetical increase in self-produced crop yields. This reduction of 2–8% was not observed for the Q4 farm, for which raw material and feed purchase quantities remained unchanged, as did the resulting emissions. The application of GR 1 for the purchase of feed reduced all impact categories considered in this context by 5–29% (
Table 4), as manure management practices (storage, spreading of manure and fertilizer on the soil) reduce NH
3 emissions, as presented above, leading to a potential increase in crop yields due to increased nitrogen availability to the field. In this regard, Sefeedpari et al., 2019 [
44], in a technical, environmental, and economic study on manure management, state that good agricultural practices of this resource condition are related to nitrogen availability of crops. Given the high impact associated with the purchase of feed, particularly from geographic areas affected by land use change [
19], GR 1 actions and proper management of the farm’s raw materials make it possible to reduce the share of feed purchased on the market by enhancing self-production. As Gaudino et al., 2018 [
45] pointed out, this approach represents a good opportunity to increase feed protein self-sufficiency. However, the increase in the in-farm feed also led to an increase in emissions from crop production for those farms, particularly Q1 and Q2, that did not have high yields. In fact, for Q1 and Q2, the impact of WRDs increased by 17–8%, respectively (
Table 4), as higher amounts of water for irrigation were justified to achieve higher yields in proportion to the lower amount of feed purchased.
Farmers would be more eager to apply GR 1 as mitigation action because it has a high potential for environmental impact reduction, even if it involves investments to buy storage covers and equipment to be used as injectors for fertilizer spreading.
On-farm anaerobic digestion of manure effectively reduces greenhouse gas emissions and non-renewable energy consumption [
46]. In this context, indeed, the mitigation strategy of GR 2 led to the highest environmental impact reduction for all the quartiles, as mentioned above, with a decrease of 7–9% (
Figure 2). These results are distinguished in the macro area of manure management emissions by reducing the total impact by 44–50%, and consequently the effects on POF and CC indicators for this process are highly reduced by 92–96% (
Table 5). CH
4 emissions from conventional manure storage were reduced due to the creation of bioenergy and digestate, which can be used as fertilizer for agricultural land. The high reduction potential is similar to the findings of Lovarelli et al., 2022 [
9], for whom anaerobic manure treatment can cause a reduction of GHG emissions by 30% per FU. Indeed, this mitigation strategy is widely known as an effective measure to reduce farm impacts [
9,
40]. Pexas et al., 2020 [
47] stated that there are no one-size-fits-all solutions to improve environmental and economic performance in the livestock sector, but mitigation strategies must be planned and considered. In this regard, the anaerobic digestion systems require large initial capital investments for constructing the biogas plant, along with maintenance costs. However, in the present scenario, potential environmental benefits have been calculated, assuming that the manure would be sent to a biogas plant not owned by the farm itself, but to a biogas consortium plant. However, it requires structural investments and natural resources [
48] to transport the slurry to a collective anaerobic digestion plant and the digestate to the farm of origin, also considering the distance between production sites [
27].
The introduction of the mitigation strategy GR 3, which was not calculated for Q1 because the herd composition was estimated to be already optimal, reduced the total impact of Q2, Q3, and Q4 quartiles by 2–5%, lowering to a similar extent all the impact categories considered (
Figure 2). In accordance with Knapp et al., 2014 [
49], the heat stress abatement, disease control and treatment, performance-enhancing technologies, and management solutions toward the improvement of animal reproductive performance are estimated to lower environmental impact per kg of FPCM, depending on the cow’s genetic potential. Additionally, the increase in milking frequency improves the environmental performance of the herd when referred to the CF of milk [
50], as well as the increase in milk yield [
51]. In contrast, a reduction of the age at first calving and of the replacement rate, as for the improvement in fertility, can reduce CH
4 emissions by up to 24% [
52]. Özkan Gülzari et al., 2018 [
53], stated that compromised animal health status is responsible for losses in both productivity and profitability on dairy farm activity. For these reasons, improved udder health and milk quality would lead to a reduction of the GHG emission intensity of the herd. In the context of the mitigation actions referred to GR 3, optimizing the composition of the herd implied maintaining the number of lactating cows constant while minimizing the number of non-productive animals, increasing farm management efficiency. Indeed, the management of cow breeding can be seen as a mitigation intervention, acting at different levels that influenced almost all the studied processes, as the number of animals has changed, with, however, the highest reduction for bedding materials (2–13%), feed purchased (2–7%), and enteric fermentation emissions (5–6%) (
Table 6). The implementation of this mitigation only concerns the better management of the reared herd, not involving structural investments, and, hence, it is easy to be implemented. However, the environmental benefit would be observed only over the long term.
The GR 4 investigated how the quality of feeds used in diet formulation affected the estimated digestible energy and CH
4 output, mainly from enteric fermentation, but also from manure. The main factors determining enteric CH
4 emissions are feed intake, forage digestibility and quality, and dry matter intake level [
18,
41]. According to Tullo et al., 2019 [
21], continuous monitoring of feed quality parameters can reduce CF of milk by reformulating diets over time. In this specific scenario, the farms considered already had a good quality of in-farm feeds; therefore, the application of this mitigation action showed a reduction of the total average impact in a range between 1 and 3% for the four quartiles considered (
Figure 2). The process reduction addressed by the mitigation measure was emissions from enteric fermentation in the range of 3 to 11% and emissions from manure management in the range of 7 to 10%, mainly reducing POF and CC potential impacts (
Table 7). The findings agree with Caro et al., 2016 [
54], who found a potential reduction of enteric emissions in Europe of 10% by modifying the cattle diet, using high-quality forages, and consequently reducing the fibre content in the dairy cows’ diets [
55].
Feed quality, therefore, influences both enteric and manure CH
4 production. It is possible to state that the higher the feed quality, the lower the CH
4 emissions from enteric fermentation due to enhancing the feed conversion ratio and, consequently, less indigestible feed in the manure [
10,
19]. These results align with a study by Knapp et al., 2014 [
49], which examined a significant potential for reducing CH
4 emissions through high-quality feeds and, thus, good performance in reducing the CC indicator.
This mitigating approach, however, has limitations and necessitates significant investments, such as external technical assistance, analysis expenses, and the use of analytical feed composition in diet formulation.
The GR 5 mitigation measure resulted in a reduction in the environmental impacts of only 0.01–0.04%, reducing the emissions derived from energy, mainly from M-RD impact (
Figure 2). Few studies have been conducted on this in the scientific literature. Schader et al., 2014 [
22], examined a GHG reduction potential at the dairy farm level of 0.14% due to heat recovery from the milk tank. In this respect, the mitigation consisted of heat recovery from the milk cooling process, which, as an example, could be used to heat water to wash the milking equipment [
56]. It has a straightforward implementation with low economic investment, but a low reduction potential compared to the other mitigation groups. In fact, only the amount of fossil energy used in heating the water for washing machinery is replaced by a milk tank equipped with a heat exchanger.
However, the use of fossil energy in this context was very modest, and its replacement would have a limited effect on the reduction of the total impact of milk, as confirmed in
Table 8.
3.4. The Realistic Scenario Results
As shown in
Table 1, the farm representatives of the four quartiles are willing to employ different mitigation actions marked with the asterisk. Nevertheless, Mitigation GR 1 found greater interest by farmers for the possible ease of implementation. Therefore, in the realistic scenario, each of the four farms would employ only the GR 1 to varying degrees (
Table 1), producing different results (
Table 4).
For the Q1 farm, the realistic scenario showed overall 1% higher results than the best-case scenario (
Figure 1) for GR 1 due to 13% higher emissions for barn management emissions, resulting in higher POF emissions (
Table 4). Indeed, the farm preferred to continue with the conventional manure application approach and fertilizers incorporation, in contrast to the best-case scenario, which considered slurry injection (closed-slot) and closed-slot injection of fertilizers. In their reference scenario, Q1 favored the formation of natural crust during manure storage.
Q2 farm would partly apply the GR 1 mitigation strategy, so the results of the realistic scenario correspond to those obtained from the best-case scenario (GR 1), except for feed purchased and in-farm feed. The in-farm feed category was characterized by +6% and the feed purchased process by −4% environmental impact in the best-case scenario compared to the realistic scenario (
Table 4). Nevertheless, the total impact reduction as an application of the mitigation measure stands a 6% in the realistic scenario, as well as in the best-case scenario (GR 1) (
Figure 1).
For farm Q3, farmers were not willing to entirely apply the GR 1, preferring the conventional manure application and no improvement in manure storage. This farm would implement the incorporation of fertilizers, which, however, decreases in lesser extent the NH
3 emissions compared to the closed-slot injection practice, as shown in
Table 1. Therefore, the realistic scenario resulted higher than the application of the corresponding best-case scenario, which would decrease by 7% the total impact of the farm by diminishing mostly TE impact (
Figure 2).
The Q4 would partly employ the mitigation GR 1, as well, resulting in a realistic scenario 3% higher compared to the best-case scenario total impact (
Figure 2). In particular, the complete application of the mitigation measure would result in a significant reduction in the impacts of the TE, ME, POF, and A indicators (
Table 4). In fact, the emissions from manure management and barn management were higher in the realistic scenario. These results are probably due to the farm management’s choice of favoring the natural crust of manure storage and the open-slot as the application of manure, with less reduction in NH
3 emissions than the closed-slot (
Table 1). Similarly, Q4 would apply fertilizer incorporation as fertilizer application instead of injection, which would be more efficient.
Abbreviations: Reference: reference scenario; BS GR 1: best-case scenario applying group 1; BS GR 2: best-case scenario applying group 2; BS GR 3: best-case scenario applying group 3; BS GR 4: best-case scenario applying group 4; BS GR 5: best-case scenario applying group 5; Realistic: realistic scenario.


 and
and 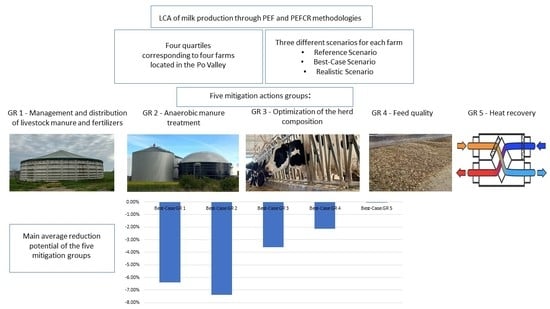


