
Development and Evaluation of a Dry Emulsion of Ostrich Oil as a Dietary Supplement


Abstract
:1. Introduction
2. Materials and Methods
2.1. Materials
2.2. Preparation and Evaluation of Ostrich Oil
2.2.1. Preparation of Ostrich Oil
2.2.2. Fatty Acid Composition
2.2.3. Antioxidant Activity
DPPH Radical Scavenging
Copper-Chelating Activity
2.2.4. Acid Value (AV), Peroxide Value (PV), Iodine Value (IV), Saponification Value (SV), and Refractive Index (RI)
2.2.5. Heavy Metal Contents
2.2.6. Microbial Contamination
2.3. Formulation and Evaluation of Emulsion Containing Ostrich Oil
2.3.1. Formulation of Emulsion
2.3.2. Evaluation of Emulsion
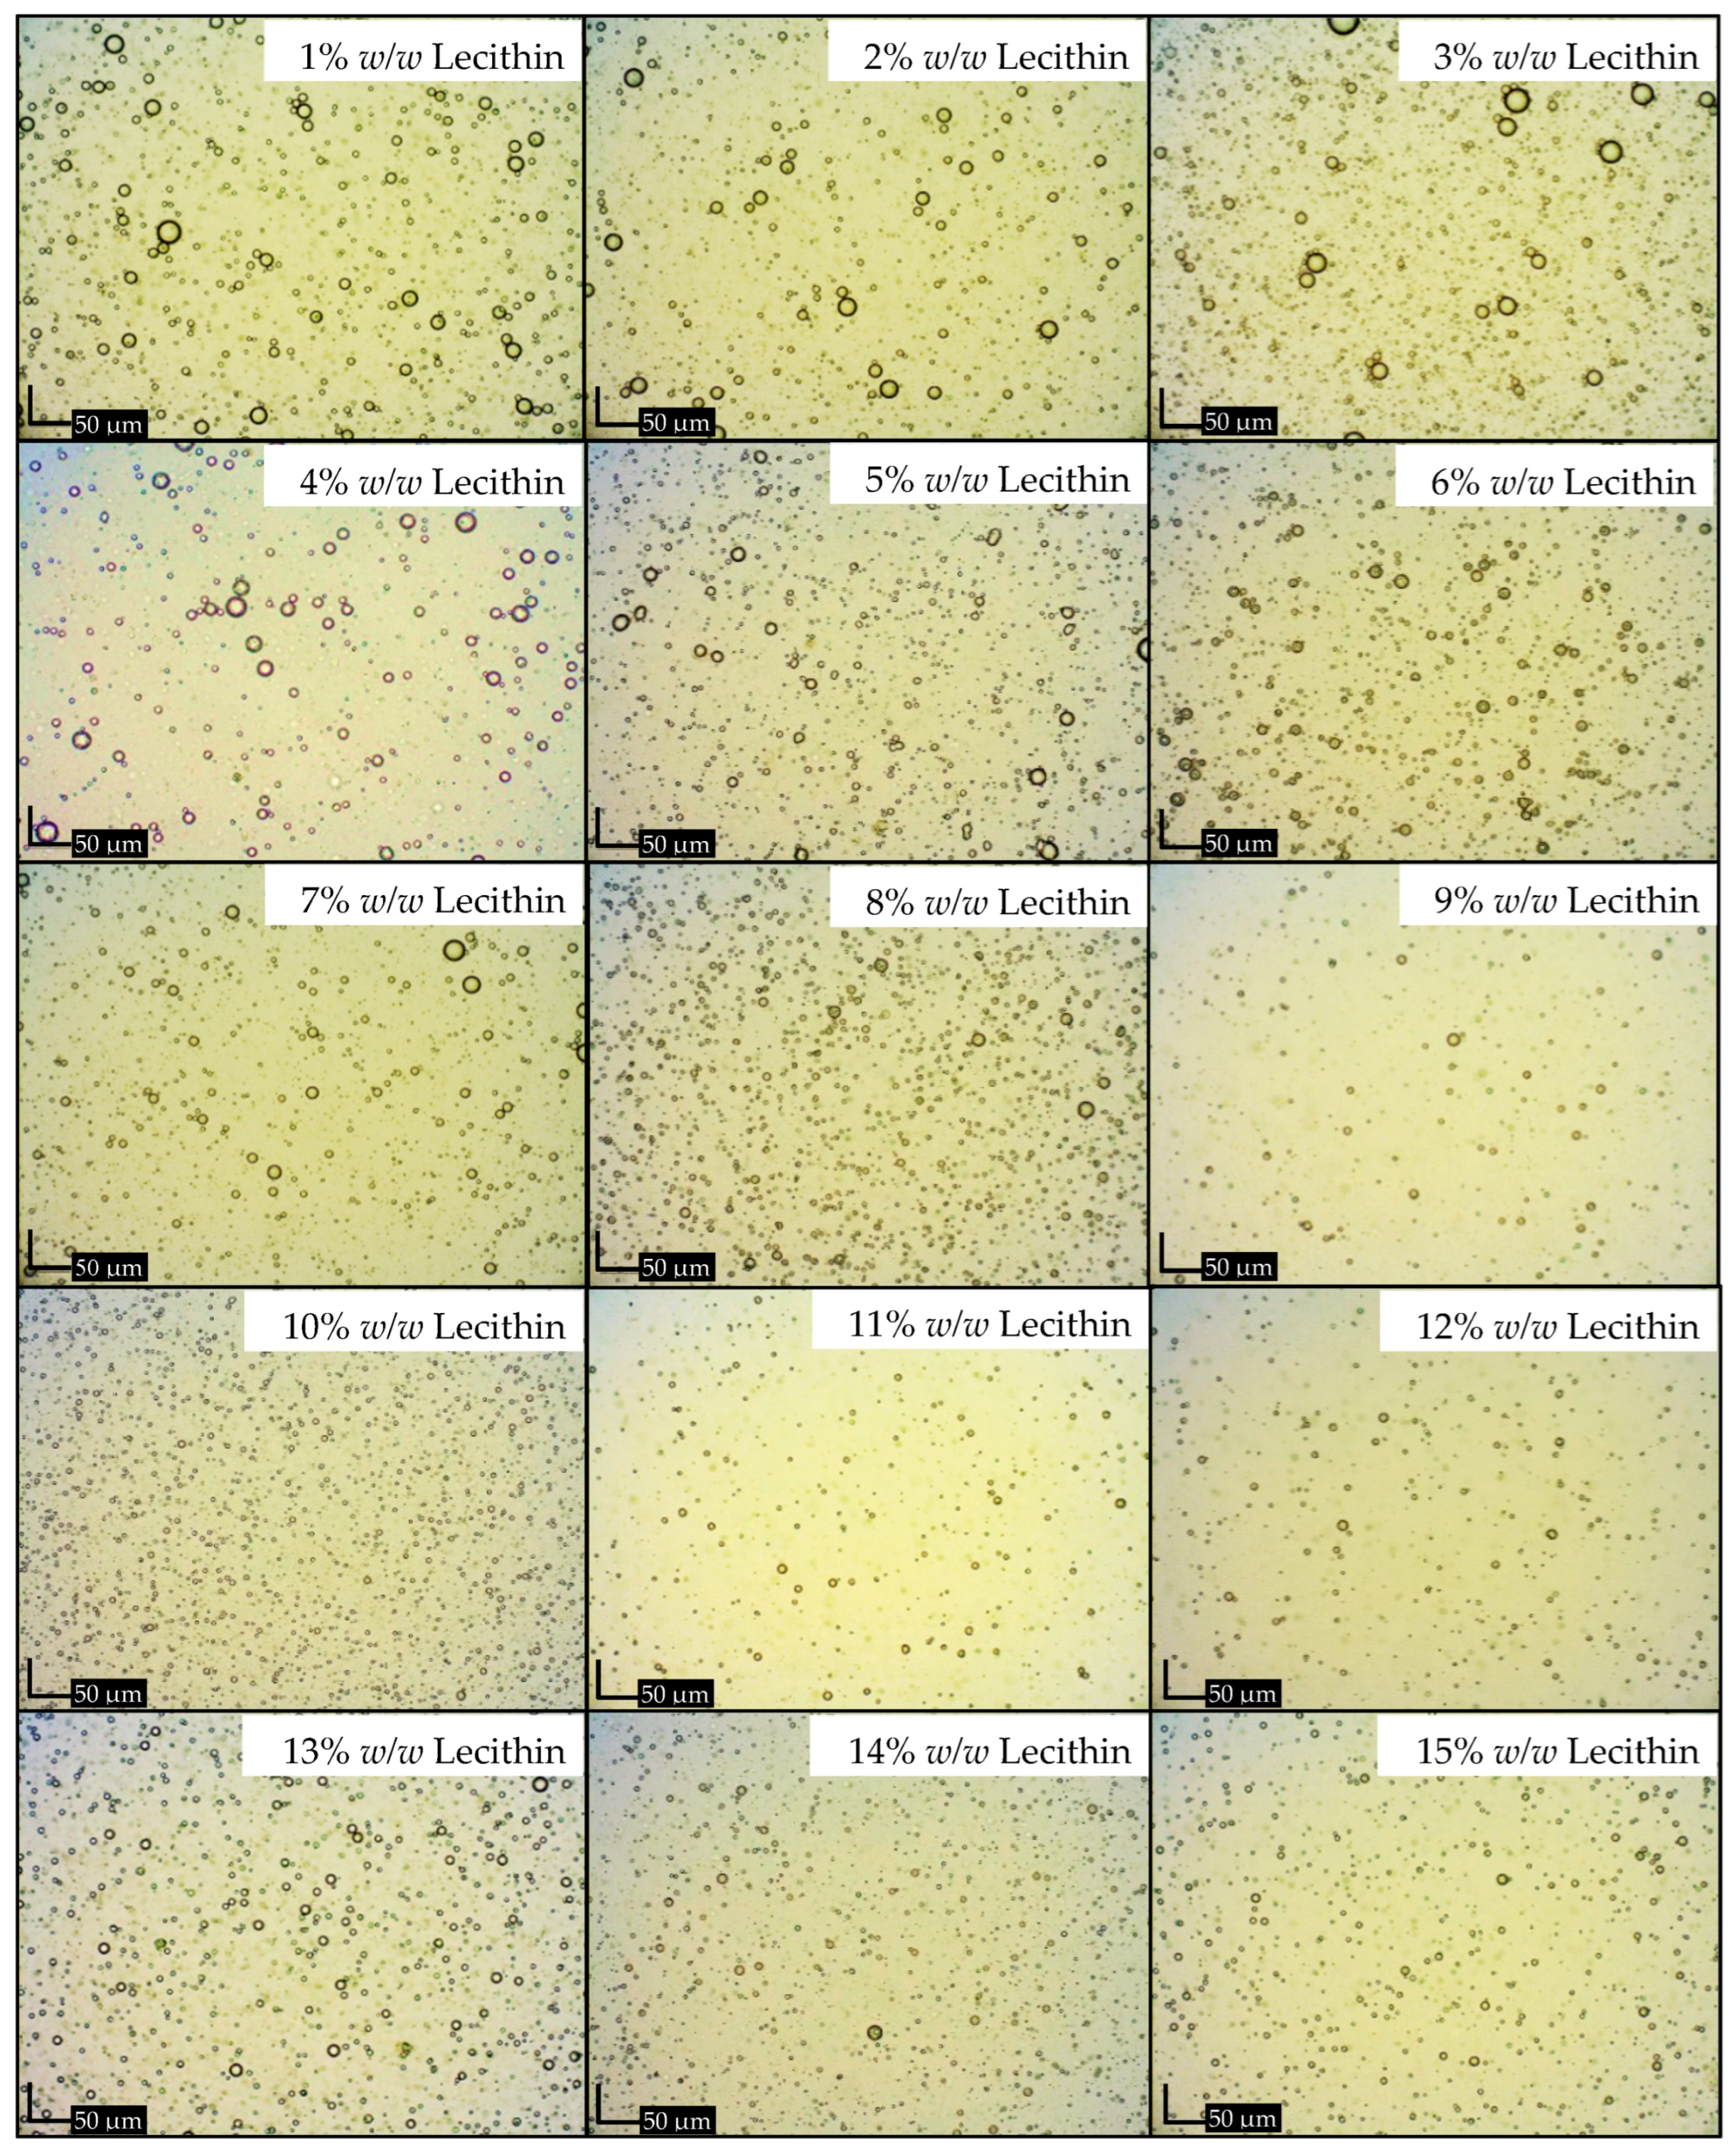
Microscopic Examination
Physical Characteristics
Droplet Size
Zeta Potential Value
Viscosity
2.4. Fabrication and Evaluation of Dry Emulsions Containing Ostrich Oil
2.4.1. Fabrication of Dry Emulsions
2.4.2. Evaluation of Dry Emulsions
Physical Characteristics
Percentage of Moisture
Percentage of Weight Loss after Oil Release
Microbial Contamination
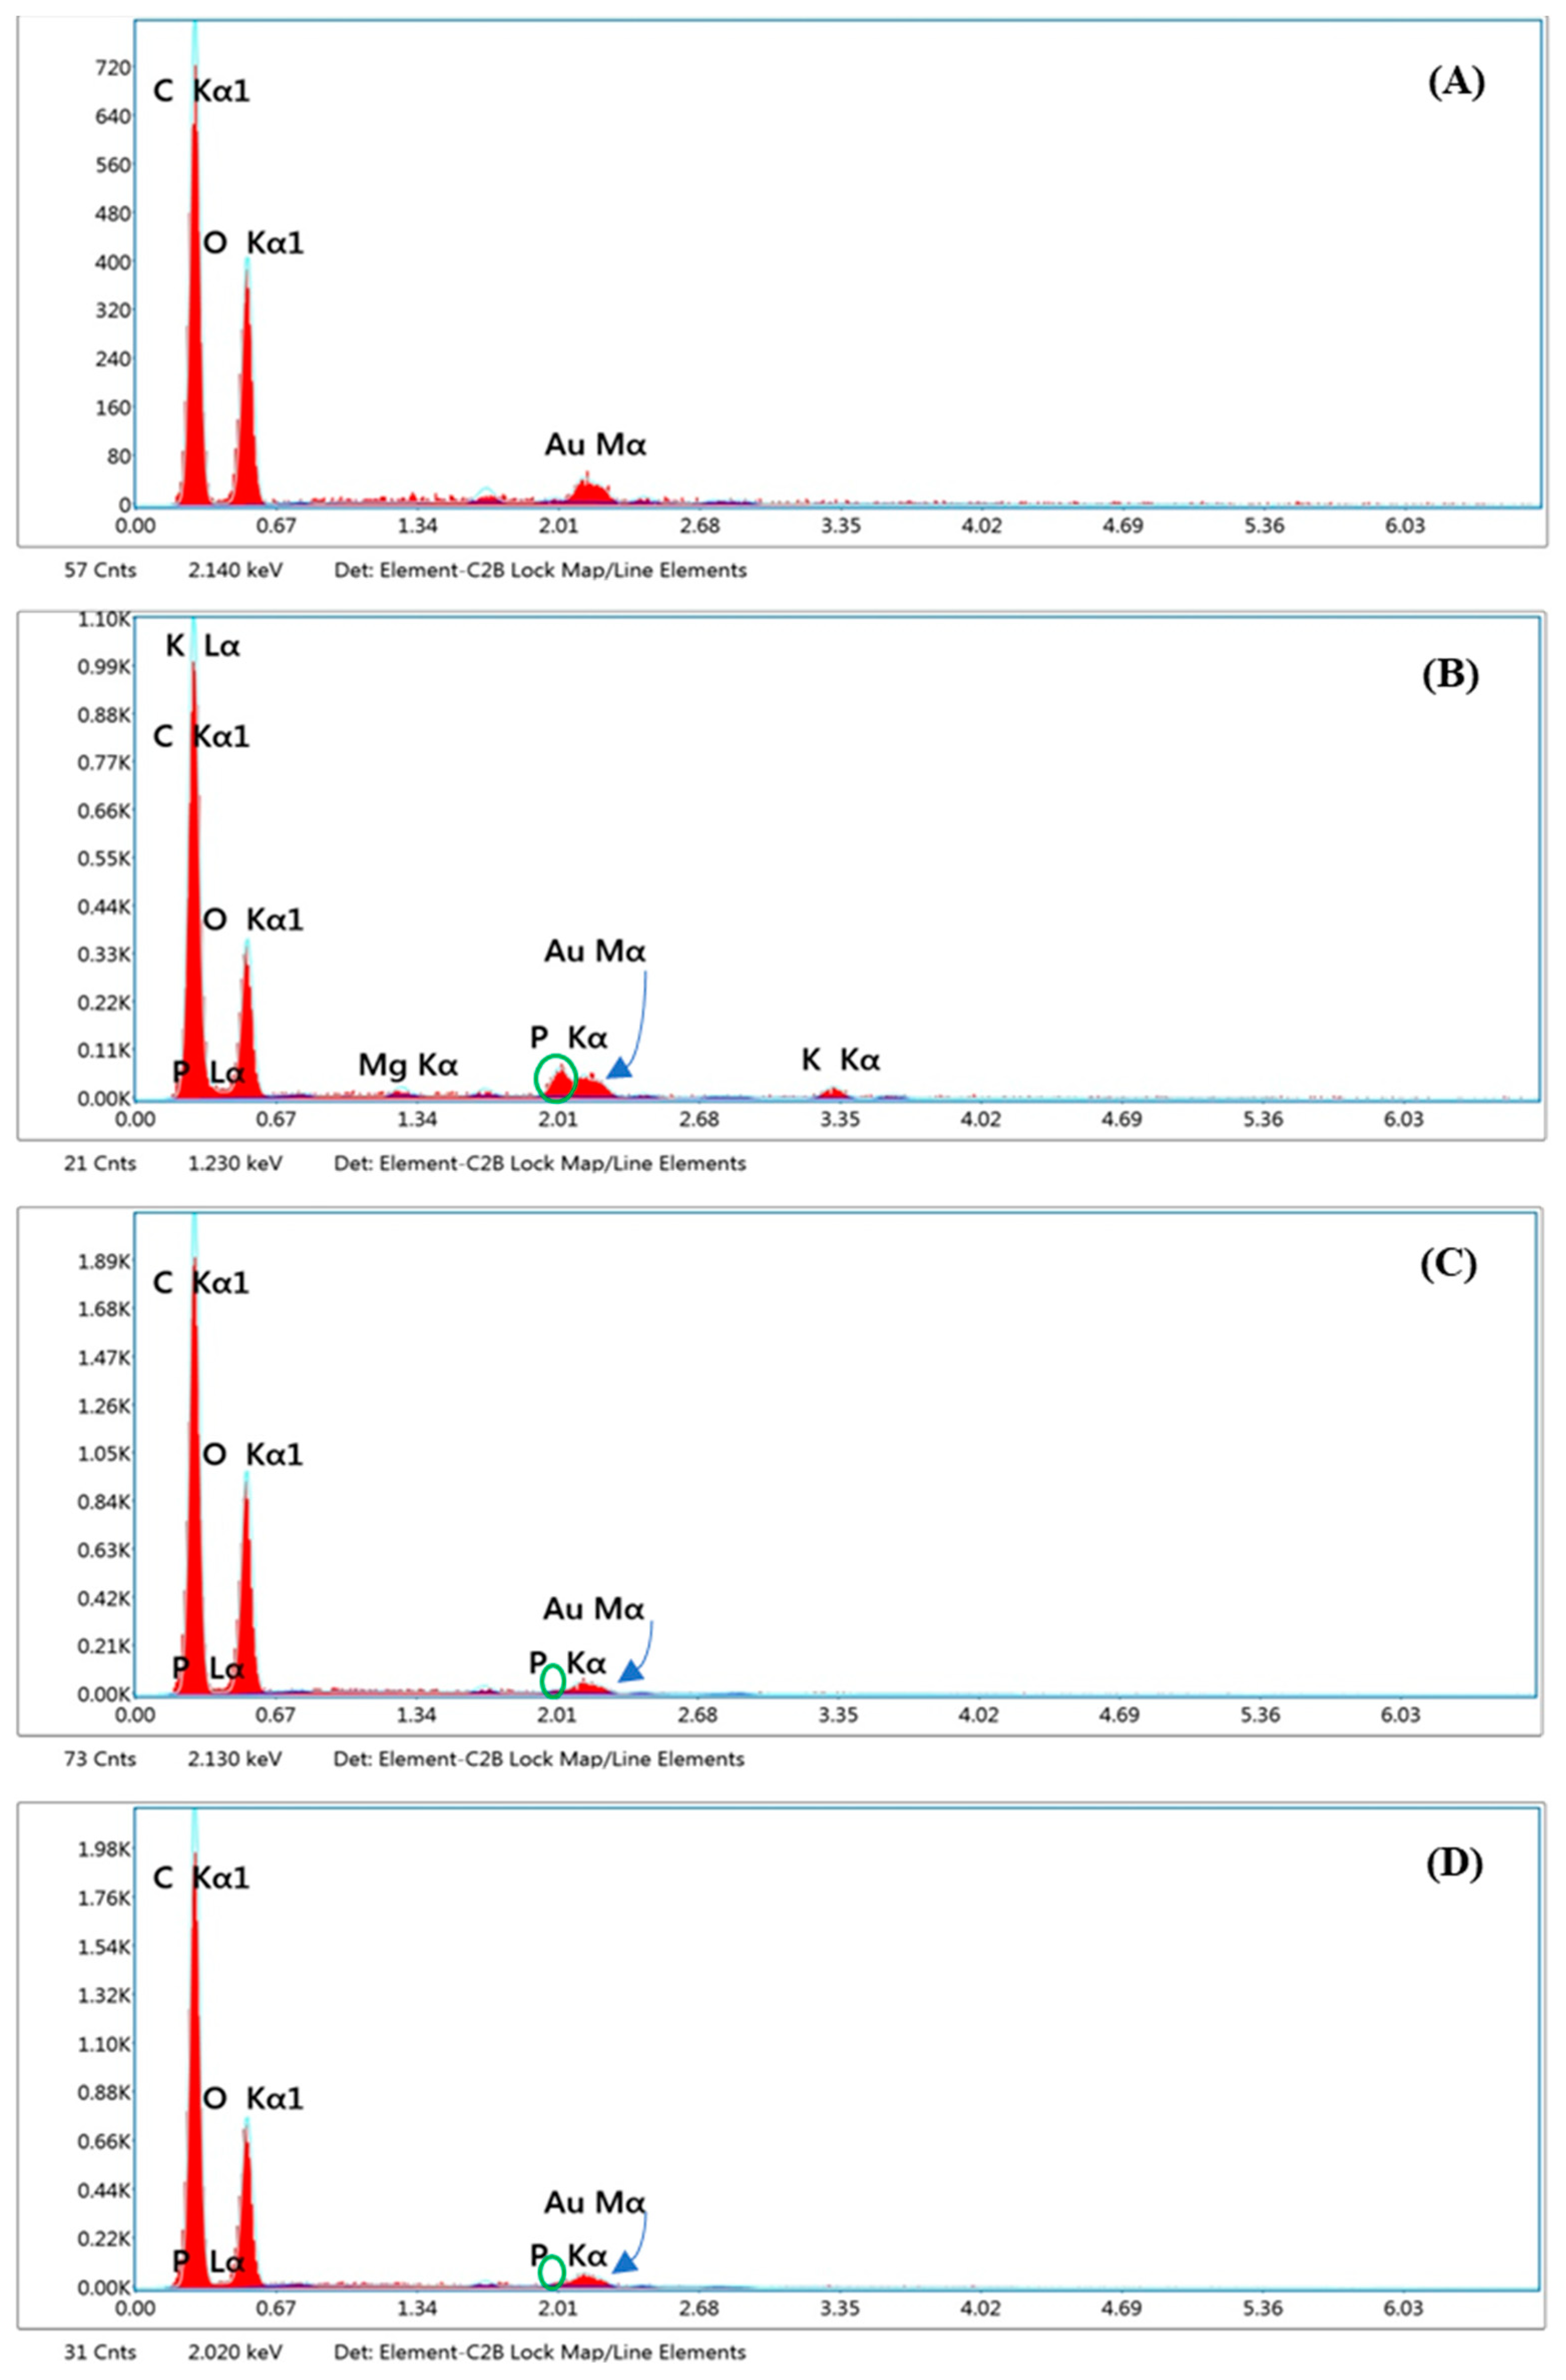
Heavy Metal Contamination
Particle Size Analysis
Compressibility Index
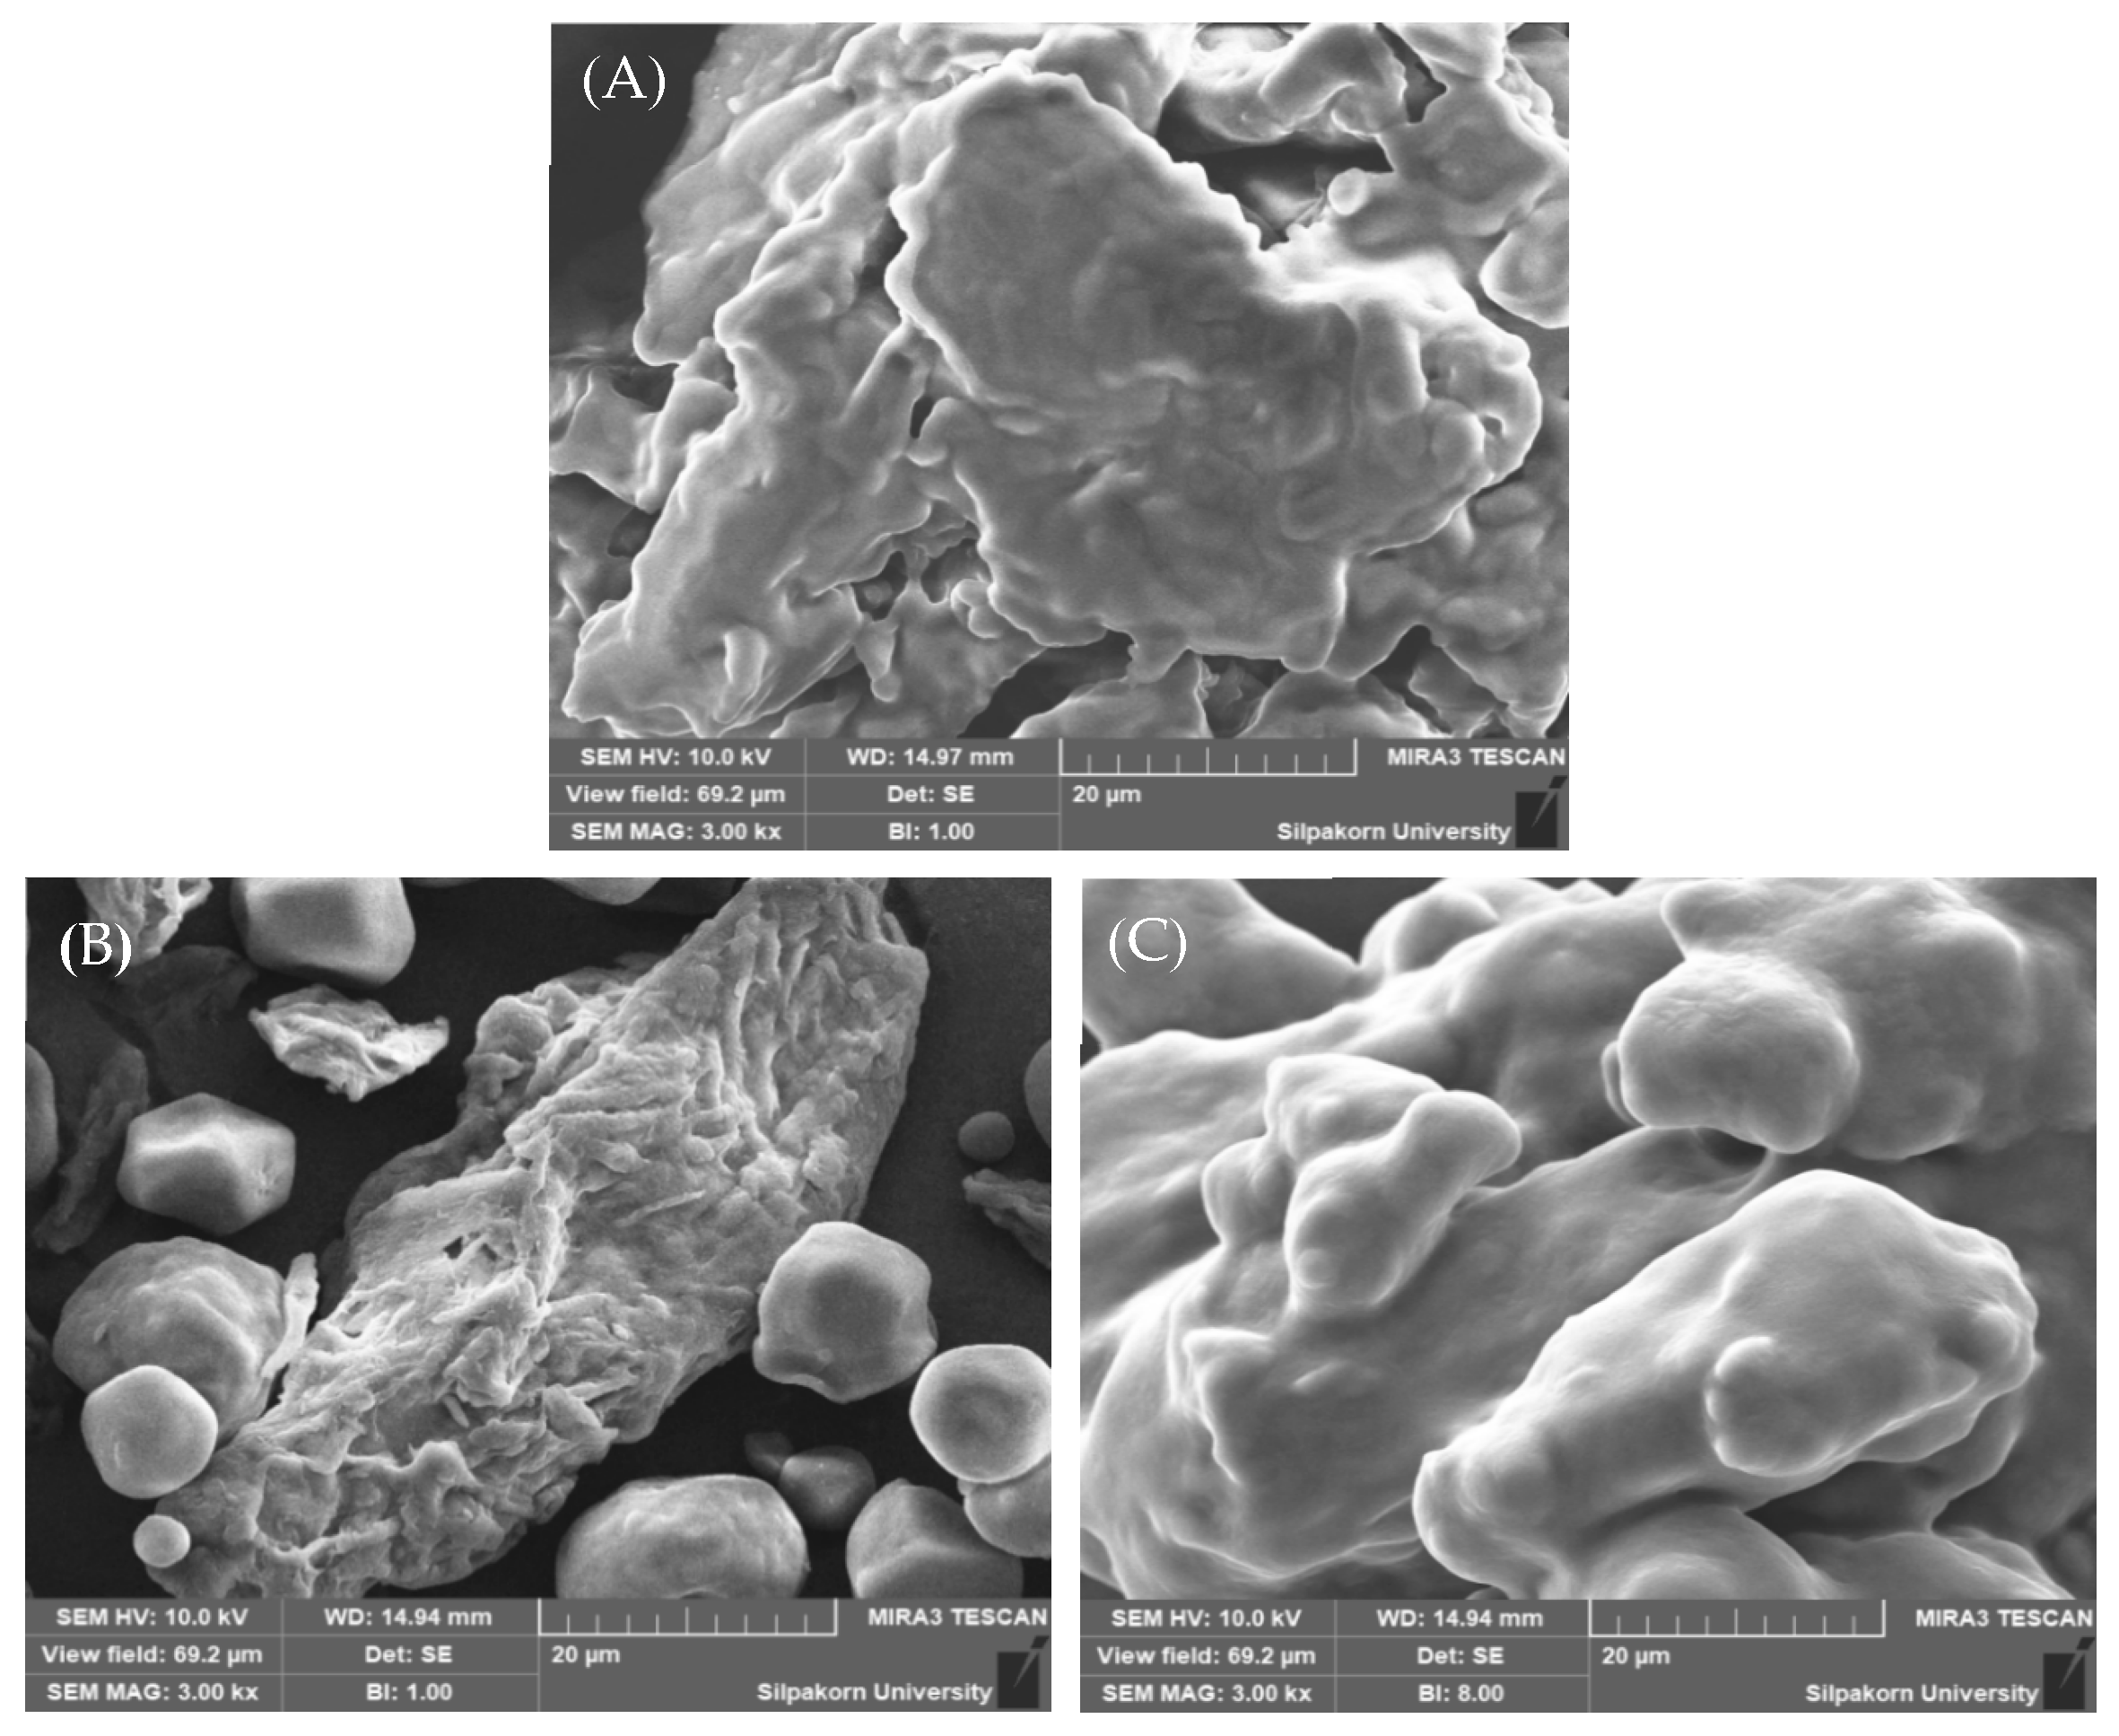
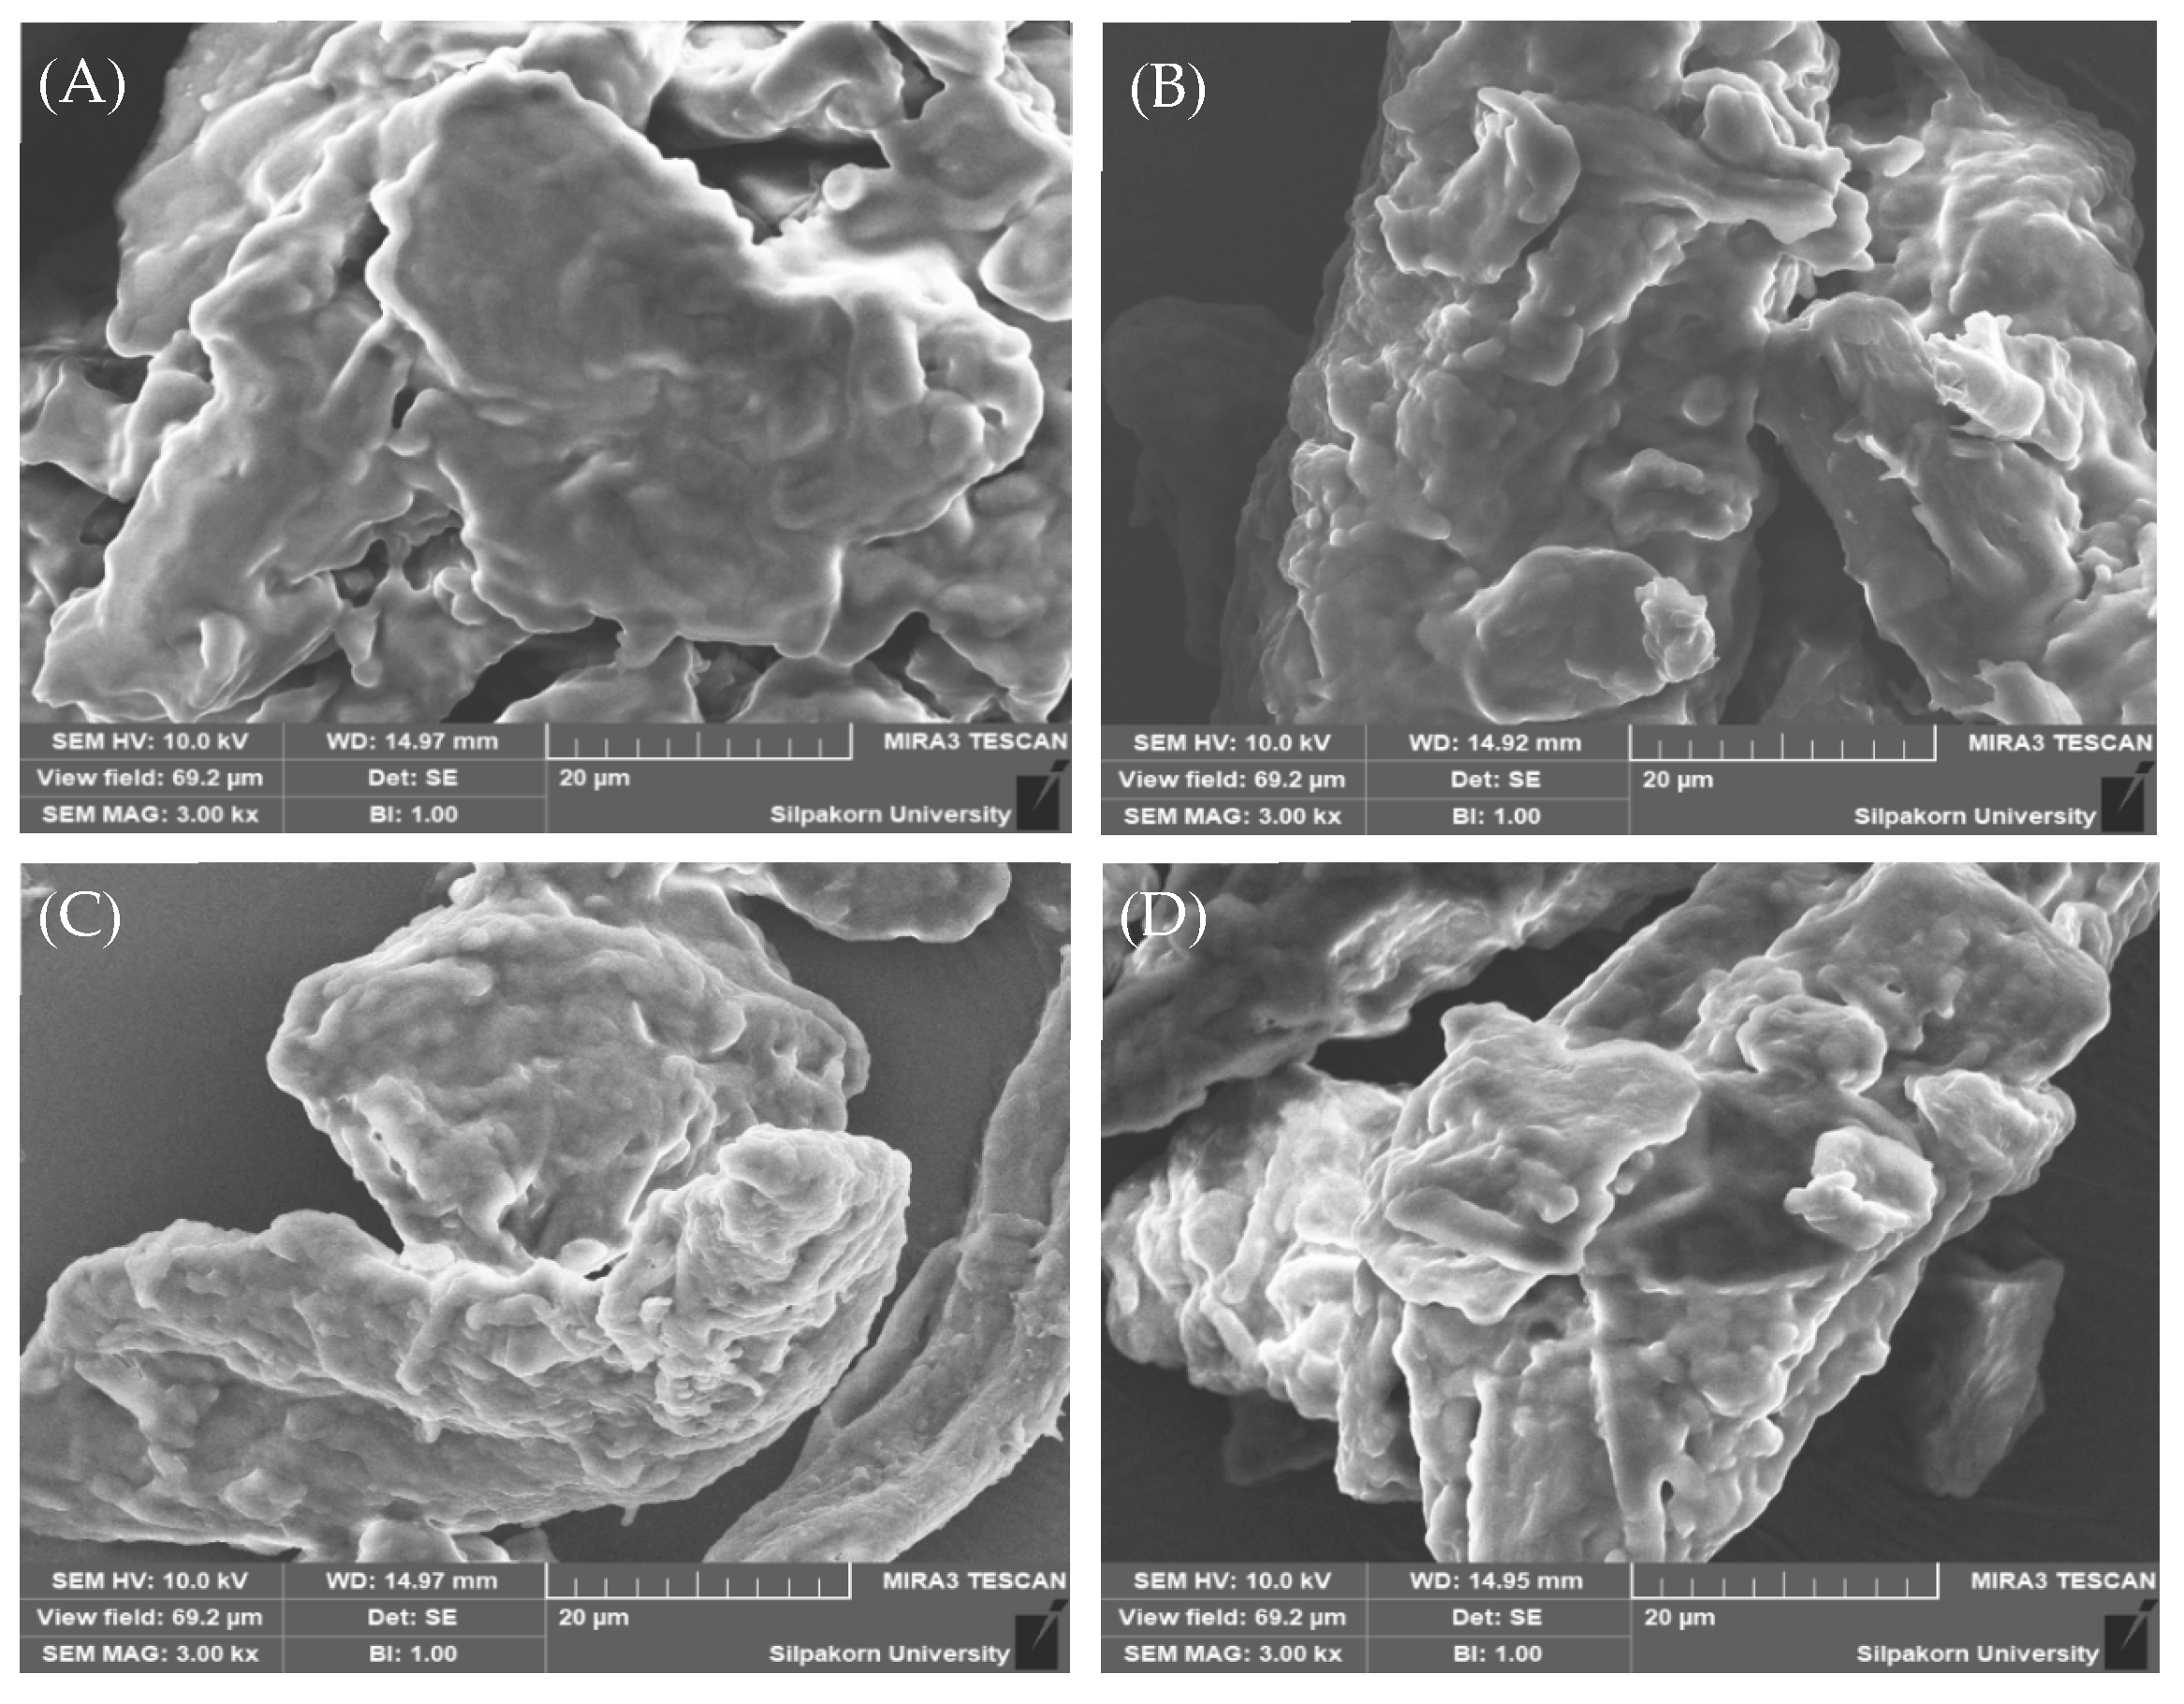
Particle Morphology
Disintegration
2.5. Stability
2.5.1. Stability under Temperature Cycling
2.5.2. Stability under Storage at Various Temperatures
2.5.3. Color Intensity
2.6. Statistical Analysis
3. Results
3.1. Preparation and Evaluation of Ostrich Oil
3.2. Formulation and Evaluation of Emulsion Containing Ostrich Oil
3.2.1. Formulation of Emulsion
3.2.2. Evaluation of Emulsion
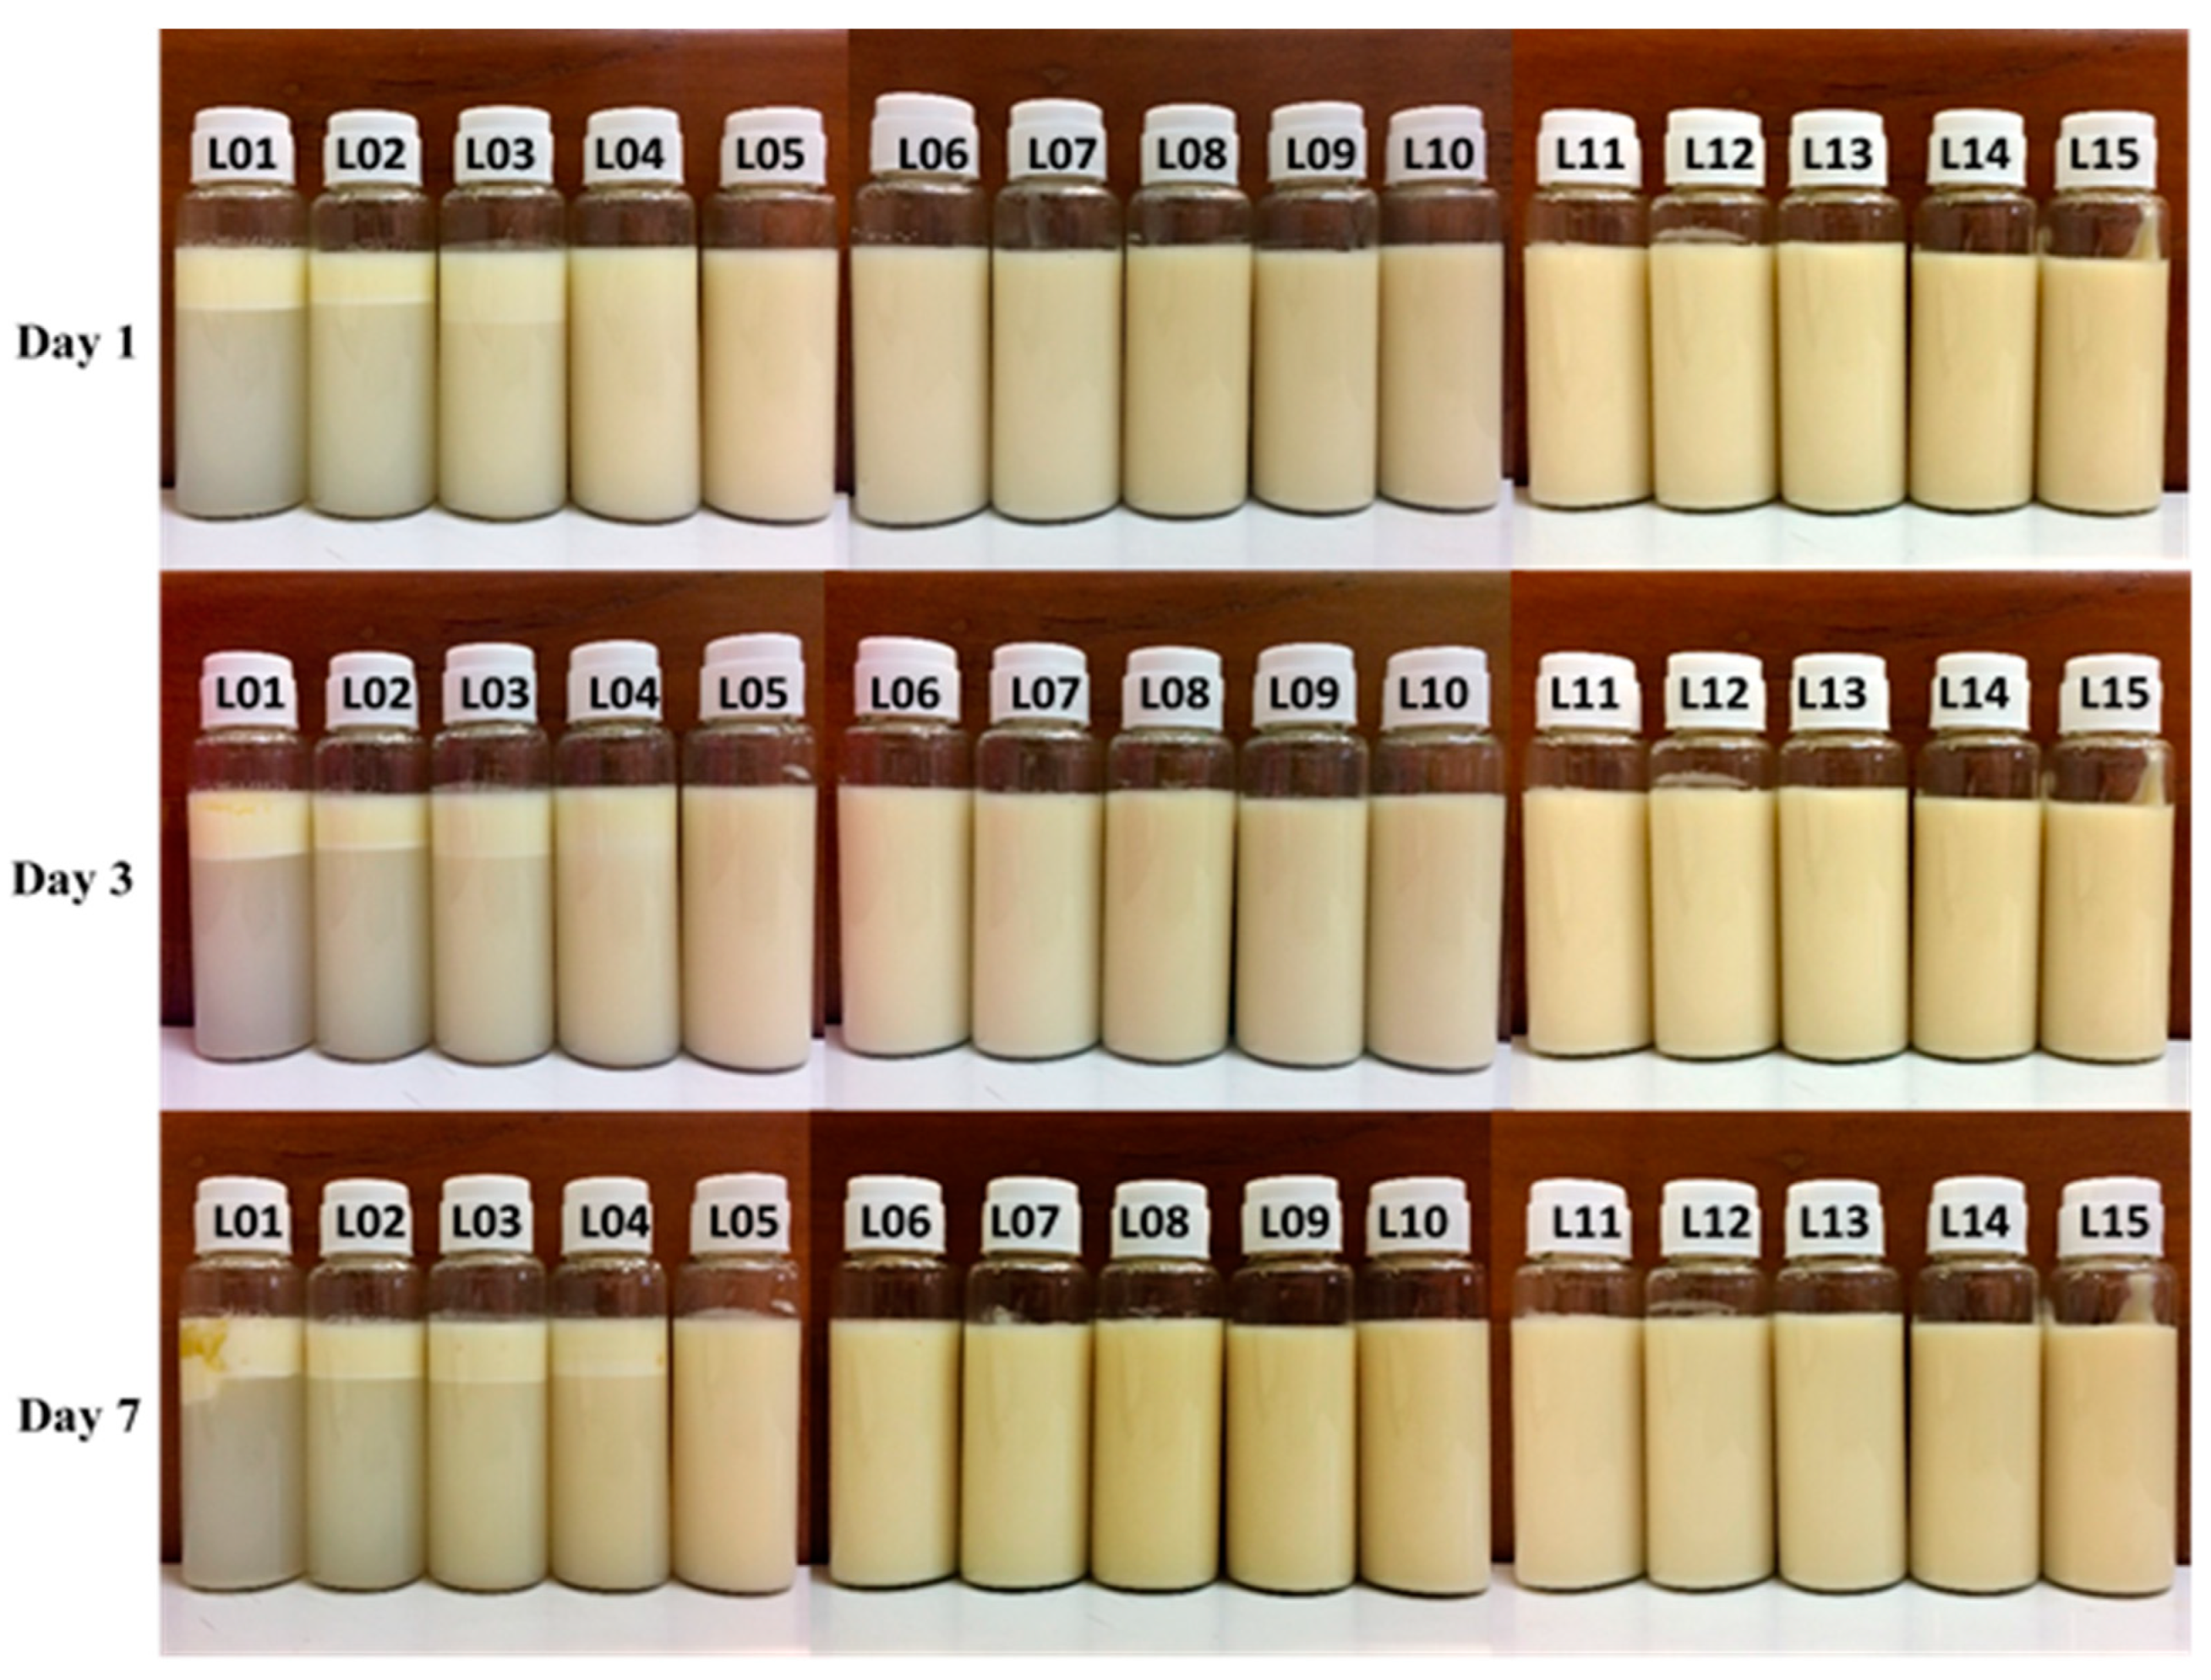
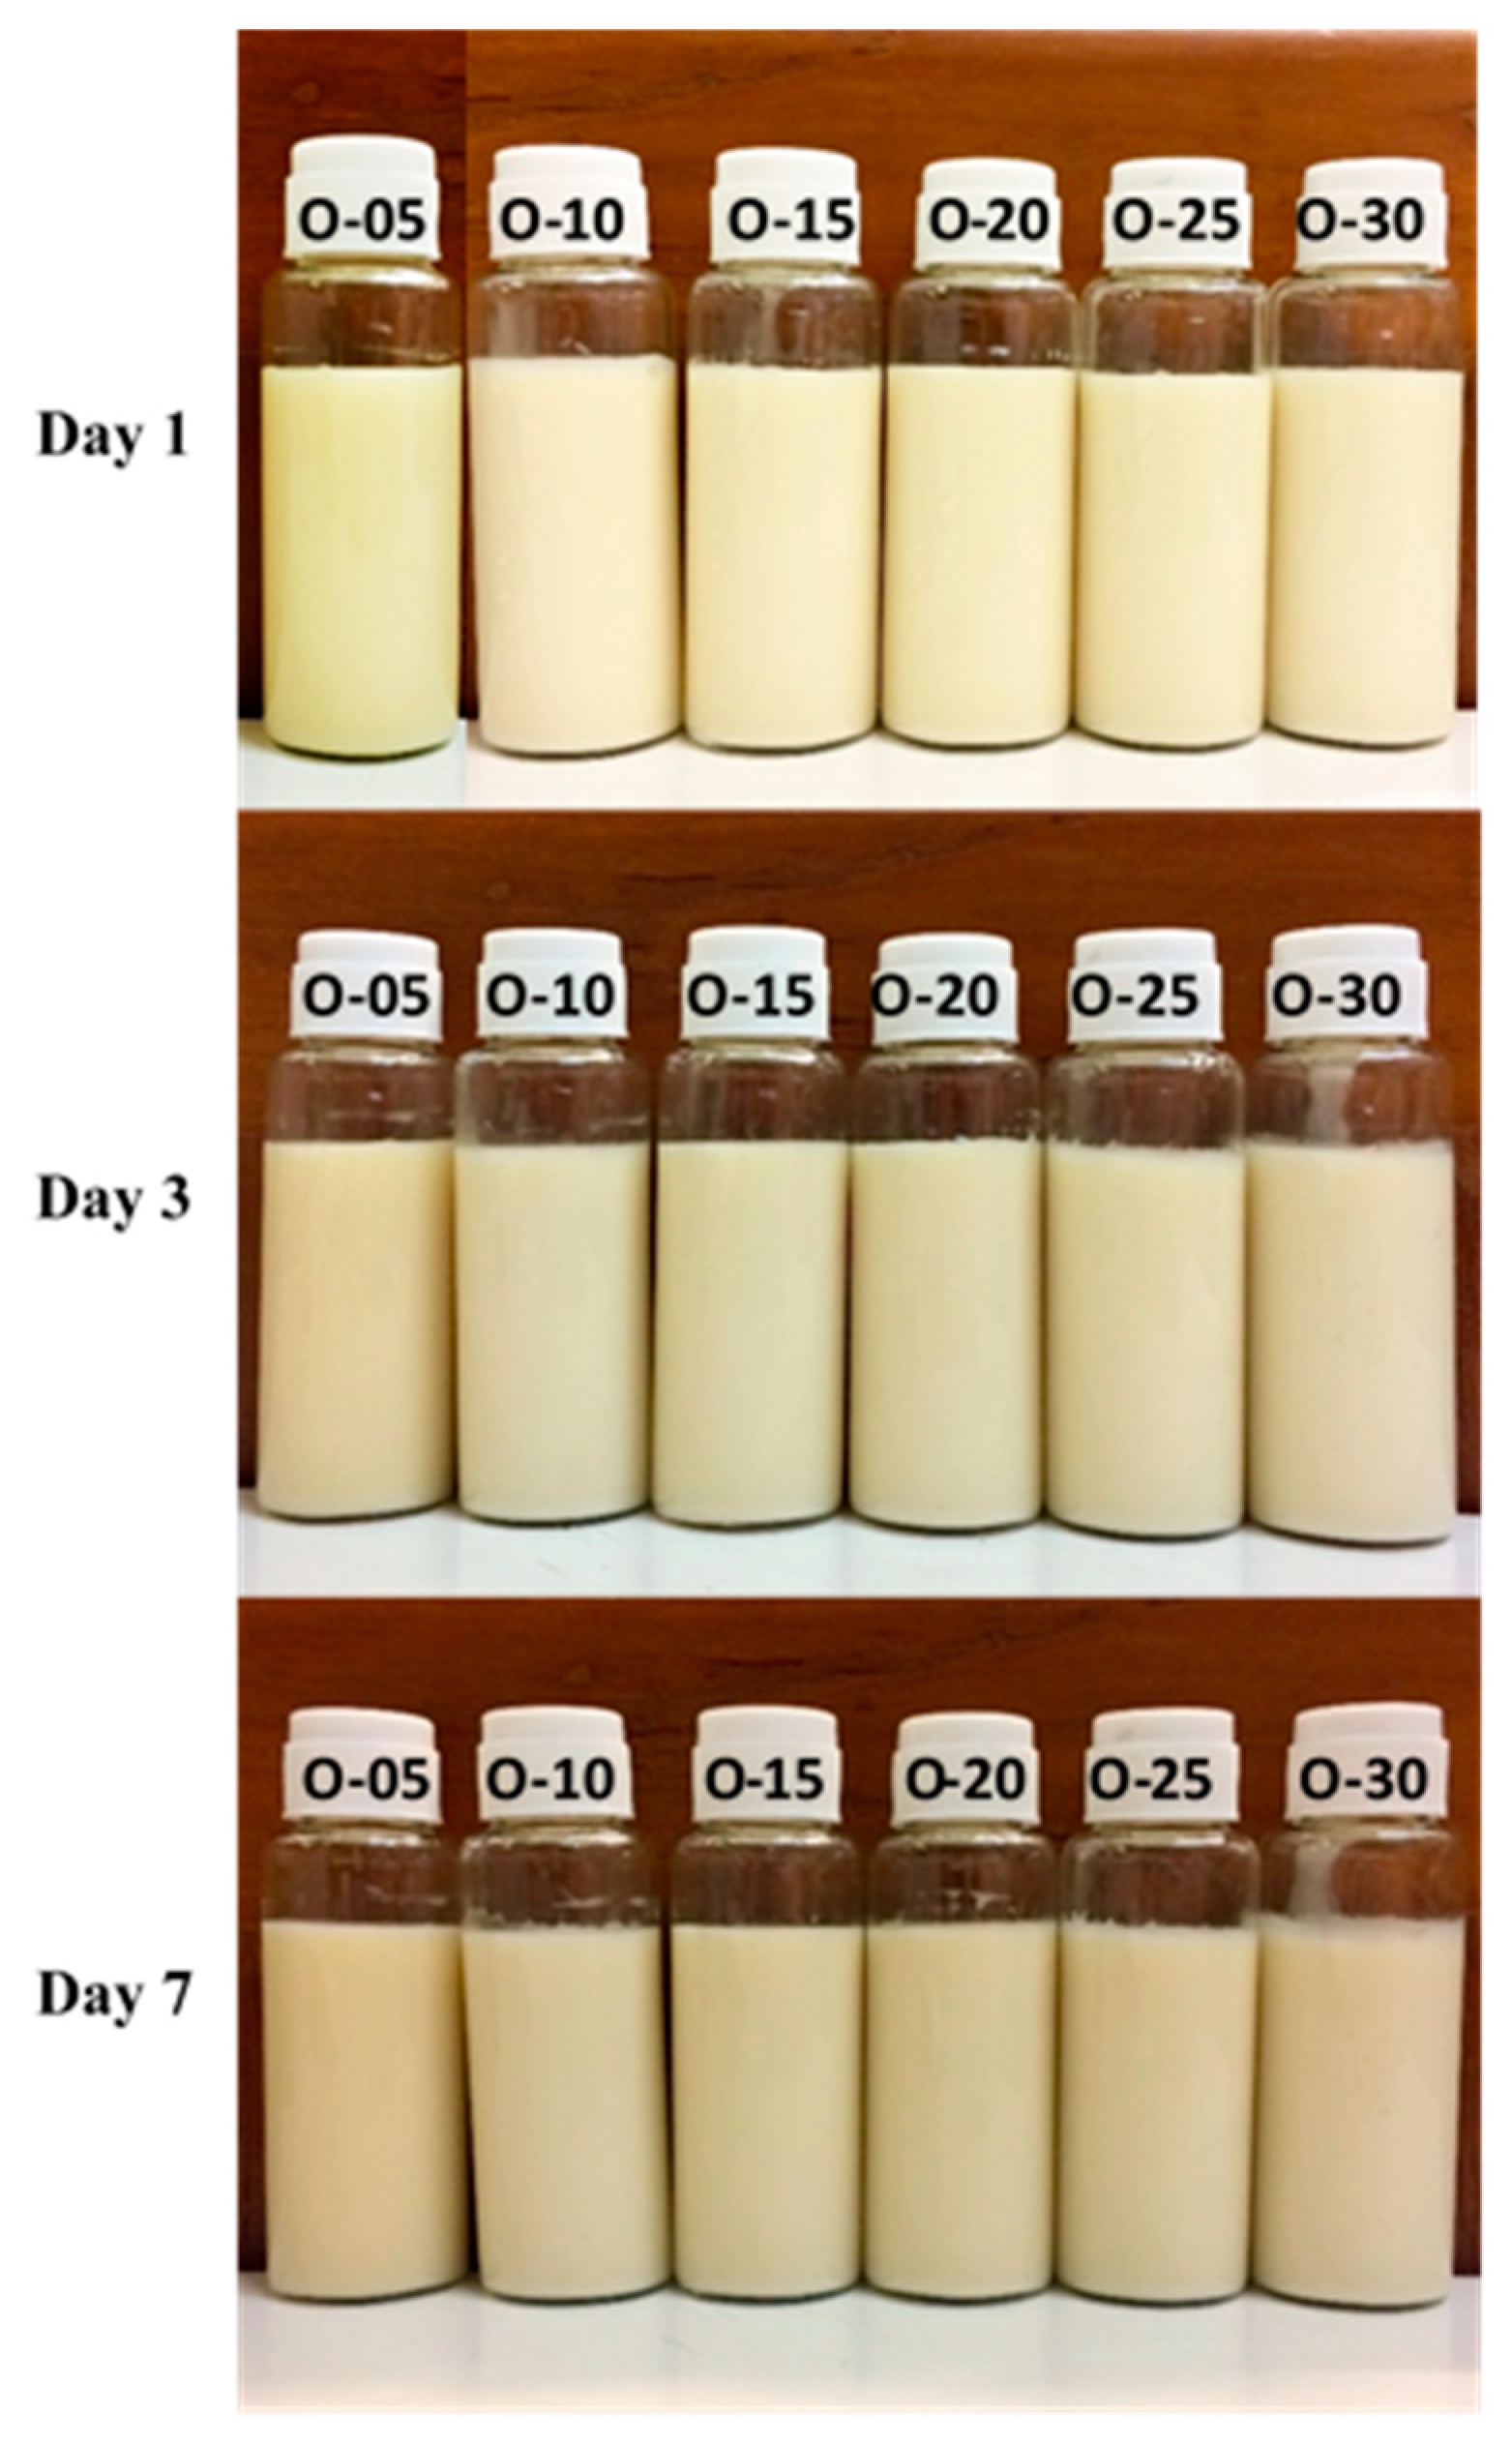
Visual Observation and Creaming Indices
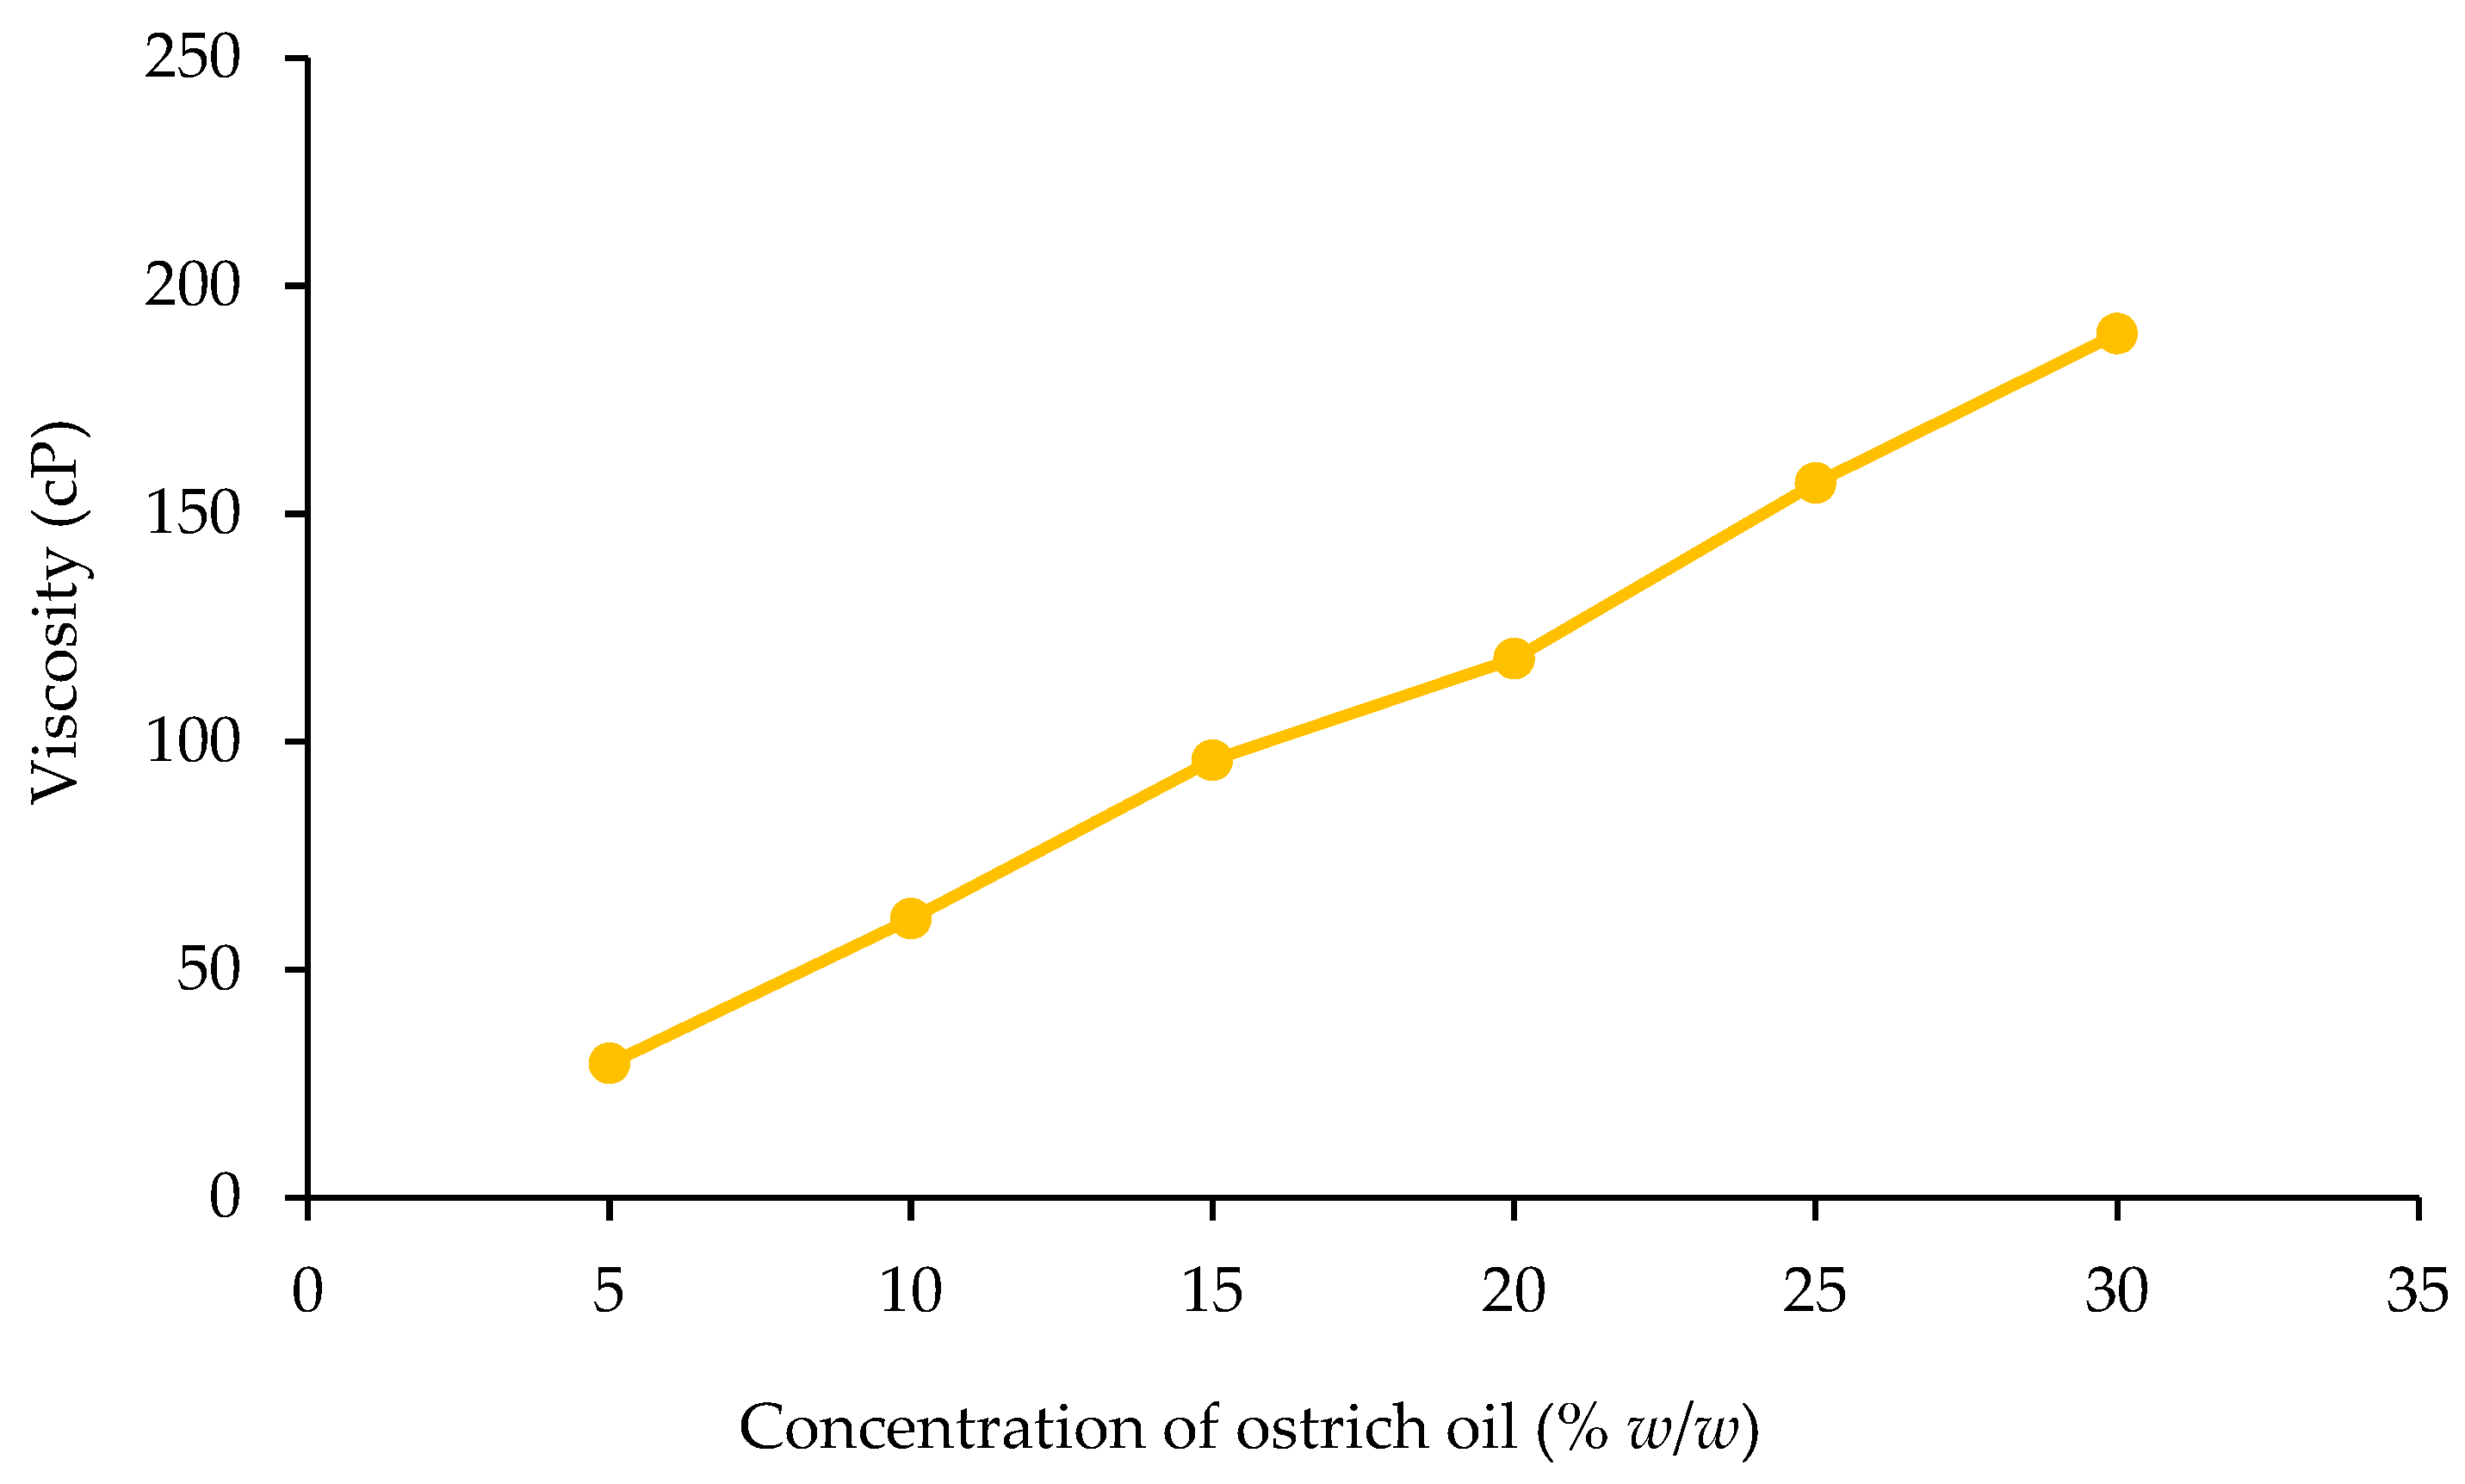
Viscosity
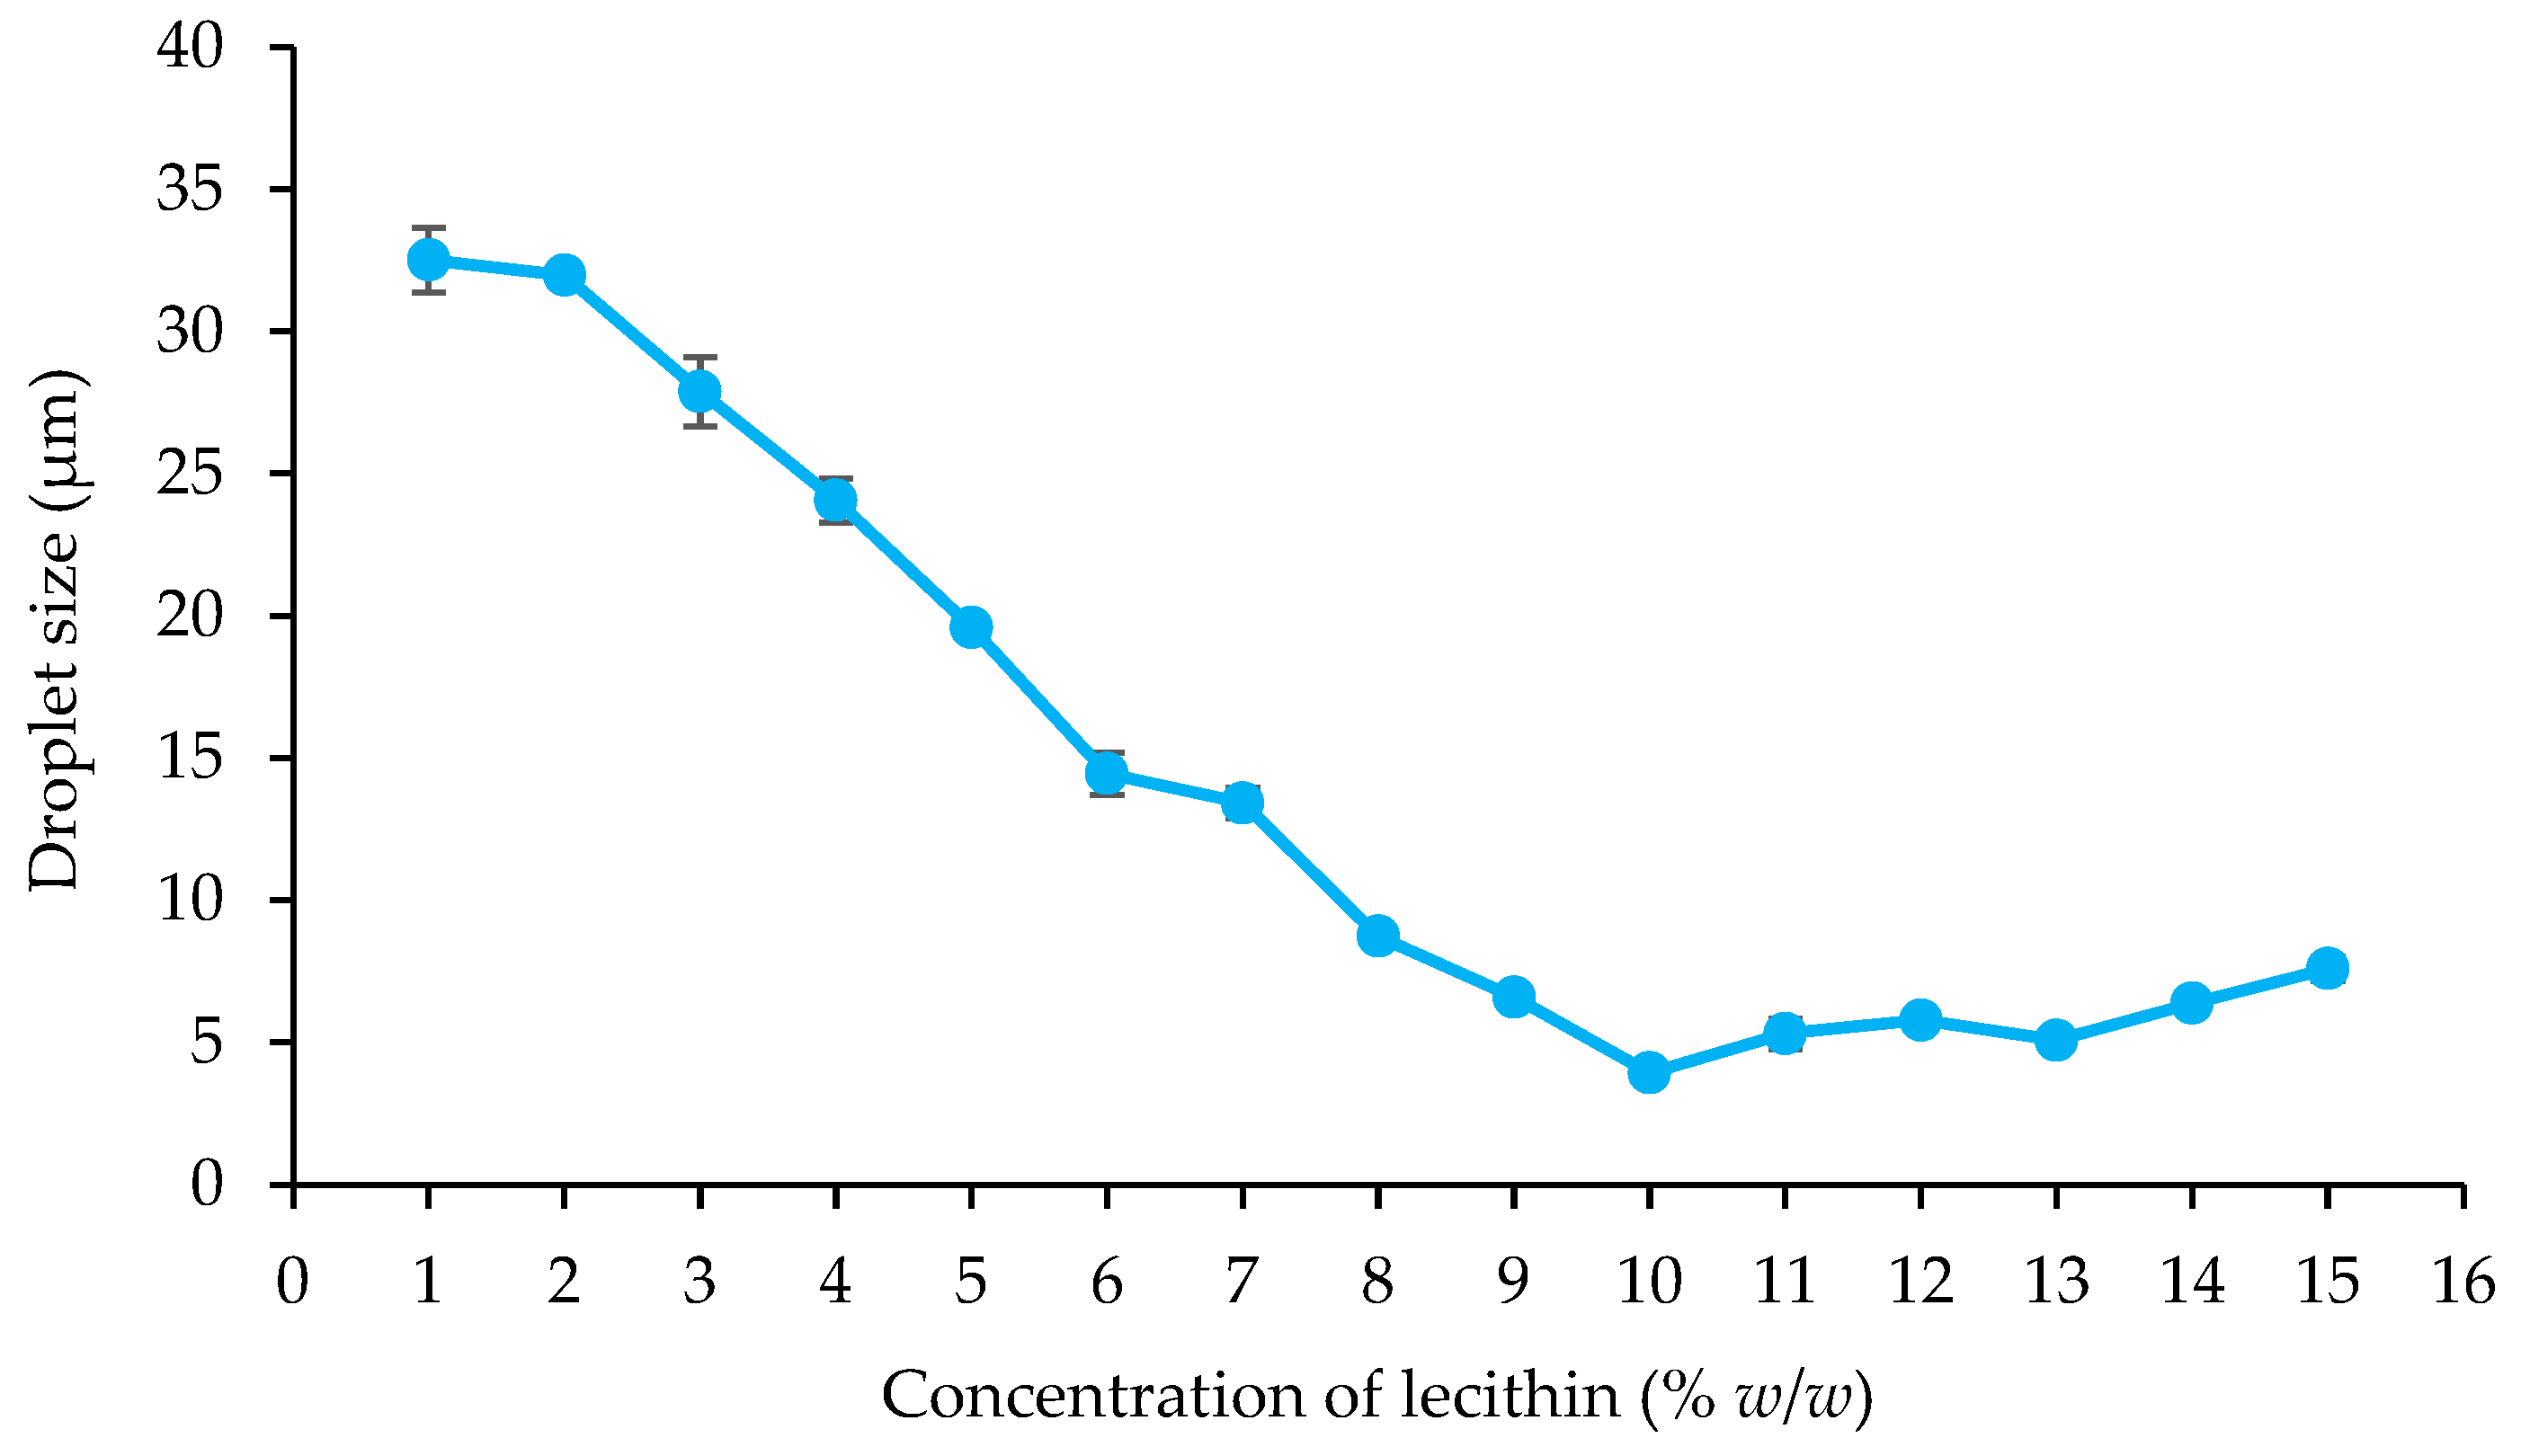
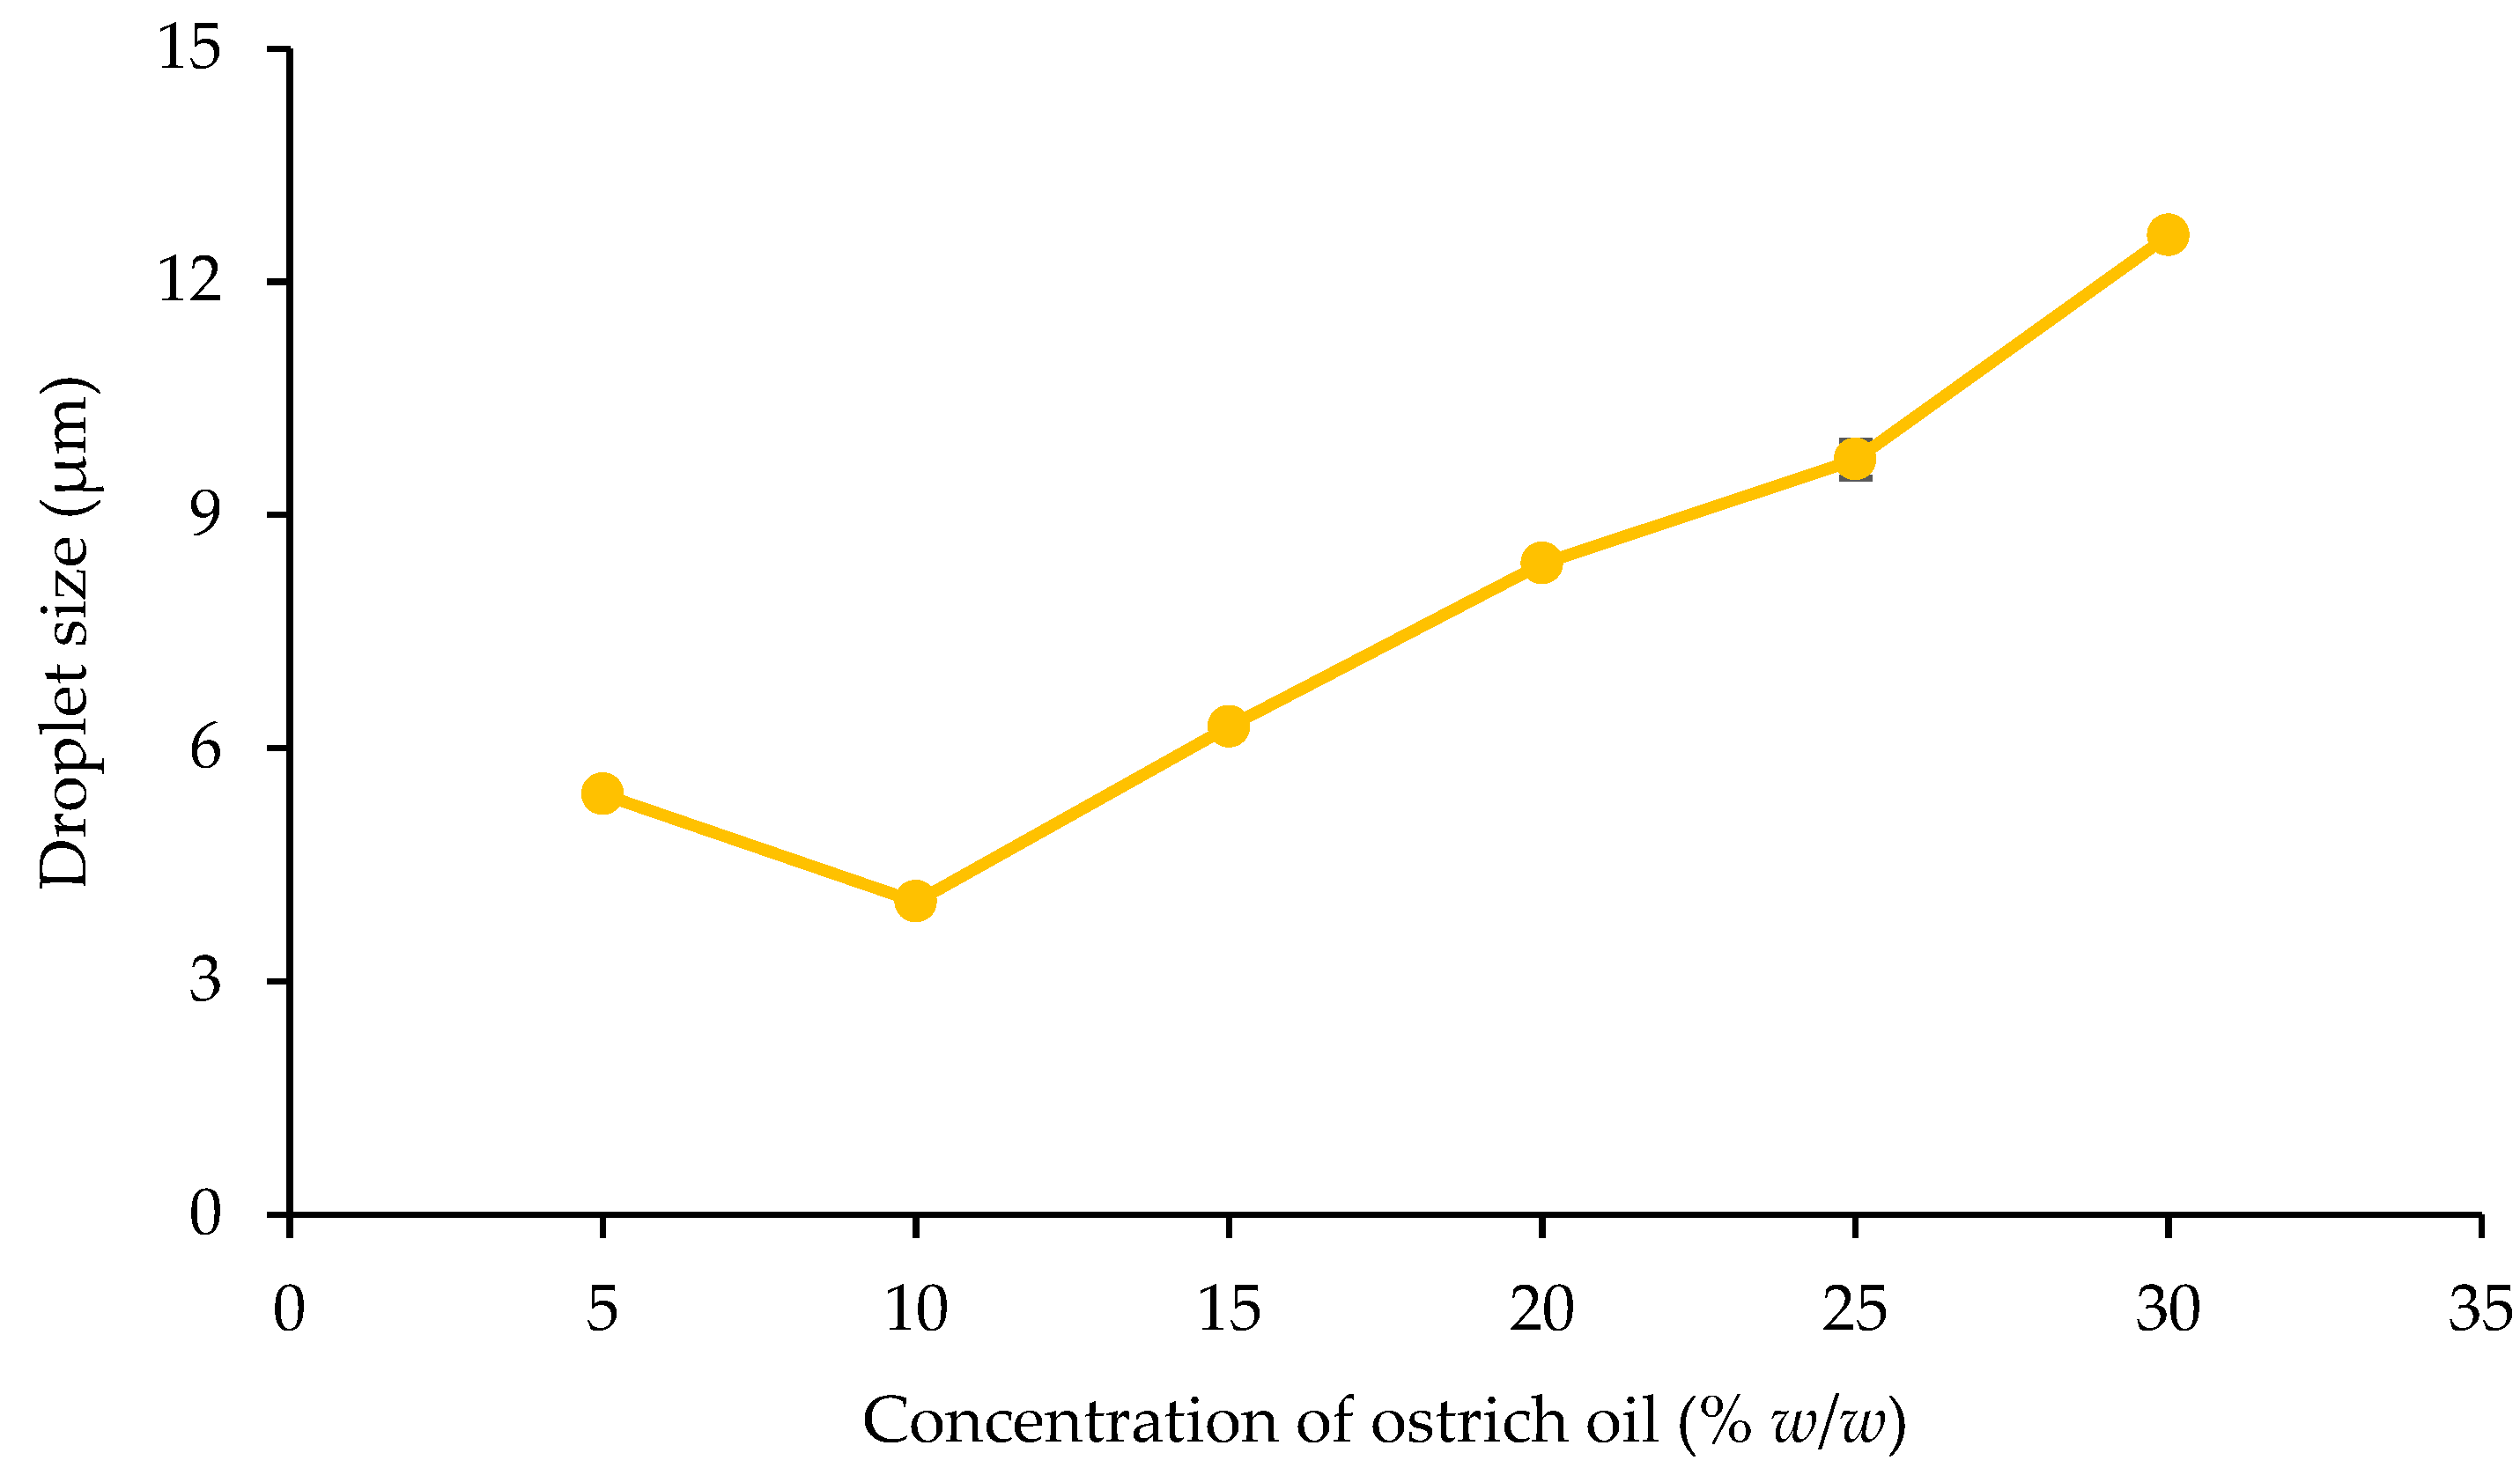
Droplet Size
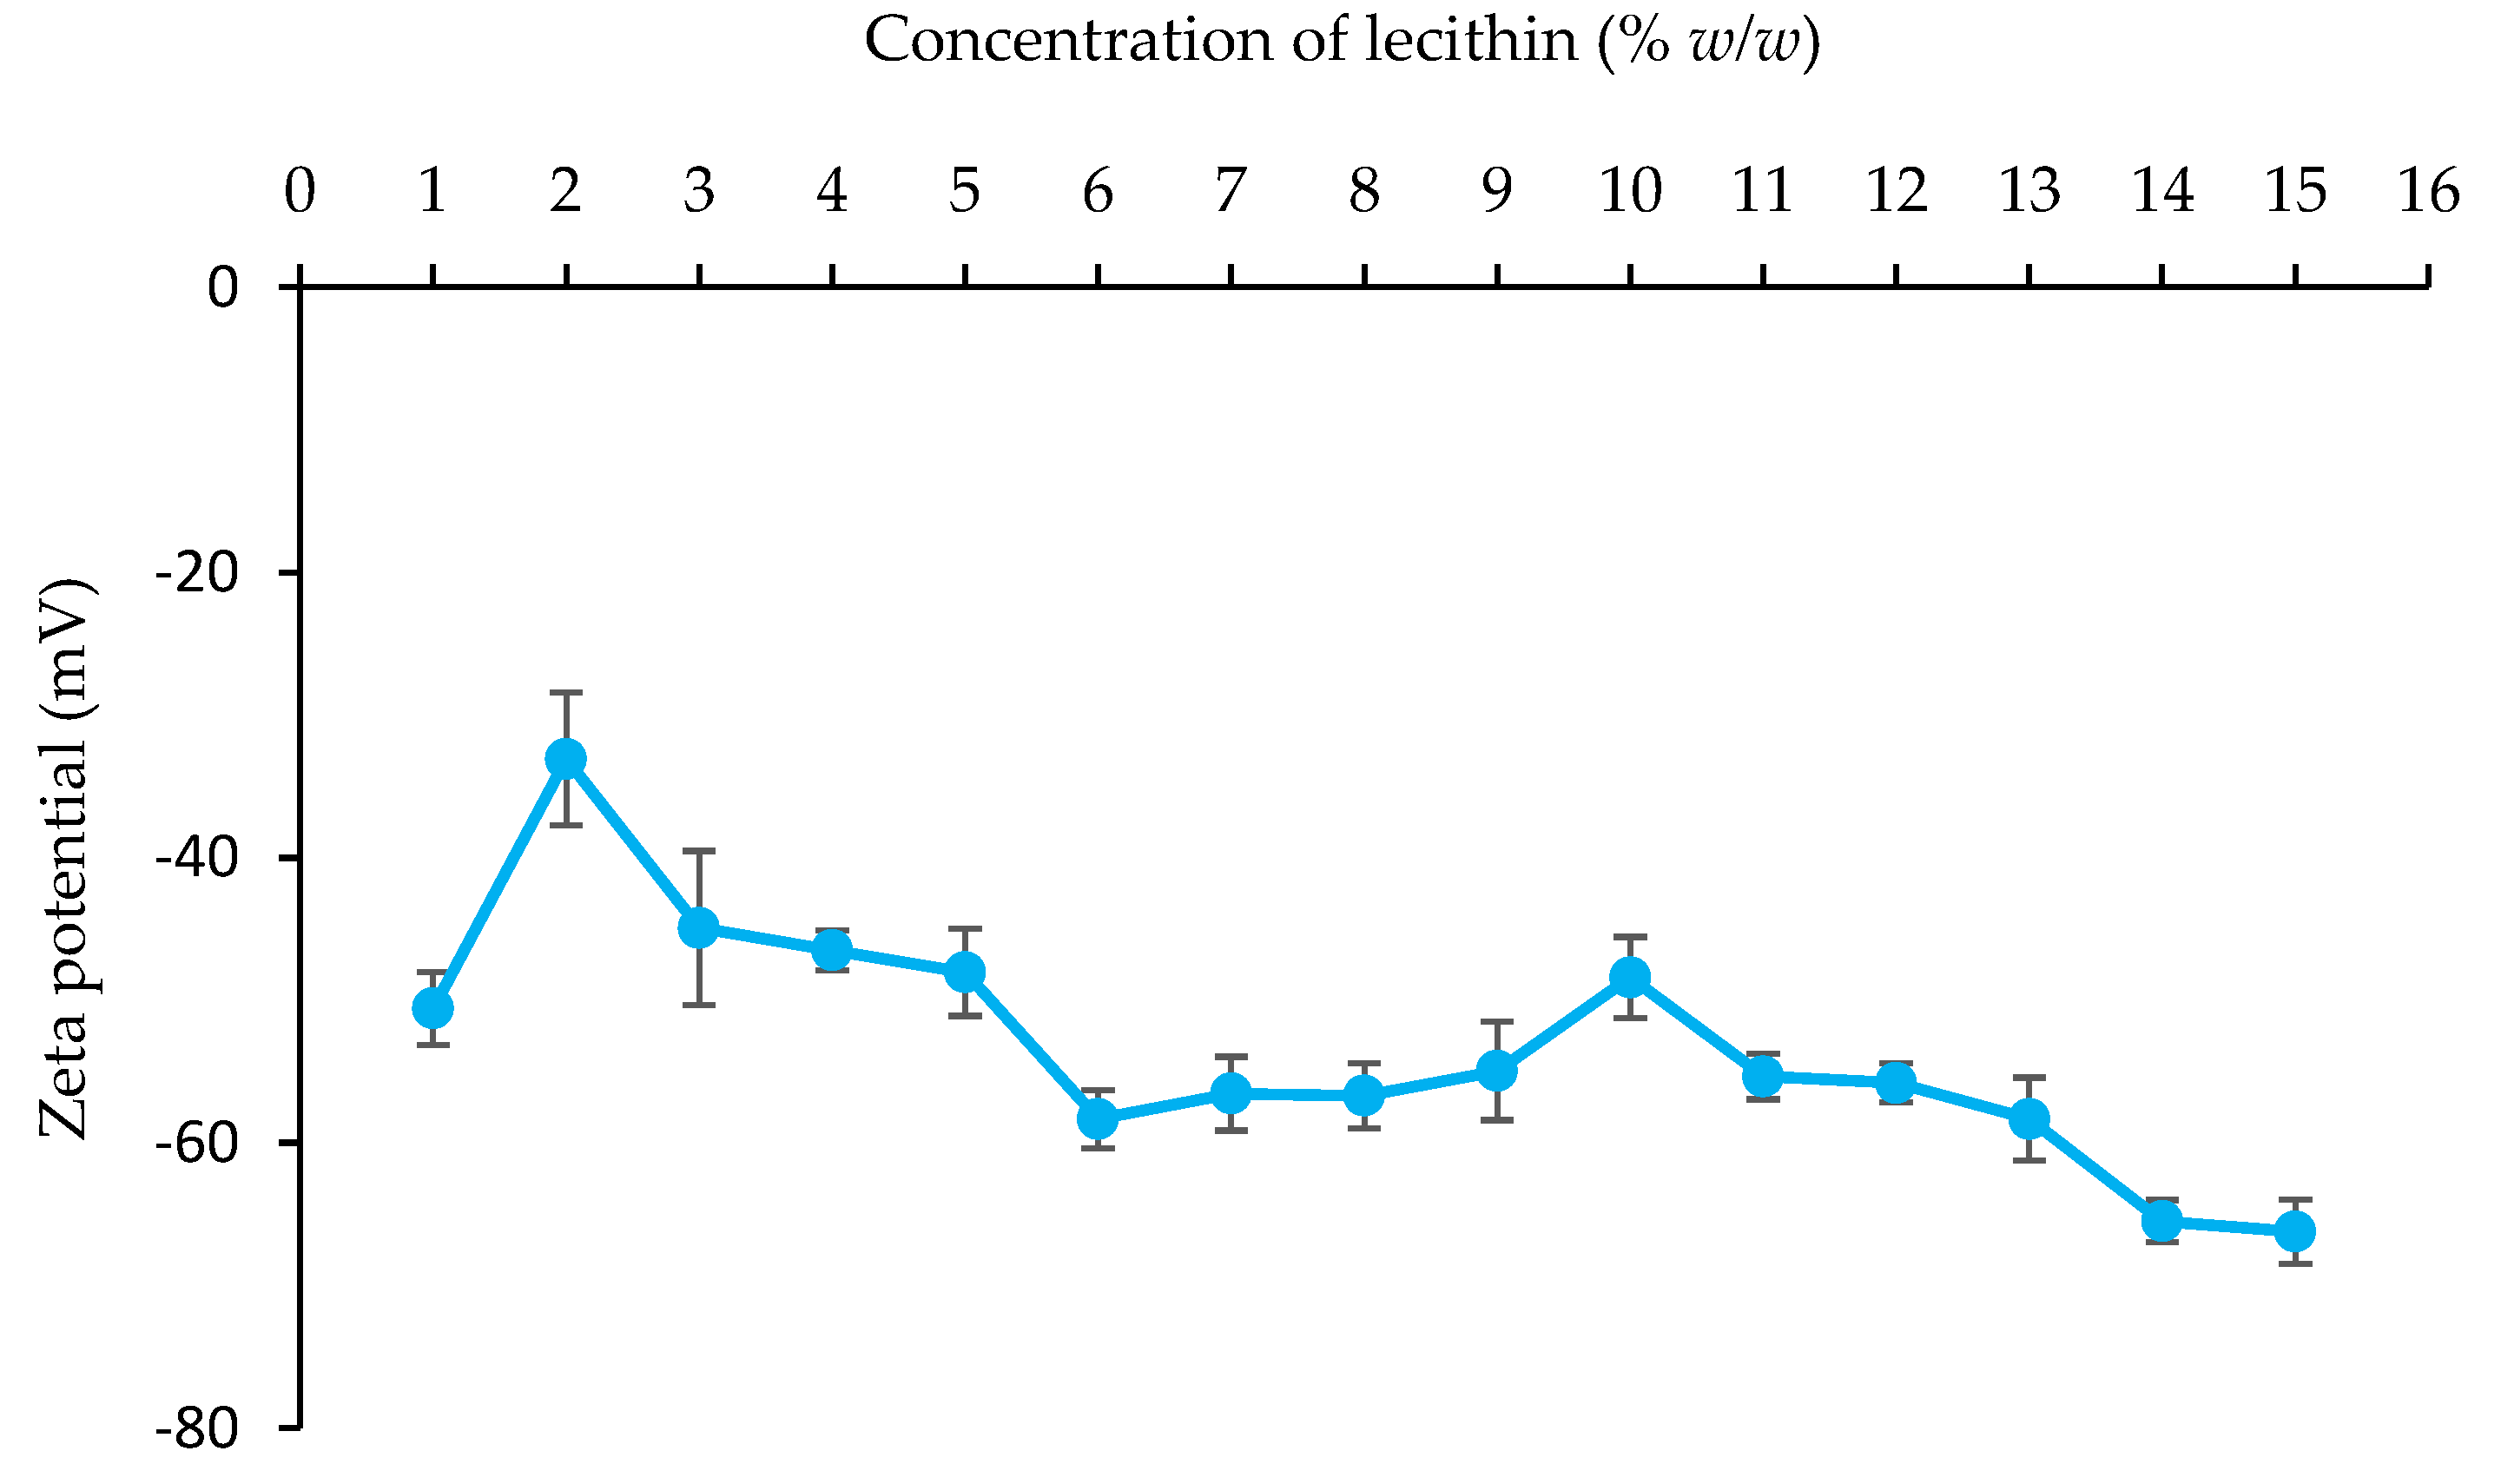
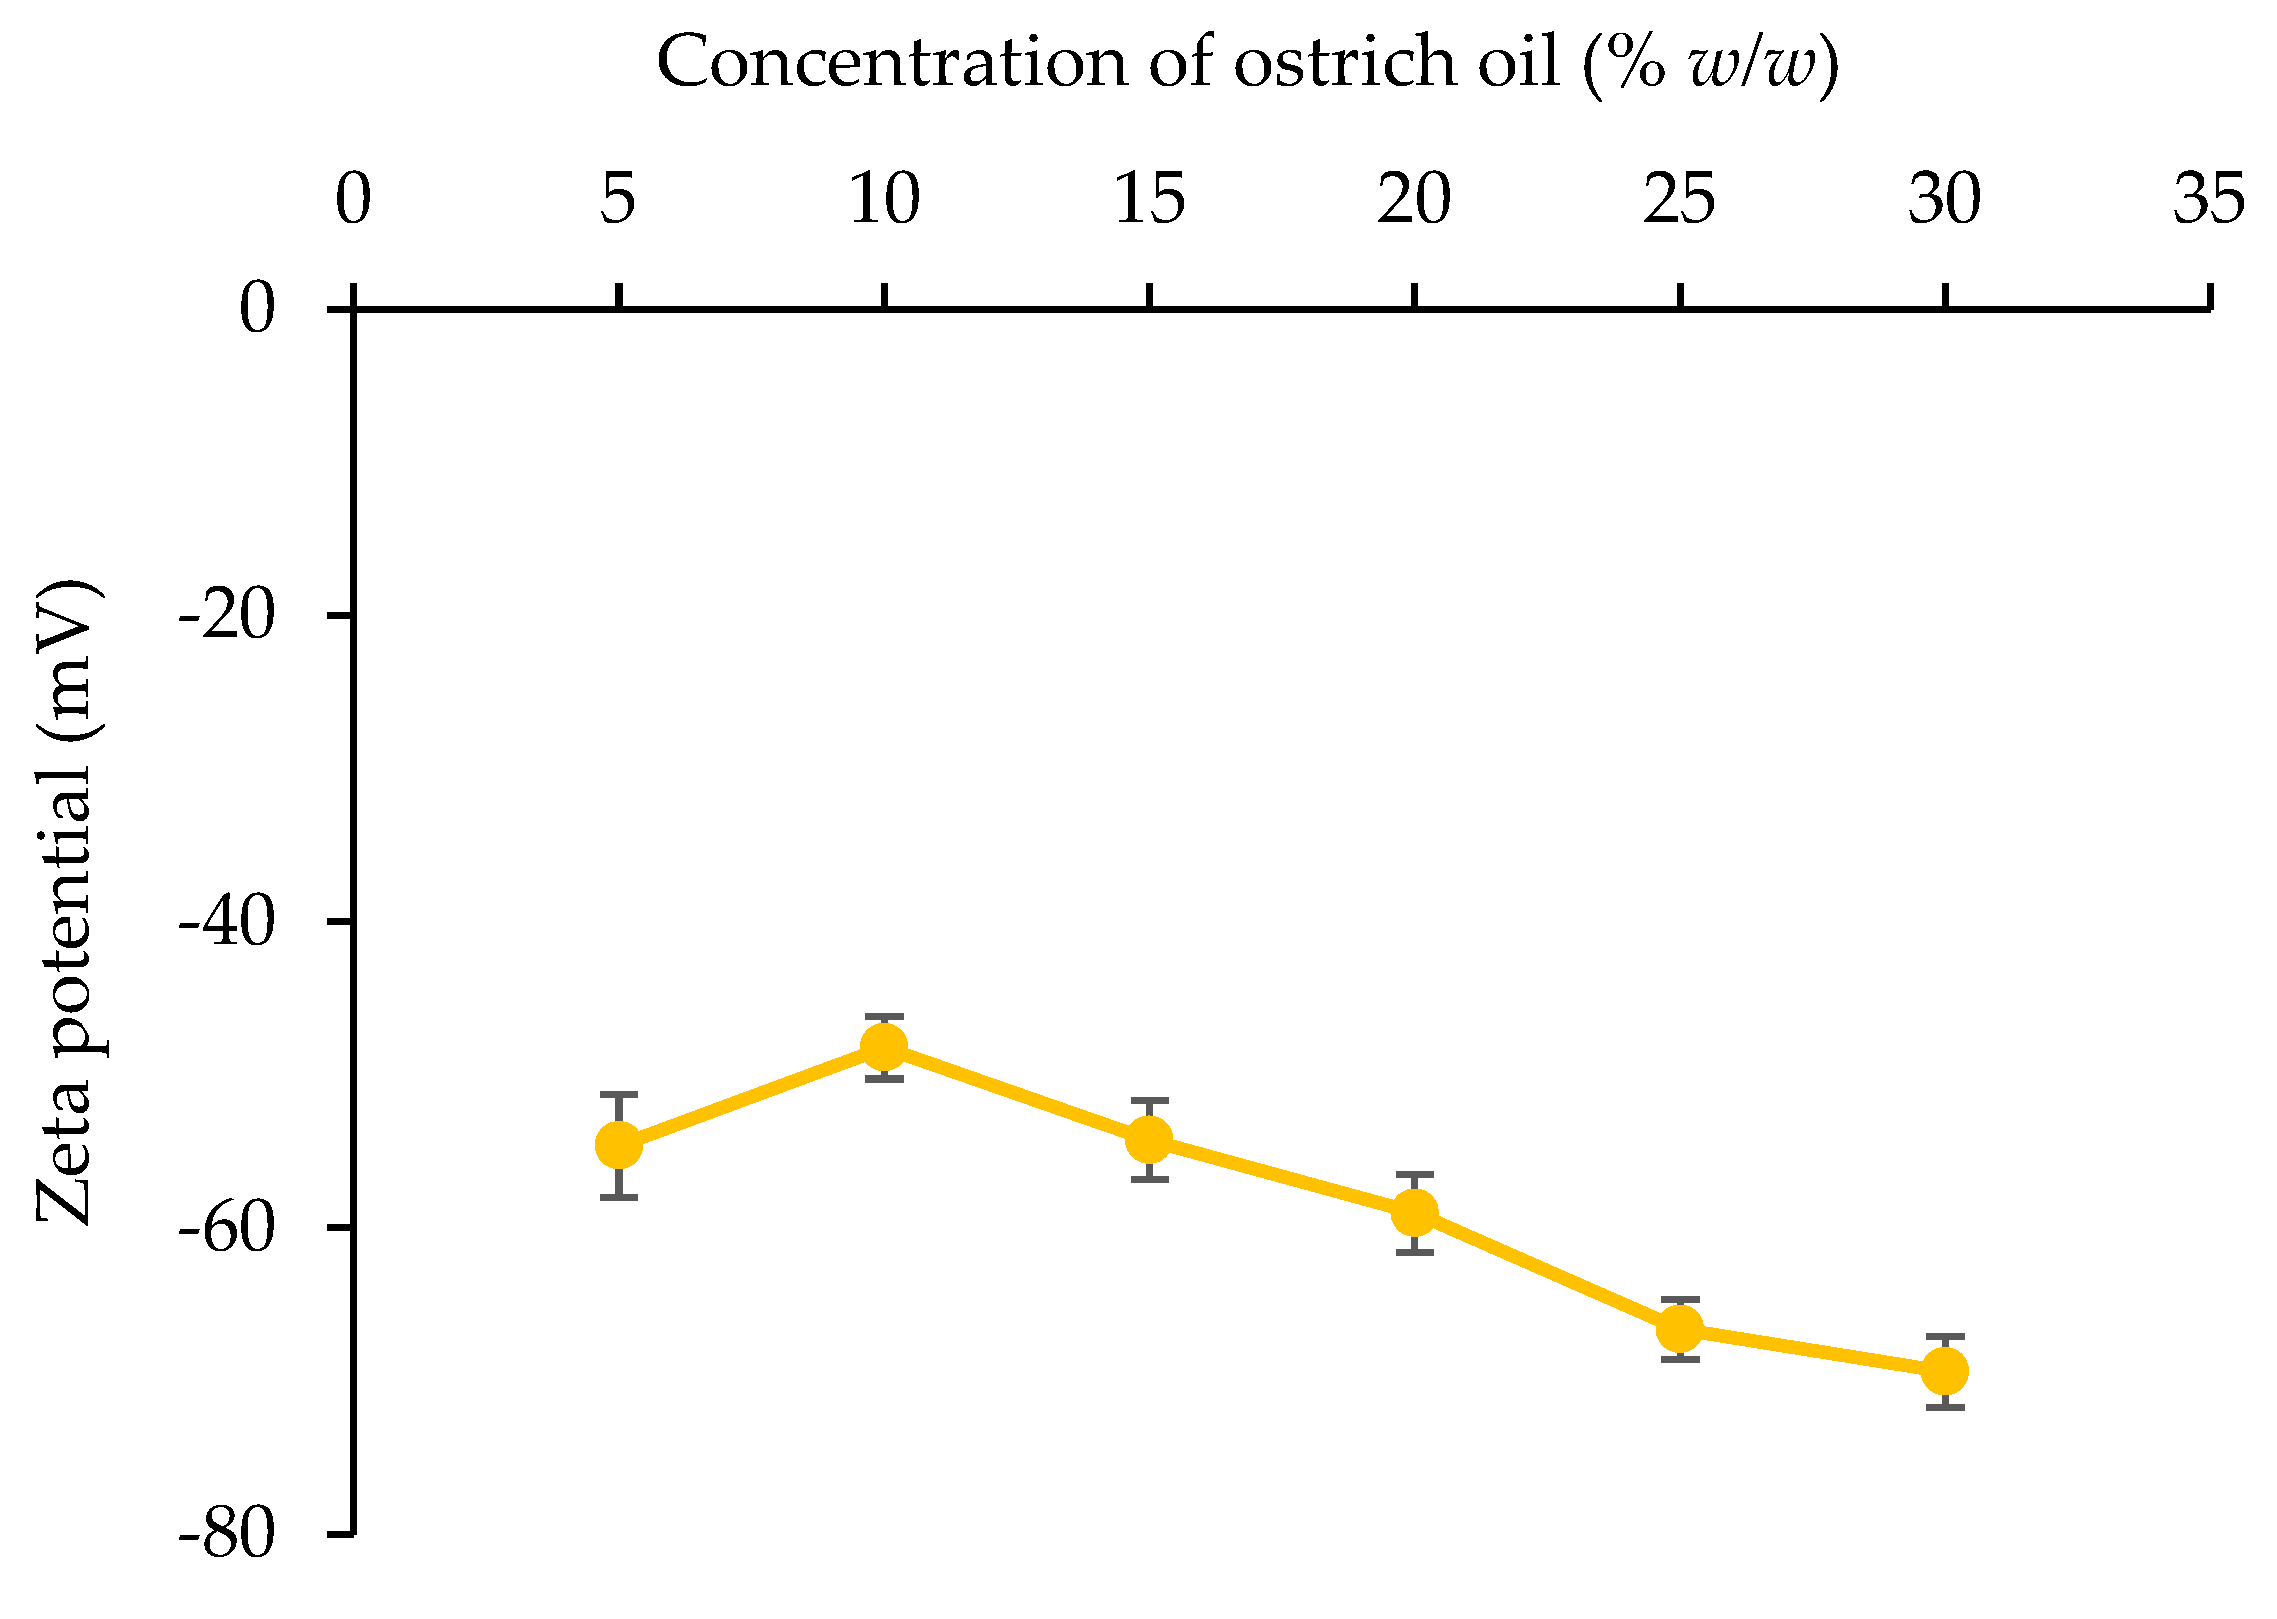
Zeta Potential Value
3.3. Fabrication and Evaluation of Dry Emulsions Containing Ostrich Oil
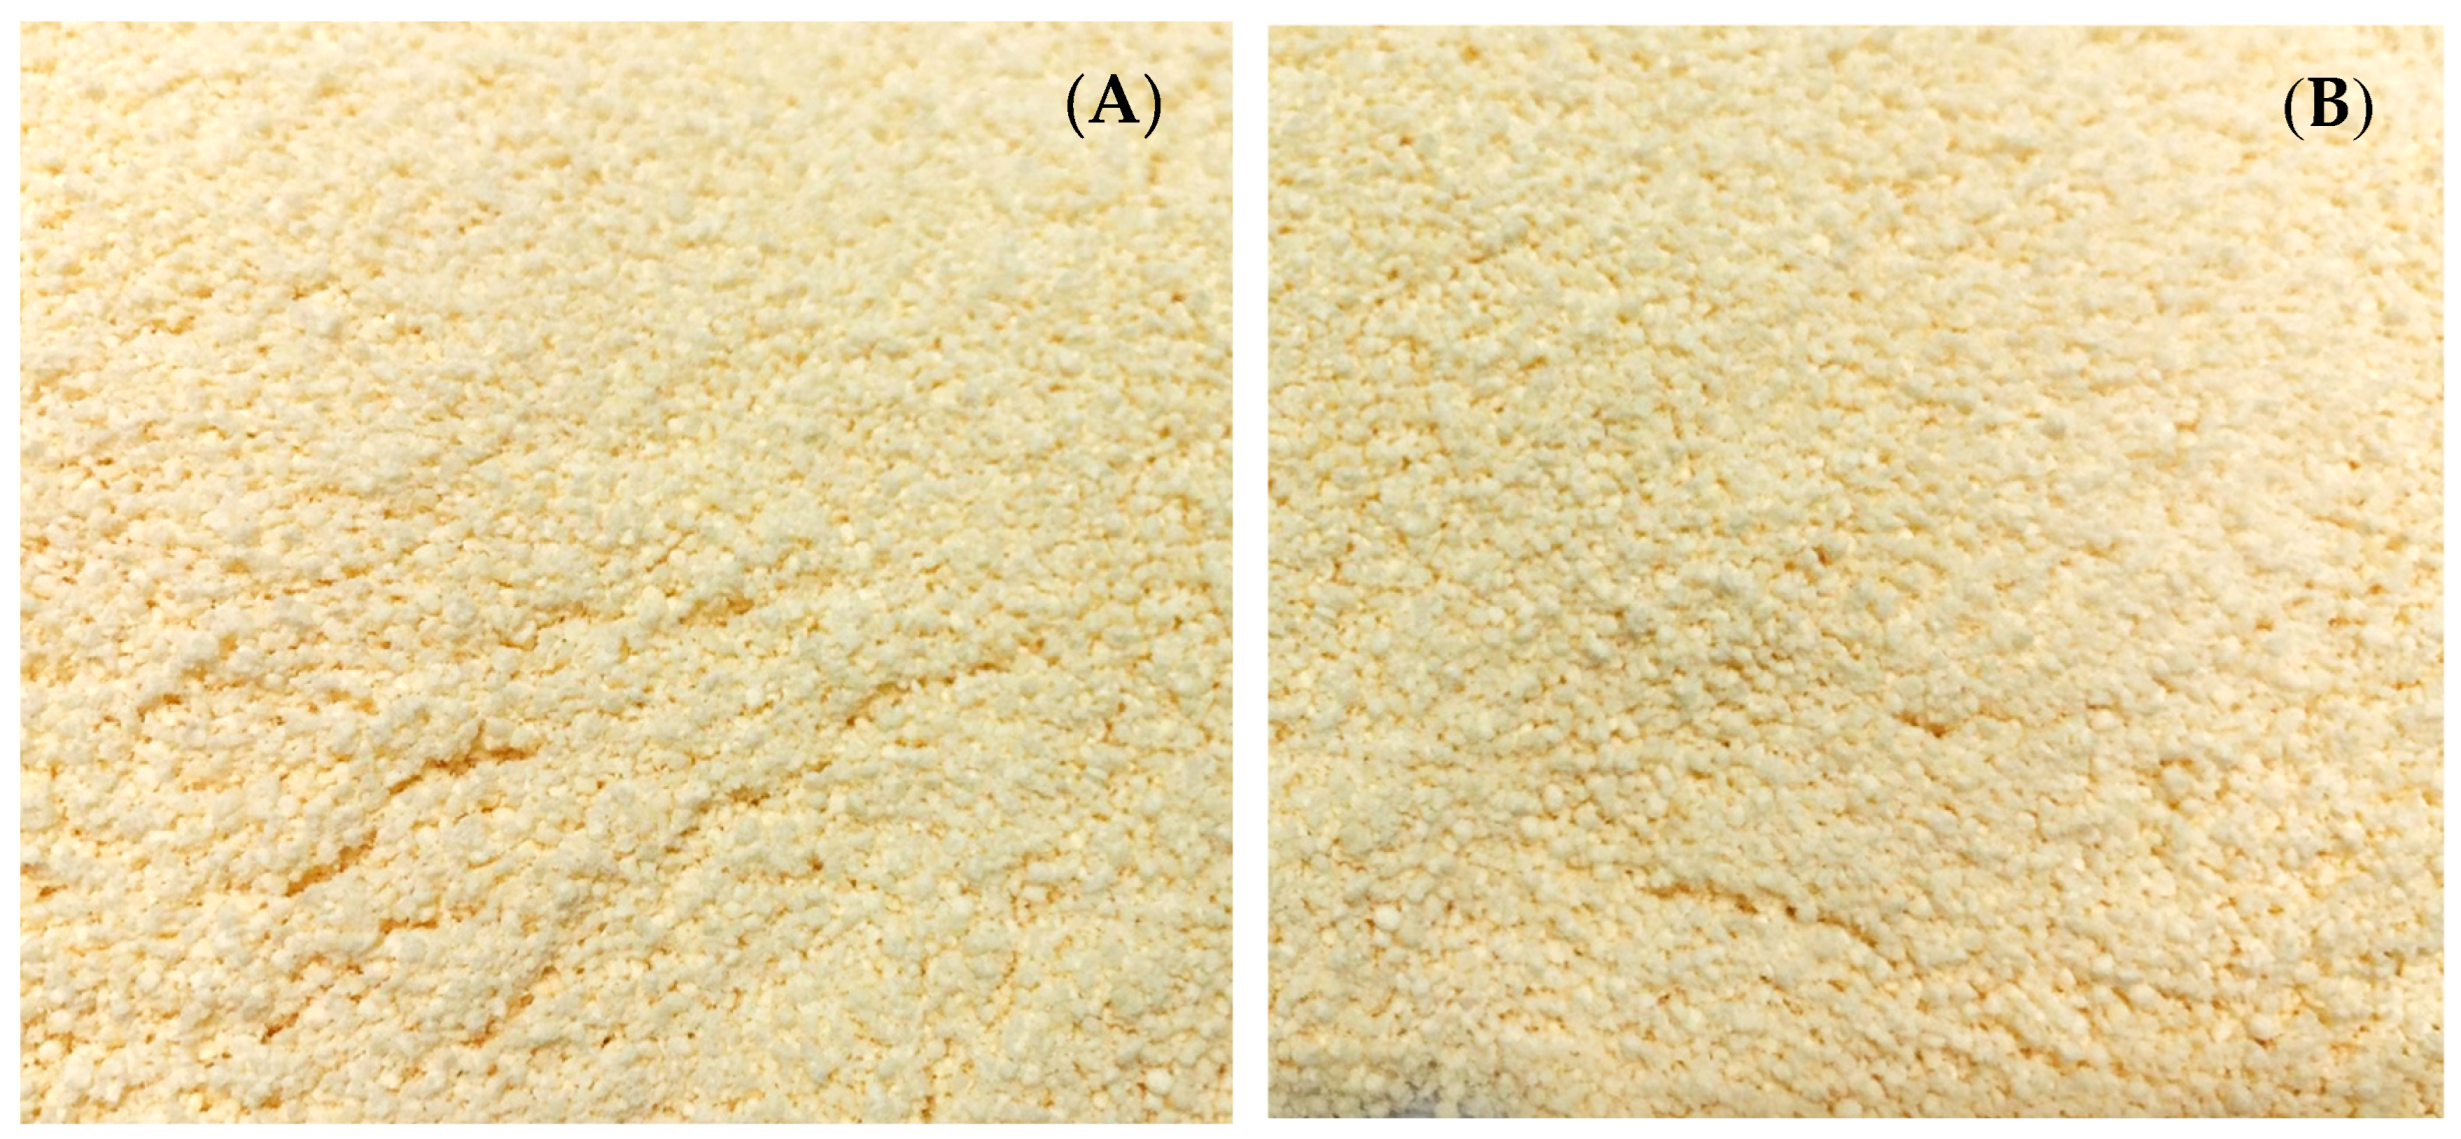
3.3.1. Fabrication of Dry Emulsions
3.3.2. Evaluation of Avicel® PH-101 Granules Containing Ostrich Oil Emulsion
3.4. Stability
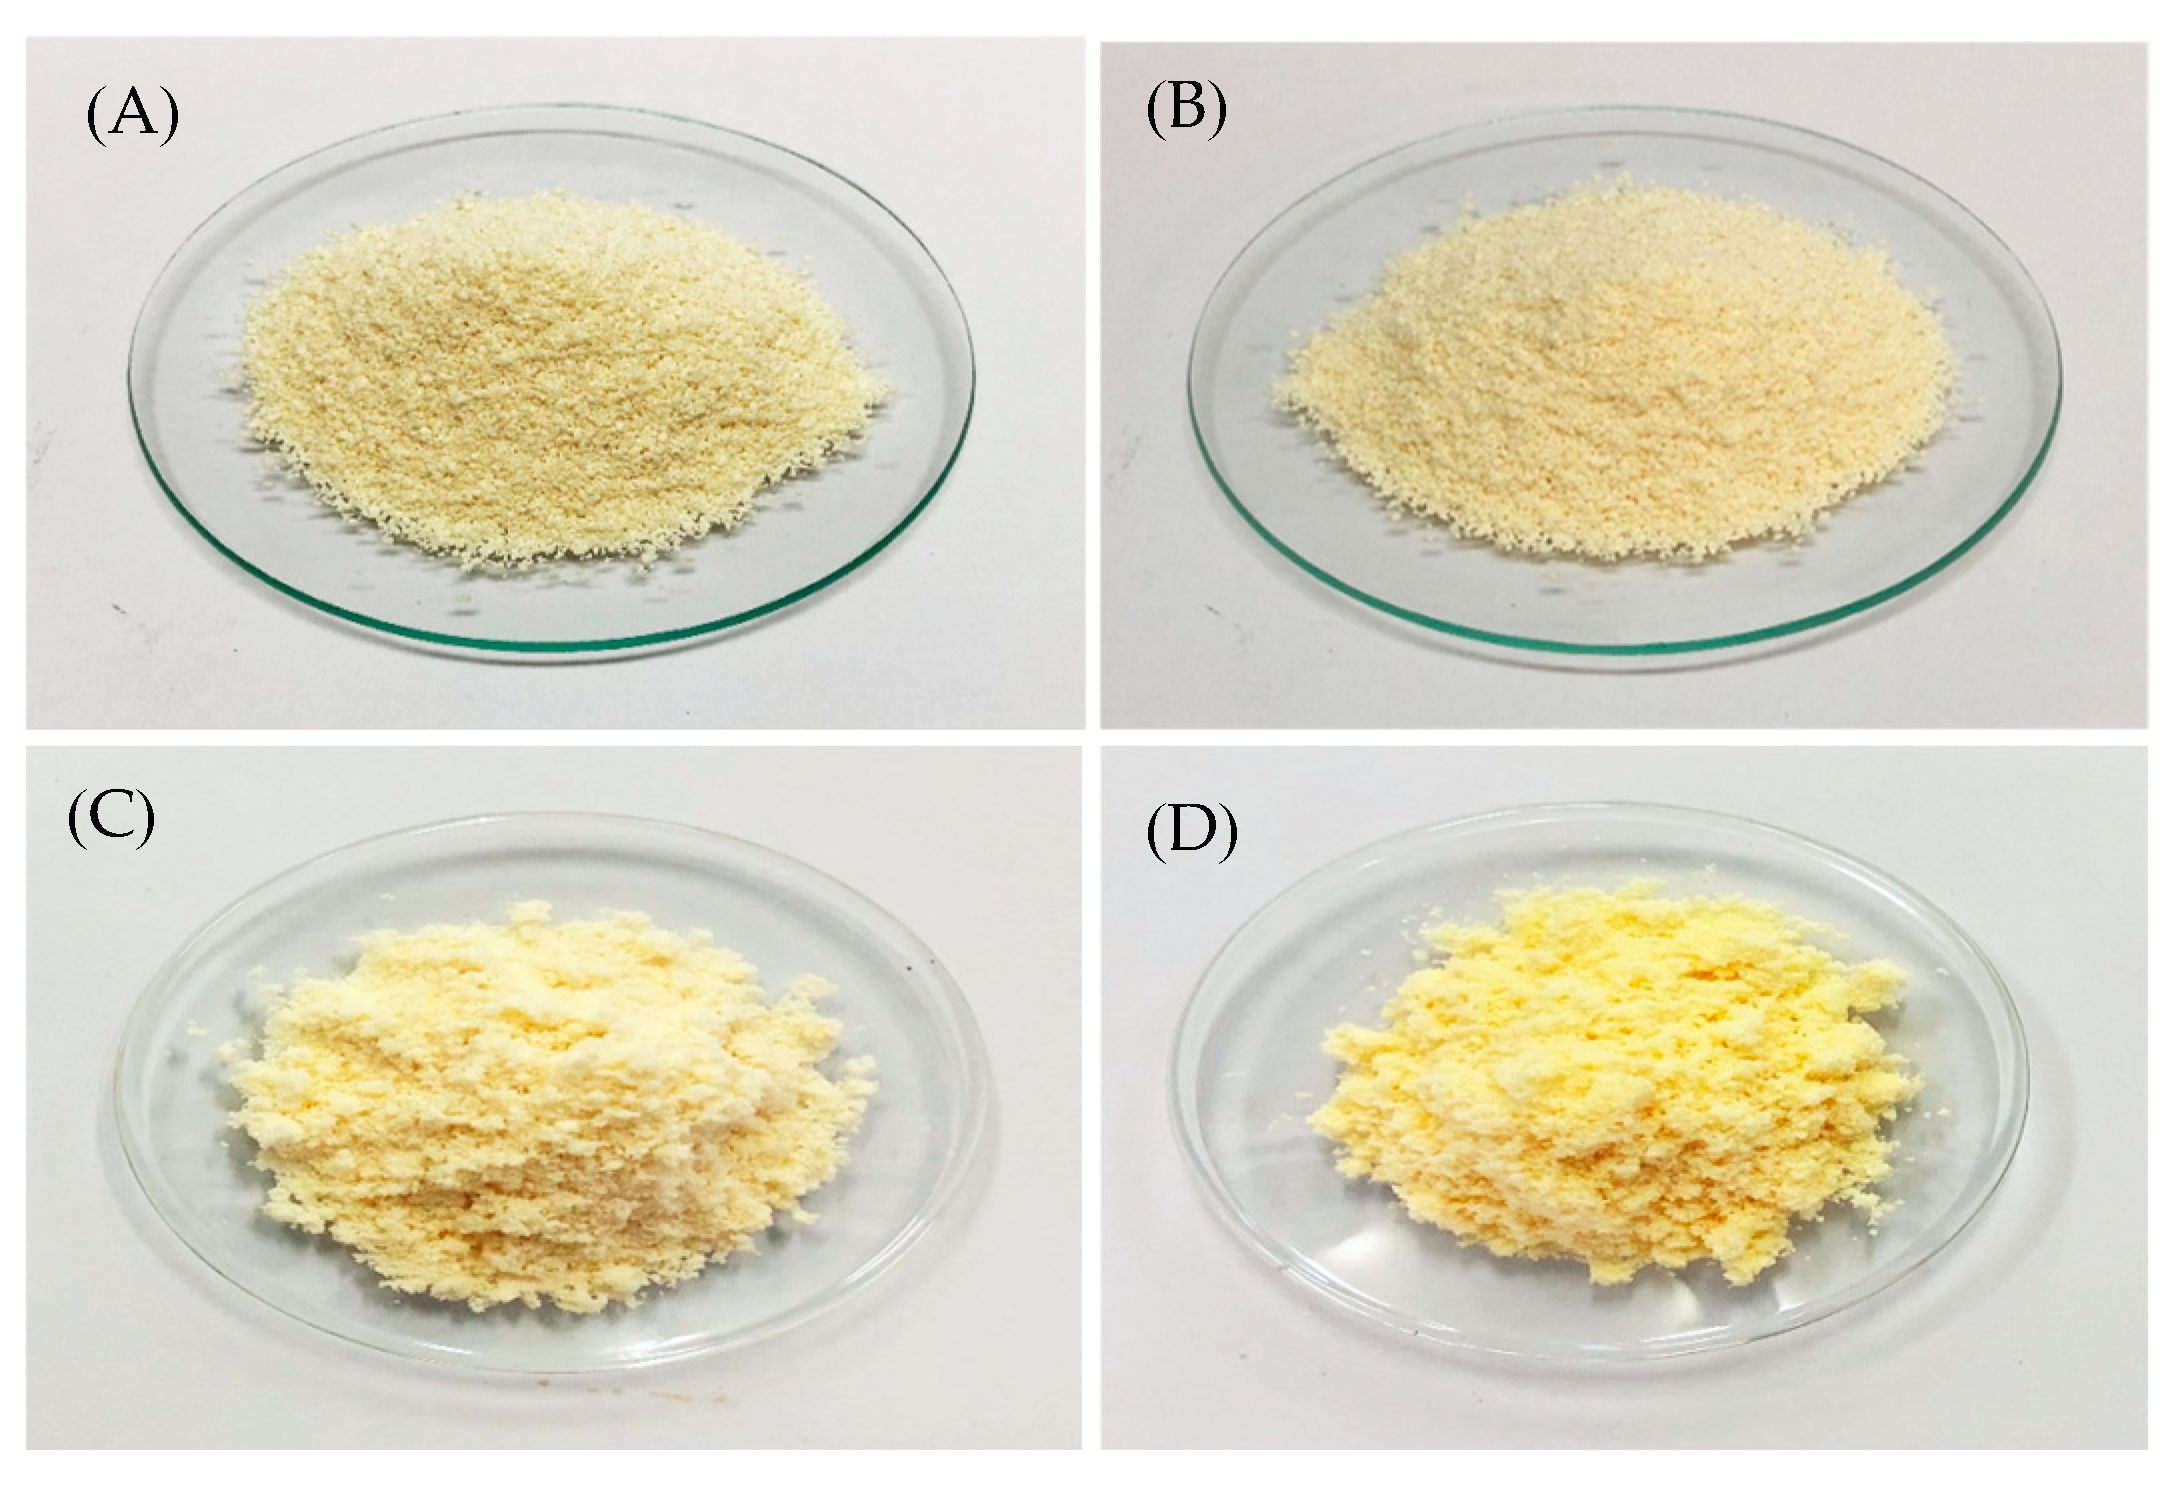
3.4.1. Color and Morphological Stability
3.4.2. Physicochemical Stability
4. Discussion
4.1. Emulsion Formulation and Stability
4.2. Influence of Emulsifier Concentration
4.3. Selection of Edible Adsorbents for Dry Emulsion
4.4. Nutritional and Health Considerations of Ostrich Oil as a Dietary Supplement
5. Conclusions
Author Contributions
Funding
Institutional Review Board Statement
Informed Consent Statement
Data Availability Statement
Conflicts of Interest
References
- Brassó, L.D.; Béri, B.; Komlósi, I. Studies on ostrich (Struthio camelus)—Review. Acta Agrar. Debr. 2020, 1, 15–22. [Google Scholar] [CrossRef]
- Sugihartono, S.; Rahmawati, D.; Radnawati, E.; Priatni, A. Extraction of fat/oil from fleshing by-product using a wet rendering process and combination with organic solvents. MKKP 2019, 35, 7–16. [Google Scholar] [CrossRef]
- Okparanta, S.; Daminabo, V.; Solomon, L. Assessment of rancidity and other physicochemical properties of edible oils (mustard and corn oils) stored at room temperature. J. Food Nutr. Sci. 2018, 6, 70–75. [Google Scholar] [CrossRef]
- Limmatvapirat, C.; Limmatvapirat, S.; Charoenteeraboon, J.; Wessapan, C.; Kumsum, A.; Jenwithayaamornwech, S.; Luangthuwapranit, P. Determination of heavy metals in herbal drinks using ICP-MS. Adv. Mat. Res. 2014, 1060, 199–202. [Google Scholar] [CrossRef]
- Horbańczuk, O.K.; Moczkowska, M.; Marchewka, J.; Atanasov, A.G.; Kurek, M.A. The composition of fatty acids in ostrich meat influenced by the type of packaging and refrigerated storage. Molecules 2019, 24, 4128. [Google Scholar] [CrossRef] [PubMed]
- Belichovska, D.; Hajrulai-Musliu, Z.; Uzunov, R.; Belichovska, K.; Arapcheska, M. Fatty acid composition of ostrich (Struthio camelus) abdominal adipose tissue. Maced. Vet. Rev. 2015, 38, 53–59. [Google Scholar] [CrossRef]
- Simopoulos, A.P. The importance of the ratio of omega-6/omega-3 essential fatty acids. Biomed. Pharmacother. 2002, 56, 365–379. [Google Scholar] [CrossRef] [PubMed]
- Alshahrani, S.M. Preparation, characterization and in vivo anti-inflammatory studies of ostrich oil based nanoemulsion. J. Oleo Sci. 2019, 68, 203–208. [Google Scholar] [CrossRef] [PubMed]
- Ponphaiboon, J.; Limmatvapirat, S.; Limmatvapirat, C. Development and evaluation of a stable oil-in-water emulsion with high ostrich oil concentration for skincare applications. Molecules 2024, 29, 982. [Google Scholar] [CrossRef] [PubMed]
- Scholfield, C.R. Composition of soybean lecithin. J. Am. Oil Chem. Soc. 1981, 58, 889–892. [Google Scholar] [CrossRef]
- Turchiuli, C.; Gallottia, F.; Hernandez-Sancheza, M.R.; Cuveliera, M. Improvement of oxidative stability of dry emulsion containing antioxidants by modifying process conditions. Chem. Eng. Trans. 2017, 57, 1915–1920. [Google Scholar]
- Lu, W.; Maidannyk, V.; Kelly, A.L.; Miao, S. Fabrication and characterization of highly re-dispersible dry emulsions. Food Hydrocoll. 2020, 102, 105617. [Google Scholar] [CrossRef]
- Haritha, M.; Priyanka, M.; Aqther, A.; Neeharika, R.; Kumar, P.B. Dry emulsion: A promising dosage form to deliver lipophilic drug molecules with improved stability and effectiveness. Indian J. Res. Pharm. Biotechnol. 2013, 1, 119–121. [Google Scholar]
- Saigal, N.; Baboota, S.; Ahuja, A.; Ali, J. Microcrystalline cellulose as a versatile excipient in drug research. J. Young Pharm. 2009, 1, 6–12. [Google Scholar]
- Albertini, B.; Passerini, N.; González-Rodríguez, M.L.; Perissutti, B.; Rodriguez, L. Effect of Aerosil® on the properties of lipid controlled release microparticles. J. Control. Release 2004, 100, 233–246. [Google Scholar] [CrossRef]
- Teixé-Roig, J.; Oms-Oliu, G.; Odriozola-Serrano, I.; Martín-Belloso, O. Emulsion-based delivery systems to enhance the functionality of bioactive compounds: Towards the use of ingredients from natural, sustainable sources. Foods 2023, 12, 1502. [Google Scholar] [CrossRef] [PubMed]
- Khan, B.A.; Akhtar, N.; Khan, H.M.S.; Waseem, K.; Mahmood, T.; Rasul, A.; Iqbal, M.; Khan, H. Basics of pharmaceutical emulsions: A review. Afr. J. Pharm. Pharmacol. 2011, 5, 2715–2725. [Google Scholar] [CrossRef]
- Chambin, O.; Bellone, C.; Champion, D.; Rochat-Gonthier, M.H.; Pourcelot, Y. Dry adsorbed emulsion: 1 Characterization of an intricate physicochemical structure. J. Pharm. Sci. 2000, 89, 991–999. [Google Scholar] [CrossRef]
- Ponphaiboon, J.; Limmatvapirat, S.; Chaidedgumjorn, A.; Limmatvapirat, C. Physicochemical property, fatty acid composition, and antioxidant activity of ostrich oils using different rendering methods. LWT-Food Sci. Technol. 2018, 93, 45–50. [Google Scholar] [CrossRef]
- Limmatvapirat, C.; Limmatvapirat, S.; Chansatidkosol, S.; Krongrawa, W.; Liampipat, N.; Leechaiwat, S.; Lamaisri, P.; Siangjong, L.; Meetam, P.; Tiankittumrong, K. Preparation and properties of anti-nail-biting lacquers containing shellac and bitter herbal extract. Int. J. Polym. Sci. 2021, 2021, 8537544. [Google Scholar] [CrossRef]
- Limmatvapirat, C.; Limmatvapirat, S.; Krongrawa, W.; Ponphaiboon, J.; Witchuchai, T.; Jiranuruxwong, P.; Theppitakpong, P.; Pathomcharoensukchai, P. Beef tallow: Extraction, physicochemical property, fatty acid composition, antioxidant activity, and formulation of lotion bars. J. Appl. Pharm. Sci. 2021, 11, 018–028. [Google Scholar] [CrossRef]
- Zhu, L.; Chen, J.; Tang, X.; Xiong, Y.L. Reducing, radical scavenging, and chelation properties of in vitro digests of alcalase-treated zein hydrolysate. J. Agric. Food Chem. 2008, 56, 2714–2721. [Google Scholar] [CrossRef]
- AOCS. Method Cd 3d-63: Acid Value of Fats and Oils; Official methods and recommended practices of the AOCS; American Oil Chemists’ Society: Urbana, IL, USA, 2017. [Google Scholar]
- AOCS. Method Cd 8b-90: Peroxide Value of Fats and Oils, Acetic Acid, Isooctane Method; Official methods and recommended practices of the AOCS; American Oil Chemists’ Society: Urbana, IL, USA, 2017. [Google Scholar]
- AOCS. Method Cd 1d-92: Iodine Value of Fats and Oils, Cyclohexane-Acetic Acid Method, Official methods and recommended practices of the AOCS; American Oil Chemists’ Society: Urbana, IL, USA, 2017.
- AOCS. Method Cd 3-25: Saponification Value of Fats and Oils; Official methods and recommended practices of the AOCS; American Oil Chemists’ Society: Urbana, IL, USA, 2017. [Google Scholar]
- Limmatvapirat, C.; Limmatvapirat, S.; Charoenteeraboon, J.; Wessapan, C.; Kumsum, A.; Jenwithayaamornwech, S.; Luangthuwapranit, P. Comparison of eleven heavy metals in Moringa oleifera Lam. products. Indian J. Pharm. Sci. 2015, 77, 485–490. [Google Scholar] [CrossRef]
- The United States Pharmacopeial Convention. 〈61〉 Microbiological examination of nonsterile products: Microbial enumeration tests. In The United States Pharmacopeia 43 and the National Formulary 38 (USP 43-NF 38); The United States Pharmacopeial Convention: Rockville, MD, USA, 2023. [Google Scholar] [CrossRef]
- Klang, V.; Valenta, C. Lecithin-based nanoemulsions. J. Drug Del. Sci. Tech. 2011, 21, 55–76. [Google Scholar] [CrossRef]
- The United States Pharmacopeial Convention. 〈616〉 Bulk density and tapped density of powders. In The United States Pharmacopeia 43 and the National Formulary 38 (USP 43-NF 38); The United States Pharmacopeial Convention: Rockville, MD, USA, 2023. [Google Scholar] [CrossRef]
- The United States Pharmacopeial Convention. 〈701〉 Disintegration. In The United States Pharmacopeia 43 and the National Formulary 38 (USP 43-NF 38); The United States Pharmacopeial Convention: Rockville, MD, USA, 2023. [Google Scholar] [CrossRef]
- FAO/WHO. Codex Standard for Fats and Oils from Animal Sources, Codex Standard for Named Animal Fats (CODEX-STAN 211-1999), Codex Alimentarius: Fats, Oils and Related Products; Food and Agriculture Organization of the United Nations: Rome, Italy, 2001. [Google Scholar]
- Abdelhadi, O.M.A.; Babiker, S.A.; Bauchart, D.; Listrat, A.; Remond, D.; Hocquette, J.F.; Faye, B. Effect of gender on quality and nutritive value of dromedary camel (Camelus dromedarius) longissimus lumborum muscle. J. Saudi Soc. Agric. Sci. 2017, 16, 242–249. [Google Scholar] [CrossRef]
- Mortensen, A.; Aguilar, F.; Crebelli, R.; Di Domenico, A.; Frutos, M.J.; Galtier, P.; Gott, D.; Gundert-Remy, U.; Lambré, C.; Leblanc, J.; et al. Re-evaluation of lecithins (E 322) as a food additive. EFSA J. 2017, 15, e04742. [Google Scholar] [CrossRef] [PubMed]
- Ramisetty, K.A.; Shyamsunder, R. Effect of ultrasonication on stability of oil in water emulsions. Int. J. Drug Deliv. 2011, 3, 133–142. [Google Scholar] [CrossRef]
- Le, N.T.T.; Cao, V.D.; Nguyen, T.N.Q.; Le, T.T.H.; Tran, T.T.; Thi, T.T.H. Soy lecithin-derived liposomal delivery systems: Surface modification and current applications. Int. J. Mol. Sci. 2019, 20, 4706. [Google Scholar] [CrossRef] [PubMed]
- Fatfat, Z.; Karam, M.; Maatouk, B.; Fahs, D.; Gali-Muhtasib, H. Chapter 7—Nanoliposomes as safe and efficient drug delivery nanovesicles. In Advanced and Modern Approaches for Drug Delivery; Academic Press: Cambridge, MA, USA, 2023; pp. 159–197. [Google Scholar] [CrossRef]
- Van Eerdenbrugh, B.; Froyen, L.; Van Humbeeck, J.; Martens, J.A.; Augustijns, P.; Van Den Mooter, G. Alternative matrix formers for nanosuspension solidification: Dissolution performance and X-ray microanalysis as an evaluation tool for powder dispersion. Eur. J. Pharm. Sci. 2008, 35, 344–353. [Google Scholar] [CrossRef]
- Cho, S.; Lee, J.; Yoo, Y.; Cho, M.; Sohn, S.; Lee, B. Improved manufacturability and in vivo comparative pharmacokinetics of dapagliflozin cocrystals in beagle dogs and human volunteers. Pharmaceutics 2021, 13, 70. [Google Scholar] [CrossRef]
- Pohlen, M.; Pirker, L.; Dreu, R. The potential of macroporous silica-nanocrystalline cellulose combination for formulating dry emulsion systems with improved flow properties: A DoE study. Pharmaceutics 2021, 13, 1177. [Google Scholar] [CrossRef] [PubMed]
- Whitby, C.P. Structuring edible oils with fumed silica particles. Front. Sustain. Food Syst. 2020, 4, 585160. [Google Scholar] [CrossRef]
- The United States Pharmacopeial Convention. 〈1174〉 Powder flow. In The United States Pharmacopeia 43 and the National Formulary 38 (USP 43-NF 38); The United States Pharmacopeial Convention: Rockville, MD, USA, 2023. [Google Scholar] [CrossRef]
- The United States Pharmacopeial Convention. 〈2040〉 Disintegration and dissolution of dietary supplements. In The United States Pharmacopeia 43 and the National Formulary 38 (USP 43-NF 38); The United States Pharmacopeial Convention: Rockville, MD, USA, 2023. [Google Scholar] [CrossRef]
- The United States Pharmacopeial Convention. 〈2232〉 Element contaminants in dietary supplements. In The United States Pharmacopeia 43 and the National Formulary 38 (USP 43-NF 38); The United States Pharmacopeial Convention: Rockville, MD, USA, 2023. [Google Scholar] [CrossRef]
- The United States Pharmacopeial Convention. 〈2023〉 Microbiological attributes of nonsterile nutritional and dietary supplements. In The United States Pharmacopeia 43 and the National Formulary 38 (USP 43-NF 38); The United States Pharmacopeial Convention: Rockville, MD, USA, 2023. [Google Scholar] [CrossRef]
- Palanisamy, U.D.; Sivanathan, M.; Subramaniam, T.; Radhakrishnan, A.K.; Haleagrahara, N.; Sundralingam, U.; Chiew, G.S. Refining ostrich oil and its stabilization with curcumin. J. Nutr. Health Food Eng. 2015, 2, 63–69. [Google Scholar] [CrossRef]
- The United States Pharmacopeial Convention. Fish oil containing omega-3 acids capsules. In The United States Pharmacopeia 43 and the National Formulary 38 (USP 43-NF 38); The United States Pharmacopeial Convention: Rockville, MD, USA, 2023. [Google Scholar] [CrossRef]
- The United States Pharmacopeial Convention. Cod liver oil capsule. In The United States Pharmacopeia 43 and the National Formulary 38 (USP 43-NF 38); The United States Pharmacopeial Convention: Rockville, MD, USA, 2023. [Google Scholar] [CrossRef]
- Global Organization for EPA and DHA (GOED). Voluntary Monograph, Version 8.1; GOED: Salt Lake City, UT, USA, 2022. [Google Scholar]
- Moustiés, C.; Bourlieu-Lacanal, C.; Hemery, Y.M.; Baréa, B.; Villeneuve, P.; Servent, A.; Alter, P.; Lebrun, M.; Laillou, A.; Wieringa, F.T.; et al. Nutritional quality of ready-to-use therapeutic foods: Focus on lipid composition and vitamin content. OCL 2022, 29, 13. [Google Scholar] [CrossRef]
- Basuny, A.M.M.; Arafat, S.M.; Nasef, S.I. Utilization of ostrich oil in foods. Int. Res. J. Biochem. Bioinform. 2011, 2, 199–208. [Google Scholar]
- Lisitsyn, A.B.; Chernukha, I.M.; Lunina, O.I. Fatty acid composition of meat from various animal species and the role of technological factors in transisomerization of fatty acids. Food Raw Mater. 2017, 5, 54–61. [Google Scholar] [CrossRef]
- Poławska, E.; Zdanowska-Sąsiadek, Ż.; Horbańczuk, J.O.; Pomianowski, J.; Jóźwik, A.; Tolik, D.; Ras, K.; De Smet, S. Effect of dietary organic and inorganic selenium supplementation on chemical, mineral and fatty acid composition of ostrich meat. CyTa-J. Food 2016, 14, 84–87. [Google Scholar] [CrossRef]
- Basuny, A.; Arafat, S.; Soliman, H. Biological evaluation of ostrich oil and its using for production of biscuit. Egypt. J. Chem. 2017, 60, 1091–1099. [Google Scholar] [CrossRef]


| Formulation | Lecithin (% w/w) | Distilled Water (% w/w) | Ostrich Oil (% w/w) | % Creaming Index (% CI) | ||
|---|---|---|---|---|---|---|
| Day 1 | Day 3 | Day 7 | ||||
| L01 | 1 | 89 | 10 | 78.38 | 78.38 | 77.78 |
| L02 | 2 | 88 | 10 | 80.56 | 80.56 | 80.56 |
| L03 | 3 | 87 | 10 | 77.78 | 75.68 | 72.22 |
| L04 | 4 | 86 | 10 | 0.00 | 78.38 | 76.32 |
| L05 | 5 | 85 | 10 | 0.00 | 0.00 | 0.00 |
| L06 | 6 | 84 | 10 | 0.00 | 0.00 | 0.00 |
| L07 | 7 | 83 | 10 | 0.00 | 0.00 | 0.00 |
| L08 | 8 | 82 | 10 | 0.00 | 0.00 | 0.00 |
| L09 | 9 | 81 | 10 | 0.00 | 0.00 | 0.00 |
| L10 | 10 | 80 | 10 | 0.00 | 0.00 | 0.00 |
| L11 | 11 | 79 | 10 | 0.00 | 0.00 | 0.00 |
| L12 | 12 | 78 | 10 | 0.00 | 0.00 | 0.00 |
| L13 | 13 | 77 | 10 | 0.00 | 0.00 | 0.00 |
| L14 | 14 | 76 | 10 | 0.00 | 0.00 | 0.00 |
| L15 | 15 | 75 | 10 | 0.00 | 0.00 | 0.00 |
| Formulation | Lecithin (% w/w) | Distilled Water (% w/w) | Ostrich Oil (% w/w) | % Creaming Index (% CI) | ||
|---|---|---|---|---|---|---|
| Day 1 | Day 3 | Day 7 | ||||
| O-05 | 10 | 85 | 5 | 0.00 | 0.00 | 0.00 |
| O-10 | 10 | 80 | 10 | 0.00 | 0.00 | 0.00 |
| O-15 | 10 | 75 | 15 | 0.00 | 0.00 | 0.00 |
| O-20 | 10 | 70 | 20 | 0.00 | 0.00 | 0.00 |
| O-25 | 10 | 65 | 25 | 0.00 | 0.00 | 0.00 |
| O-30 | 10 | 60 | 30 | 0.00 | 0.00 | 0.00 |
| Color Components | Dry Emulsions | |
|---|---|---|
| Avicel® PH-101 | Aerosil® 200 | |
| Granule color | ||
| L* | 92.48 ± 0.43 | 92.55 ± 0.37 |
| a* | −0.32 ± 0.07 | −0.47 ± 0.10 |
| b* | 18.44 ± 0.16 | 18.60 ± 0.12 |
| Avicel® PH-101 Granules Containing Ostrich Oil Emulsion | Cycle | L* | a* | b* | ∆E |
|---|---|---|---|---|---|
| With BHT | 0 | 92.37 ± 0.47 | −0.64 ± 0.17 | 18.32 ± 0.26 | |
| 6 | 92.23 ± 0.27 | −0.63 ± 0.10 | 18.38 ± 0.62 | 0.15 | |
| Without BHT | 0 | 92.34 ± 0.43 | −0.68 ± 0.10 | 18.29 ± 0.16 | |
| 6 | 92.17 ± 0.45 | −0.62 ± 0.07 | 18.24 ± 0.37 | 0.19 |
| Ostrich Oil—Avicel®101 Granules | Day | L* | a* | b* | ∆E |
|---|---|---|---|---|---|
| With BHT Stored at 4 °C | 0 | 92.37 ± 0.47 | −0.67 ± 0.18 | 18.32 ± 0.26 | |
| 30 | 92.37 ± 0.42 | −0.64 ± 0.08 | 18.10 ± 0.24 | 0.22 | |
| 90 | 92.37 ± 0.39 | −0.67 ± 0.11 | 18.10 ± 0.32 | 0.22 | |
| 180 | 92.37 ± 0.70 | −0.63 ± 0.12 | 18.14 ± 0.21 | 0.18 | |
| With BHT Stored at 25 °C | 0 | 92.37 ± 0.47 | −0.64 ± 0.17 | 18.32 ± 0.26 | |
| 30 | 92.30 ± 0.72 | −0.67 ± 0.07 | 18.09 ± 0.19 | 0.24 | |
| 90 | 92.13 ± 0.16 | −0.62 ± 0.03 | 18.06 ± 0.24 | 0.35 | |
| 180 | 92.00 ± 0.17 | −0.62 ± 0.09 | 18.22 ± 0.11 | 0.38 | |
| With BHT Stored at 45 °C | 0 | 92.37 ± 0.47 | −0.64 ± 0.17 | 18.32 ± 0.26 | |
| 30 | 91.66 ± 0.10 | 0.58 ± 0.07 | 19.15 ± 0.38 | 1.64 | |
| 90 | 89.88 ± 0.34 | 1.48 ± 0.13 | 20.92 ± 0.26 | 4.18 | |
| 180 | 88.51 ± 0.21 | 2.36 ± 0.17 | 23.95 ± 0.06 | 7.46 | |
| Without BHT Stored at 4 °C | 0 | 92.34 ± 0.43 | −0.68 ± 0.10 | 18.29 ± 0.16 | |
| 30 | 92.31 ± 0.78 | −0.64 ± 0.13 | 18.23 ± 0.32 | 0.08 | |
| 90 | 92.38 ± 0.17 | −0.64 ± 0.16 | 18.10 ± 0.15 | 0.20 | |
| 180 | 92.09 ± 0.19 | −0.62 ± 0.13 | 18.13 ± 0.07 | 0.30 | |
| Without BHT Stored at 25 °C | 0 | 92.34 ± 0.43 | −0.64 ± 0.11 | 18.29 ± 0.16 | |
| 30 | 92.22 ± 0.69 | −0.42 ± 0.14 | 18.10 ± 0.11 | 0.31 | |
| 90 | 91.96 ± 0.15 | −0.48 ± 0.15 | 18.12 ± 0.26 | 0.45 | |
| 180 | 91.93 ± 0.08 | −0.44 ± 0.17 | 18.01 ± 0.14 | 0.54 | |
| Without BHT Stored at 45 °C | 0 | 92.34 ± 0.43 | −0.64 ± 0.11 | 18.29 ± 0.16 | |
| 30 | 91.07 ± 0.18 | 0.62 ± 0.45 | 21.38 ± 0.05 | 3.57 | |
| 90 | 87.76 ± 0.67 | 3.64 ± 0.17 | 27.55 ± 0.13 | 11.18 | |
| 180 | 83.13 ± 0.22 | 6.41 ± 0.06 | 34.55 ± 0.23 | 19.97 |
| Sample | Storage Temperature (°C) | AV (mg NaOH/g Sample) | PV (mEq O2/kg Sample) | ||||||
|---|---|---|---|---|---|---|---|---|---|
| Initial | 1 Month | 3 Months | 6 Months | Initial | 1 Month | 3 Months | 6 Months | ||
| Dry emulsion with BHT | 4 °C | 0.08 ± 0.01 | 0.10 ± 0.01 | 0.09 ± 0.01 | 0.09 ± 0.01 | 0.90 ± 0.01 | 1.00 ± 0.01 | 1.00 ± 0.01 | 1.00 ± 0.01 |
| 25 °C | 0.10 ± 0.01 | 0.09 ± 0.01 | 0.08 ± 0.01 | 1.00 ± 0.01 | 1.10 ± 0.02 | 1.10 ± 0.02 | |||
| 45 °C | 0.10 ± 0.01 | 0.12 ± 0.01 | 0.19 ± 0.02 | 1.05 ± 0.01 | 1.53 ± 0.02 | 2.51 ± 0.02 | |||
| Dry emulsion without BHT | 4 °C | 0.08 ± 0.01 | 0.10 ± 0.01 | 0.09 ± 0.01 | 0.09 ± 0.01 | 0.90 ± 0.01 | 1.01 ± 0.02 | 1.15 ± 0.01 | 1.80 ± 0.02 |
| 25 °C | 0.10 ± 0.01 | 0.11 ± 0.02 | 0.14 ± 0.02 | 1.01 ± 0.01 | 1.45 ± 0.02 | 2.80 ± 0.02 | |||
| 45 °C | 0.12 ± 0.02 | 0.14 ± 0.02 | 0.30 ± 0.02 | 1.60 ± 0.01 | 4.09 ± 0.02 | 5.82 ± 0.04 | |||
| Ostrich oil With BHT | 4 °C | 0.07 ± 0.01 | 0.10 ± 0.01 | 0.09 ± 0.01 | 0.09 ± 0.01 | 0.80 ± 0.02 | 0.80 ± 0.01 | 0.80 ± 0.01 | 1.00 ± 0.01 |
| 25 °C | 0.10 ± 0.01 | 0.09 ± 0.02 | 0.08 ± 0.01 | 0.08 ± 0.01 | 1.05 ± 0.01 | 1.10 ± 0.02 | |||
| 45 °C | 0.10 ± 0.02 | 0.12 ± 0.01 | 0.15 ± 0.02 | 0.95 ± 0.02 | 1.40 ± 0.02 | 2.31 ± 0.03 | |||
| Ostrich oil Without BHT | 4 °C | 0.07 ± 0.01 | 0.10 ± 0.01 | 0.09 ± 0.01 | 0.09 ± 0.01 | 0.80 ± 0.01 | 0.80 ± 0.01 | 1.00 ± 0.01 | 1.80 ± 0.01 |
| 25 °C | 0.10 ± 0.01 | 0.11 ± 0.02 | 0.14 ± 0.01 | 0.90 ± 0.02 | 1.10 ± 0.02 | 2.65 ± 0.01 | |||
| 45 °C | 0.12 ± 0.02 | 0.13 ± 0.01 | 0.22 ± 0.02 | 1.50 ± 0.01 | 2.24 ± 0.03 | 5.61 ± 0.01 | |||
Disclaimer/Publisher’s Note: The statements, opinions and data contained in all publications are solely those of the individual author(s) and contributor(s) and not of MDPI and/or the editor(s). MDPI and/or the editor(s) disclaim responsibility for any injury to people or property resulting from any ideas, methods, instructions or products referred to in the content. |
© 2024 by the authors. Licensee MDPI, Basel, Switzerland. This article is an open access article distributed under the terms and conditions of the Creative Commons Attribution (CC BY) license (https://creativecommons.org/licenses/by/4.0/).
Share and Cite
Ponphaiboon, J.; Limmatvapirat, S.; Limmatvapirat, C. Development and Evaluation of a Dry Emulsion of Ostrich Oil as a Dietary Supplement. Foods 2024, 13, 2570. https://doi.org/10.3390/foods13162570
Ponphaiboon J, Limmatvapirat S, Limmatvapirat C. Development and Evaluation of a Dry Emulsion of Ostrich Oil as a Dietary Supplement. Foods. 2024; 13(16):2570. https://doi.org/10.3390/foods13162570
Chicago/Turabian StylePonphaiboon, Juthaporn, Sontaya Limmatvapirat, and Chutima Limmatvapirat. 2024. "Development and Evaluation of a Dry Emulsion of Ostrich Oil as a Dietary Supplement" Foods 13, no. 16: 2570. https://doi.org/10.3390/foods13162570