Article

Characterizing the Contribution of Strain Specificity to the Microbiota Structure and Metabolites of Muqu and Fresh High-Temperature Daqu

College of Biomass Science and Engineering, Sichuan University, Chengdu 610065, China
*
Author to whom correspondence should be addressed.
Foods 2024, 13(19), 3098; https://doi.org/10.3390/foods13193098
Submission received: 24 August 2024 / Revised: 24 September 2024 / Accepted: 26 September 2024 / Published: 27 September 2024
(This article belongs to the Special Issue Food Quality Control: Microbial Diversity and Metabolic Regulation)

Abstract

:
In this study, the differences in physicochemical properties, microbial community structure, and metabolic characteristics between various fortified Muqu and their corresponding high-temperature Daqu (HTD) were investigated using multiphase detection methods. The results demonstrated that the physicochemical properties, community structure, dominant bacterial composition, and metabolic components varied significantly among the different types of fortified HTD. The differences between HTDs became more pronounced when fortified HTD was used as Muqu. Compared to HTD, Muqu exhibited a more complex volatile profile, while HTD contained higher levels of characteristic non-volatile components. The cultivable bacteria count in Muqu was significantly higher than that in HTD, while the cultivable fungi count was slightly lower than that in HTD. The fungal profiles in HTD were primarily associated with starch hydrolysis and ethanol synthesis, while bacterial activity was more prominent in Muqu. Additionally, pyrazine synthesis was mainly attributed to fungi in Muqu and bacteria in HTD. Source Tracker analysis indicated that 8.11% of the bacteria and 26.76% of the fungi originated from Muqu. This study provides a theoretical foundation for the controlled production of HTD, contributing to improvements in its quality and consistency.

1. Introduction

Daqu is irreplaceable in traditional Chinese conventional fermented foods, serving as a unique fermentation starter and raw material. The special texture structure, flavor constituents, and their precursors are attributed to traditional craftsmanship. High-temperature Daqu (HTD), also known as Maotai Daqu or Jiangxiang Daqu, is one of the three basic traditional Daqu used for Baijiu fermentation. The quality of HTD, which is used in quantities slightly exceeding those of sorghum, significantly contributes to the characteristic flavor and yield of fresh sauce soy Baijiu [1,2]. Unlike Nongxiang Daqu, HTD processing involves the addition of Muqu (high-quality Daqu from the previous year), along with variations in process parameters [3]. Previous studies suggest that it can improve Daqu quality by colonizing certain functional strains preferentially. However, the contribution of the microbiota in Muqu to microbiota in different types of HTD remains unclear [4]. Improving Daqu quality remains challenging as it is traditionally controlled by artisans based on their experiences. Since Daqu is manufactured in an open environment, its quality and properties are influenced by both biotic and abiotic factors, resulting in significant temporal and spatial variability [5,6].
Emerging omics and bioinformatics provide powerful tools to understand the role of microbiota in Daqu. For example, the dominant microbiota in HTD include Thermoactinomycetaceae and Bacillaceae, with Bacillus as a keystone genus [7]. Monascus is also a dominant fungus, accounting for more than 50% of the relative abundance (RA) in the mid and later phases of HTD processing. Specifically, Monascus accounts for 21.1% and 30.3% of Yellow Qu and White Qu, respectively [8]. The presence of Monascus is positively correlated with the activities of α-amylase, glucoamylase, cellulase, and protease [9]. Additionally, isolates of Monascus purpureus YJX-8 synthesize short-chain fatty acid esters in the aqueous phase, imparting a unique flavor to fresh Baijiu, with the enzyme LIP05 belonging to the α/β hydrolase family [10]. Among Nongxiang Daqu and Qingxiang Daqu (QXD), both share the same dominant genera, such as Bacillus and Lactobacillus. However, they also have unique genera, such as Asperigillus and Saccharomycopsis in the former and Saccharomyces and Rhizopus in the latter [11,12].
These findings have laid an important foundation for the development of new technologies to improve Daqu quality, particularly through functional strain and microbiota. For instance, inoculating Bacillus spp. significantly enhanced the content of unique components such as ligustrazine and phenylethanol, thereby improving Daqu quality [13,14]. The Bacillus licheniformis, isolated from HTD, was inoculated into HTD and QXD as a starter, which endowed them with a unique flavor [14,15]. Moreover, the contents of aromatics, phenols, and pyrazines in fresh Baijiu were increased by 2.4, 0.5, and 3.9 times, respectively, in fortified HTD. Meanwhile, amylase activity and the content of pyrazines and aromatic compounds were notably increased in fortified Daqu [15,16]. However, few reports exist on the effect of fortified HTD with Monascus used in Muqu on the microbiota and their metabolites in matured HTD [17].
In this study, the effects of fortified HTD with Monascus-based Muqu on physicochemical properties, microbial community structure and diversity, as well as metabolites, were investigated by a multiphase detection approach, including conventional analysis methods, chromatography-mass spectrometry, as well as the Illumina MiSeq platform. Meanwhile, the contribution of the dominant microbiota in Muqu to mature HTD was explored with Source Tracker software 1.0.1. Relationships among physicochemical properties, metabolic components, and dominant microorganisms were analyzed by Spearman’s and Mantel’s tests. This provided a theoretical basis for the controllable production of HTD.

2. Materials and Methods

2.1. Preparation and Sampling of Fortified High-Temperature Daqu

2.1.1. Microorganism

Three isolates of Monascus floridanus were obtained from high-temperature Daqu. These isolates were identified based on their ITS sequences and preserved in our laboratory. They were named H14, H26, and H30, respectively.

2.1.2. Seed Preparation

The seed preparation followed these steps: These isolated strains were inoculated onto malt extract agar medium (with a sugar concentration of 8°Brix) and cultivated at 30 °C for five days, followed by washing with a sterile 2% acetic acid solution. The spores of activated isolates (5.45 × 10⁵ spores/g) were inoculated into wheat flour medium, which had been autoclaved for 20 min at 121 °C. This process was performed using 500 g of wheat flour in a 5 L triangular flask. The cultures were incubated at 30 ± 1 °C for 3–5 d, then dried until the moisture content was reduced to below 13% at a temperature range of 40–45 °C.

2.1.3. Muqu Production

The Muqu was produced using the traditional method described by Zhu et al. [2]. In brief, crushed wheat was thoroughly mixed with water, and 3% (w/w, dried weight) of the respective seed powder. The mixture was then shaped into Qupei blocks (with a moisture content of 37%) and stacked into piles with four layers. During the fermentation process, the piles were flipped on day 7 and day 14. Fermentation was completed on day 40, after which HTD was transferred to a storage room and stored for 6 months at ambient temperature. The matured HTD fortified with isolate H14, H26, and H30 were used as Muqu for the subsequent round of HTD, and each was labeled as H14-M, H26-M, and H30-M, respectively.

2.1.4. High-Temperature Daqu Production and Sampling

The HTD production process followed the traditional method described by Zhu et al. [2] with the Muqu replaced by 6% of H14-M, H26-M, and H30-M, respectively. The resulting HTD products were labeled as H14-ZF, H26-ZF, and H30-ZF, respectively. Three pieces of HTD from each group were randomly sampled, crushed, mixed evenly, and stacked conically. A 500 g sample was taken using a five-point sampling approach. The samples were divided into 100 g and 400 g portions and stored at −20 °C and −80 °C, respectively, until further analysis.

2.2. Determination of Physiochemical Properties

The moisture, saccharification ability, liquefaction ability, fermentation ability, esterification ability, acidity, and ammoniacal nitrogen were determined according to the general methods of analysis for Daqu as specified in QB/T 4257-2011 [18]. Specifically, the moisture content was determined by drying the Daqu sample at 105 °C until a constant weight was achieved, with the calculation based on the mass difference before and after drying. Saccharification ability was assessed by measuring the milligrams of glucose produced from the conversion of soluble starch by 1.0 g of absolutely dry sample per hour under conditions of 35 °C and pH 4.6. The liquefaction ability was measured by determining the grams of starch liquefied by 1.0 g of absolutely dry sample per hour under the same temperature and pH conditions. The fermentation ability was evaluated by fermenting 0.5 g of absolutely dry sample at 30 °C for 72 h and measuring the volume of CO2 produced during the fermentation process. The esterification ability was determined by measuring the amount of ethyl hexanoate produced by catalyzing ethanol and hexanoic acid in 50 g of absolutely dry Daqu over a period of 7 d at 35 °C. Acidity was measured using a titration method with acid-base neutralization, where the endpoint was indicated by a change in pH, to determine the acidity of the Daqu. The ammonium nitrogen content was determined based on the amphoteric nature of amino acids. This involved reacting the sample with a standard solution of sodium hydroxide, which neutralized the basicity of the amino groups, leaving the carboxyl groups acidic. The titration endpoint was controlled with a pH indicator, and the ammonium nitrogen content was calculated based on the volume of sodium hydroxide standard solution consumed.

2.3. Detection of Volatile Metabolic Components

A sample of 1.000 g of the Daqu was accurately weighed and placed in a 25 mL headspace vial. To this, 10 µL of the internal standard substance (Caprylic acid methyl ester: 0.0079 g/100 mL) was added. The vial was then placed on a magnetic stirrer at a constant temperature of 60 ± 1 °C and allowed to equilibrate for 15 min. A solid-phase microextraction (SPME) fiber (50/30 µm, DVB/CAR/PDMS) was inserted into the headspace vial and exposed for extraction for 45 min. After extraction, the fiber was inserted into the gas chromatograph (GC) injection port for desorption for 5 min.
GC conditions: The temperature of the injection port was set to 250 °C, and no split mode was used. Temperature program began at 40 °C, held for 5 min, then increased at 5 °C/min to 220 °C and held for 5 min. High-purity helium (>99.999%) was used as the carrier gas at a constant flow rate of 1 mL/min. MS conditions: The interface temperature was set to 250 °C, and Electron Ionization (EI) mode was used with an electron energy of 70 eV. The ion source temperature was 200 °C with a mass spectrometer set to scan over a range of 30–400 amu at a scan rate of 1 scan/s. Volatile compounds were identified by comparing their mass spectrum with data in the NIST2017 library database (Finnigan Co., San Jose, CA, USA) based on a similarity index > 800.

2.4. Detection of Non-Volatile Metabolic Components

Non-volatile metabolites were detected using ultra-performance liquid chromatography coupled with quadrupole time-of-flight mass spectrometry (UPLC-Q/TOF-MS). The system included a 1290 Infinity II equipped with a Zorbax Eclipse Plus C18 column (2.1 mm × 50 mm, 1.9 μm), Q/TOF-MS (G6546A), MassHunter Profinder (v10.0.2), MassHunter Qualitative Analysis (v10.0), and PCDL Manager B.08.00.

2.4.1. Sample Preparation

A 5.00 g sample was mixed with 20 mL of 1% (w/v) CaCl2, and the mixture was allowed to stand overnight at 4 °C. The mixture was then subjected to ultrasonication in an ice bath for 30 min. After centrifugation at 4 °C and 8000 rpm for 20 min, the supernatant was collected, and 10 μL of the internal standard (2-chloro-L-phenylalanine, 104 μg/L) was added. The residue was vacuum freeze-dried, dissolved in 10 mL of an 80% methanol solution, vortexed, and filtered through a 0.22 μm nylon filter membrane. The filtrate was transferred to an injection vial.

2.4.2. UPLC Conditions

Automatic injection of 2 µL of supernatant was performed. Gradient elution was carried out with 0.1% formic acid aqueous solution (A) and acetonitrile solution (B) at a flow rate of 0.3 mL/min using the following program: 0–5 min, 98% A; 5–13 min, 98% to 90% A; 13–23 min, 90% to 5% A; 23–26 min, 5% A; 26–26.1 min, 5% to 98% A; and 26.1–30 min, 5% to 98%.

2.4.3. MS Conditions

A triple quadrupole time-of-flight mass spectrometer with a Dual AJS ESI ion source was used. The capillary voltages were set to 4.0 kV for positive mode and 3.5 kV for negative mode. The mass scan range was m/z 100–1000, with a full scan at a resolution of 60,000. Auto MS/MS experiments were conducted using collision-induced dissociation (CID) scanning with normalized collision energies of 20 eV and 40 eV. Additional MS conditions included a curtain gas temperature of 300 °C, a gas flow rate of 10 L/min, a nebulizer pressure of 60 psi, a sheath gas temperature of 350 °C, and a sheath gas flow rate of 11 L/min.
Raw data generated by MassHunter Profinder (v10.0.2) was used for peak alignment, peak picking, peak matching, and semi-quantitative analysis of each metabolite. The main parameters for peak alignment included a retention time and mass tolerance of 0.30 min and 20 ppm, respectively. Retention time and mass tolerance for peak matching were 0.15 min and 10 ppm, respectively, with peaks having an absolute height of ≥ 20,000 and a core of ≥70. Subsequently, MassHunter Qualitative Analysis (v10.0) software was used for automatic MS/MS library searches and online database searches to obtain accurate qualitative results.

2.5. Enumeration of Cultivable Microorganisms in Daqu

A 5.00 g Daqu sample was placed in a triangular flask containing 100 mL of sterile normal saline and a glass bead was thoroughly mixed. These suspensions were serially diluted, plated onto beef extract peptone agar medium and Bengal red medium, then incubated at 37 °C for 36–48 h for the total bacteria count, and at 30 °C for 48–72 h for the fungal count. For mesophilic bacteria, the suspension was treated for 10 min at 80 °C in a water bath before incubation [19,20]. The sample was then spread on beef extract peptone agar medium, incubated at 37 ± 1 °C for 36–48 h, and the colonies were counted.

2.6. Analysis of Daqu Microbial Community Structure

Total DNA was extracted from Daqu using the Fast DNA SPIN extraction kit (MP Biomedicals, Santa Ana, CA, USA) following the manufacturer’s instructions. DNA concentration and purity were assessed using a Nanodrop DN-1000 spectrophotometer and 1% agarose gel electrophoresis. PCR amplification and sequencing: The V3-V4 region of the bacterial 16S rRNA gene and the ITS1 and ITS5 regions of the fungal genome were amplified using primers 338F/806R and ITS5F/ITS1R, respectively. The PCR system (25 µL) consisted of 5 µL each of 5 × reaction buffer and 5 × GC buffer, 0.25 µL of High-Fidelity DNA polymerase (5 U/µL), 2 µL of dNTPs (2.5 mmol/L), 1 µL each of forward and reverse primers (10 µmol/L), 2 µL of DNA template, and 8.57 µL of ddH₂O. PCR conditions: For bacteria, the PCR conditions were as follows: preheating at 98 °C for 2 min, followed by 25 cycles of denaturation at 98 °C for 15 s, annealing at 55 °C for 30 s, with a final extension at 72 °C for 30 s. For fungi, the PCR conditions were as follows: preheating at 95 °C for 3 min, followed by 32 cycles of denaturation at 95 °C for 45 s, annealing at 61 °C for 30 s, and extension at 72 °C for 10 min.
After PCR amplification, the products were purified using agarose gel electrophoresis and gel extraction. The purified fragments are then further purified using the Agencourt AMPure Beads nucleic acid purification kit and sequenced by Shanghai Personal Biotechnology Co., Ltd. (Shanghai, China) based on the 2 × 300 Illumina MiSeq platform.

2.7. Data Analysis

Data analysis was performed using the Tutool analysis platform (https://www.cloudtutu.com (accessed on 5 June 2024)) for principal coordinate analysis (PCoA), principal component analysis (PCA), heatmap clustering analysis, linear discriminant analysis effect size (LEfSe), mantel test, and redundancy analysis correlation analysis. Differential analyses of metabolite components were conducted using partial least squares discriminant analysis (PLS-DA) in SIMCA 14.1. Statistical significance was assessed using Duncan’s test within one-way ANOVA in SPSS 25.0 software (p < 0.05, n = 3). Source tracking analysis was performed using the Source Tracker to evaluate the microbial origins of the HTD.

3. Results and Discussion

3.1. Differences in Physicochemical Properties between Muqu and HTD

As shown in Table 1, significant differences in moisture content were observed among the HTD samples, with H30-ZF exhibiting the highest moisture content at 18.11 g/100 g. In contrast, only slight variations in moisture content were noted among the Muqu samples. The enzyme activities of Muqu and HTD did not exhibit positive correlations. HTD samples generally displayed reduced acidity and increased ammoniacal nitrogen levels, except for H14-ZF, which showed marginal fluctuations. In the case of H30-M, which corresponds to H30-ZF, a slight reduction in starch hydrolysis capacity was observed. However, the fermentation ability of HTD was notably enhanced compared to their respective Muqu counterparts, with H14-ZF showing a significant increase from 0.11 g/0.5 g·72 h to 0.23 g/0.5 g·72 h. On the other hand, esterification ability significantly declined in H14-ZF, with H26-ZF and H30-ZF showing slight decreases and increases, respectively.

3.2. Differences in Volatile Metabolites

Figure 1A,B illustrates that a total of 83 volatile metabolic components were identified across the samples, categorized into esters (31), alcohols (9), aldehydes (7), acids (11), pyrazines (6), and other compounds (19). Common components included phenethyl alcohol, undecane, dodecane, methyl palmitate, methyl linoleate, and methyl phenylacetate. The proportion of dominant esters ranged from 55.35% to 80.46%, with methyl palmitate and methyl linoleate accounting for 27.11% to 42.08% and 13.39% to 25.75% of the total volatile components, respectively. H14-M, H26-M, and H30-M shared 15, 16, and 14 components, respectively, with their corresponding HTD samples. H14-M, H26-M, and H30-M contained 36, 41, and 32 components, respectively, while corresponding HTD samples contained 32, 30, and 32 components, with their contents having increased by 24.31%, 85.62%, and 29.66%, respectively. The total content of volatile components in H26-ZF increased from 2.89 mg/kg to 5.37 mg/kg, with the esters increasing from 1.83 mg/kg to 4.32 mg/kg. Notably, the content of alcohol components in H14-ZF and H26-ZF significantly decreased, while the aldehyde and acid components in the former increased by 6.49 and 1.24 times, respectively, and the alcohol in H30-ZF increased by 1.11 times. Among the six main characteristic components identified in the Baijiu, including 2,5-dimethylpyrazine, 2,6-dimethylpyrazine, 2,3-dimethylpyrazine, 2-ethyl-6-methylpyrazine, 2,3,5,6-tetramethylpyrazine and 2,5-dimethyl-3-butylpyrazine, the levels in the corresponding HTD increased by 3.46, 2.09, and 3.64 times, respectively. Despite these differences, important components present in Muqu were found in HTD, though their number and concentration varied significantly.
Figure 1C shows the PLS-DA differential analysis of volatile components. The model quality, as evaluated by R2X, R2Y, and Q2 was close to 1, indicating that the model was robust and reliable. Muqu samples were located in the first quadrant, exhibiting relatively close proximity to each other, while the corresponding HTD samples were located in the third and fourth quadrants, indicating significant alterations in the volatile component profiles between Muqu and HTD. A total of 21 differential volatile metabolites were identified based on the criterion of VIP (Variable Importance in the Projection) > 1.0 (Figure 1D). These included 2,5-dimethylpyrazine, 2,6-dimethylpyrazine, 1-hexadecanol, phenethyl alcohol, isovaleric acid, 3-methylvaleric acid, stearolic acid, 2-acetamido-3-hydroxypropionic acid, cedarene, three alkanes, and nine fatty acid methyl esters. Phenethyl alcohol, methyl palmitate, and isovaleric acid were also significant components in Daqu and Baijiu [21,22]. Additionally, 1-Hexadecanol is a precursor of palmitic acid and ethyl palmitate [23], while cedarene is an important flavor terpenoid compound in the Baijiu [24].

3.3. Variation of Non-Volatile Components

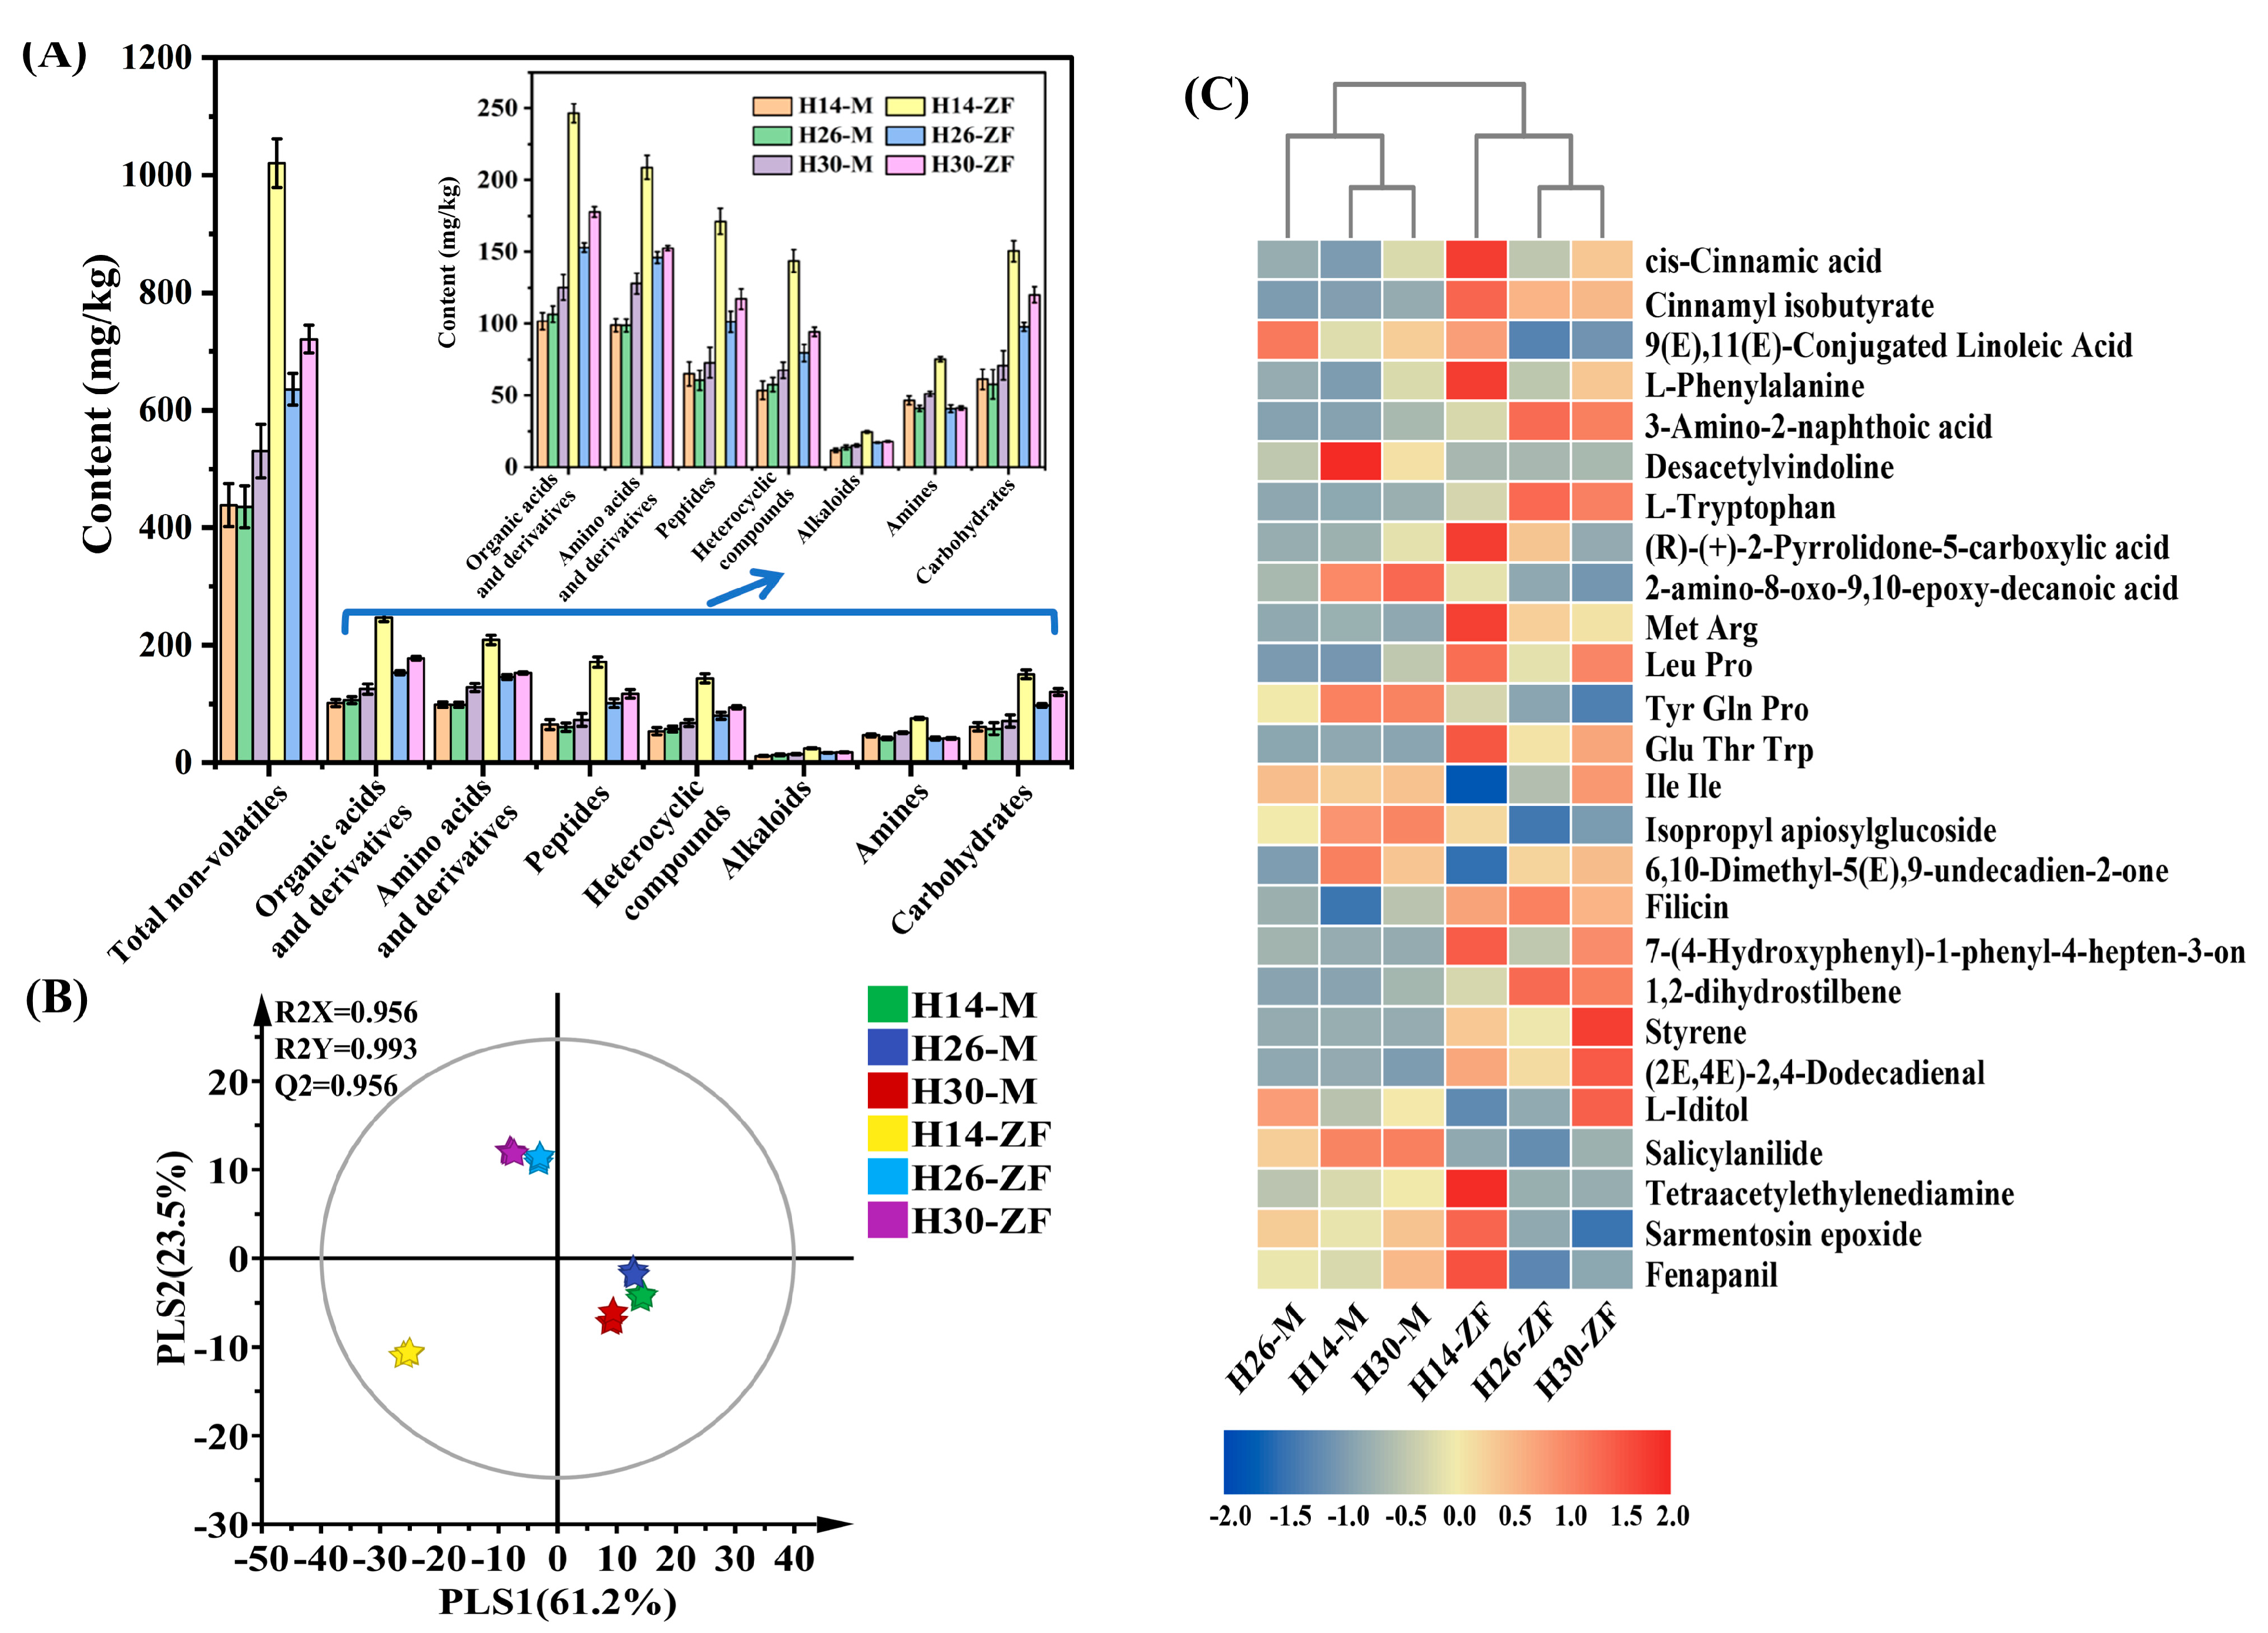
A total of 8233 and 2457 ion characteristic peaks were detected under the ESI+ and ESI modes of LC-Q/TOF-MS, respectively. Based on the MS/MS search, 568 reliable non-volatile components were identified, including 310 in ESI+ and 258 in ESI. These substances were categorized into seven groups: organic acids and their derivatives (125), amino acids and their derivatives (74), peptides (140), heterocyclic compounds (94), alkaloids (22), amines (36), and carbohydrates (77). Similar to the trend observed in volatile components, the content of non-volatile components in HTD was significantly higher than that in the corresponding Muqu (Figure 2A). Notably, the total contents of H30-M and H14-ZF were 530.50 mg/kg and 1020.58 mg/kg, respectively, the highest among Muqu and HTD samples. The contents of non-volatile components in HTD exceeded those in Muqu across most categories, except for amines. Organic acids and their derivatives, as well as amino acids and their derivatives, accounted for more than 45% of the total non-volatile content, while peptides, heterocyclic compounds, and carbohydrates made up over 39%, with amines and alkaloids contributing slightly over 8%. These results confirmed that the non-volatile metabolic component profiles in HTD differ significantly from those in their respective Muqu.
The PLS-DA analysis of the characteristic non-volatile metabolic components yielded results that were similar to those for volatiles (Figure 2B). The structural differences in the characteristic metabolites of HTD were significant, with samples clustering in the second and third quadrants, and being relatively distant from each other. Based on the criterion of VIP > 2.0, 26 characteristic components were identified, including organic acids and their derivatives, amino acids, and their derivatives. Most characteristic components of HTD were present at higher levels than that in the corresponding Muqu samples. The cluster analysis results indicated that HTD and Muqu formed a distinct cluster (Figure 2C), with higher similarities observed between H30-ZF and H26-ZF, as well as between H30-M and H14-M.

3.4. Differences in Microbial Community Structure

Differences in the total bacterial count, mesophilic bacteria, and fungi among samples, as determined by the plate count method (Table 2). The total bacterial count in HTD was lower compared to Muqu, while the number of fungi increased. Moreover, the composition and proportion of mesophilic bacteria were altered, shifting from 3.20–9.74% to 55.08–78.26%. This shift may be driven by process parameters that likely influenced the evolution of the community structure.
The effective sequencing range for bacteria and fungi obtained from six types of Daqu was 91,574 to 115,317 and 123,261 to 138,732, respectively. The average values and proportions of high-quality sequences were 73,310 and 126,616, with 95.65% and 97.90%, respectively. The rarefaction curves for the six types of Daqu approached a plateau, indicating that the sequencing volume for each sample was reasonable and valid (Table 3, Figure 3A,B). The sequencing depth adequately represented the microbial composition of the samples.
A total of 147 bacterial genera and 69 fungal genera, each with RA > 1%, were identified. The distribution of genera in Muqu and HTD is presented in Figure 3E,F. Muqu samples contained 11, 12, and 9 bacterial genera, with 9 genera being common across the samples, aligning with previous reports on dominant bacteria. Lactobacillus was identified in H14-M and H26-M, with Scoulibacillus, Lactococcus, and Saccharomonospora being dominated in H14-M and H26-M, respectively, while Brevibacterium was dominant in H30-M. In the corresponding HTD, five to seven dominant bacterial genera were identified. In H14-ZF, Bacillus, Thermoactinomyces, Sebaldella, and Pantoea were no longer dominant, with Streptomyces emerging as the dominant genus. In H26-ZF, Bacillus, Sebaldella, and Pantoea were no longer dominant, while Weissella became dominant. In H30-ZF, only Sebaldella and Pantoea were no longer dominant. The most significant differences among the three HTD samples were the RA of Kroppenstedtia, Virgibacillus, and Saccharopolysopora.
The structural differences in the dominant fungal communities of Monascus in fortified Muqu with three isolates were significantly altered. Aspergillus emerged as a dominant genus in these Muqu, with RA of 68.02% in H26-M and 34.57% in H30-M, while it constituted only 3.23% in H14-M. Additionally, other prominent genera included Thermoascus (32.54%), Thermomyces (32.50%), and Rasamsonia (12.59%). Dominant bacterial genera still included Botryotrichum, Byssochlamys, and Humicola in H26-M and H30-M, though significant differences in RA were observed (Figure 3).
In the corresponding HTD samples, the dominant fungal community underwent significant changes. In H14-ZF, RA of Aspergillus decreased to 29.16%, while Thermoascus and Byssochlamys reached 26.39% and 41.82%, respectively, with Byssochlamys becoming the most dominant fungus. In H26-ZF and H30-ZF, the RA of Aspergillus dropped further to 2.47% and 7.22%, respectively. Meanwhile, Thermomyces and Thermoascus became more dominant, with RAs of 64.82% and 28.52% in H26-ZF, as well as 52.52% and 29.59% in H30-ZF, respectively. Additionally, the number of dominant fungal species decreased to four.
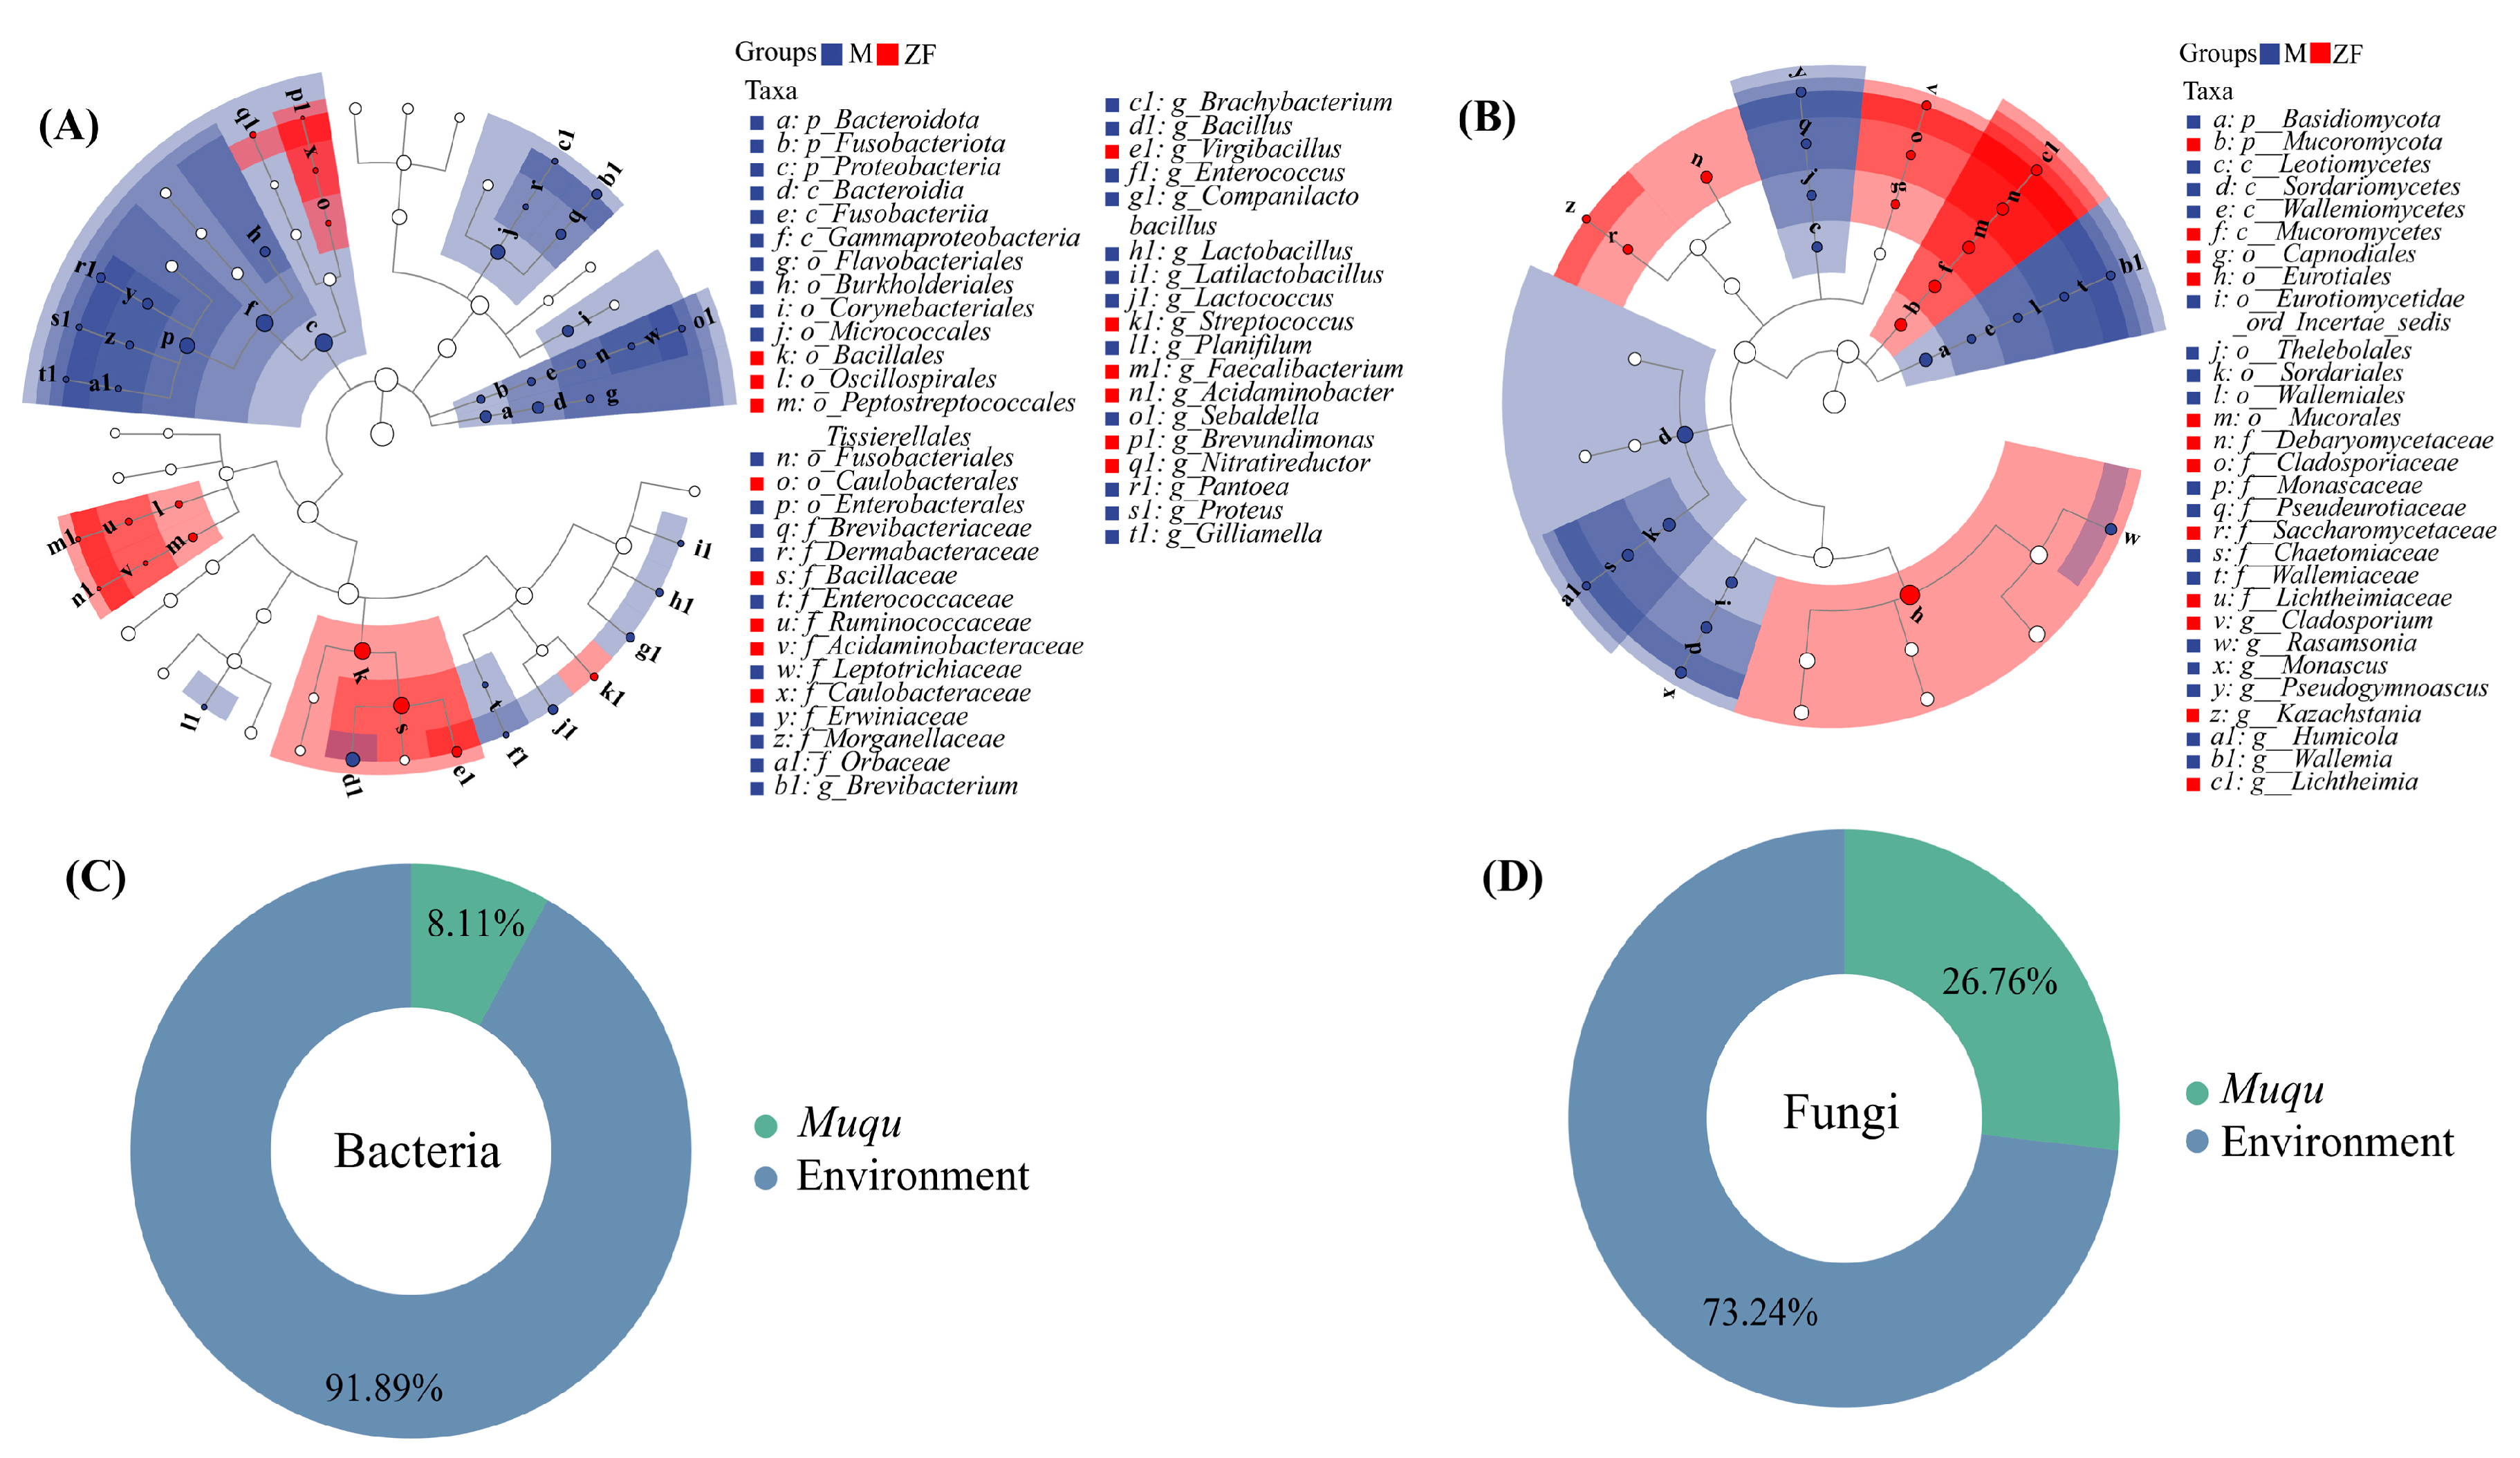
LEfSe analysis (LDA score > 2 and p < 0.05) revealed distinct differences in microbial communities between Muqu and HTD (Figure 4). A total of 19 differential bacterial genera and 8 differential fungal genera were identified across the six types of Daqu. HTD samples contained 6 differential bacterial genera and 3 differential fungal genera, while Muqu samples had 13 differential bacterial genera and 5 differential fungal genera. The predominant genera observed in Muqu included Brevibacterium, Brachybacterium, Bacillus, Lactobacillus, Latilactobacillus, Rasamsonia, Monascus, and others. In contrast, the dominant genera in HTD were Virgibacillus, Streptococcus, Cladosporium, Kazachstania, Lichtheimia, and others.
The results from the Source Tracker analysis, which delineated microbial origins in HTD (Figure 4C,D), indicated that 8.11% of the bacteria and 26.76% of the fungi originated from Muqu. The remaining microorganisms likely originated from the environment and production facilities, and warranted further investigation.

3.5. Correlation between Physicochemical Properties and Dominant Bacteria

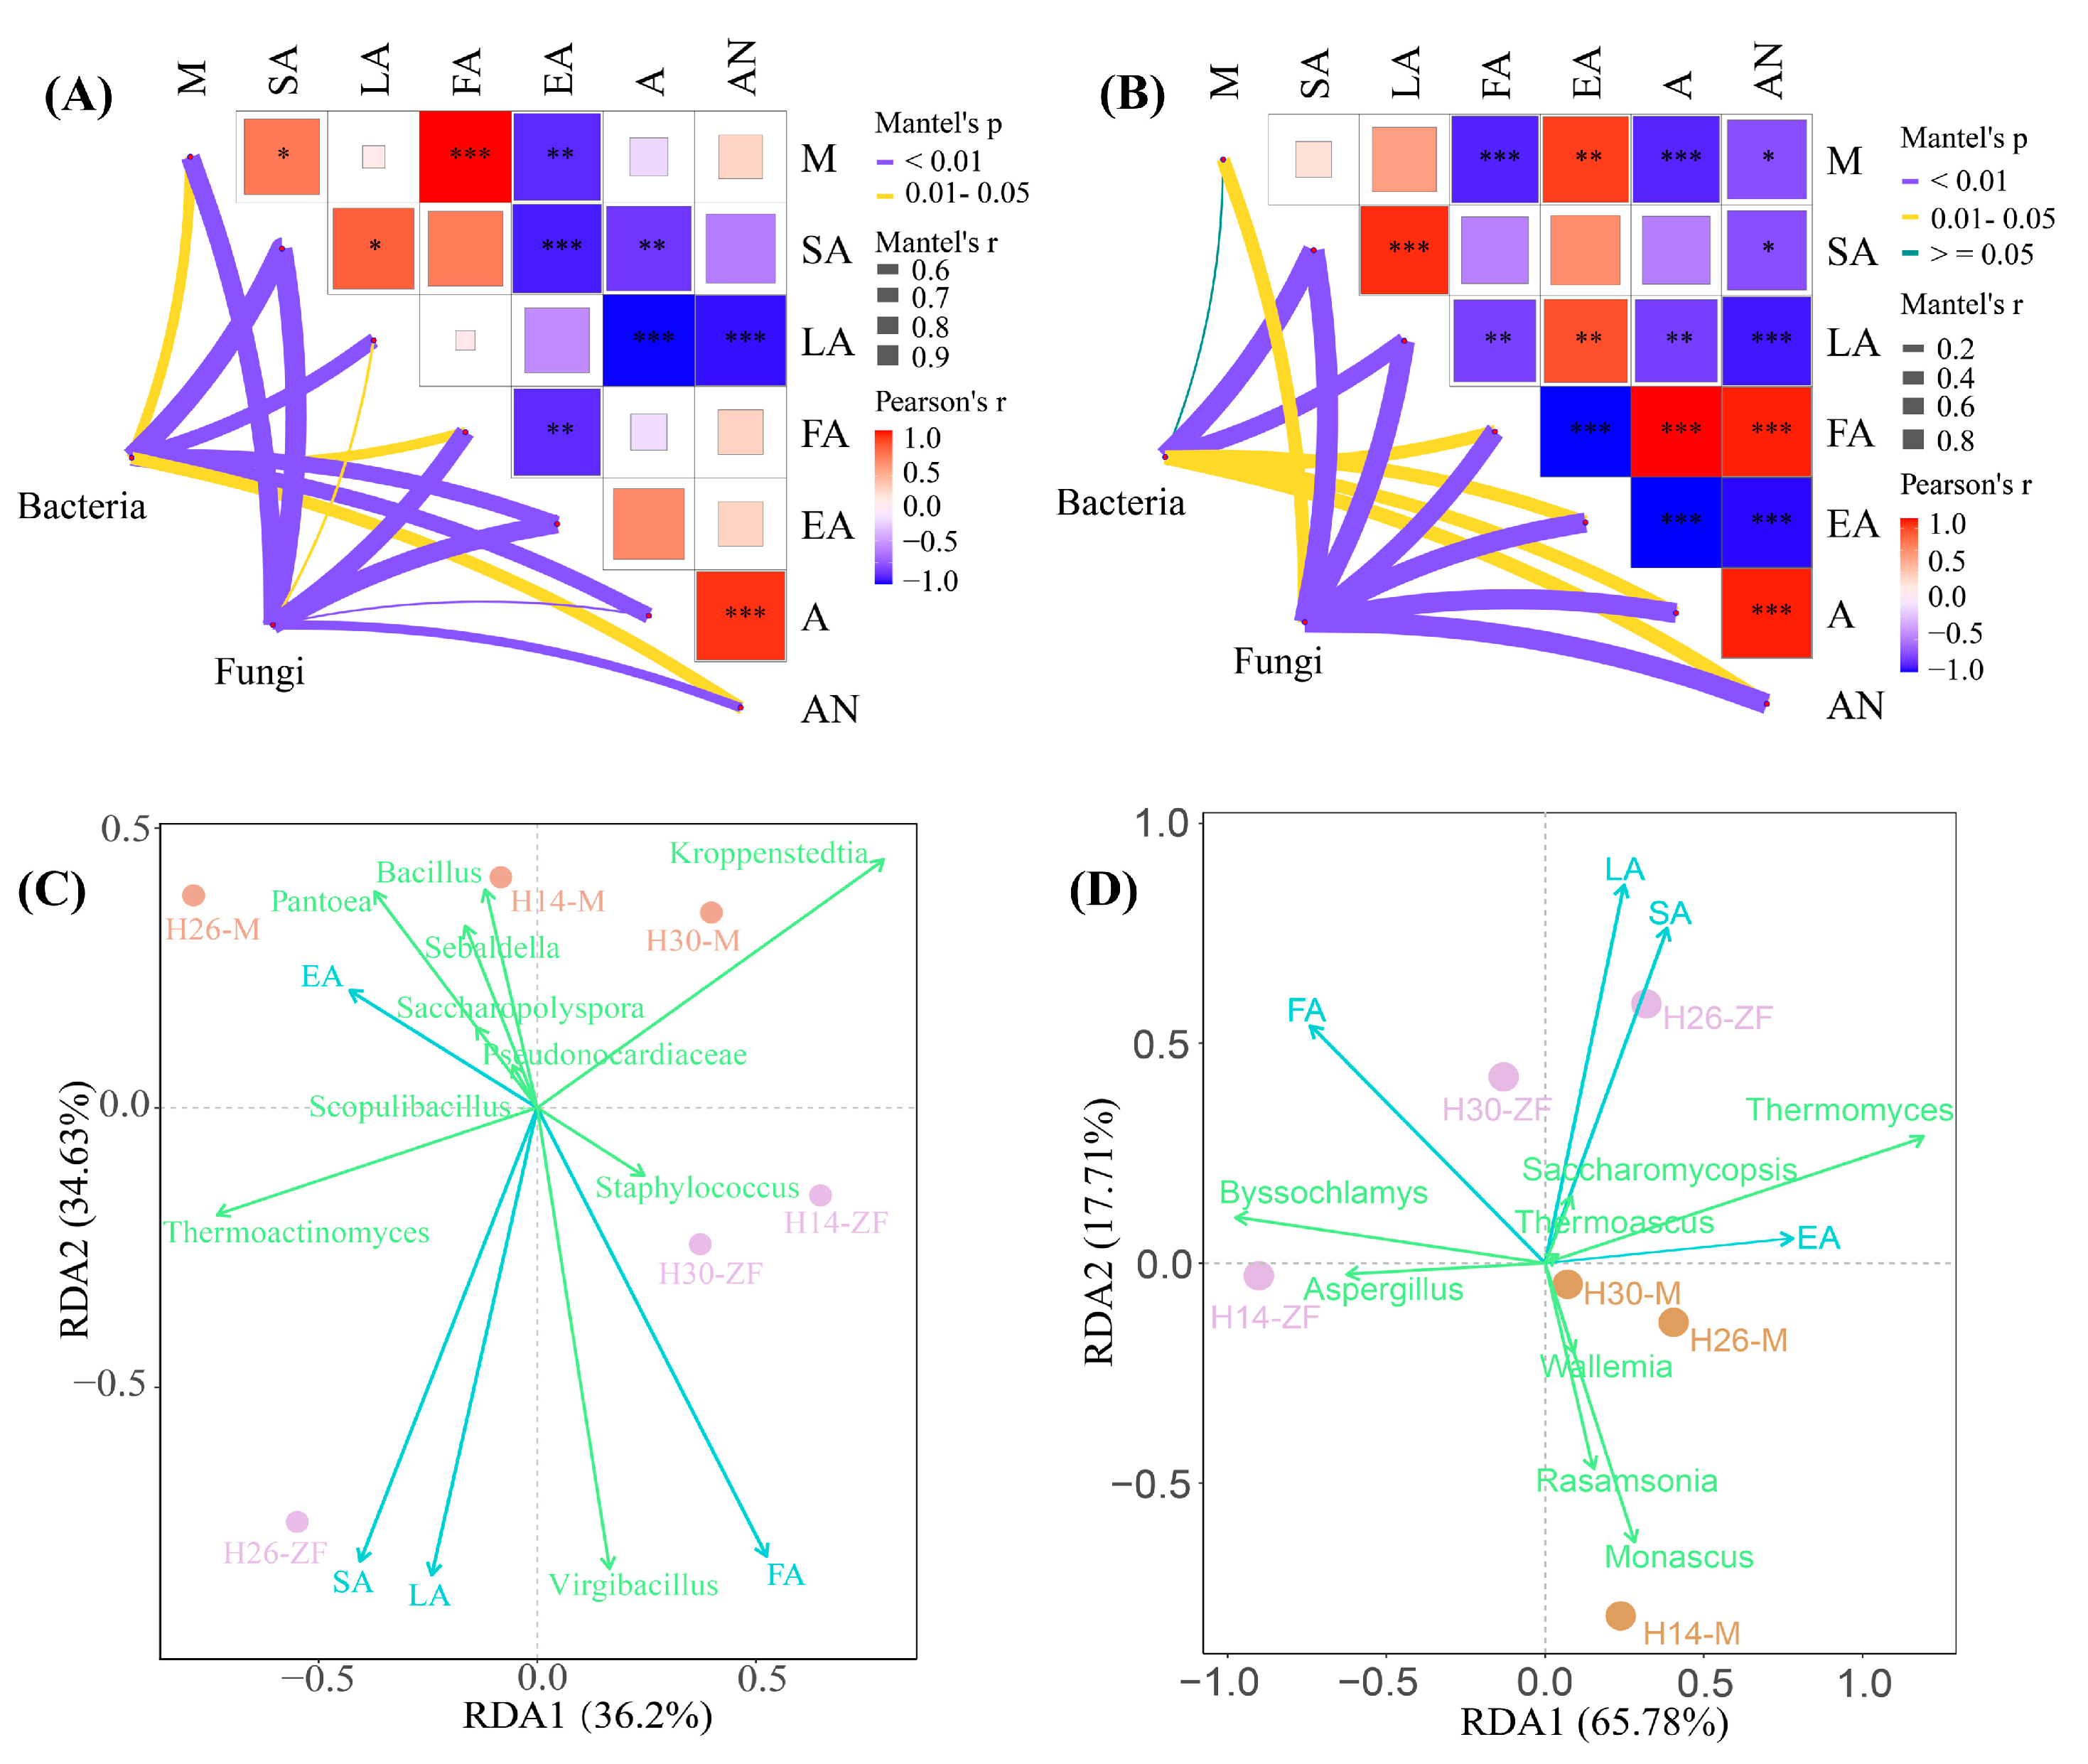
The Mantel test was employed to explore the correlation between community structure and the physicochemical properties of Daqu (Figure 5A,B). In Muqu, bacteria exhibited a significantly positive correlation with key physicochemical parameters, including saccharification ability, liquefaction ability, esterification ability, and acidity. Fungi were also significantly and positively correlated not only with saccharification ability, esterification ability, and acidity, but also with fermentation ability, moisture, and ammoniacal nitrogen. In HTD, the positive correlation between bacteria and physicochemical properties, with the exception of saccharification and liquefaction abilities, was weakened, while the positive correlation for fungi was enhanced. These findings were consistent with previous reports [11]. Redundancy analysis of the dominant genera and four types of enzyme activities (Figure 5C,D) revealed variance for bacterial and fungal communities of 70.83% and 83.49%, respectively. Most dominant bacteria, such as Bacillus, were positively correlated with esterification ability but negatively correlated with saccharification ability, liquefaction ability, and fermentation ability. However, Virgibacillus, Thermoactinomyces, and Staphylococcus showed positive correlations with these parameters. The fermentation ability of HTD was notably higher than that of Muqu, significantly enhancing the saccharification and liquefaction abilities of H26-ZF and H30-ZF, which may be attributed to the increased RA of Virgibacillus and Staphylococcus. Most identified fungal genera, such as Thermomyces, were positively correlated with esterification ability. Additionally, Thermomyces, Thermoascus, and Saccharomycopsis were positively correlated with saccharification and liquefaction abilities. Byssochlamys and Aspergillus were positively correlated with fermentation ability, and their increased RA in HTD contributed to a higher fermentation ability compared to Muqu. The correlation between these microbial genera and enzymes is multivariate and nonlinear.
The correlation analysis of physicochemical properties is illustrated in Figure 5A,B. In Muqu, saccharification and liquefaction abilities were significantly and positively correlated, but negatively correlated with esterification ability and acidity, which, in turn, were strongly positively correlated with ammoniacal nitrogen. In HTD, most physicochemical properties were strongly correlated with fermentation ability but negatively correlated with other physicochemical properties. The correlation between saccharification ability and liquefaction ability was consistent with that in Muqu, but the relationship between esterification ability and both saccharification and liquefaction ability was inversed. Due to the higher moisture in HTD, its correlation with other physicochemical properties was more pronounced.

3.6. Differences in Correlations between Microorganisms and Metabolites

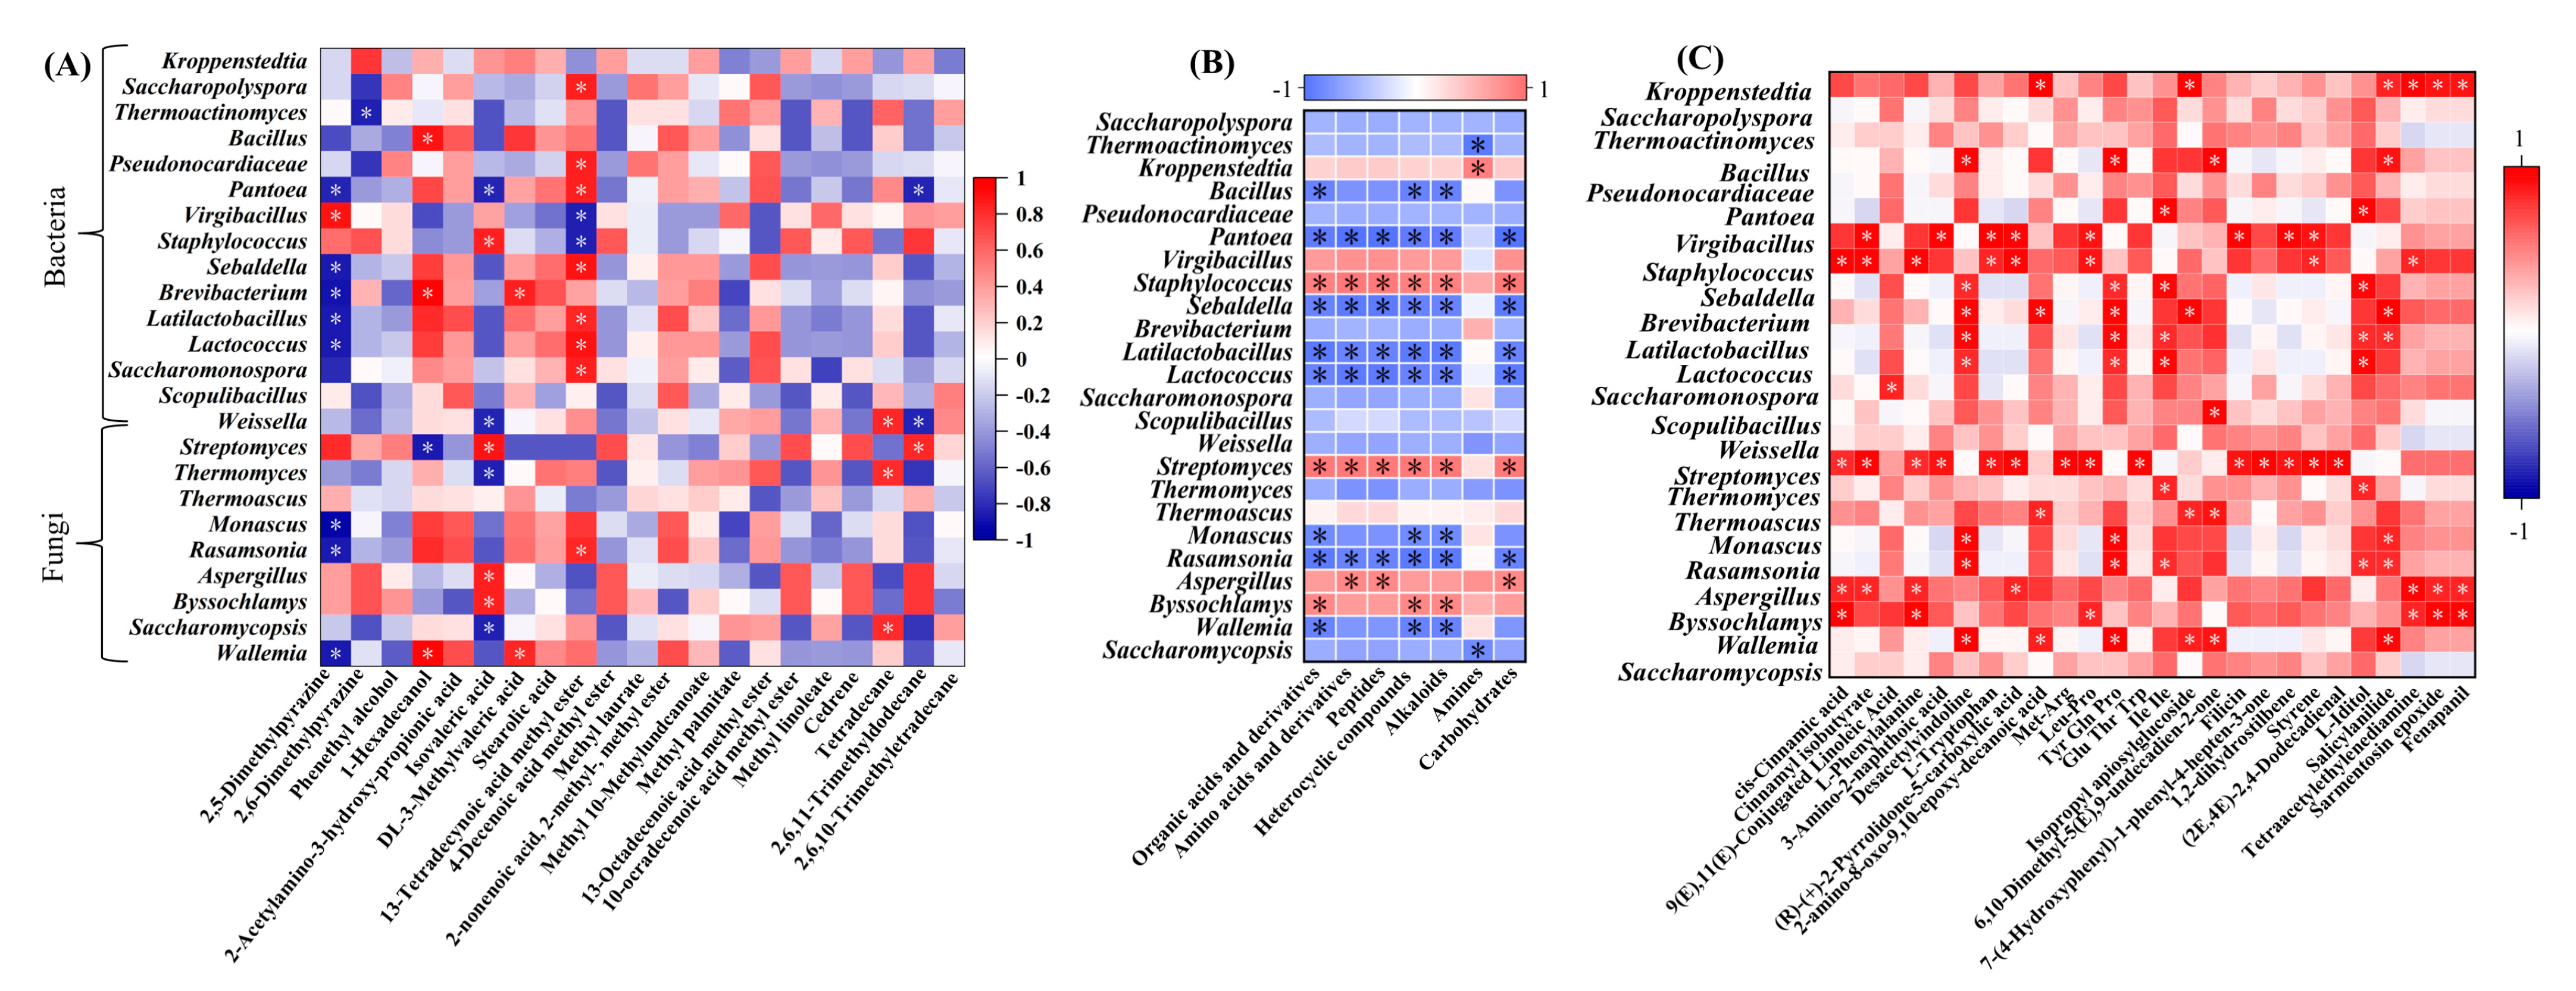
As shown in Figure 6, the Spearman correlation coefficient was utilized to examine the relationship between microbes and their characteristic volatile metabolites. Although no reports have linked Virgibacillus to pyrazine synthesis, in HTD, 2,5-dimethylpyrazine exhibited a significant positive correlation with Virgibacillus. Phenethyl alcohol demonstrated a weak negative correlation with the most dominant bacteria. Notably, 1-Hexadecanol, known for its rose-like fragrance [25], showed a significant positive correlation with dominant bacteria, particularly Bacillus, Brachybacterium, and Wallemia, while it was significantly negatively correlated with Streptomyces. Among the four characteristic acidic volatile metabolites, isovaleric acid was negatively correlated with most dominant bacteria. Methyl 13-tetradecenoate, which imparts a honey-like fruity flavor, displayed a significant and positive correlation with most dominant bacteria, including Saccharopolyspora, Pseudonocardiaceae, Pantoea, and Rasamsonia, but was significantly negatively correlated with Virgibacillus and Staphylococcus. Among the four types of hydrocarbon volatile metabolites, only tetradecane and 2,6,11-trimethyldodecane showed significant correlations with certain dominant microbes. Hydrocarbon compounds were an important source of flavor in Baijiu [26,27]. However, their contribution to the overall aroma profile of Baijiu has been rarely reported to date.
The correlation analysis between dominant genera and non-volatile metabolites is presented in Figure 6B. With the exception of amines, Staphylococcus and Streptomyces exhibited a positive correlation with all detected non-volatile components. In contrast, Pantoea, Sebaldella, Latilactobacillus, Lactococcus, and Rasamsonia demonstrated significant negative correlations. Kroppenstedtia was the only genus that showed a significant positive correlation with amines. Aspergillus was strongly and positively correlated with amino acids and their derivatives, peptides, and carbohydrates, while Byssochlamys displayed a significant positive correlation with organic acids and their derivatives, heterocyclic compounds, and alkaloids.
These dominant genera were significantly positively correlated with 26 characteristic non-volatile metabolites (Figure 6C). Among these, Desacetylvindoline, Tyr-Gln-Pro, Ile-Ile, L-Iditol, and Salicylanilide were the five compounds strongly correlated with the dominant genera. Desacetylvindoline, a type of terpenoid alkaloid, was found to be significantly more abundant in Muqu, potentially due to the higher RA of Lactobacillus, which is known for its ability to degrade alkaloids. Peptides, such as Tyr-Gln-Pro and Ile-Ile, were also significantly more abundant in Muqu. Peptides in HTD play a crucial role in microbial diversity and the production of key metabolites during the fermentation process in HTD [28,29]. L-Iditol, a sugar alcohol carbohydrate, served as a characteristic flavor component that differentiates various grades of HTD [30], with the highest content observed in H26-M and H30-ZF.

3.7. Function Prediction of Key Metabolic Pathways of Daqu

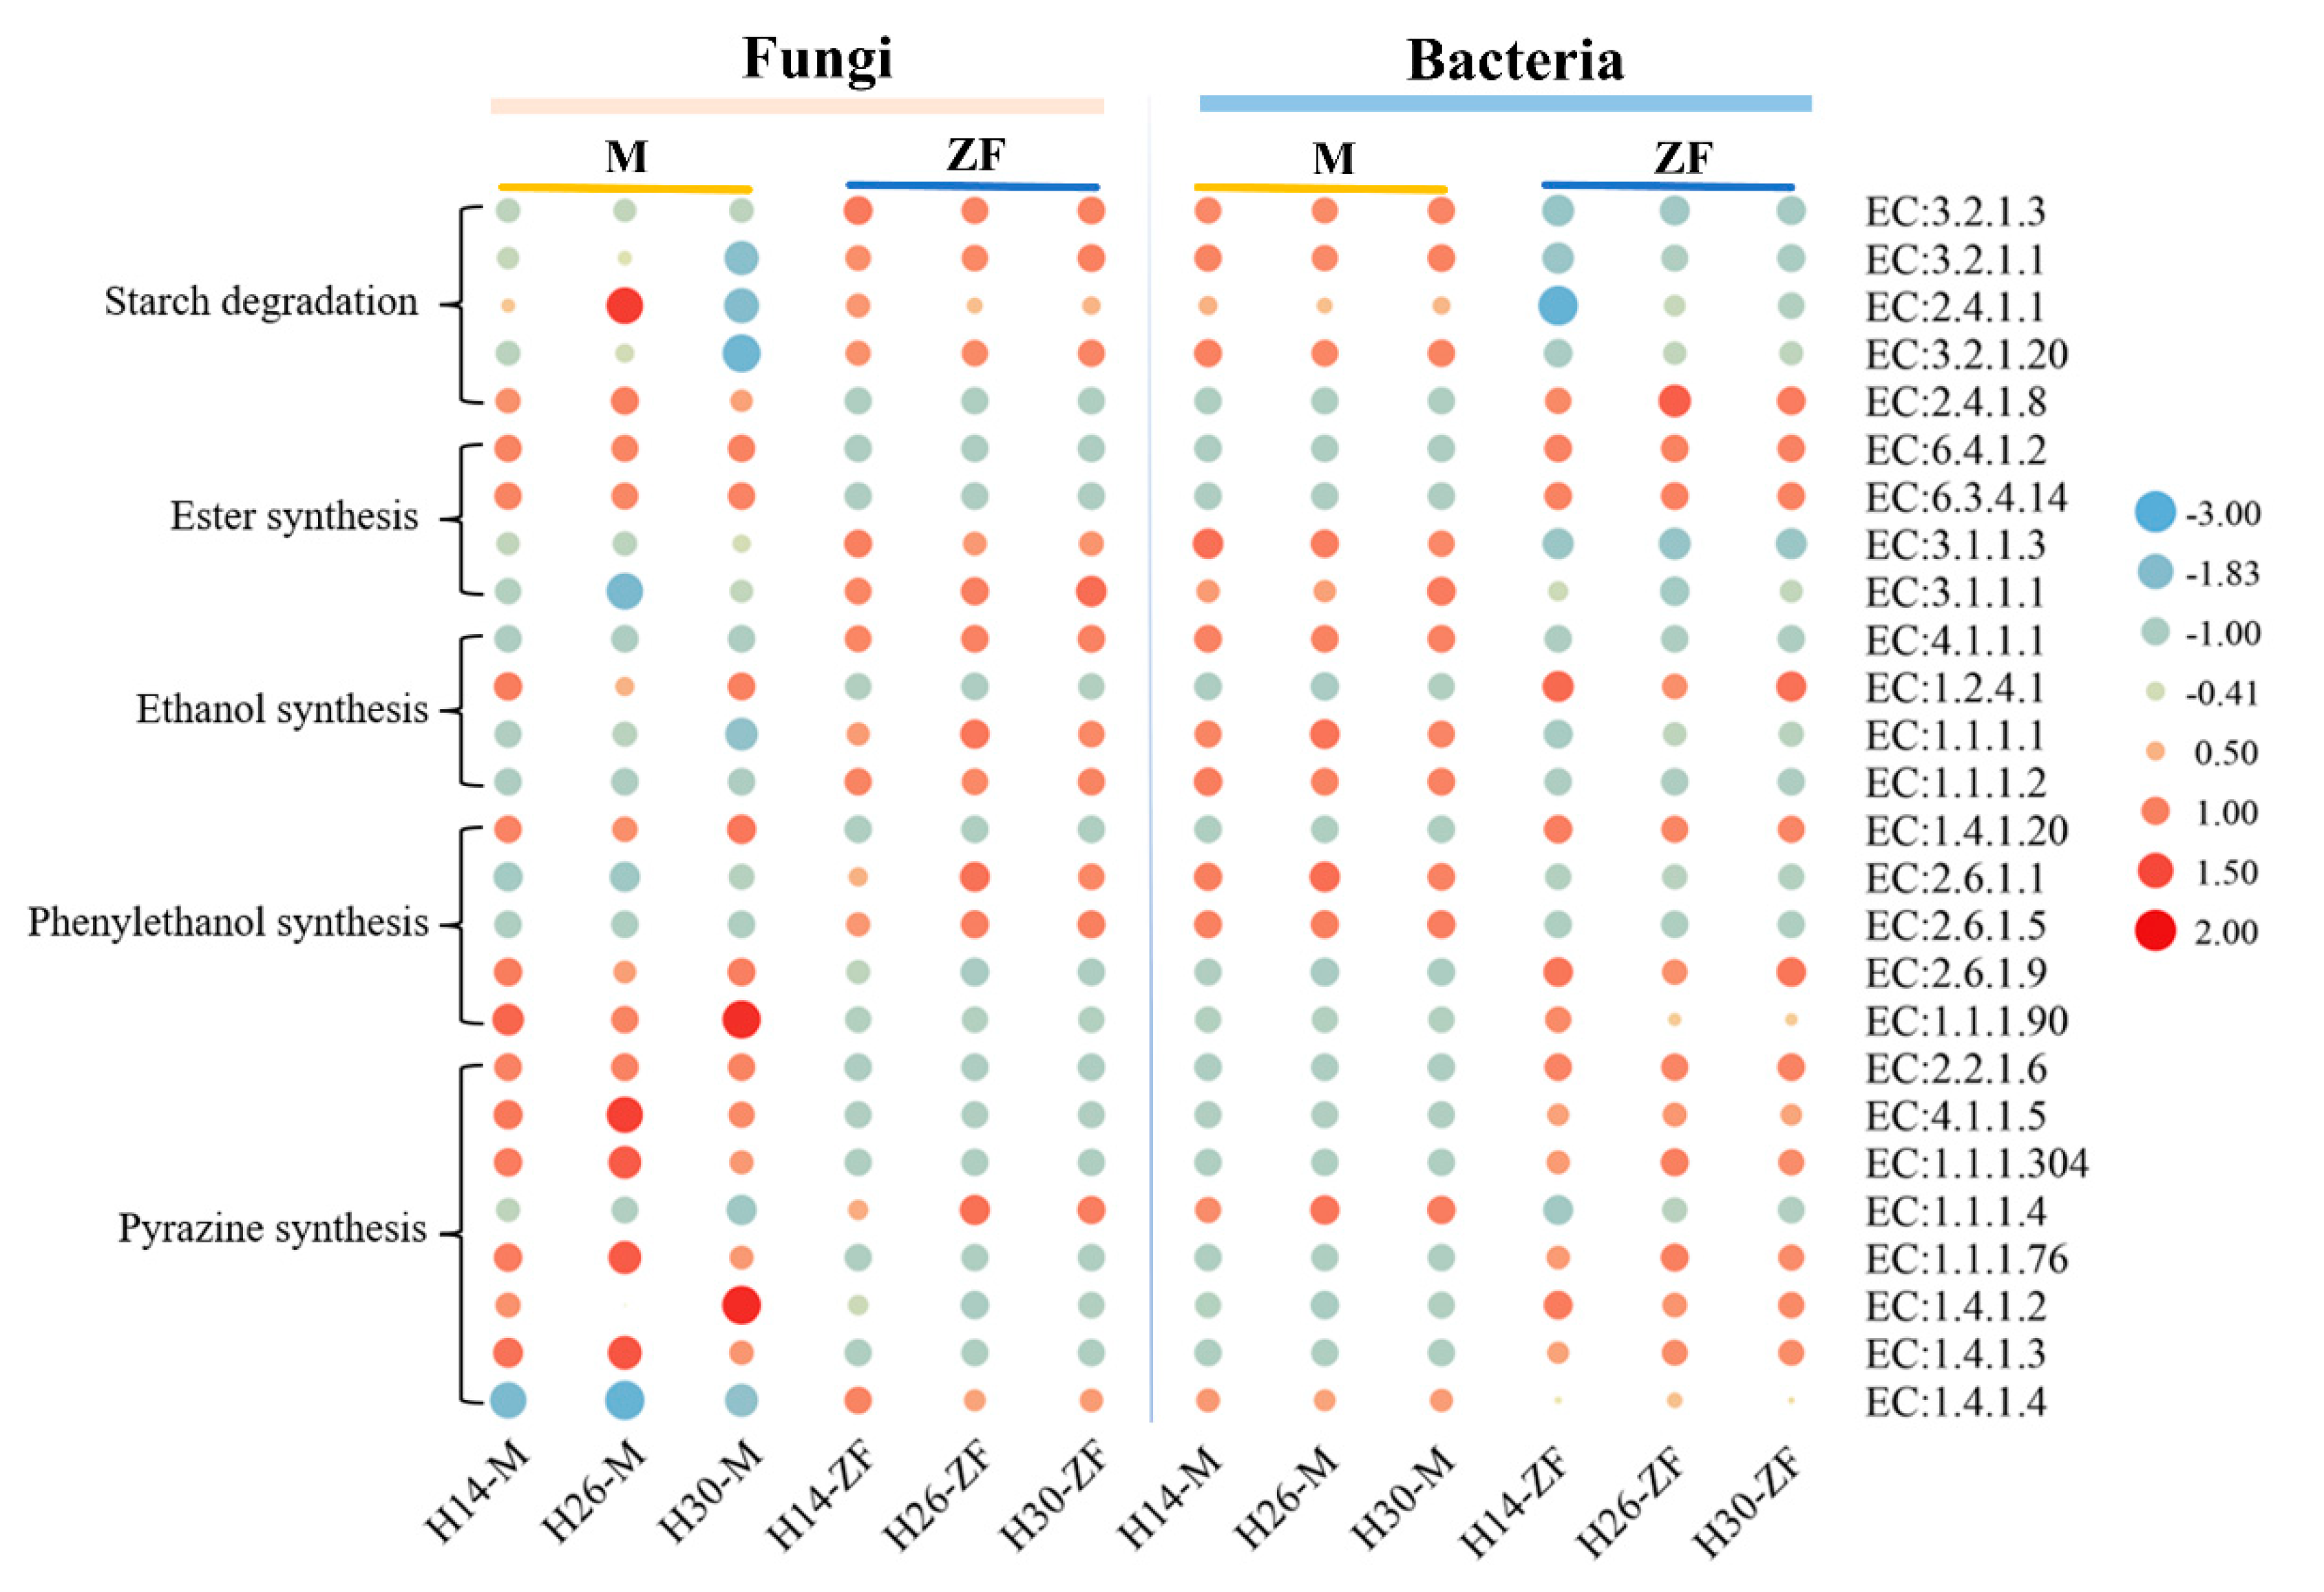
The PICRUSt2-predicted gene annotation results, which illustrate the differences in key enzymes of metabolic pathways between Muqu and HTD, are presented in Figure 7. The pathways primarily involved the degradation of starch and the synthesis of esters, ethanol, phenethyl alcohol, and pyrazine compounds. Five enzymes were annotated for starch degradation, showing that fungi in HTD contributed higher enzyme abundances compared to Muqu, while bacterial enzymes exhibited the opposite pattern. This suggested that the starch hydrolysis capability in HTD is mainly driven by fungi, whereas in Muqu, bacteria played a more significant role. Four enzymes were annotated for ester synthesis, with EC:6.4.1.2 and EC:6.3.4.14 predominantly produced by fungi in Muqu and bacteria in HTD, whereas EC:3.1.1.3 and EC:3.1.1.1 were mainly contributed by bacteria in Muqu and fungi in HTD. These findings explained the difference in ester production between Muqu and HTD. The synthesis of ethanol followed a similar pattern to starch hydrolysis, with fungi contributing more to ethanol synthesis in HTD, and bacteria contributing more in Muqu. For phenethyl alcohol synthesis, five annotated enzymes showed varied contributions: EC:1.4.1.20, EC:2.6.1.9, and EC:1.1.1.90 were more abundant in Muqu’s fungi than HTD, while EC:2.6.1.1 and EC:2.6.1.5 exhibited the opposite patterns. The synthesis of pyrazine compounds involved eight annotated enzymes, with fungi being the primary contributors in Muqu and bacteria in HTD. This indicated that fungi are primarily responsible for pyrazine synthesis in Muqu, while bacteria are more involved in HTD.

4. Conclusions

This study focused on HTD, utilizing various detection techniques to investigate the stability and differences in the properties of three types of fortified HTD used as Muqu. Significant differences were found between Muqu and HTD, with H30-M exhibiting the most stable starch decomposition ability, and H14-M showing relatively stable fermentation ability, acidity, and ammoniacal nitrogen, while H26-M contributed more stably to esterification ability. The metabolic profiles of Muqu and HTD also differed significantly, with Muqu having a more complex volatile profile and HTD containing higher levels of characteristic non-volatile components. Several important volatiles and non-volatile components in the Muqu, such as phenethyl alcohol, methyl palmitate, and methyl linoleate, as well as some amino acids and their derivatives and peptides, were still detected in HTD. Notable differences were also observed in the microbiota structure between Muqu and HTD. The number of cultivable bacteria in Muqu was significantly higher than that in HTD, while the proportion of cultivable mesophilic bacteria increased in HTD. However, the α-diversity of microbiota in Muqu was higher in Muqu. The composition of dominant genera in both Muqu and corresponding HTD samples was similar. Most dominant bacteria were significantly and positively correlated with 1-Hexadecanol and 26 characteristic non-volatile metabolic components. Starch hydrolysis and ethanol synthesis in HTD were mainly driven by fungi, whereas in Muqu bacteria played a more significant role. Additionally, pyrazine synthesis was mainly contributed by fungi in Muqu and bacteria in HTD.

Author Contributions

Conceptualization, Q.T., J.H., and R.Z.; methodology, Y.Z. and Z.Z.; software, Y.Z. and Z.Z.; validation, Y.Z., Q.T. and R.Z.; formal analysis, Y.Z., Z.Z. and R.Z.; investigation, Y.Z.; resources, Q.T., J.H. and R.Z.; data curation, Y.Z.; writing—original draft preparation, Y.Z.; writing—review and editing, Q.T., Y.J. and R.Z.; visualization, Y.Z.; supervision, Q.T., J.H., Y.J. and R.Z.; project administration, R.Z., Q.T. and Y.J. All authors have read and agreed to the published version of the manuscript.

Funding

This research received no external funding.

Data Availability Statement

The original contributions presented in the study are included in the article, further inquiries can be directed to the corresponding author.

Conflicts of Interest

The authors declare no conflict of interest.

References

  1. Yang, L.; Fan, W.L.; Xu, Y. GC × GC-TOF/MS and UPLC-Q-TOF/MS based untargeted metabolomics coupled with physicochemical properties to reveal the characteristics of different type daqus for making soy sauce aroma and flavor type baijiu. LWT 2021, 146, 111416. [Google Scholar] [CrossRef]
  2. Zhu, C.T.; Cheng, Y.X.; Zuo, Q.C.; Huang, Y.G.; Wang, L. Exploring the impacts of traditional crafts on microbial community succession in Jiang-flavored Daqu. Food Res. Int. 2022, 158, 111568. [Google Scholar] [CrossRef] [PubMed]
  3. Deng, L.; Mao, X.; Liu, D.; Ning, X.Q.; Shen, Y.; Chen, B.; Nie, H.F.; Huang, D.; Luo, H.B. Comparative analysis of physicochemical properties and microbial composition in high-temperature Daqu with different colors. Front. Microbiol. 2020, 11, 588117. [Google Scholar] [CrossRef] [PubMed]
  4. Yang, L.; Fan, W.L.; Xu, Y. Chameleon-like microbes promote microecological differentiation of Daqu. Food Microbiol. 2023, 109, 104144. [Google Scholar] [CrossRef] [PubMed]
  5. Fu, G.M.; Deng, M.F.; Chen, Y.; Chen, Y.R.; Wu, S.W.; Lin, P.; Huang, B.J.; Liu, C.M.; Wan, Y. Analysis of microbial community, physiochemical indices, and volatile compounds of Chinese te-flavor baijiu daqu produced in different seasons. J. Sci. Food Agric. 2021, 101, 6525–6532. [Google Scholar] [CrossRef]
  6. Guan, T.W.; Yang, H.; Ou, M.Y.; Zhang, J.X. Storage period affecting dynamic succession of microbiota and quality changes of strong-flavor Baijiu Daqu. LWT 2021, 139, 110544. [Google Scholar] [CrossRef]
  7. Wang, X.D.; Ban, S.D.; Hu, B.D.; Qiu, S.Y.; Zhou, H.X. Bacterial diversity of Moutai-flavour Daqu based on high-throughput sequencing method. J. Inst. Brew. 2017, 123, 138–143. [Google Scholar] [CrossRef]
  8. Shi, W.; Chai, L.J.; Fang, G.Y.; Mei, J.L.; Lu, Z.M.; Zhang, X.J.; Xiao, C.; Wang, S.T.; Shen, C.H.; Shi, J.S.; et al. Spatial heterogeneity of the microbiome and metabolome profiles of high-temperature Daqu in the same workshop. Food Res. Int. 2022, 156, 111298. [Google Scholar] [CrossRef]
  9. Wu, M.Y.; Luo, Y.; Yao, Y.Q.; Ji, W.; Xia, X.L. Multidimensional analysis of wheat original crucial endogenous enzymes driving microbial communities metabolism during high-temperature Daqu fermentation. Int. J. Food Microbiol. 2024, 413, 110589. [Google Scholar] [CrossRef]
  10. Xu, Y.Q.; Wang, X.C.; Liu, X.; Li, X.T.; Zhang, C.N.; Li, W.W.; Sun, X.T.; Wang, W.H.; Sun, B.G. Discovery and development of a novel short-chain fatty acid ester synthetic biocatalyst under aqueous phase from Monascus purpureus isolated from Baijiu. Food Chem. 2020, 338, 128025. [Google Scholar] [CrossRef]
  11. Mao, J.J.; Liu, X.L.; Gao, T.; Gu, S.B.; Wu, Y.; Zhao, L.N.; Ma, J.L.; Li, X.; Zhang, J. Unraveling the correlations between bacterial diversity, physicochemical properties and bacterial community succession during the fermentation of traditional Chinese strong-flavor Daqu. LWT 2022, 154, 112764. [Google Scholar] [CrossRef]
  12. Hu, Y.A.; Huang, X.N.; Yang, B.; Zhang, X.; Han, Y.; Chen, X.X.; Han, B.Z. Contrasting the microbial community and metabolic profile of three types of light-flavor Daqu. Food Biosci. 2021, 44, 101395. [Google Scholar] [CrossRef]
  13. He, G.Q.; Dong, Y.; Huang, J.; Wang, X.J.; Zhang, S.Y.; Wu, C.D.; Jin, Y.; Zhou, R.Q. Alteration of microbial community for improving flavor character of Daqu by inoculation with Bacillus velezensis and Bacillus subtilis. LWT 2019, 111, 1–8. [Google Scholar] [CrossRef]
  14. Zhang, R.; Wu, Q.; Xu, Y. Aroma characteristics of Moutai-flavour liquor produced with Bacillus licheniformis by solid-state fermentation. Lett. Appl. Microbiol. 2013, 57, 11–18. [Google Scholar] [CrossRef]
  15. Wang, P.; Wu, Q.; Jiang, X.J.; Wang, Z.Q.; Tang, J.L.; Xu, Y. Bacillus licheniformis affects the microbial community and metabolic profile in the spontaneous fermentation of Daqu starter for Chinese liquor making. Int. J. Food Microbiol. 2017, 250, 59–67. [Google Scholar] [CrossRef] [PubMed]
  16. Tang, Q.; Chen, X.; Huang, J.; Zhang, S.Y.; Qin, H.; Dong, Y.; Wang, C.; Wang, X.J.; Wu, C.D.; Jin, Y.; et al. Mechanism of Enhancing Pyrazines in Daqu via Inoculating Bacillus licheniformis with Strains Specificity. Foods 2023, 12, 304. [Google Scholar] [CrossRef] [PubMed]
  17. Ai, M.; Qiu, X.; Huang, J.; Wu, C.D.; Jin, Y.; Zhou, R.Q. Characterizing the microbial diversity and major metabolites of Sichuan bran vinegar augmented by Monascus purpureus. Int. J. Food Microbiol. 2019, 292, 83–90. [Google Scholar] [CrossRef]
  18. QB/T 4257–2011; General Methods of Analysis for DAQU. China Light Industry Press: Beijing, China, 2011.
  19. Stevenson, K.E.; Lembke, F. Compendium of Methods for the Microbiological Examination of Foods, 5th ed.; American Public Health Association (APHA): Washington, DC, USA, 2014; pp. 299–304. [Google Scholar]
  20. GB/T 26408–2010; Method for Determination of Bacillus subtilis in Feeds. National Standard Press: Beijing, China, 2011.
  21. Tong, W.H.; He, P.; Yang, Y.; Qiao, Z.W.; Huang, D.; Luo, H.B.; Feng, X.J. Occurrence, diversity, and character of bacillaceae in the solid fermentation process of strong aromatic liquors. Front. Microbiol. 2022, 12, 811788. [Google Scholar] [CrossRef]
  22. Guan, Q.J.; Meng, L.J.; Mei, Z.L.; Liu, Q.R.; Chai, L.J.; Zhong, X.Z.; Zheng, L.; Liu, G.Q.; Wang, S.T.; Shen, C.H.; et al. Volatile compound abundance correlations provide a new insight into odor balances in sauce-aroma Baijiu. Foods 2022, 11, 3916. [Google Scholar] [CrossRef]
  23. Guo, W.H.; Sheng, J.Y.; Zhao, H.M.; Feng, X.Y. Metabolic engineering of Saccharomyces cerevisiae to produce 1-hexadecanol from xylose. Microb. Cell Fact. 2016, 15, 24. [Google Scholar] [CrossRef]
  24. Ma, Y.; Huang, Y.G. Volatile Components and Aroma Characteristics of Fen-Maotai-Flavored Liquor. Food Sci. 2019, 40, 241–248. [Google Scholar]
  25. He, J.H. Analysis and Reconfiguration of Aromatic Substances in Medium-Temperature Daqu. Master’s Thesis, Jiangnan University, Wuxi, China, 2022. [Google Scholar]
  26. Lin, M.W.; Yang, B.Y.; Dai, M.Q.; Xu, Y.Q.; Li, X.T.; Sun, B.G. East meets west in alcoholic beverages: Flavor comparison, microbial metabolism and health effects. Food Biosci. 2023, 56, 103385. [Google Scholar] [CrossRef]
  27. Wang, L.Q.; Tang, P.; Zhang, P.J.; Liu, J.; Chen, Y.F.; Xiao, D.G.; Guo, X.W. Unraveling the aroma profiling of Baijiu: Sensory characteristics of aroma compounds, analytical approaches, key odor-active compounds in different Baijiu, and their synthesis mechanisms. Trends Food Sci. Tech. 2024, 146, 104376. [Google Scholar] [CrossRef]
  28. Wang, Z.X.; Chen, L.Q.; Yang, F.; Wang, X.L.; Hu, Y.; Wang, T.; Lu, X.; Lu, J.J.; Hu, C.X.; Tu, H.B.; et al. High-sensitivity profiling of dipeptides in sauce-flavor Baijiu Daqu by chemical derivatization and ultrahigh-performance liquid chromatography coupled with high-resolution mass spectrometry. Food Chem. X 2024, 21, 101097. [Google Scholar] [CrossRef]
  29. Yu, Y.; Yu, W.H.; Jin, Y. Peptidomics analysis of Jiang-flavor Daqu from high-temperature fermentation to mature and in different preparation season. J. Proteom. 2023, 273, 104804. [Google Scholar] [CrossRef]
  30. Ding, F.; Zhang, Y.D.; Jiang, Y.L.; Chen, B.; Chen, X.X.; Han, B.Z. Microbial communities and metabolites characteristics of high temperature Daqu with different grades. Chin. Brew. 2022, 41, 24–30. [Google Scholar]
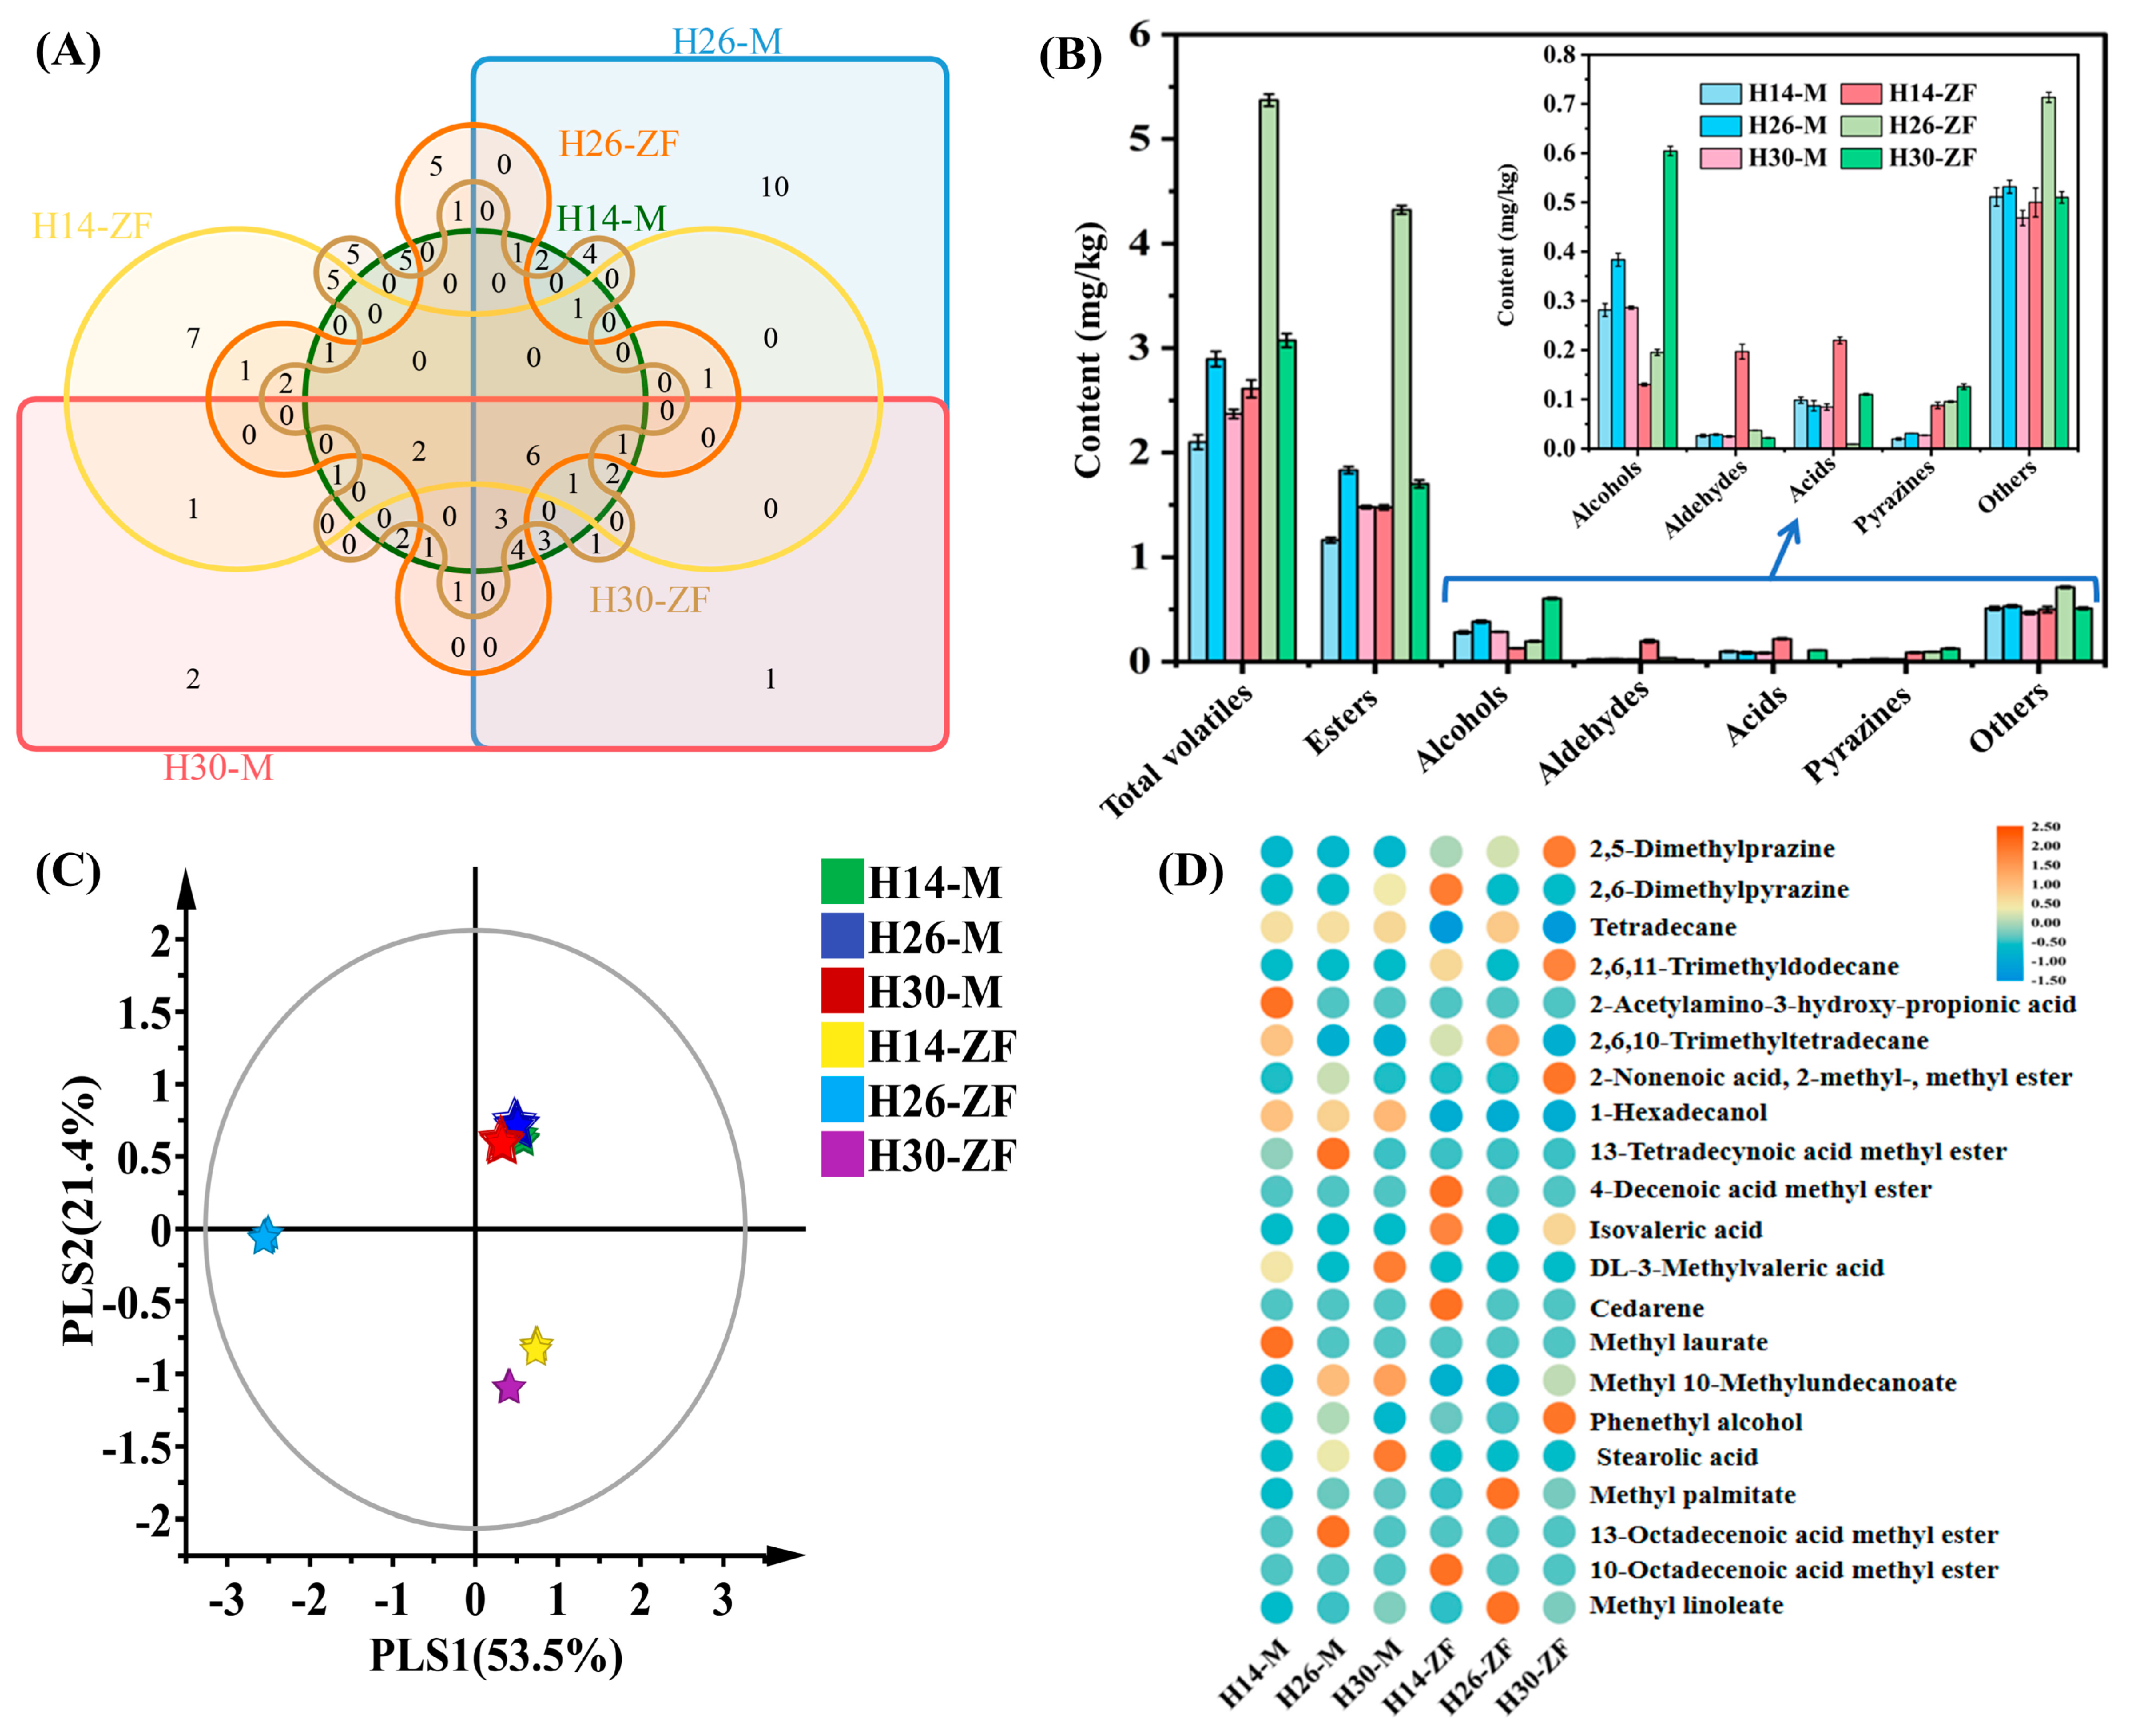
Figure 1. (A) Venn diagrams of volatile fractions of different Daqu; (B) volatile fraction content; (C) PLS-DA of volatiles; (D) heatmap displaying characteristic volatile metabolites.
Foods 13 03098 g001
Figure 2. (A) The content of non-volatiles in different Daqu; (B) PLS-DA of non-volatiles; (C) heatmap displaying characteristic non-volatile components.
Foods 13 03098 g002
Figure 3. Rarefaction curves of (A) bacterial communities and (B) fungal communities; differences in β−diversity of (C) bacterial communities and (D) fungal communities; composition of microbial communities at genus level of (E) bacterial communities and (F) fungal communities.
Foods 13 03098 g003
Figure 4. LEfSe of (A) bacterial and (B) fungal communities in Daqu (M and ZF represented Muqu and HTD); the source proportion of (C) bacteria and (D) fungi in HTD derived from the Muqu and the environment.
Foods 13 03098 g004
Figure 5. Mantel analysis between microbial communities and physicochemical indicators, (A) Muqu, (B) HTD; redundancy analysis between dominant genera and enzymatic properties of Daqu, (C) Muqu, (D) HTD (M: Moisture; SA: Saccharification ability; LA: Liquefaction ability; FA: Fermentation ability; EA: Esterification ability; A: Acidity; AN: Ammoniacal Nitrogen; *: p < 0.05; **: p < 0.01; ***: p < 0.001).
Foods 13 03098 g005
Figure 6. (A) Correlation analysis of dominant genera and characteristic volatile metabolites; (B) correlation analysis of dominant genera and non-volatile metabolites, (B) different categories and (C) characteristic non-metabolites (* represented p < 0.05).
Foods 13 03098 g006
Figure 7. Differential analysis of key enzymes in the Daqu.
Foods 13 03098 g007
Table 1. Differences in the physicochemical properties of Daqu.
SampleMoisture
(g/100 g)
Saccharification Ability (mg/g·h)Liquefaction Ability (g/g·h)Fermentation Ability (g/0.5 g·72 h)Esterification Ability (mg/50 g·7 d)Acidity (mmol/10 g)Ammoniacal Nitrogen (g/kg)
H14-M9.94 ± 0.15 d81.73 ± 1.65 d0.05 ± 0.00 d0.11 ± 0.00 d603.95 ± 5.29 c1.74 ± 0.01 a4.92 ± 0.02 d
H26-M9.59 ± 0.20 e46.72 ± 0.43 e0.05 ± 0.00 d0.08 ± 0.00 f617.23 ± 1.93 b1.74 ± 0.01 a4.52 ± 0.01 e
H30-M9.81 ± 0.05 d108.93 ± 2.23 c0.07 ± 0.00 c0.10 ± 0.00 e602.64 ± 2.10 c1.62 ± 0.01 c3.81 ± 0.01 f
H14-ZF11.85 ± 0.19 c21.05 ± 0.26 f0.03 ± 0.00 e0.23 ± 0.02 a190.08 ± 2.04 e1.70 ± 0.01 b6.20 ± 0.01 a
H26-ZF13.09 ± 0.08 b439.86 ± 1.56 a0.36 ± 0.00 a0.20 ± 0.00 b529.09 ± 7.58 d1.29 ± 0.01 d5.35 ± 0.01 b
H30-ZF18.11 ± 0.09 a219.04 ± 2.21 b0.29 ± 0.00 b0.17 ± 0.00 c742.09 ± 16.45 a1.00 ± 0.01 e5.18 ± 0.02 c
Note: Different letters in the same column represent significant differences (Duncan’s test, p < 0.05).
Table 2. Counts of cultivable microorganisms.
SampleBacteria (CFU/g)Mesophilic Bacteria (CFU/g)Fungi (CFU/g)
H14-M(1.16 ± 0.01) × 109 b(1.13 ± 0.03) × 108 a(1.07 ± 0.22) × 104 e
H26-M(9.72 ± 0.21) × 108 c(3.63 ± 0.13) × 107 d(1.60 ± 0.22) × 104 d
H30-M(1.24 ± 0.02) × 109 a(3.97 ± 0.15) × 107 c(6.22 ± 0.13) × 103 f
H14-ZF(5.74 ± 0.12) × 107 f(3.35 ± 0.19) × 107 d(4.62 ± 0.45) × 105 a
H26-ZF(7.28 ± 0.20) × 107 e(4.01 ± 0.09) × 107 c(4.80 ± 0.58) × 104 c
H30-ZF(1.38 ± 0.03) × 108 d(1.08 ± 0.02) × 108 b(2.31 ± 0.13) × 105 b
Note: Different letters in the same column represent significant differences (Duncan’s test, p < 0.05).
Table 3. Differences in community α-diversity.
Number of DaquBacteriaFungi
Chao1ShannonChao1Shannon
H14-M211.964.5659.022.71
H26-M209.204.6543.901.65
H30-M159.094.2263.002.42
H14-ZF173.063.9568.002.28
H26-ZF274.243.8566.051.60
H30-ZF216.083.8449.001.97
Disclaimer/Publisher’s Note: The statements, opinions and data contained in all publications are solely those of the individual author(s) and contributor(s) and not of MDPI and/or the editor(s). MDPI and/or the editor(s) disclaim responsibility for any injury to people or property resulting from any ideas, methods, instructions or products referred to in the content.