
Effects of a Sorghum Beverage with Lacticaseibacillus paracasei on Body Composition, Lipid Profiles, and Intestinal Health in Overweight and Obese Adults: A Randomized Single-Blind Pilot Study

 ,
,  , , , ,
  ,
,
Abstract
:
1. Introduction
2. Materials and Methods
2.1. Beverage Preparation
2.2. Chemical Composition of Beverages
2.3. Study Design
2.4. Study Population
2.5. Body Composition
2.6. Biochemical Markers
2.7. Gastrointestinal Symptom Rating Scale and Bristol Stool Form Scale Questionnaire
2.8. Intestinal Permeability Test
2.9. Short-Chain Fatty Acid Analysis
2.10. Fecal pH
2.11. DNA Extraction and Fecal PCR Analysis
2.12. Statistical Analysis
3. Results
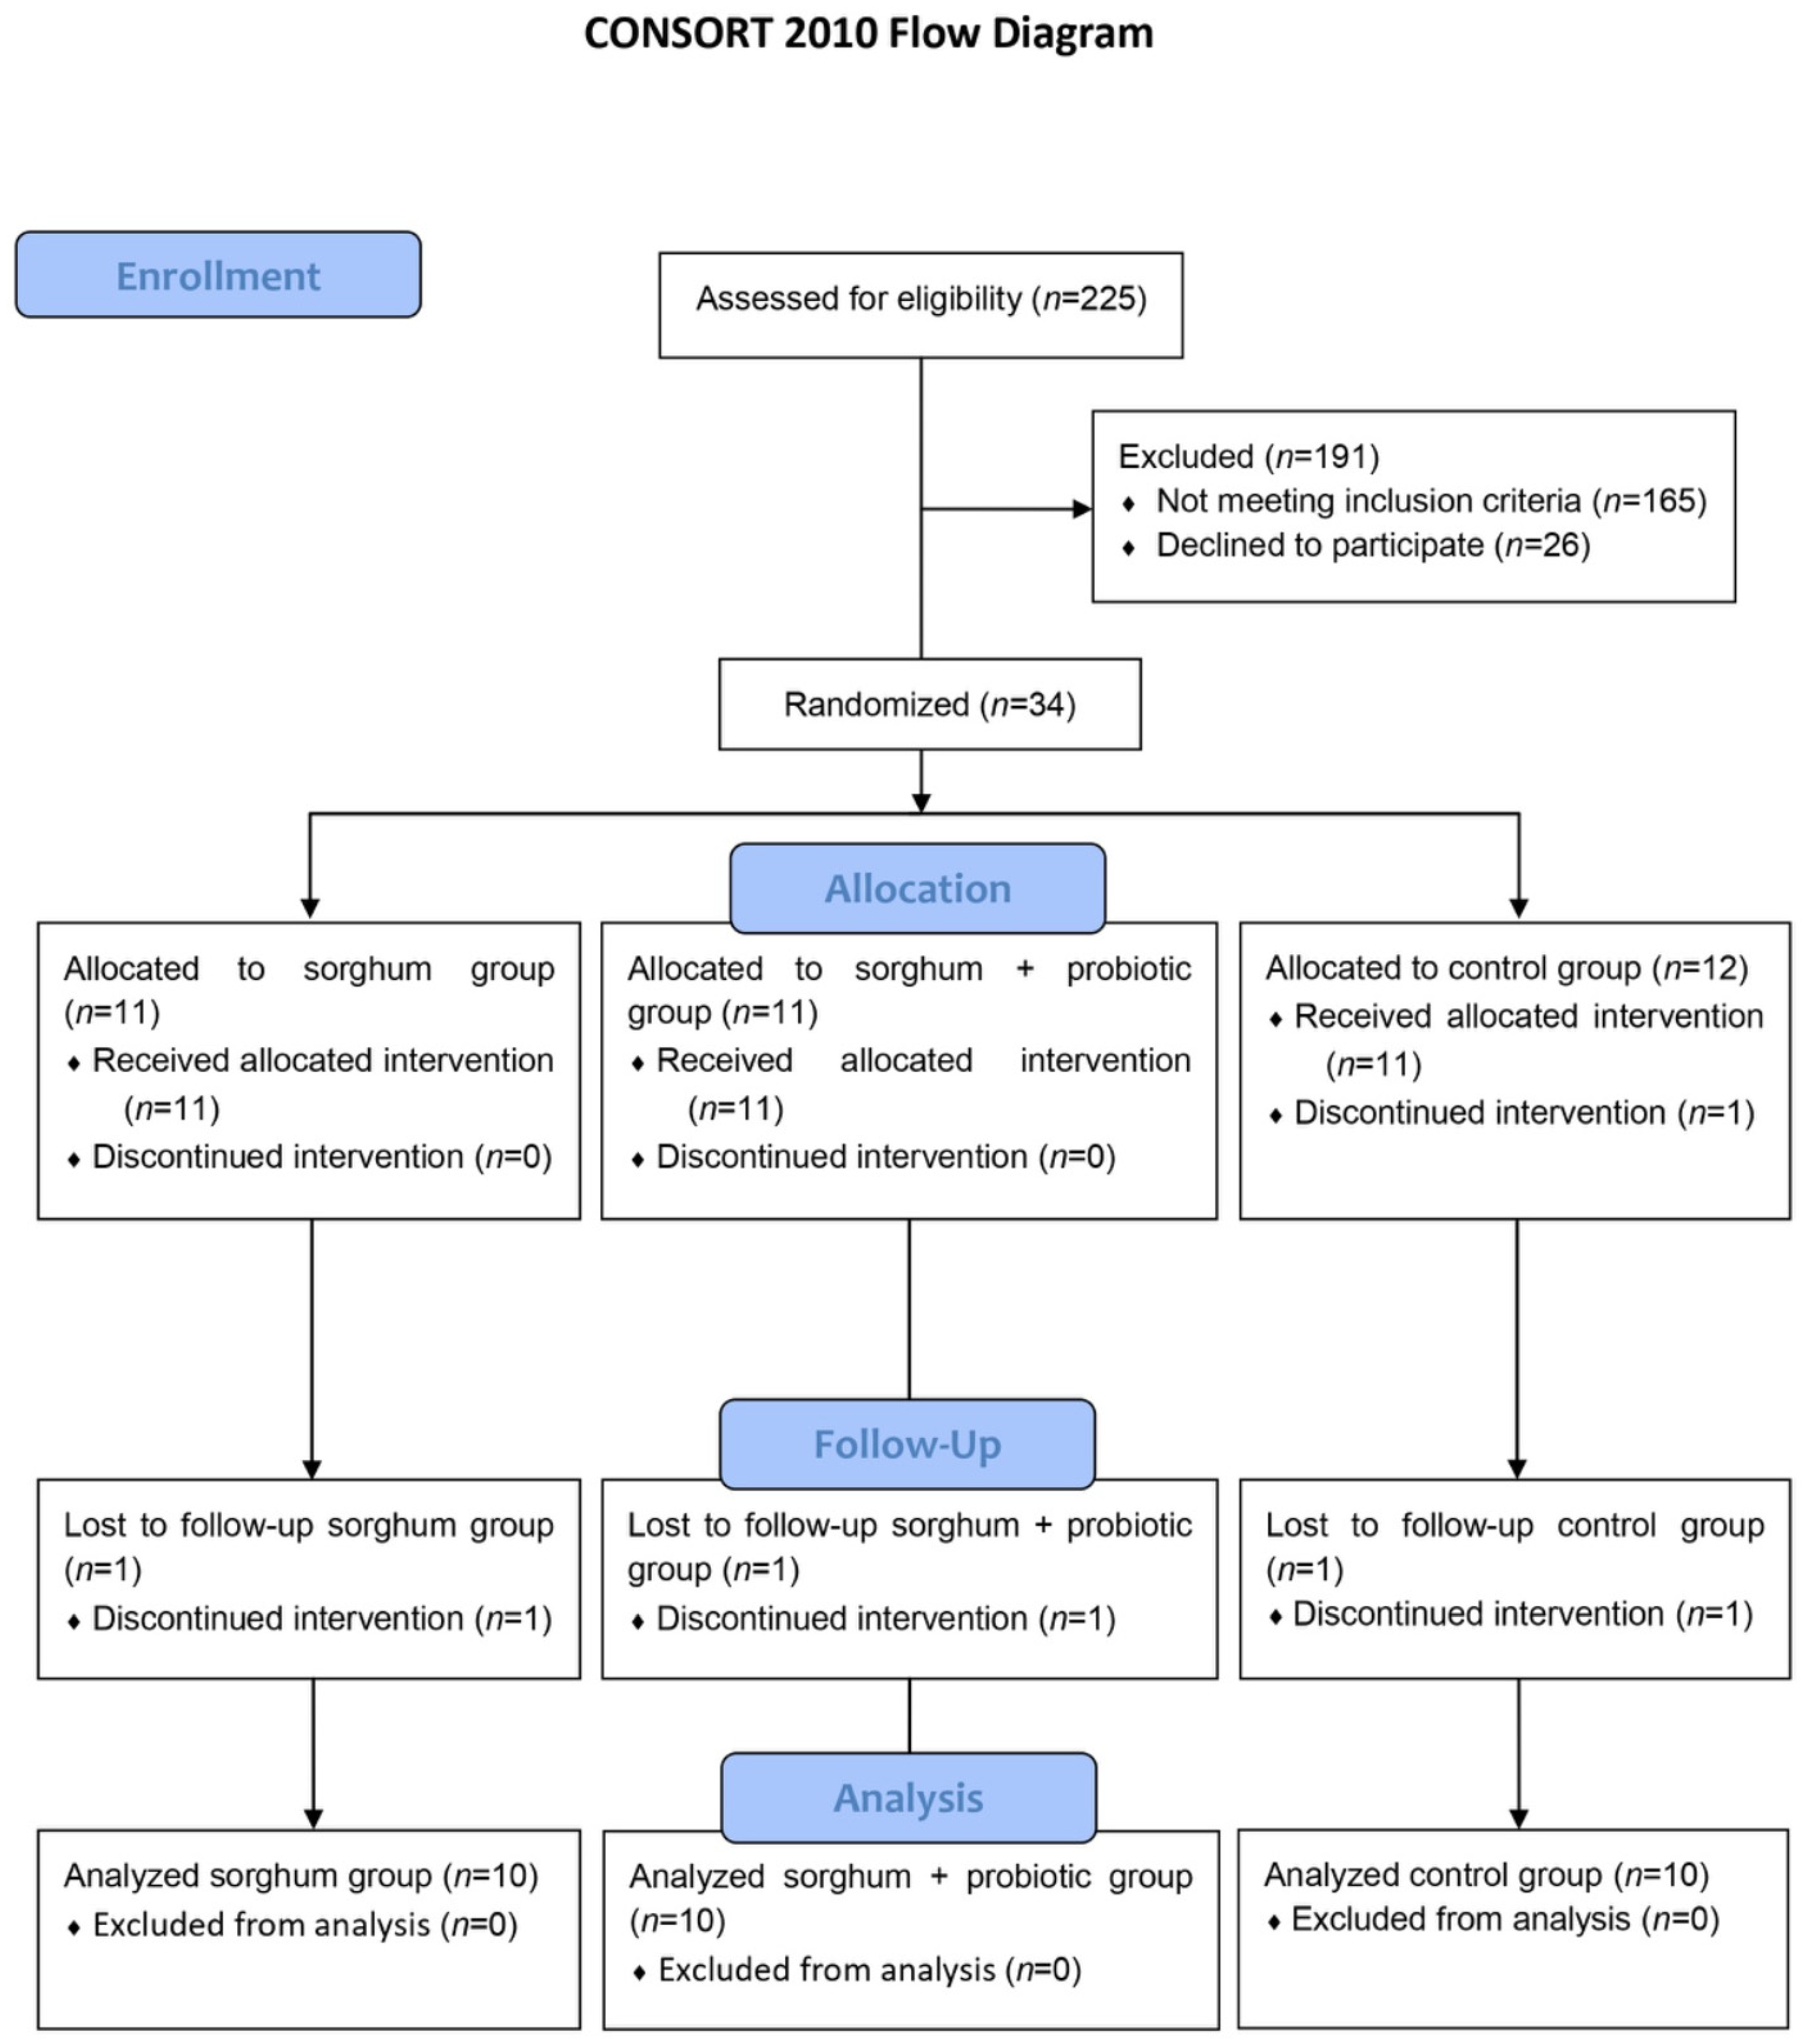
3.1. Participants
3.2. Beverage Chemical Composition
3.3. Effects of ESB with Lacticaseibacillus paracasei TRA061676 on Body Composition and Biochemical Markers
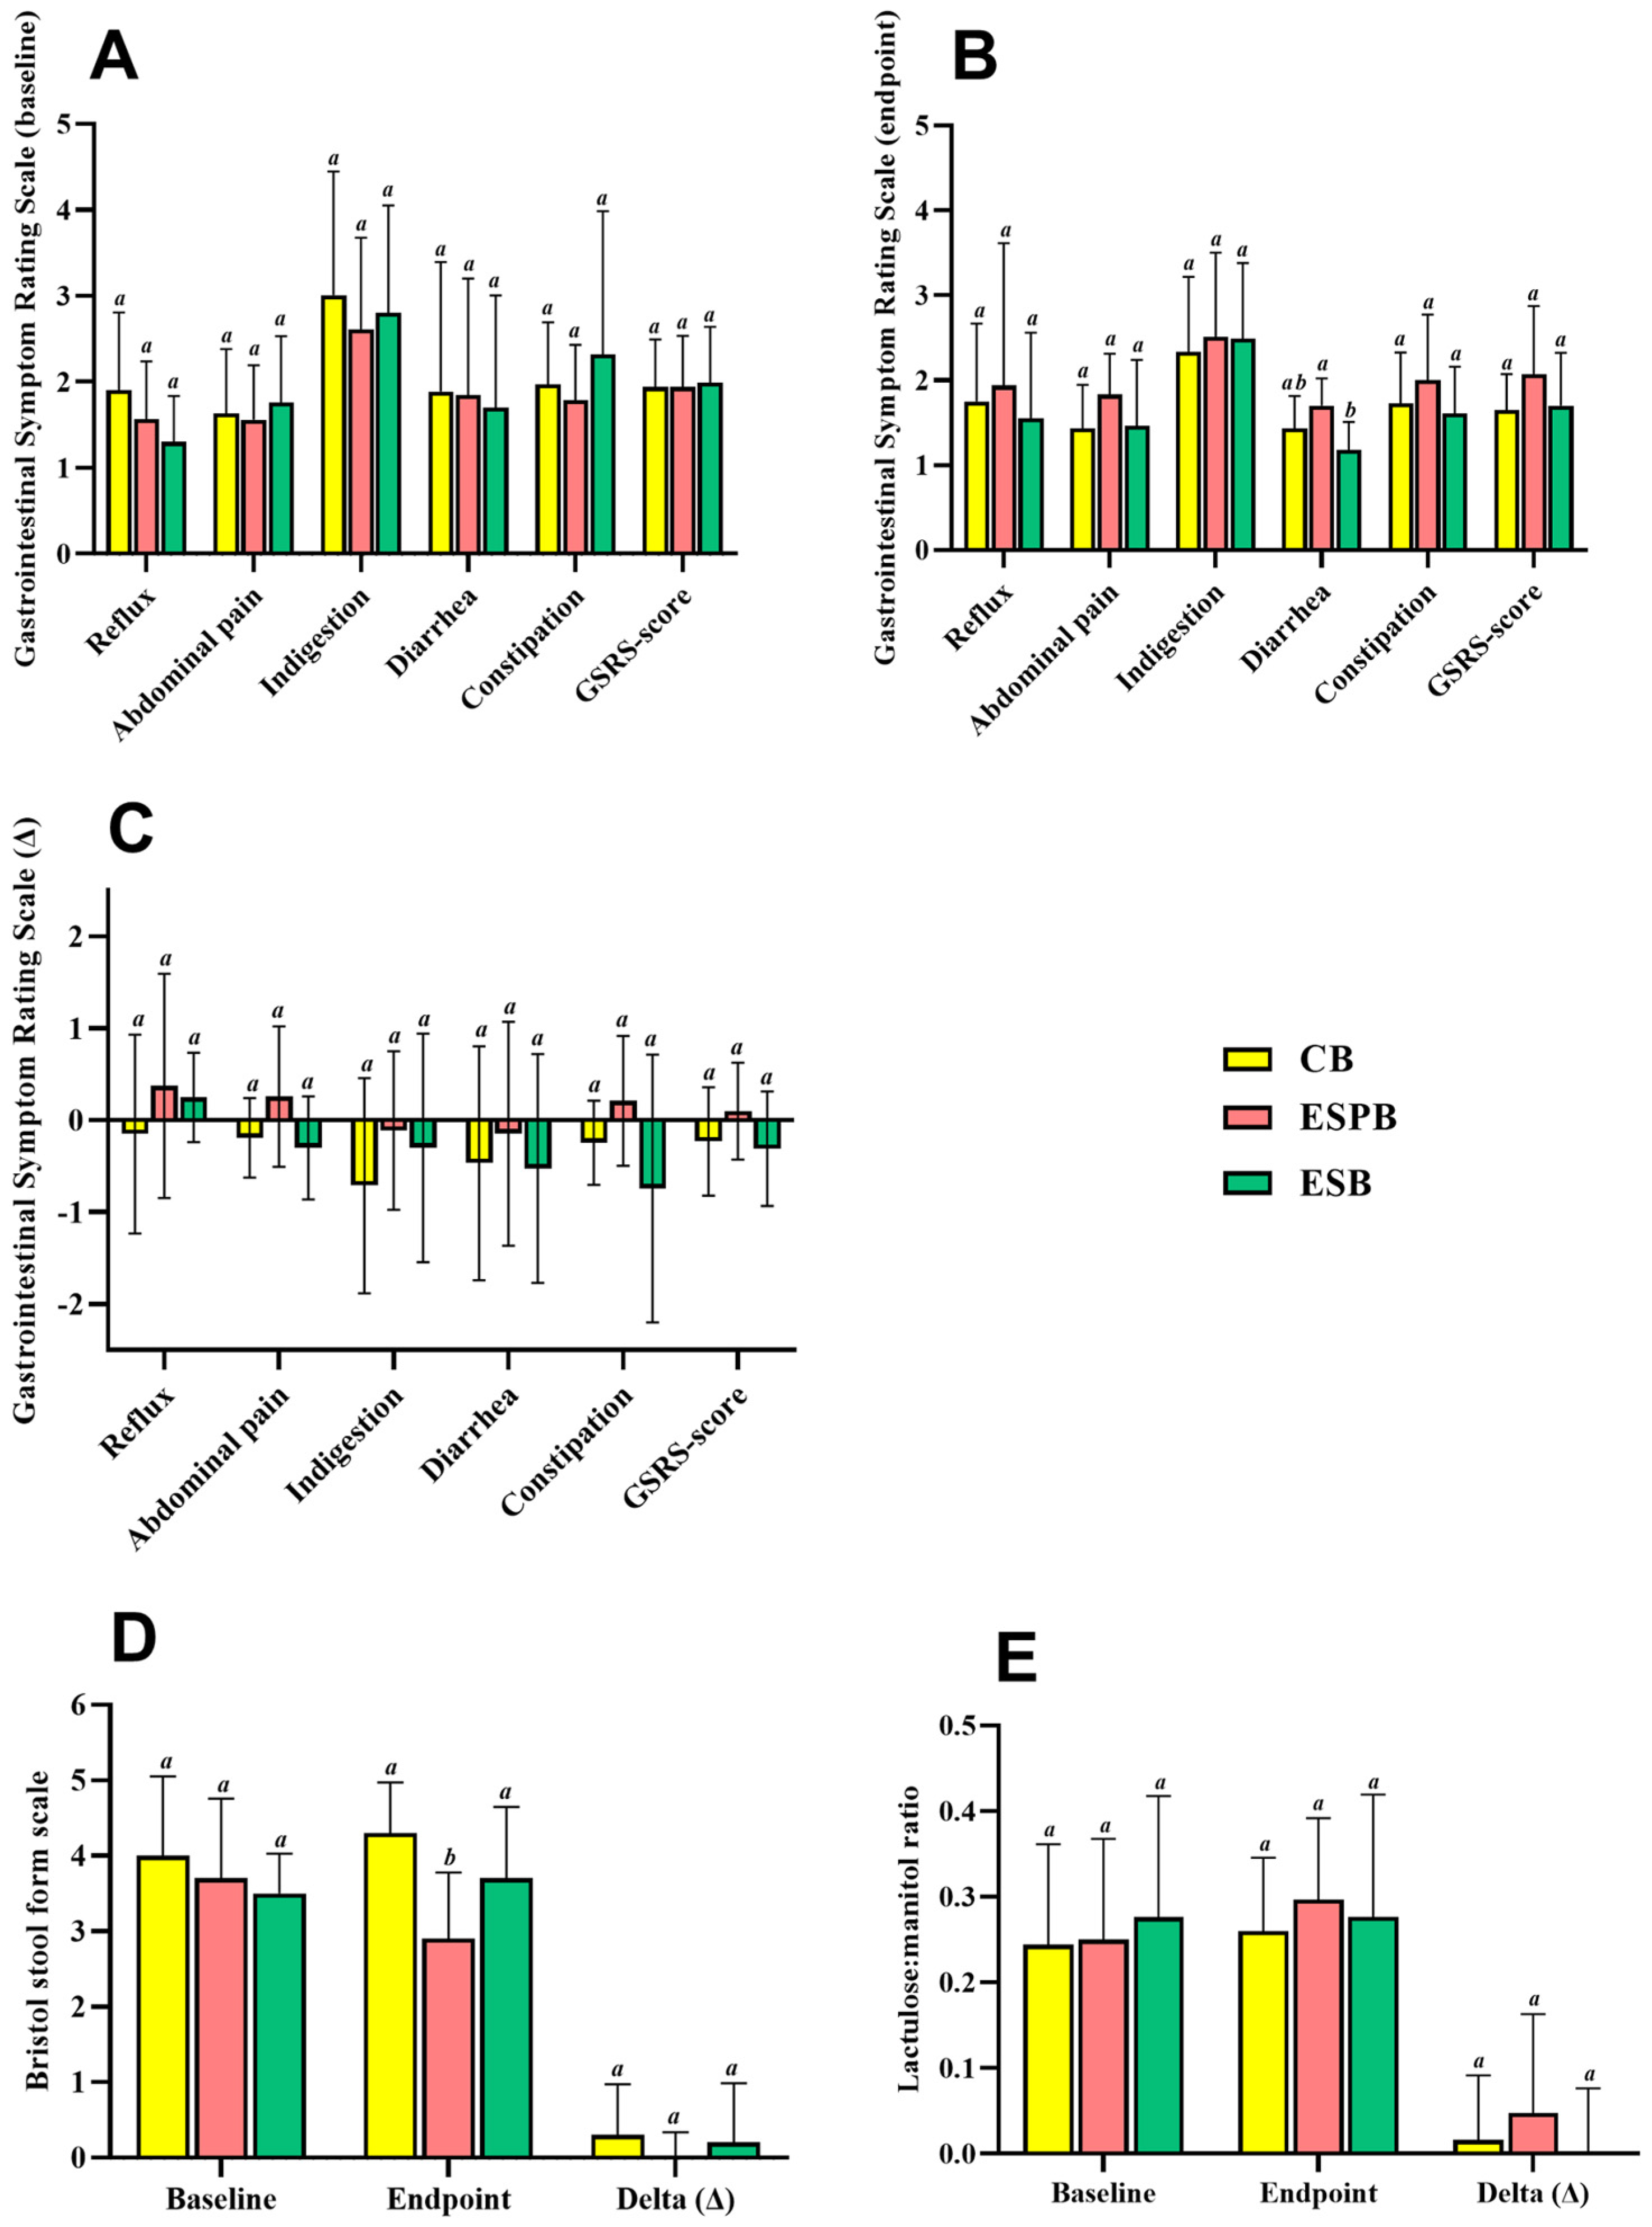
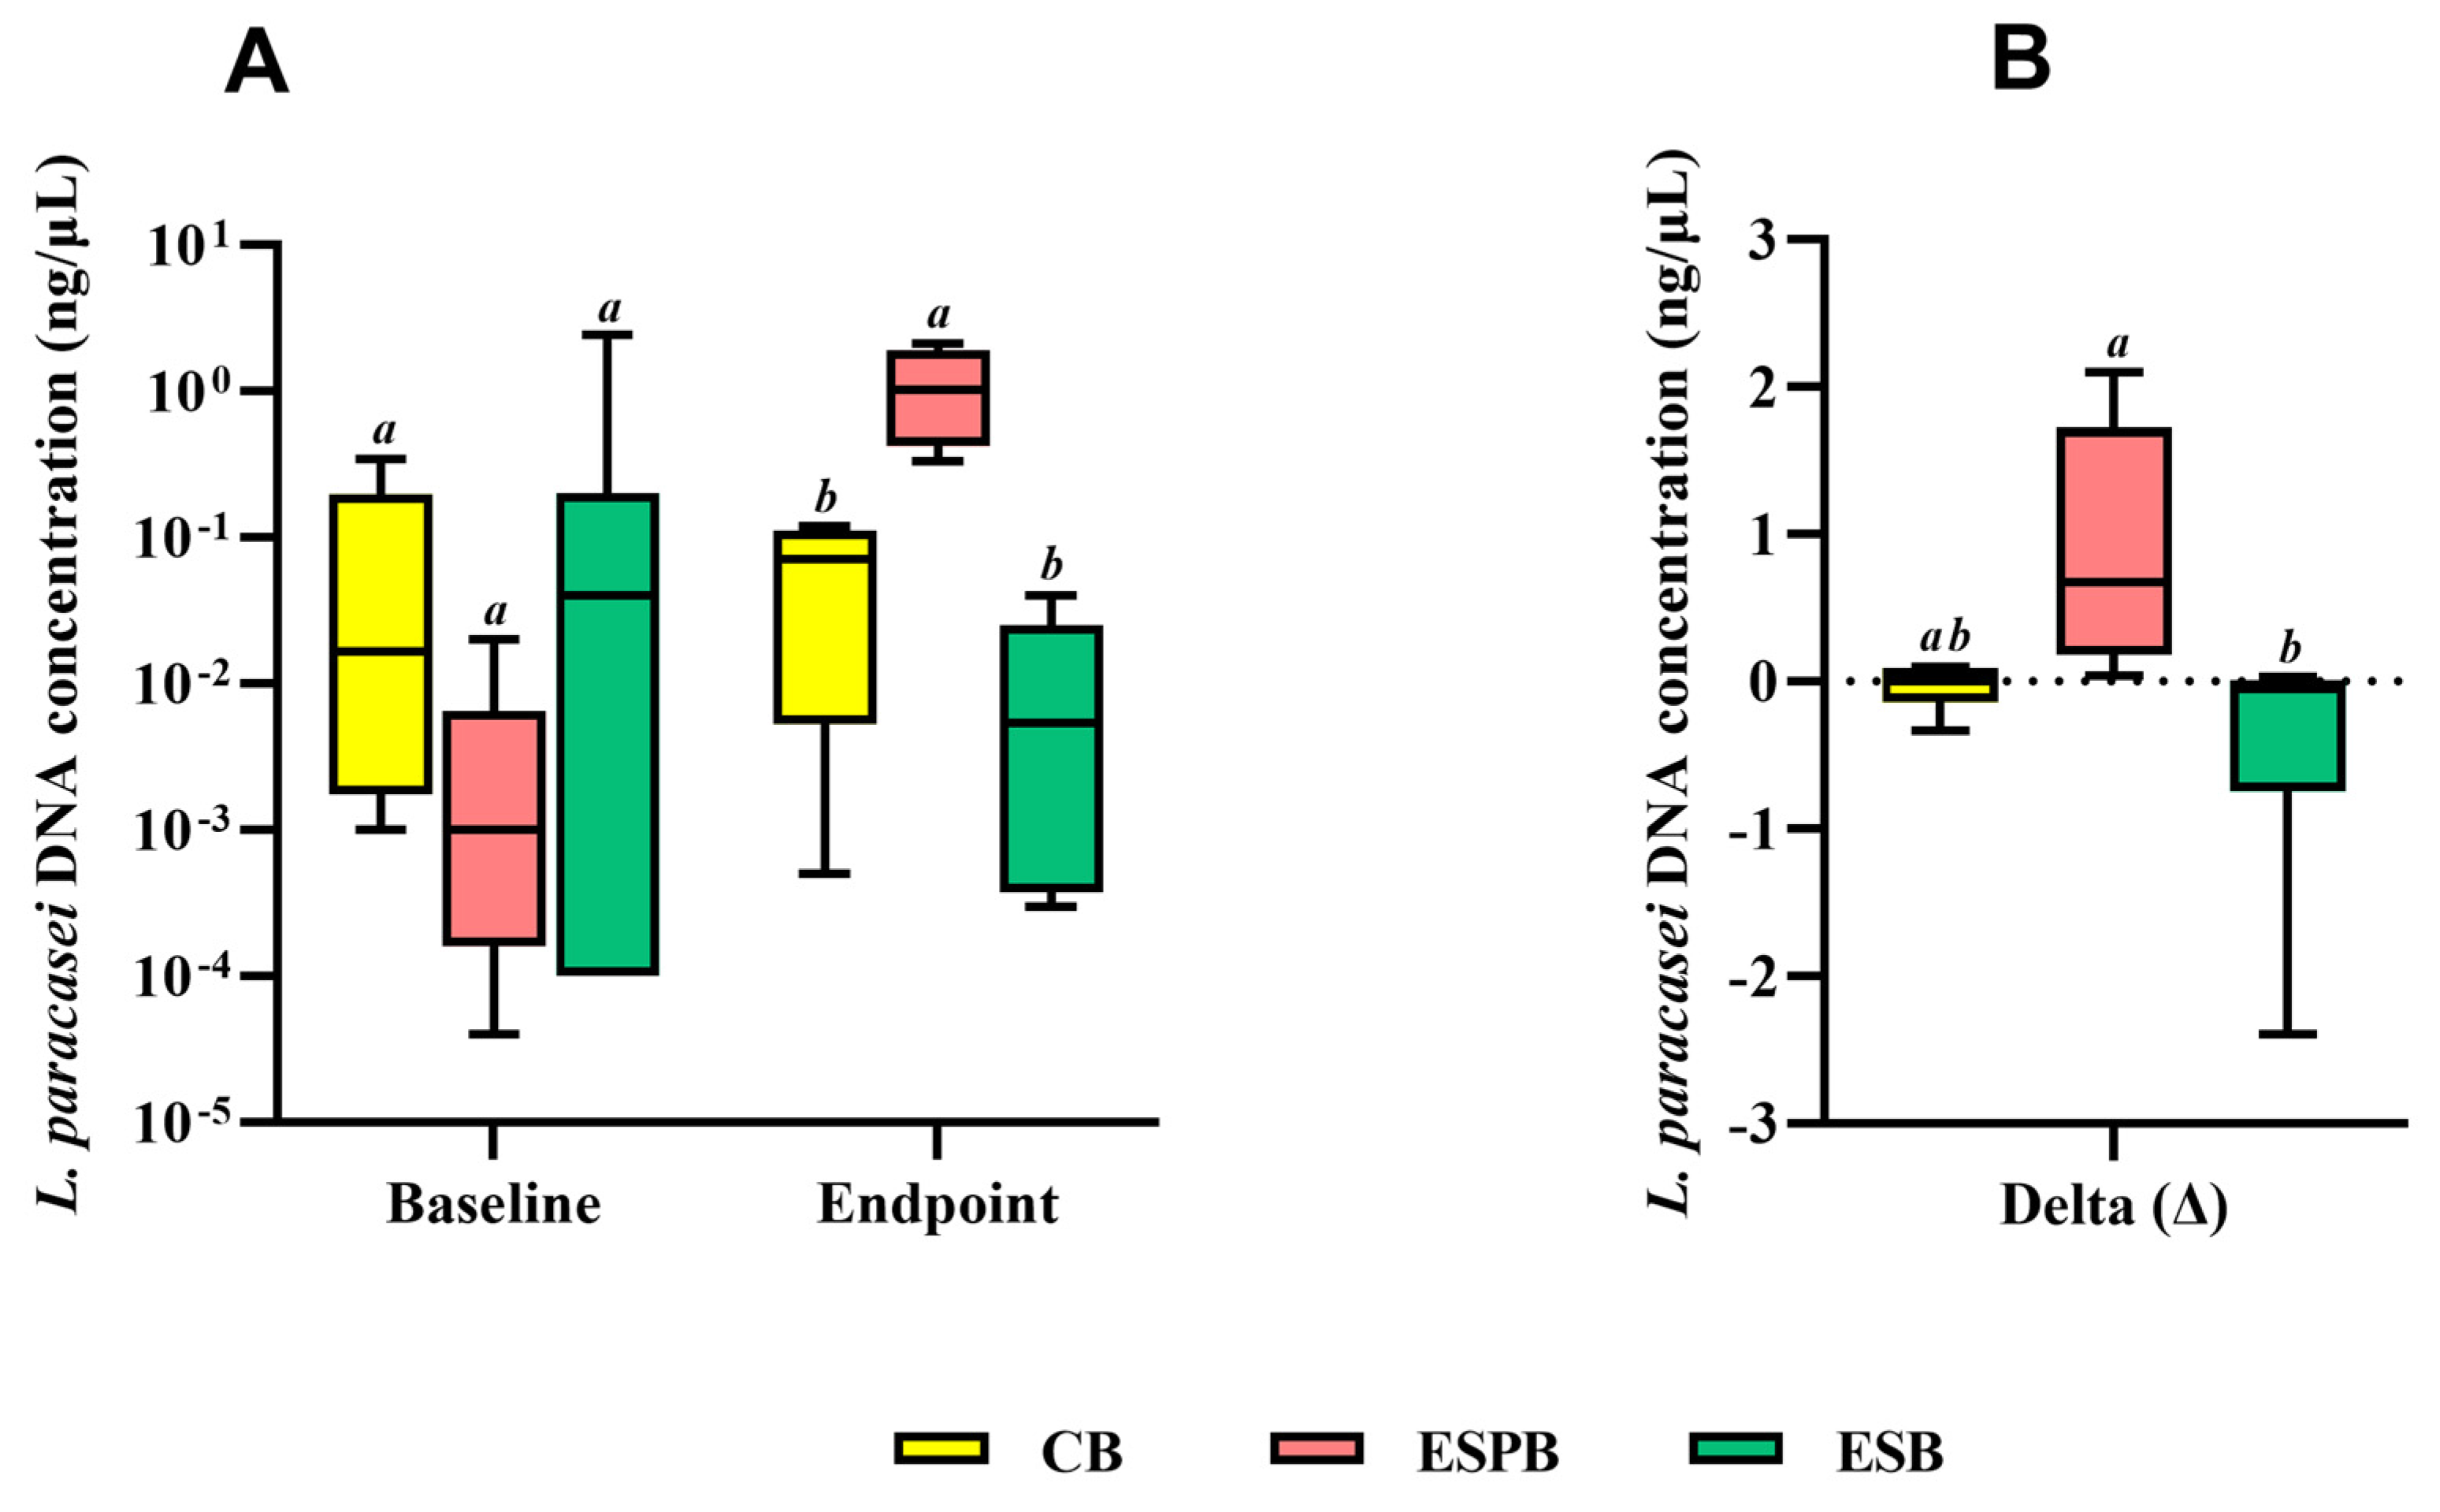
3.4. Effects of EBS in Combination with Lacticaseibacillus paracasei TRA061676 on Intestinal Health
4. Discussion
5. Conclusions
Author Contributions
Funding
Institutional Review Board Statement
Informed Consent Statement
Data Availability Statement
Acknowledgments
Conflicts of Interest
References
- Ducksbury, C.; Neale, E.P.; Stefoska-Needham, A. The Effect of Sorghum Consumption on Markers of Chronic Disease: A Systematic Review. Crit. Rev. Food Sci. Nutr. 2023, 63, 159–177. [Google Scholar] [CrossRef]
- FAO FAOSTAT. Available online: https://www.fao.org/faostat/en/#data/FBS (accessed on 8 July 2024).
- Guedes Lúcio, H.; Grancieri, M.; David Medina Martinez, O.; Celi Lopes Toledo, R.; Beserra de Menezes, C.; Maria Brunoro Costa, N.; Aparecida Vieira Queiroz, V.; Pereira da Silva, B.; Stampini Duarte Martino, H. Dry Heat Whole Sorghum BRS 305 Flour Modulate Satiety and Improves Antioxidant Response in Brain of Wistar Rats Fed with High-Fat High-Fructose Diet. Food Res. Int. 2023, 173, 113252. [Google Scholar] [CrossRef] [PubMed]
- Mkandawire, N.L.; Kaufman, R.C.; Bean, S.R.; Weller, C.L.; Jackson, D.S.; Rose, D.J. Effects of sorghum (Sorghum bicolor (L.) Moench) tannins on α-amylase activity and in vitro digestibility of starch in raw and processed flours. J. Agric. Food Chem. 2013, 61, 4448–4454. [Google Scholar] [CrossRef] [PubMed]
- Medina Martinez, O.D.; Lopes Toledo, R.C.; Vieira Queiroz, V.A.; Pirozi, M.R.; Duarte Martino, H.S.; Ribeiro de Barros, F.A. Mixed Sorghum and Quinoa Flour Improves Protein Quality and Increases Antioxidant Capacity In Vivo. LWT 2020, 129, 109597. [Google Scholar] [CrossRef]
- USDA United States Department of Agriculture. FoodData Central. Washington, 2020/2021. Database for Standard Reference. Available online: https://usdasearch.usda.gov/search?utf8=%E2%9C%93&affiliate=usda&query=sorghum&commit=Search (accessed on 8 August 2024).
- Gutierrez-Barrutia, M.B.; Cozzano, S.; Arcia, P.; del Castillo, M.D. In Vitro Digestibility and Bioaccessibility of Nutrients and Non-Nutrients Composing Extruded Brewers’ Spent Grain. Nutrients 2022, 14, 3480. [Google Scholar] [CrossRef] [PubMed]
- Lúcio, H.; Anunciação, P.; da Silva, B.; da Silva, A.; Queiroz, V.; de Carvalho, C.; Pinheiro-Sant’Ana, H.; Martino, H. Consumption of Extruded Sorghum SC319 Improved Gut Microbiota at Genus Level and Reduced Anthropometric Markers in Men with Overweight: A Randomized Controlled Clinical Trial. Nutrients 2023, 15, 3786. [Google Scholar] [CrossRef] [PubMed]
- Girard, A.L.; Awika, J.M. Sorghum polyphenols and other bioactive components as functional and health promoting food ingredients. J. Cereal Sci. 2018, 84, 112–124. [Google Scholar] [CrossRef]
- Kleniewska, P.; Hoffmann, A.; Pniewska, E.; Pawliczak, R. The Influence of Probiotic Lactobacillus casei in Combination with Prebiotic Inulin on the Antioxidant Capacity of Human Plasma. Oxid. Med. Cell. Longev. 2016, 2016, 1340903. [Google Scholar] [CrossRef] [PubMed]
- dos Santos, K.M.O.; Vieira, A.D.S.; Buriti, F.C.A.; do Nascimento, J.C.F.; de Melo, M.E.S.; Bruno, L.M.; de Fátima Borges, M.; Rocha, C.R.C.; de Souza Lopes, A.C.; de Melo Franco, B.D.G.; et al. Artisanal Coalho Cheeses as Source of Beneficial lactobacillus plantarum and Lactobacillus rhamnosus Strains. Dairy Sci. Technol. 2015, 95, 209–230. [Google Scholar] [CrossRef]
- Sun, N.Y.; Chen, S.; Li, Y. Lactobacillus paracasei L9 Ameliorated Obesity-Associated Metabolic Parameters and Relevant Gut Microbiota in Mice Fed a High-Fat Diet. Nutr. Res. 2023, 115, 26–37. [Google Scholar] [CrossRef] [PubMed]
- Ji, Y.; Lang, X.; Wang, W.; Li, S.; Zhao, C.; Shen, X.; Zhang, T.; Ye, H. Lactobacillus paracasei Ameliorates Cognitive Impairment in High-Fat Induced Obese Mice via Insulin Signaling and Neuroinflammation Pathways. Food Funct. 2021, 12, 8728–8737. [Google Scholar] [CrossRef]
- Tarrah, A.; dos Santos Cruz, B.C.; Sousa Dias, R.; da Silva Duarte, V.; Pakroo, S.; Licursi de Oliveira, L.; Gouveia Peluzio, M.C.; Corich, V.; Giacomini, A.; Oliveira de Paula, S. Lactobacillus paracasei DTA81, a Cholesterol-Lowering Strain Having Immunomodulatory Activity, Reveals Gut Microbiota Regulation Capability in BALB/c Mice Receiving High-Fat Diet. J. Appl. Microbiol. 2021, 131, 1942–1957. [Google Scholar] [CrossRef]
- Mishima, M.D.V.; Martino, H.S.D.; Kolba, N.; Shah, D.D.; Grancieri, M.; Dos Santos, K.M.O.; Lima, J.P.; Da Silva, B.P.; Gonzalez de Mejia, E.; Tako, E. Effects of Intra-Amniotic Administration of the Hydrolyzed Protein of Chia (Salvia hispanica L.) and Lacticaseibacillus Paracasei on Intestinal Functionality, Morphology, and Bacterial Populations, In Vivo (Gallus gallus). Nutrients 2023, 15, 1831. [Google Scholar] [CrossRef] [PubMed]
- Ferrario, C.; Taverniti, V.; Milani, C.; Fiore, W.; Laureati, M.; De Noni, I.; Stuknyte, M.; Chouaia, B.; Riso, P.; Guglielmetti, S. Modulation of Fecal Clostridiales Bacteria and Butyrate by Probiotic Intervention with Lactobacillus paracasei DG Varies among Healthy Adults. J. Nutr. 2014, 144, 1787–1796. [Google Scholar] [CrossRef] [PubMed]
- Chaiyasut, C.; Sivamaruthi, B.S.; Lailerd, N.; Sirilun, S.; Khongtan, S.; Fukngoen, P.; Peerajan, S.; Saelee, M.; Chaiyasut, K.; Kesika, P.; et al. Probiotics Supplementation Improves Intestinal Permeability, Obesity Index and Metabolic Biomarkers in Elderly Thai Subjects: A Randomized Controlled Trial. Food 2022, 11, 268. [Google Scholar] [CrossRef]
- Ajiboye, T.O.; Iliasu, G.A.; Adeleye, A.O.; Ojewuyi, O.B.; Kolawole, F.L.; Bello, S.A.; Mohammed, A.O. A fermented sorghum/millet-based beverage, Obiolor, extenuates high-fat diet-induced dyslipidemia and redox imbalance in the livers of rats. J. Sci. Food Agric. 2024, 96, 791–797. [Google Scholar] [CrossRef] [PubMed]
- Anunciação, P.C.; Cardoso, L.D.M.; Queiroz, V.A.V.; de Menezes, C.B.; de Carvalho, C.W.P.; Pinheiro-Sant’Ana, H.M.; Alfenas, R.D.C.G. Consumption of a drink containing extruded sorghum reduces glycaemic response of the subsequent meal. Eur. J. Nutr. 2018, 57, 251–257. [Google Scholar] [CrossRef] [PubMed]
- Acevedo-Román, A.; Pagán-Zayas, N.; Velázquez-Rivera, L.I.; Torres-Ventura, A.C.; Godoy-Vitorino, F. Insights into Gut Dysbiosis: Inflammatory Diseases, Obesity, and Restoration Approaches. Int. J. Mol. Sci. 2024, 25, 9715. [Google Scholar] [CrossRef] [PubMed]
- Silveira, E.A.; Santos, A.S.e.A.d.C.; Ribeiro, J.N.; Noll, M.; dos Santos Rodrigues, A.P.; de Oliveira, C. Prevalence of Constipation in Adults with Obesity Class II and III and Associated Factors. BMC Gastroenterol. 2021, 21, 217. [Google Scholar] [CrossRef] [PubMed]
- Margalho, L.P.; Kamimura, B.A.; Brexó, R.P.; Alvarenga, V.O.; Cebeci, A.S.; Janssen, P.W.; Dijkstra, A.; Starrenburg, M.J.C.; Sheombarsing, R.S.; Cruz, A.G.; et al. High throughput screening of technological and biopreservation traits of a large set of wild lactic acid bacteria from Brazilian artisanal cheeses. Food Microbiol. 2021, 100, 103872. [Google Scholar] [CrossRef] [PubMed]
- A.O.A.C. Official Methods of Analysis. Association of Official Analytical Chemists. Available online: https://scholar.google.com.br/scholar?hl=pt-BR&as_sdt=0%2C6&q=AOAC.+Official+Methods+of+Analysis+of+the+AOAC+International.+Association+of++Official+Analytical+Chemists+2019%3B1.&btnG= (accessed on 8 July 2024).
- Merrill, A.L.; Watt, B.K. Energy Value of Foods: Basis and Derivation. Available online: https://scholar.google.com.br/scholar?hl=pt-BR&as_sdt=0%2C6&q=Merrill+AL%2C+Watt+BK.+Energy+Value+of+Foods%3A+Basis+and+Derivation+1955&btnG= (accessed on 8 July 2024).
- Maxson, E.D.; Rooney, L.W. Two Methods of Tannin Analysis for Sorghum bicolor (L.) Moench grain. Crop Sci. 1972, 12, 253–254. [Google Scholar] [CrossRef]
- Price, M.L.; Van Scoyoc, S.; Butler, L.G. A Critical Evaluation of the Vanillin Reaction as an Assay for Tannin in Sorghum Grain. J. Agric. Food Chem. 1978, 26, 1214–1218. [Google Scholar] [CrossRef]
- Brand-Williams, W.; Cuvelier, M.E.; Berset, C. Use of a Free Radical Method to Evaluate Antioxidant Activity. LWT-Food Sci. Technol. 1995, 28, 25–30. [Google Scholar] [CrossRef]
- Julious, S.A. Sample Size of 12 per Group Rule of Thumb for a Pilot Study. Pharm. Stat. 2005, 4, 287–291. [Google Scholar] [CrossRef]
- American College of Sports Medicine. Position Statement on the Recommended Quantity and Quality of Exercise for Developing and Maintaining Fitness in Healthy Adults. Med. Sci. Sports Exerc. 1978, 10, 7–10. [Google Scholar]
- Stunkard, A.J.; Messick, S. The Three-Factor Eating Questionnaire to Measure Dietary Restraint, Disinhibition and Hunger. J. Psychosom. Res. 1985, 29, 71–83. [Google Scholar] [CrossRef]
- Revicki, D.A.; Wood, M.; Wiklund, I.; Crawley, J. Reliability and Validity of the Gastrointestinal Symptom Rating Scale in Patients with Gastroesophageal Reflux Disease. Qual. Life Res. 1997, 7, 75–83. [Google Scholar] [CrossRef]
- Lewis, S.J.; Heaton, K.W. Stool Form Scale as a Useful Guide to Intestinal Transit Time. Scand. J. Gastroenterol. 1997, 32, 920–924. [Google Scholar] [CrossRef]
- Trefflich, I.; Dietrich, S.; Braune, A.; Abraham, K.; Weikert, C. Short- and branched-chain fatty acids as fecal markers for microbiota activity in vegans and omnivores. Nutrients. 2021, 13, 1808. [Google Scholar] [CrossRef] [PubMed]
- Byun, R.; Nadkarni, M.A.; Chhour, K.L.; Martin, F.E.; Jacques, N.A.; Hunter, N. Quantitative Analysis of Diverse Lactobacillus Species Present in Advanced Dental Caries. J. Clin. Microbiol. 2004, 42, 3128–3136. [Google Scholar] [CrossRef] [PubMed]
- Syed, O.N.; Kabir, C.; Patel, A.; Shuai, R.; Tharian, I.; Knezevic, N.N.; Syed, O.; Kabir, C.; Patel, A.; Shuai, I.R.; et al. The Impact of Acute Postoperative Pain in Developing Chronic Pain after Total Knee Arthroplasty. Neurol. Int. 2024, 16, 459–469. [Google Scholar] [CrossRef] [PubMed]
- Khalid, W.; Ali, A.; Arshad, M.S.; Afzal, F.; Akram, R.; Siddeeg, A.; Kousar, S.; Rahim, M.A.; Aziz, A.; Maqbool, Z.; et al. Nutrients and bioactive compounds of Sorghum bicolor L. used to prepare functional foods: A review on the efficacy against different chronic disorders. Int. J. Food Prop. 2022, 25, 1045–1062. [Google Scholar] [CrossRef]
- Barbalho, S.M.; Tofano, R.J.; de Oliveira, M.B.; Quesada, K.R.; Barion, M.R.; Akuri, M.C.; Oshiiwa, M.; Bechara, M.D. HDL-C and Non-HDL-C Levels Are Associated with Anthropometric and Biochemical Parameters. J. Vasc. Bras. 2019, 18, e20180109. [Google Scholar] [CrossRef] [PubMed]
- Cardoso, B.E.P.; da Cunha Soares, T.; da Silva Dias, T.M.; Fontenelle, L.C.; Morais, J.B.S.; Cruz, K.J.C.; de Paiva Sousa, M.; de Sousa, T.G.V.; de Sousa Melo, S.R.; dos Santos, L.R.; et al. Selenium Biomarkers and Their Relationship to Cardiovascular Risk Parameters in Obese Women. Biol. Trace Elem. Res. 2024, 202, 866–877. [Google Scholar] [CrossRef] [PubMed]
- Nawrocka-Rutkowska, J.; Szydłowska, I.; Jakubowska, K.; Olszewska, M.; Chlubek, D.; Szczuko, M.; Starczewski, A. The Role of Oxidative Stress in the Risk of Cardiovascular Disease and Identification of Risk Factors Using AIP and Castelli Atherogenicity Indicators in Patients with PCOS. Biomedicines 2022, 10, 1700. [Google Scholar] [CrossRef] [PubMed]
- Ge, Y.F.; Wei, C.H.; Wang, W.H.; Cao, L.K. The resistant starch from sorghum regulates lipid metabolism in menopausal rats via equol. J. Food Biochem. 2020, 44, e13295. [Google Scholar] [CrossRef] [PubMed]
- Aluko, O.O.; Ajayi, O.B. Investigation of antilipidemic efficacy of condensed tannins from three varieties of Sorghum bicolor seeds on high-fat diet-induced obese rats. Comp. Clin. Pathol. 2023, 32, 847–858. [Google Scholar] [CrossRef]
- Liu, H.; Huang, L.; Pei, X. Effects of Sorghum Rice and Black Rice on Genes Associated with Cholesterol Metabolism in Hypercholesterolemic Mice Liver and Intestine. Food Sci. Nutr. 2021, 9, 217–229. [Google Scholar] [CrossRef] [PubMed]
- Baselga-Escudero, L.; Arola-Arnal, A.; Pascual-Serrano, A.; Ribas-Latre, A.; Casanova, E.; Salvadó, M.J.; Arola, L.; Blade, C. Chronic Administration of Proanthocyanidins or Docosahexaenoic Acid Reversess the Increase of MiR-33a and MiR-122 in Dyslipidemic Obese Rats. PLoS ONE 2013, 8, e69817. [Google Scholar] [CrossRef] [PubMed]
- Rao, S.; Santhakumar, A.B.; Chinkwo, K.A.; Wu, G.; Johnson, S.K.; Blanchard, C.L. Characterization of phenolic compounds and antioxidant activity in sorghum grains. J. Cereal Sci. 2018, 84, 103–111. [Google Scholar] [CrossRef]
- Shang, W.; Si, X.; Zhou, Z.; Li, Y.; Strappe, P.; Blanchard, C. Characterization of Fecal Fat Composition and Gut Derived Fecal Microbiota in High-Fat Diet Fed Rats Following Intervention with Chito-Oligosaccharide and Resistant Starch Complexes. Food Funct. 2017, 8, 4374–4383. [Google Scholar] [CrossRef]
- Wu, T.Y.; Tsai, S.J.; Sun, N.N.; Dai, F.J.; Yu, P.H.; Chen, Y.C.; Chau, C.F. Enhanced Thermal Stability of Green Banana Starch by Heat-Moisture Treatment and Its Ability to Reduce Body Fat Accumulation and Modulate Gut Microbiota. Int. J. Biol. Macromol. 2020, 160, 915–924. [Google Scholar] [CrossRef] [PubMed]
- Mello, T.; Materozzi, M.; Galli, A. PPARs and mitochondrial metabolism: From NAFLD to HCC. PPAR Res. 2016, 2016, 7403230. [Google Scholar] [CrossRef]
- Yuille, S.; Reichardt, N.; Panda, S.; Dunbar, H.; Mulder, I.E. Human Gut Bacteria as Potent Class I Histone Deacetylase Inhibitors In Vitro through Production of Butyric Acid and Valeric Acid. PLoS ONE 2018, 13, e0201073. [Google Scholar] [CrossRef]
- Cheuk-Hay Lau, H.; Zhang, X.; Ji, F.; Lin, Y.; Liang, W.; Li, Q.; Chen, D.; Fong, W.; Kang, X.; Liu, W.; et al. Lactobacillus acidophilus Suppresses Non-Alcoholic Fatty Liver Disease-Associated Hepatocellular Carcinoma through Producing Valeric Acid. eBioMedicine 2024, 100, 104952. [Google Scholar] [CrossRef]
- Valerio, F.; Russo, F.; De Candia, S.; Riezzo, G.; Orlando, A.; Lonigro, S.L.; Lavermicocca, P. Effects of Probiotic Lactobacillus Paracasei-Enriched Artichokes on Constipated Patients: A Pilot Study. J. Clin. Gastroenterol. 2010, 44, S49–S53. [Google Scholar] [CrossRef] [PubMed]
- Rapoo, S.M.; Budeli, P.; Thaoge, M.L. Recovery of Potential Starter Cultures and Probiotics from Fermented Sorghum (Ting) Slurries. Microorganisms 2023, 11, 715. [Google Scholar] [CrossRef] [PubMed]
- Attchelouwa, C.K.; Kouakou-Kouamé, C.A.; Ouattara, L.; Amoikon, T.L.S.; N’guessan, F.K.; Marcotte, S.; Charmel, M.; Djè, M.K. Detection of Spoilage-Causing Yeasts and Bacteria in Tchapalo, the Ivorian Traditional Sorghum Beer. Lett. Appl. Microbiol. 2022, 75, 135–144. [Google Scholar] [CrossRef]
- Kumar, D.; Lal, M.K.; Dutt, S.; Raigond, P.; Changan, S.S.; Tiwari, R.K.; Chourasia, K.N.; Mangal, V.; Singh, B. Functional Fermented Probiotics, Prebiotics, and Synbiotics from Non-Dairy Products: A Perspective from Nutraceutical. Mol. Nutr. Food Res. 2022, 66, 2101059. [Google Scholar] [CrossRef] [PubMed]
- Wang, L.; Yang, S.; Mei, C.; Tang, N.; Wang, J.; Yu, Q.; Wang, G.; Wu, G.; Zhao, J.; Chen, W. Lactobacillus paracasei relieves constipation by acting on the acetic acid-5-ht-intestinal motility pathway. Foods 2023, 12, 4176. [Google Scholar] [CrossRef]
- Chiang, S.S.; Pan, T.M. Beneficial Effects of Lactobacillus Paracasei subsp. paracasei NTU 101 and Its Fermented Products. Appl. Microbiol. Biotechnol. 2012, 93, 903–916. [Google Scholar] [CrossRef]

| Variables (g·100 mL−1) | ESB | CB | p-Value |
|---|---|---|---|
| Moisture | 71.07 ± 0.01 | 70.76 ± 0.19 | 0.048 |
| Proteins | 3.59 ± 0.23 | 2.49 ± 0.14 | 0.002 |
| Lipids | 0.32 ± 0.09 | 0.23 ± 0.02 | 0.102 |
| Ash | 0.53 ± 0.00 | 0.69 ± 0.00 | <0.001 |
| Total dietary fiber | 0.80 ± 0.25 | 0.00 ± 0.00 | 0.010 |
| Soluble dietary fiber | 0.04 ± 0.01 | 0.00 ± 0.00 | 0.663 |
| Insoluble dietary fiber | 0.77 ± 0.15 | 0.00 ± 0.00 | 0.025 |
| Carbohydrate | 23.71 ± 0.28 | 25.84 ± 0.05 | <0.001 |
| Energy value (kcal·100 g−1) | 112.08 ± 0.32 | 115.39 ± 0.13 | <0.001 |
| Resistant starch | 1.05 ± 0.06 | 0.24 ± 0.02 | <0.001 |
| Total phenolic compounds (mg GAE·g−1) | 36.37 ± 0.68 | 4.13 ± 0.08 | <0.001 |
| Condensed tannins (mg CE·g−1) | 0.53 ± 0.03 | 0.00 ± 0.00 | <0.001 |
| DPPH (µmol trolox·g−1) | 66.64 ± 0.88 | 0.00 ± 0.00 | <0.001 |
| Body Composition | Group | |||
|---|---|---|---|---|
| ESPB | ESB | CB | p-Value | |
| Baseline | ||||
| Weight (kg) | 75.98 ± 8.98 | 78.11 ± 13.72 | 75.4 ± 2.42 | 0.838 |
| BMI (kg/m2) | 29.77 ± 2.83 | 29.09 ± 2.37 | 29.92 ± 2.54 | 0.781 |
| Body fat (%) | 42.39 ± 7.75 | 43.8 ± 6.08 | 45.29 ± 6.67 | 0.662 |
| Lean mass (kg) | 38.18 ± 2.71 | 39.21 ± 3.24 | 39.03 ± 6.23 | 0.897 |
| Estimated TVF (kg) | 0.92 ± 0.32 | 0.95 ± 0.39 | 0.58 ± 0.51 | 0.270 |
| Waist volume (m3) | 0.67 ± 0.36 | 1.01 ± 0.41 | 0.61 ± 0.54 | 0.265 |
| Endpoint | ||||
| Weight (kg) | 75.82 ± 10.26 | 77.51 ± 13.97 | 75.84 ± 2.15 | 0.927 |
| BMI (kg/m2) | 29.68 ± 3.20 | 28.87 ± 2.59 | 29.88 ± 2.50 | 0.727 |
| Body fat (%) | 40.82 ± 7.30 | 42.81 ± 5.53 | 44.83 ± 6.11 | 0.406 |
| Lean mass (kg) | 39.48 ± 3.35 | 40.05 ± 2.59 | 39.55 ± 5.29 | 0.963 |
| Estimated TVF (kg) | 0.76 ± 0.30 | 0.67 ± 0.23 | 0.66 ± 0.44 | 0.855 |
| Waist volume (m3) | 0.63 ± 0.31 | 0.71 ± 0.24 | 0.70 ± 0.47 | 0.889 |
| Delta (Δ) | ||||
| Weight (kg) | −0.16 ± 2.5 | −0.60 ± 1.45 | 0.40 ± 1.7 | 0.615 |
| BMI (kg/m2) | −0.07 ± 1.00 | −0.22 ± 0.54 | −0.04 ± 0.79 | 0.885 |
| Body fat (%) | −1.57 ± 2.97 | −1.06 ± 2.53 | −0.46 ± 2.15 | 0.646 |
| Lean mass (kg) | 1.29 ± 2.84 | 0.84 ± 1.28 | 0.52 ± 1.92 | 0.766 |
| Estimated TVF (kg) | −0.15 ± 0.10 a | −0.27 ± 0.23 a | 0.08 ± 0.11 b | 0.006 |
| Waist volume (m3) | −0.04 ± 0.22 b | −0.29 ± 0.25 a | 0.09 ± 0.12 b | 0.019 |
| Biochemical Variables | Group | |||
|---|---|---|---|---|
| ESPB | ESB | CB | p-Value | |
| Baseline | ||||
| Glucose (mg/dL) | 107.1 ± 16.54 | 99.00 ± 9.45 | 102.40 ± 16.54 | 0.575 |
| Insulin (µUI/mL) | 6.45 ± 2.69 | 8.14 ± 2.73 | 9.66 ± 2.46 | 0.072 |
| CRP (mg/L) | 0.21 ± 0.07 | 0.09 ± 0.05 | 0.25 ± 0.19 | 0.111 |
| Total cholesterol (mg/dL) | 155.50 ± 26.38 | 134.70 ± 13.34 | 160.00 ± 21.98 | 0.135 |
| HDL-c (mg/dL) | 42.29 ± 7.60 | 44.89 ± 5.25 | 49.10 ± 10.53 | 0.296 |
| LDL-c (mg/dL) | 67.61 ± 15.68 | 62.20 ± 15.32 | 73.09 ± 13.21 | 0.404 |
| Triglycerides (mg/dL) | 94.32 ± 9.65 | 90.13 ± 9.04 | 94.54 ± 5.07 | 0.432 |
| Castelli index I | 3.26 ± 0.83 | 3.36 ± 0.51 | 3.81 ± 0.54 | 0.241 |
| Castelli index II | 1.42 ± 0.56 | 1.30 ± 0.56 | 1.64 ± 0.46 | 0.465 |
| Endpoint | ||||
| Glucose (mg/dL) | 96.00 ± 14.88 | 98.00 ± 3.26 | 92.78 ± 6.01 | 0.548 |
| Insulin (µUI/mL) | 6.77 ± 1.98 | 7.22 ± 2.39 | 7.56 ± 2.34 | 0.784 |
| CRP (mg/L) | 0.21 ± 0.11 | 0.09 ± 0.06 | 0.21 ± 0.11 | 0.089 |
| Total cholesterol (mg/dL) | 140.60 ± 12.51 | 128.40 ± 27.22 | 150.70 ± 30.03 | 0.334 |
| HDL-c (mg/dL) | 44.95 ± 6.13 | 44.64 ± 12.95 | 44.53 ± 15.02 | 0.997 |
| LDL-c (mg/dL) | 68.09 ± 18.57 | 56.34 ± 11.20 | 68.96 ± 10.58 | 0.217 |
| Triglycerides (mg/dL) | 91.94 ± 12.26 | 87.05 ± 7.93 | 91.15 ± 11.33 | 0.580 |
| Castelli index I | 3.06 ± 0.34 b | 2.54 ± 0.77 b | 4.02 ± 1.01 a | 0.009 |
| Castelli index II | 1.45 ± 0.54 | 1.12 ± 0.43 | 1.77 ± 0.64 | 0.114 |
| Delta (Δ) | ||||
| Glucose (mg/dL) | −11.13 ± 14.18 | −1.00 ± 9.41 | −9.66 ± 15.82 | 0.326 |
| Insulin (µUI/mL) | 0.32 ± 1.79 | −0.92 ± 2.58 | −2.10 ± 2.68 | 0.149 |
| CRP (mg/L) | 0.005 ± 0.08 | 0.002 ± 0.04 | −0.034 ± 0.12 | 0.686 |
| Total cholesterol (mg/dL) | −14.89 ± 27.71 | −6.25 ± 31.83 | −9.26 ± 38.50 | 0.898 |
| HDL-c (mg/dL) | 2.66 ± 7.05 | −0.25 ± 10.92 | −4.57 ± 12.26 | 0.402 |
| LDL-c (mg/dL) | 0.48 ± 7.38 | −5.86 ± 13.19 | −4.12 ± 16.84 | 0.671 |
| Triglycerides (mg/dL) | −2.38 ± 9.23 | −3.08 ± 5.51 | −3.39 ± 9.39 | 0.962 |
| Castelli index I | −0.20 ± 1.09 | −0.82 ± 1.62 | 0.20 ± 0.99 | 0.218 |
| Castelli index II | 0.03 ± 0.59 | −0.17 ± 0.59 | 0.13 ± 0.67 | 0.651 |
| Variables | Group | |||
|---|---|---|---|---|
| ESPB | ESB | CB | p-Value | |
| Baseline (mmol/kg) | ||||
| Acetic acid | 19.53 ± 9.81 | 19.62 ± 5.80 | 25.43 ± 7.22 | 0.171 |
| Propionic acid | 13.13 ± 8.08 | 10.85 ± 4.62 | 14.92 ± 6.15 | 0.373 |
| Isobutyric acid | 2.06 ± 1.18 | 2.72 ± 1.03 | 2.58 ± 1.50 | 0.494 |
| Butyric acid | 16.56 ± 13.06 | 15.74 ± 9.47 | 14.48 ± 5.40 | 0.894 |
| Isovaleric acid | 3.46 ± 2.30 | 4.64 ± 1.96 | 3.97 ± 2.56 | 0.537 |
| Valeric acid | 2.95 ± 1.37 | 3.38 ± 1.97 | 3.40 ± 1.57 | 0.860 |
| Hexanoic acid | 1.49 ± 0.80 | 0.89 ± 0.63 | 2.15 ± 1.30 | 0.222 |
| Total branched-chain SCFAs | 5.52 ± 3.46 | 7.36 ± 0.98 | 6.55 ± 4.06 | 0.532 |
| Total SCFAs | 59.18 ± 28.53 | 57.84 ± 23.31 | 66.93 ± 18.42 | 0.636 |
| Fecal pH | 7.56 ± 0.56 | 7.27 ± 0.73 | 7.29 ± 0.59 | 0.538 |
| Endpoint (mmol/kg) | ||||
| Acetic acid | 23.66 ± 12.26 | 18.90 ± 7.44 | 24.47 ± 12.13 | 0.472 |
| Propionic acid | 16.43 ± 13.12 | 10.39 ± 5.61 | 13.18 ± 5.61 | 0.330 |
| Isobutyric acid | 2.14 ± 1.13 | 1.79 ± 1.01 | 2.47 ± 1.42 | 0.455 |
| Butyric acid | 18.27 ± 10.15 | 13.84 ± 11.48 | 15.68 ± 13.65 | 0.722 |
| Isovaleric acid | 3.77 ± 2.16 | 3.01 ± 1.77 | 4.12 ± 2.57 | 0.517 |
| Valeric acid | 3.67 ± 1.85 | 2.15 ± 1.31 | 2.95 ± 1.68 | 0.192 |
| Hexanoic acid | 1.66 ± 1.37 | 0.78 ± 0.56 | 1.73 ± 1.18 | 0.396 |
| Total branched-chain SCFAs | 5.91 ± 3.26 | 4.80 ± 2.76 | 6.59 ± 3.98 | 0.492 |
| Total SCFAs | 69.60 ± 34.10 | 50.86 ± 25.35 | 64.60 ± 32.19 | 0.448 |
| Fecal pH | 7.52 ± 0.7 | 7.17 ± 0.58 | 7.31 ± 0.59 | 0.504 |
| Delta (Δ) (mmol/kg) | ||||
| Acetic acid | 4.13 ± 7.96 | −0.72 ± 9.20 | −0.96 ± 13.71 | 0.518 |
| Propionic acid | 3.30 ± 7.38 | −0.46 ± 6.07 | −1.74 ± 7.47 | 0.287 |
| Isobutyric acid | 0.08 ± 1.41 | −0.93 ± 1.19 | −0.11 ± 1.31 | 0.209 |
| Butyric acid | 1.71 ± 6.61 | −1.90 ± 12.13 | 1.20 ± 14.51 | 0.765 |
| Isovaleric acid | 0.31 ± 1.99 | −1.63 ± 2.19 | 0.15 ± 2.38 | 0.114 |
| Valeric acid | 0.72 ± 1.56 a | −1.23 ± 1.42 b | −0.45 ± 1.62 b | 0.042 |
| Hexanoic acid | 0.17 ± 1.55 | −0.11 ± 0.83 | −0.42 ± 1.63 | 0.865 |
| Total branched-chain SCFAs | 0.39 ± 3.39 | −2.56 ± 3.37 | 0.04 ± 3.68 | 0.142 |
| Total SCFAs | 10.42 ± 20.04 | −6.98 ± 29.22 | −2.33 ± 40.26 | 0.448 |
| pH fecal | −0.04 ± 0.54 | −0.10 ± 0.54 | 0.02 ± 0.56 | 0.867 |
Disclaimer/Publisher’s Note: The statements, opinions and data contained in all publications are solely those of the individual author(s) and contributor(s) and not of MDPI and/or the editor(s). MDPI and/or the editor(s) disclaim responsibility for any injury to people or property resulting from any ideas, methods, instructions or products referred to in the content. |
© 2024 by the authors. Licensee MDPI, Basel, Switzerland. This article is an open access article distributed under the terms and conditions of the Creative Commons Attribution (CC BY) license (https://creativecommons.org/licenses/by/4.0/).
Share and Cite
da Silva, L.A.; de São José, V.P.B.; Rodrigues, L.A.; do Prado, P.V.C.; Toledo, R.C.L.; de Barros, F.A.R.; de Souza, A.M.; Antoniassi, R.; de Carvalho, C.W.P.; Queiroz, V.A.V.; et al. Effects of a Sorghum Beverage with Lacticaseibacillus paracasei on Body Composition, Lipid Profiles, and Intestinal Health in Overweight and Obese Adults: A Randomized Single-Blind Pilot Study. Foods 2024, 13, 3128. https://doi.org/10.3390/foods13193128
da Silva LA, de São José VPB, Rodrigues LA, do Prado PVC, Toledo RCL, de Barros FAR, de Souza AM, Antoniassi R, de Carvalho CWP, Queiroz VAV, et al. Effects of a Sorghum Beverage with Lacticaseibacillus paracasei on Body Composition, Lipid Profiles, and Intestinal Health in Overweight and Obese Adults: A Randomized Single-Blind Pilot Study. Foods. 2024; 13(19):3128. https://doi.org/10.3390/foods13193128
Chicago/Turabian Styleda Silva, Lucimar Aguiar, Vinícius Parzanini Brilhante de São José, Larissa Arruda Rodrigues, Pietra Vidal Cardoso do Prado, Renata Celi Lopes Toledo, Frederico Augusto Ribeiro de Barros, Andressa Moreira de Souza, Rosemar Antoniassi, Carlos Wanderlei Piler de Carvalho, Valéria Aparecida Vieira Queiroz, and et al. 2024. "Effects of a Sorghum Beverage with Lacticaseibacillus paracasei on Body Composition, Lipid Profiles, and Intestinal Health in Overweight and Obese Adults: A Randomized Single-Blind Pilot Study" Foods 13, no. 19: 3128. https://doi.org/10.3390/foods13193128