
Physicochemical, Quality and Flavor Characteristics of Starch Noodles with Auricularia cornea var. Li. Powder

Abstract
:1. Introduction
2. Materials and Methods
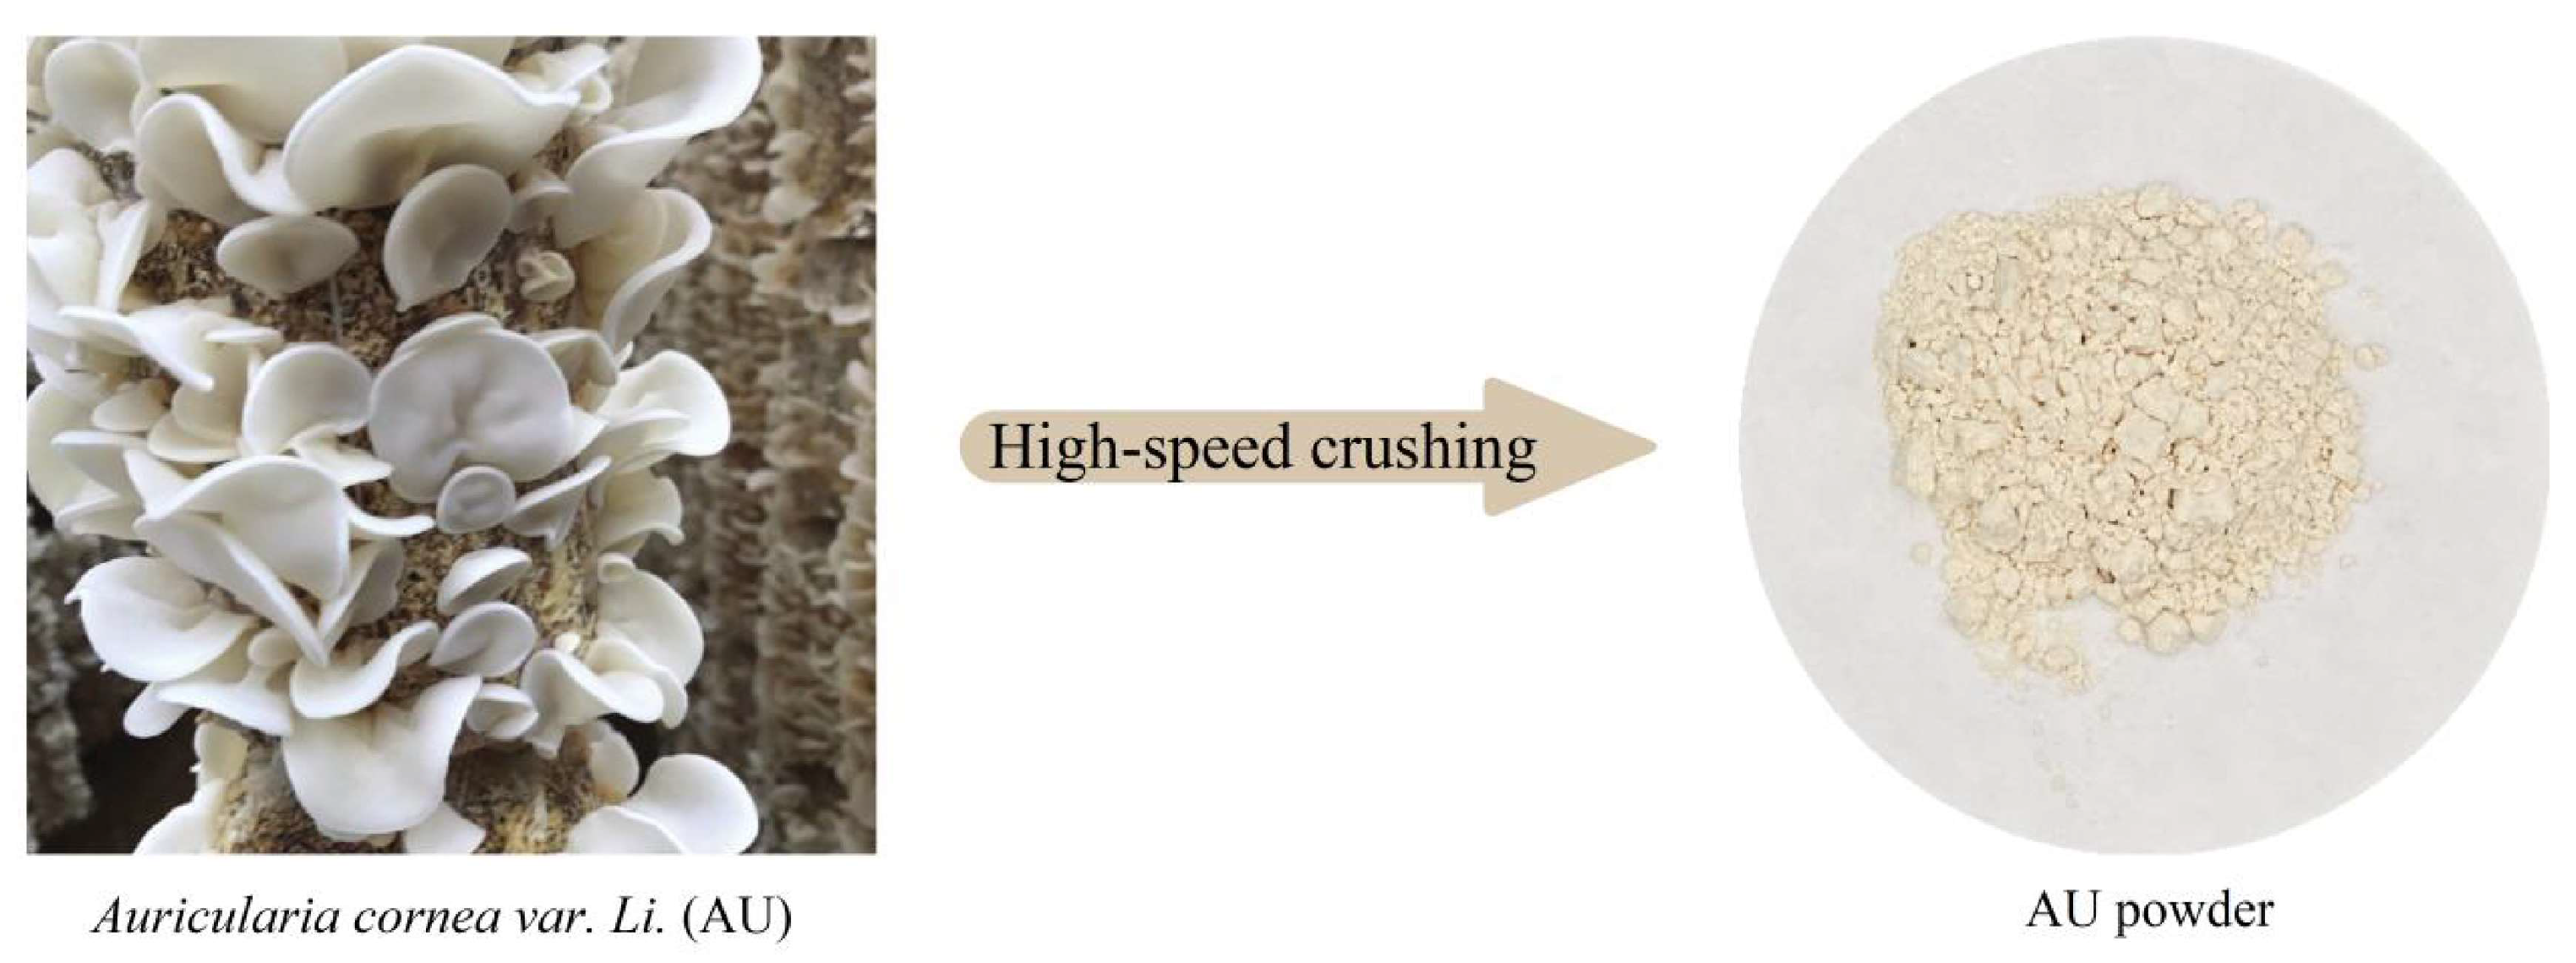
2.1. Raw Material
2.2. Preparation of Starch Slurry and Starch Noodles
2.2.1. Preparation of Starch Slurry
2.2.2. Preparation of Starch Paste
2.2.3. Preparation of Starch Noodles
2.3. Determination of Nutritional Components
2.4. Gel Properties
2.4.1. Pasting Properties
2.4.2. Rheological Properties
Dynamic Frequency Sweep
Static Rheological
2.4.3. Gel Textural Properties
2.4.4. Freeze–Thaw Cycle (FTC) and Syneresis Measurement
2.5. Structural Properties of Starch Noodles
2.5.1. Low-Field NMR (LF-NMR) Measurement
2.5.2. Scanning Electron Microscopy (SEM)
2.5.3. Fourier Transform Infrared Spectroscopy (FTIR)
2.5.4. In Vitro Digestibility
2.6. Quality Characteristics and Volatile Compounds (VOCs) of Starch Noodles
2.6.1. Cooking Properties
2.6.2. Color Measurement
2.6.3. Determination and Scoring of Hydrolyzed Amino Acids
2.6.4. Determination of VOCs by GC-IMS
2.7. Statistical Analysis
3. Results and Discussion
3.1. Nutritional Composition Analysis
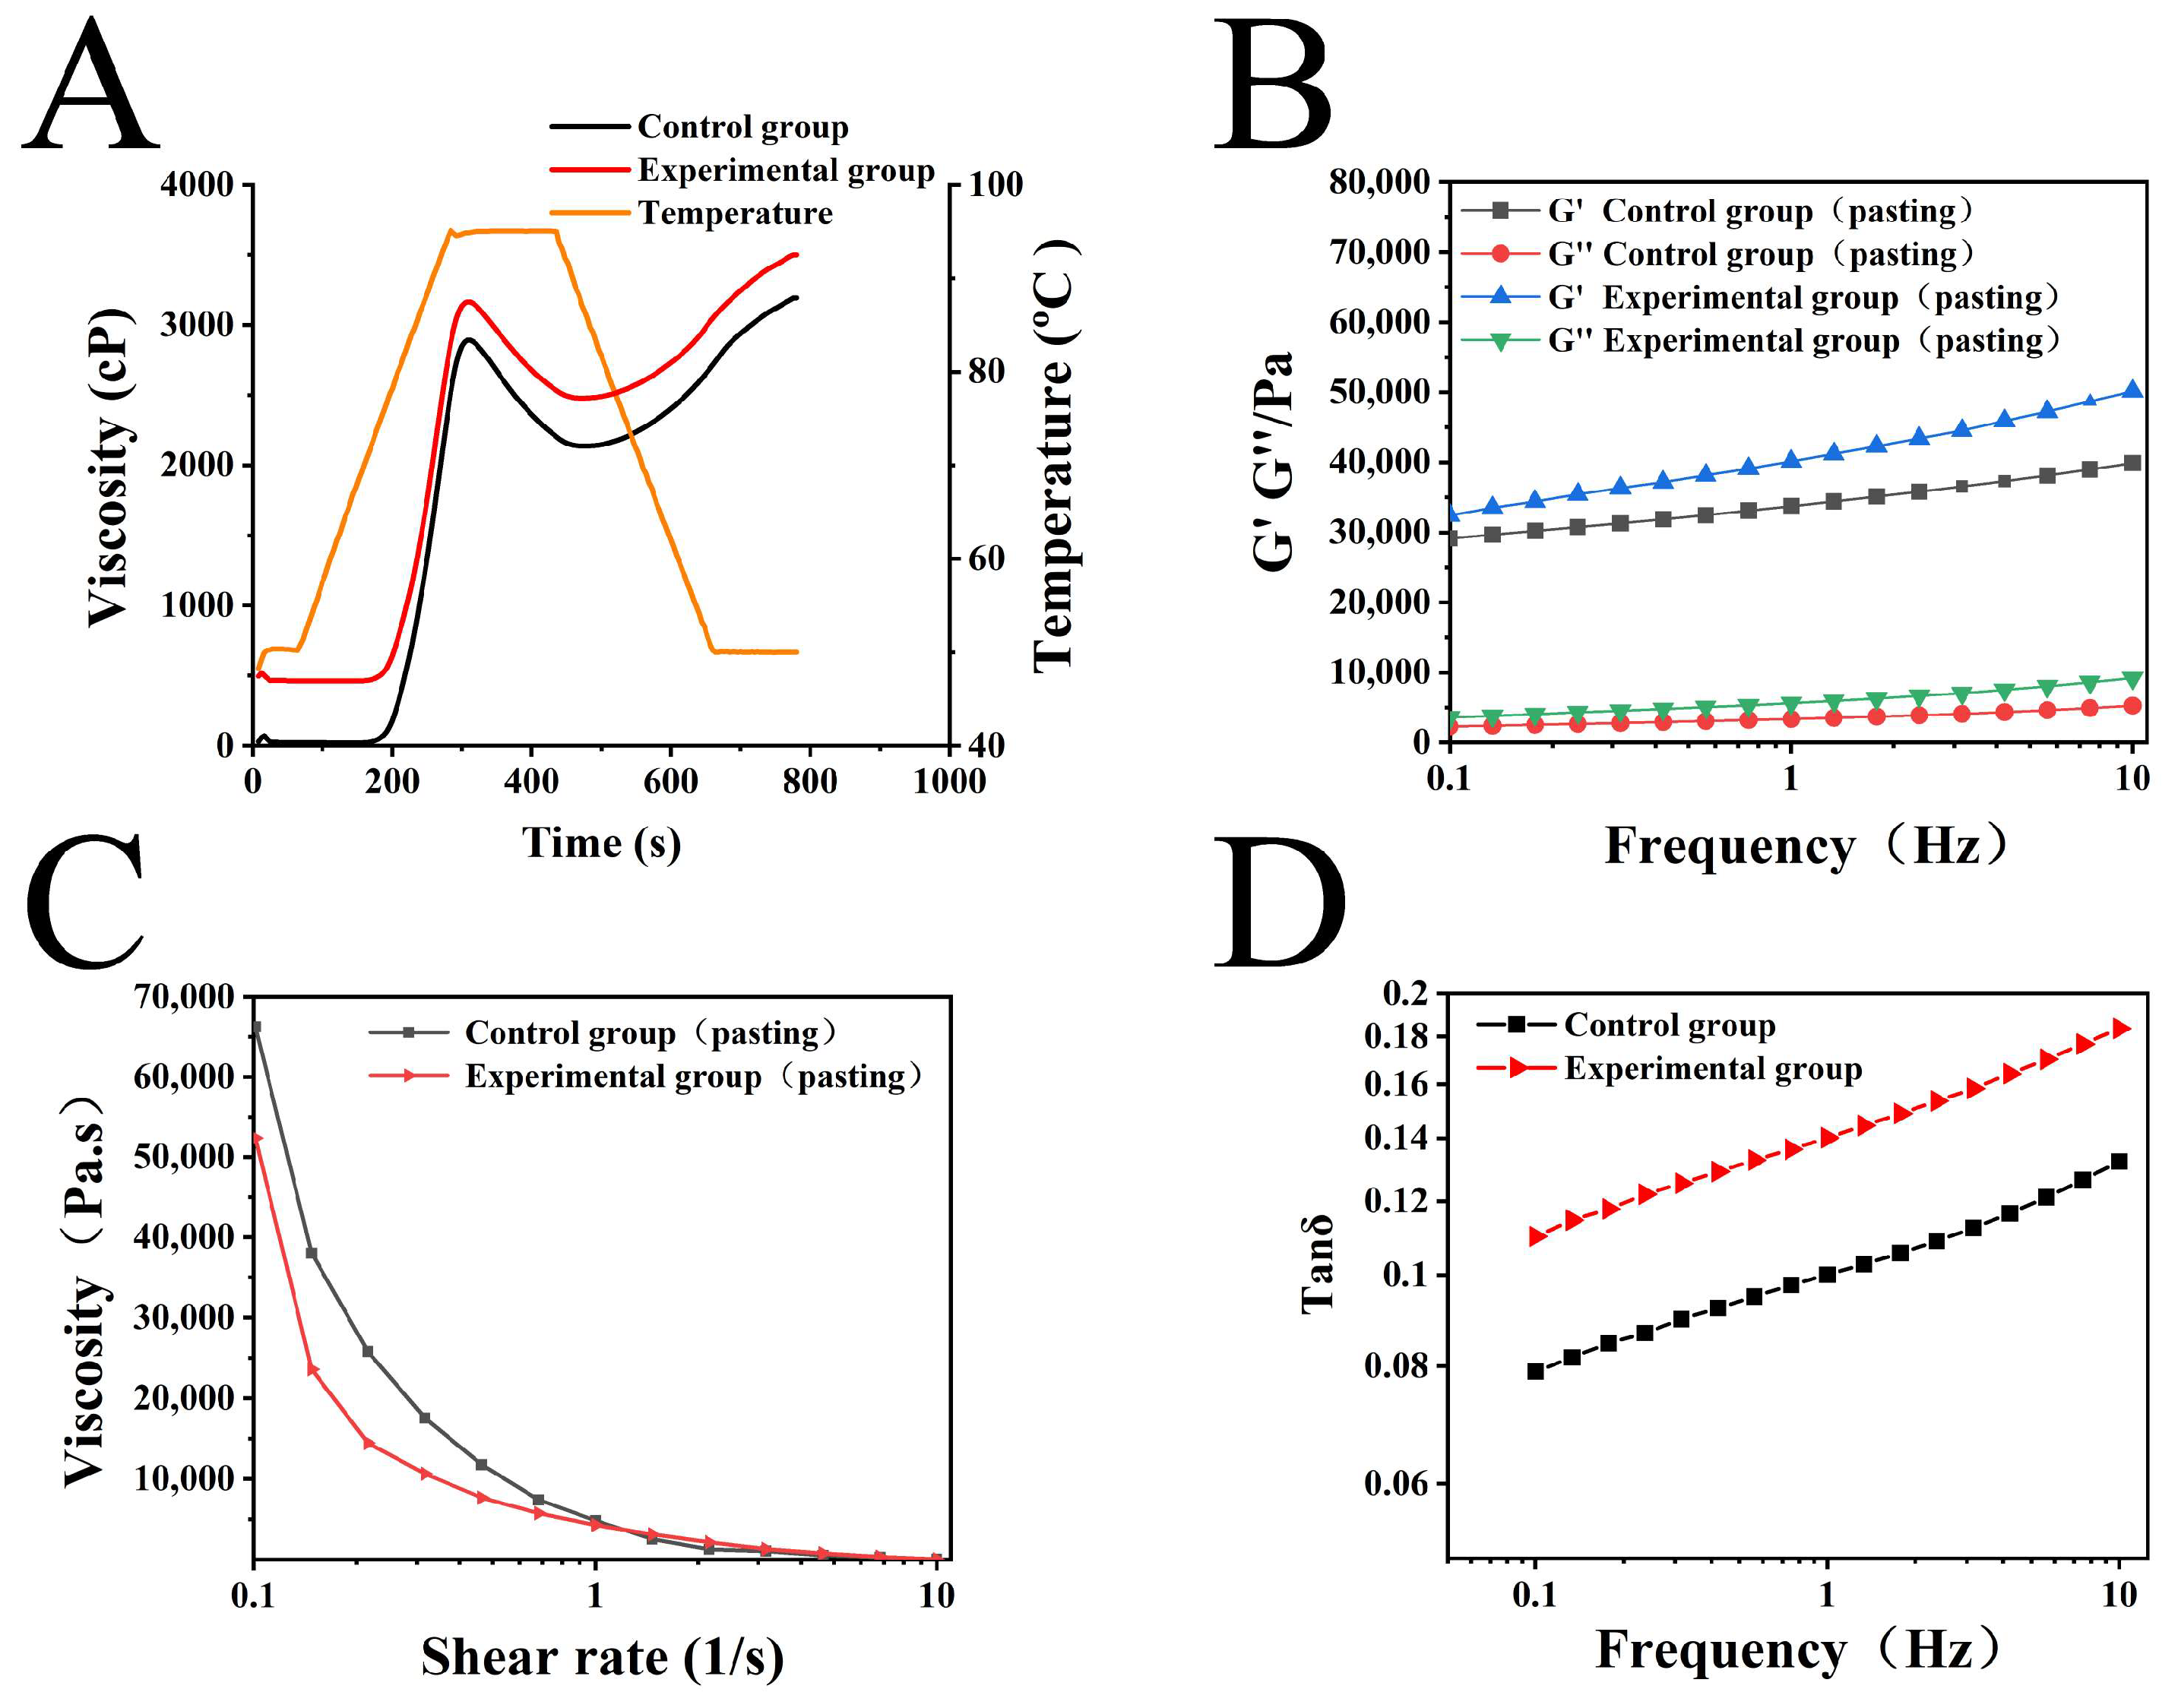
3.2. Pasting Properties
3.3. Rheological Properties
3.3.1. Dynamic Rheological Properties
3.3.2. Static Rheological Properties
3.4. Gel Texture and Freeze–Thaw Stability Analysis
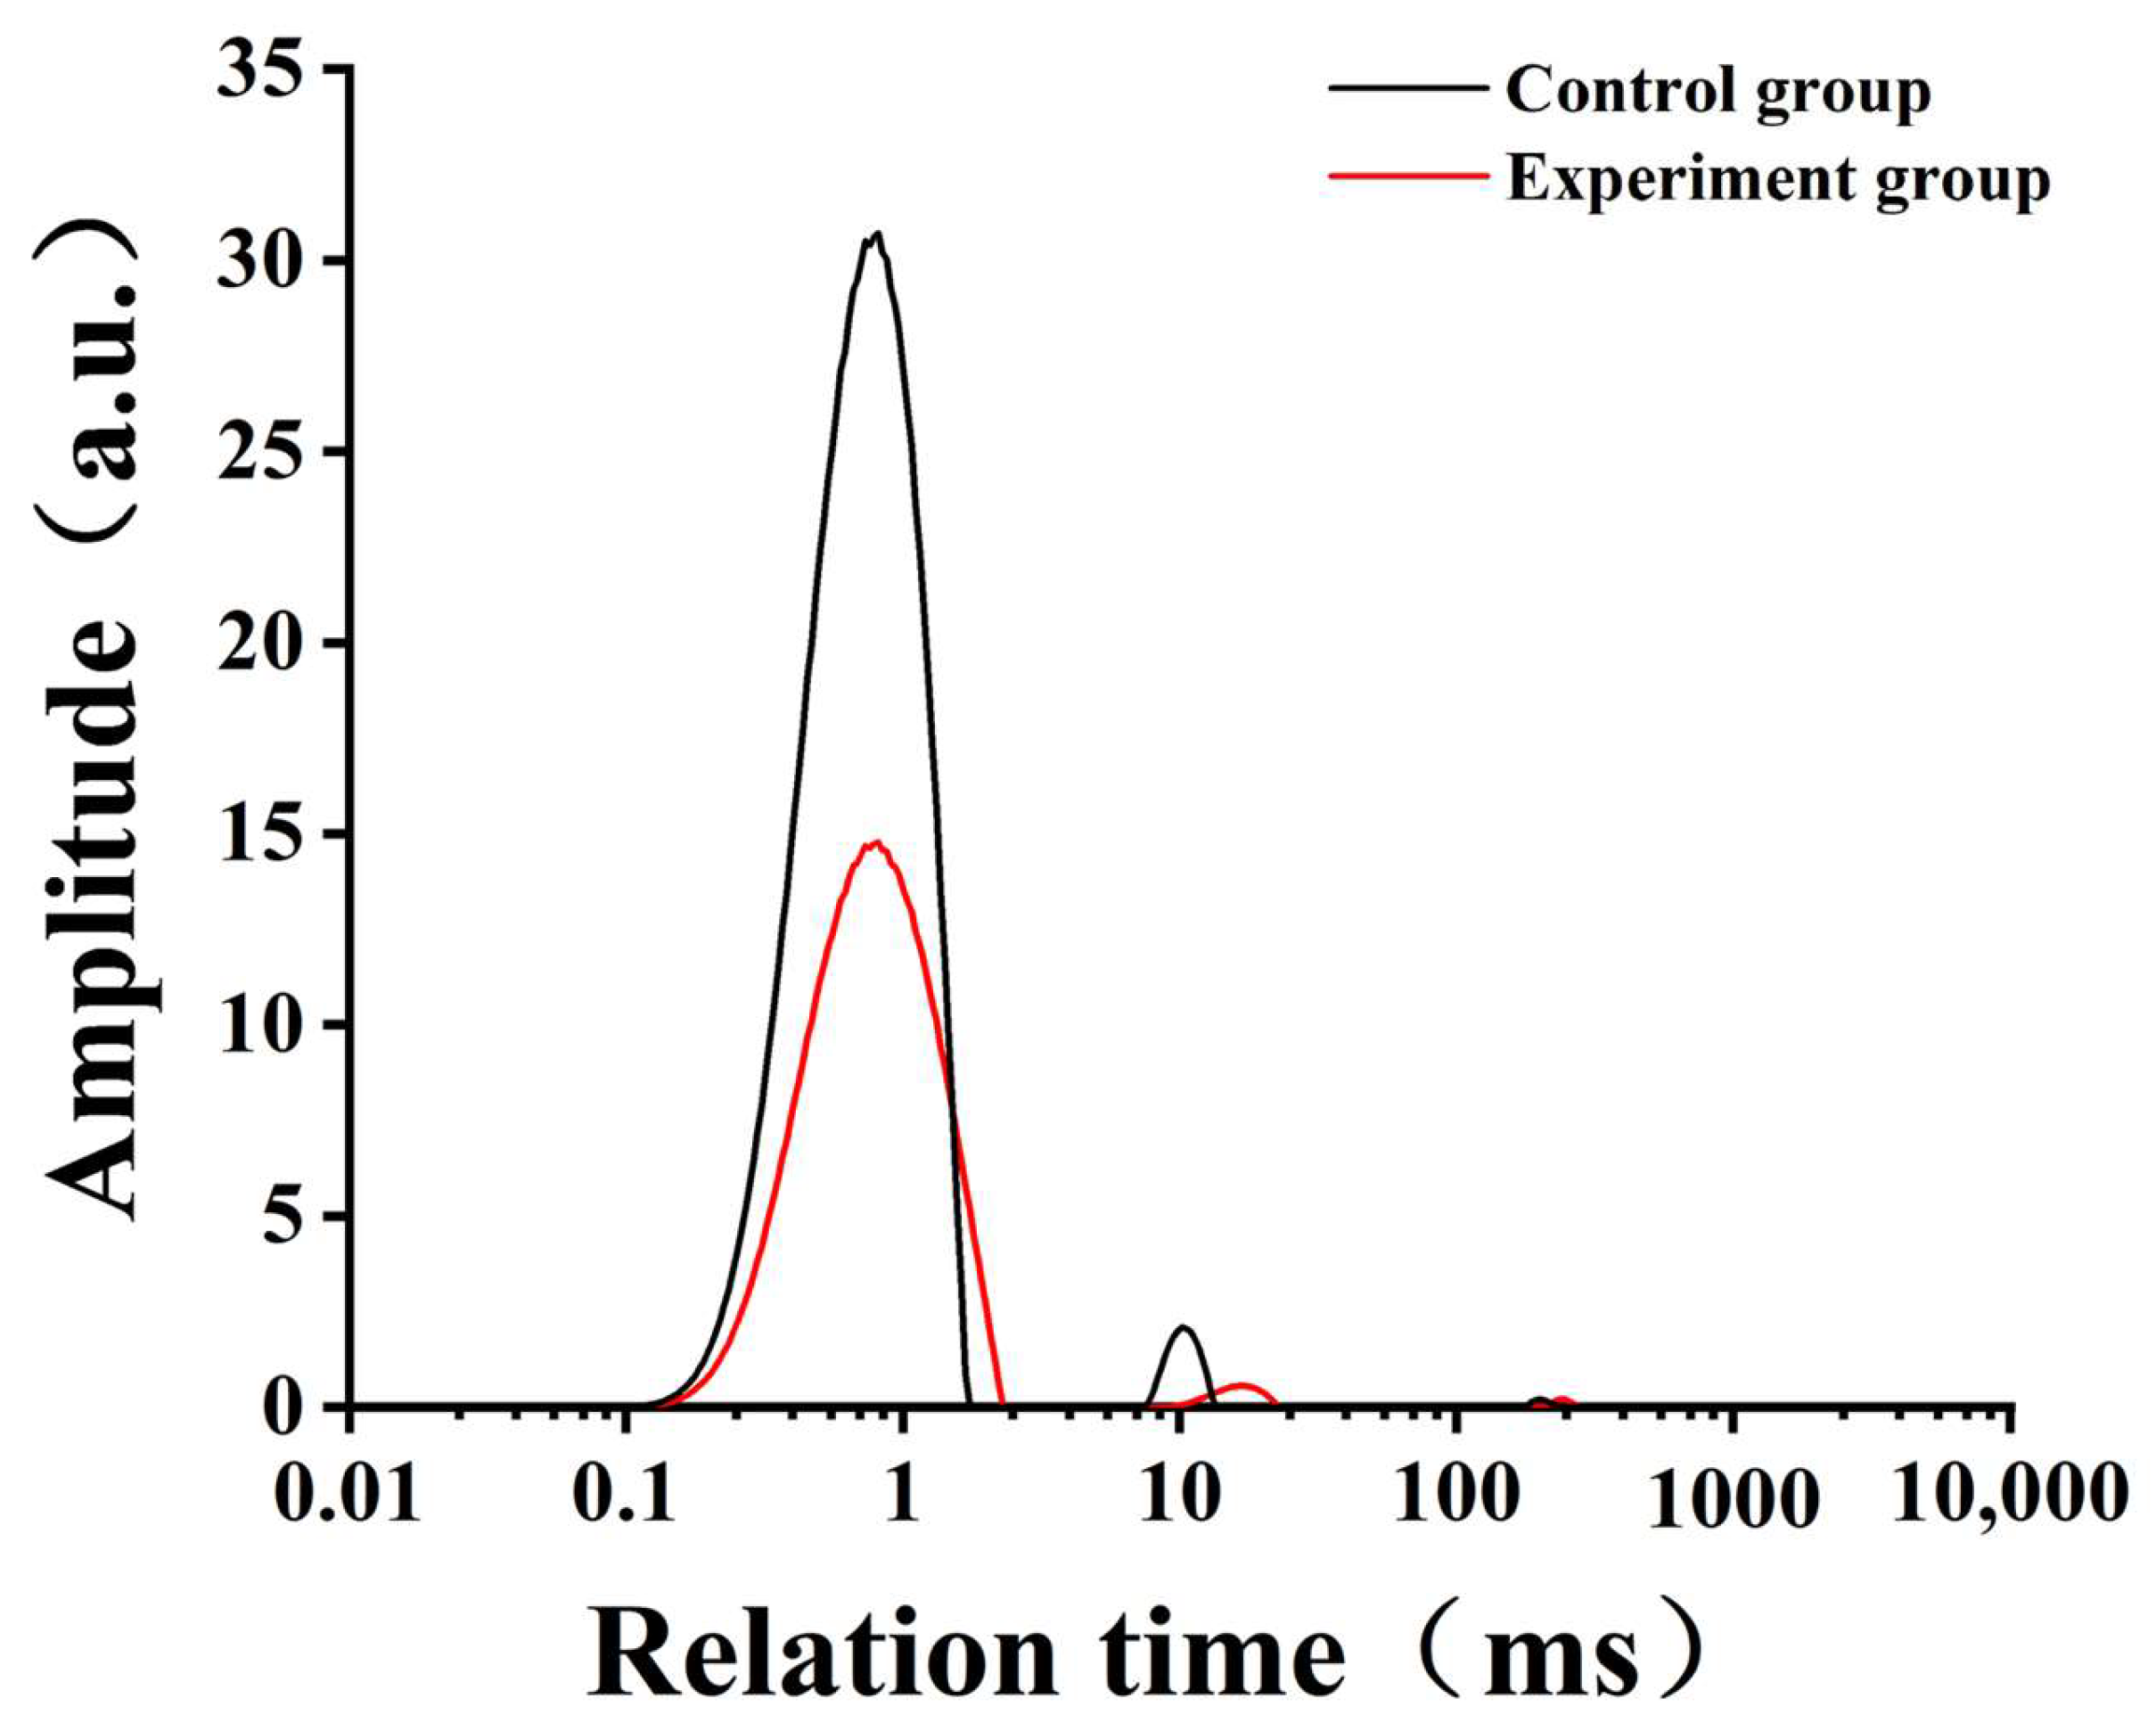
3.5. LF-NMR Analysis
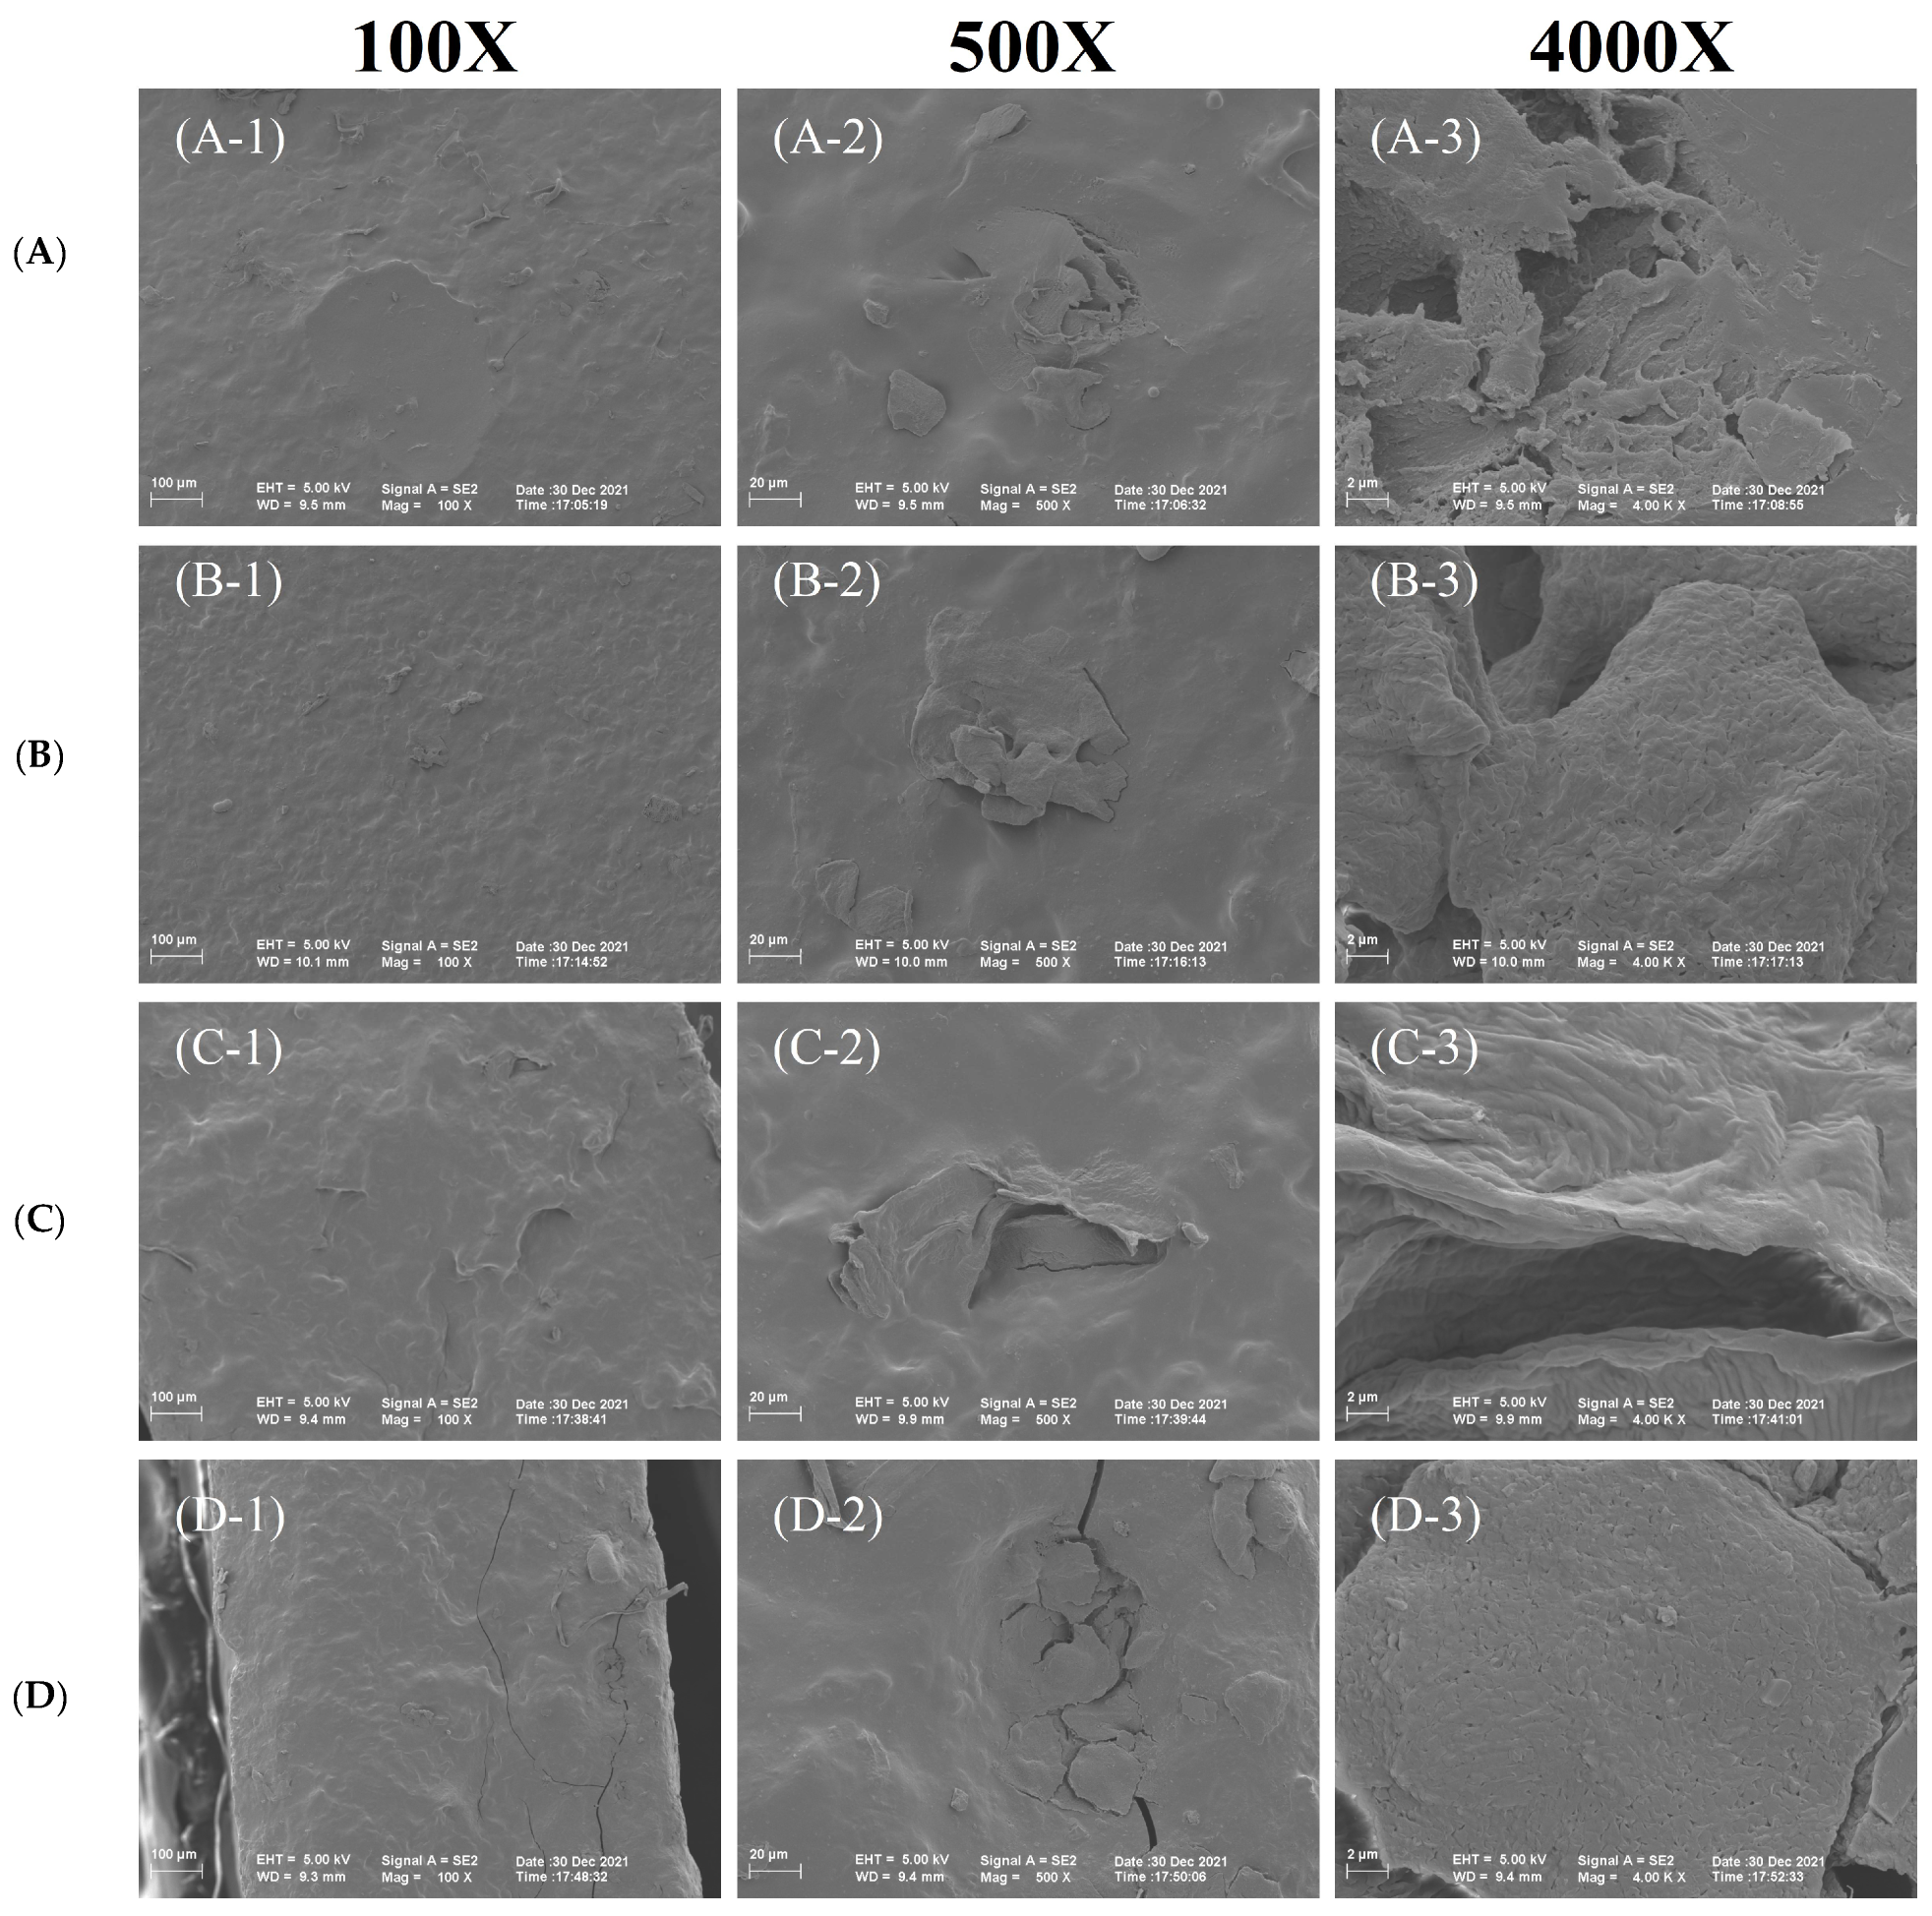
3.6. SEM Test
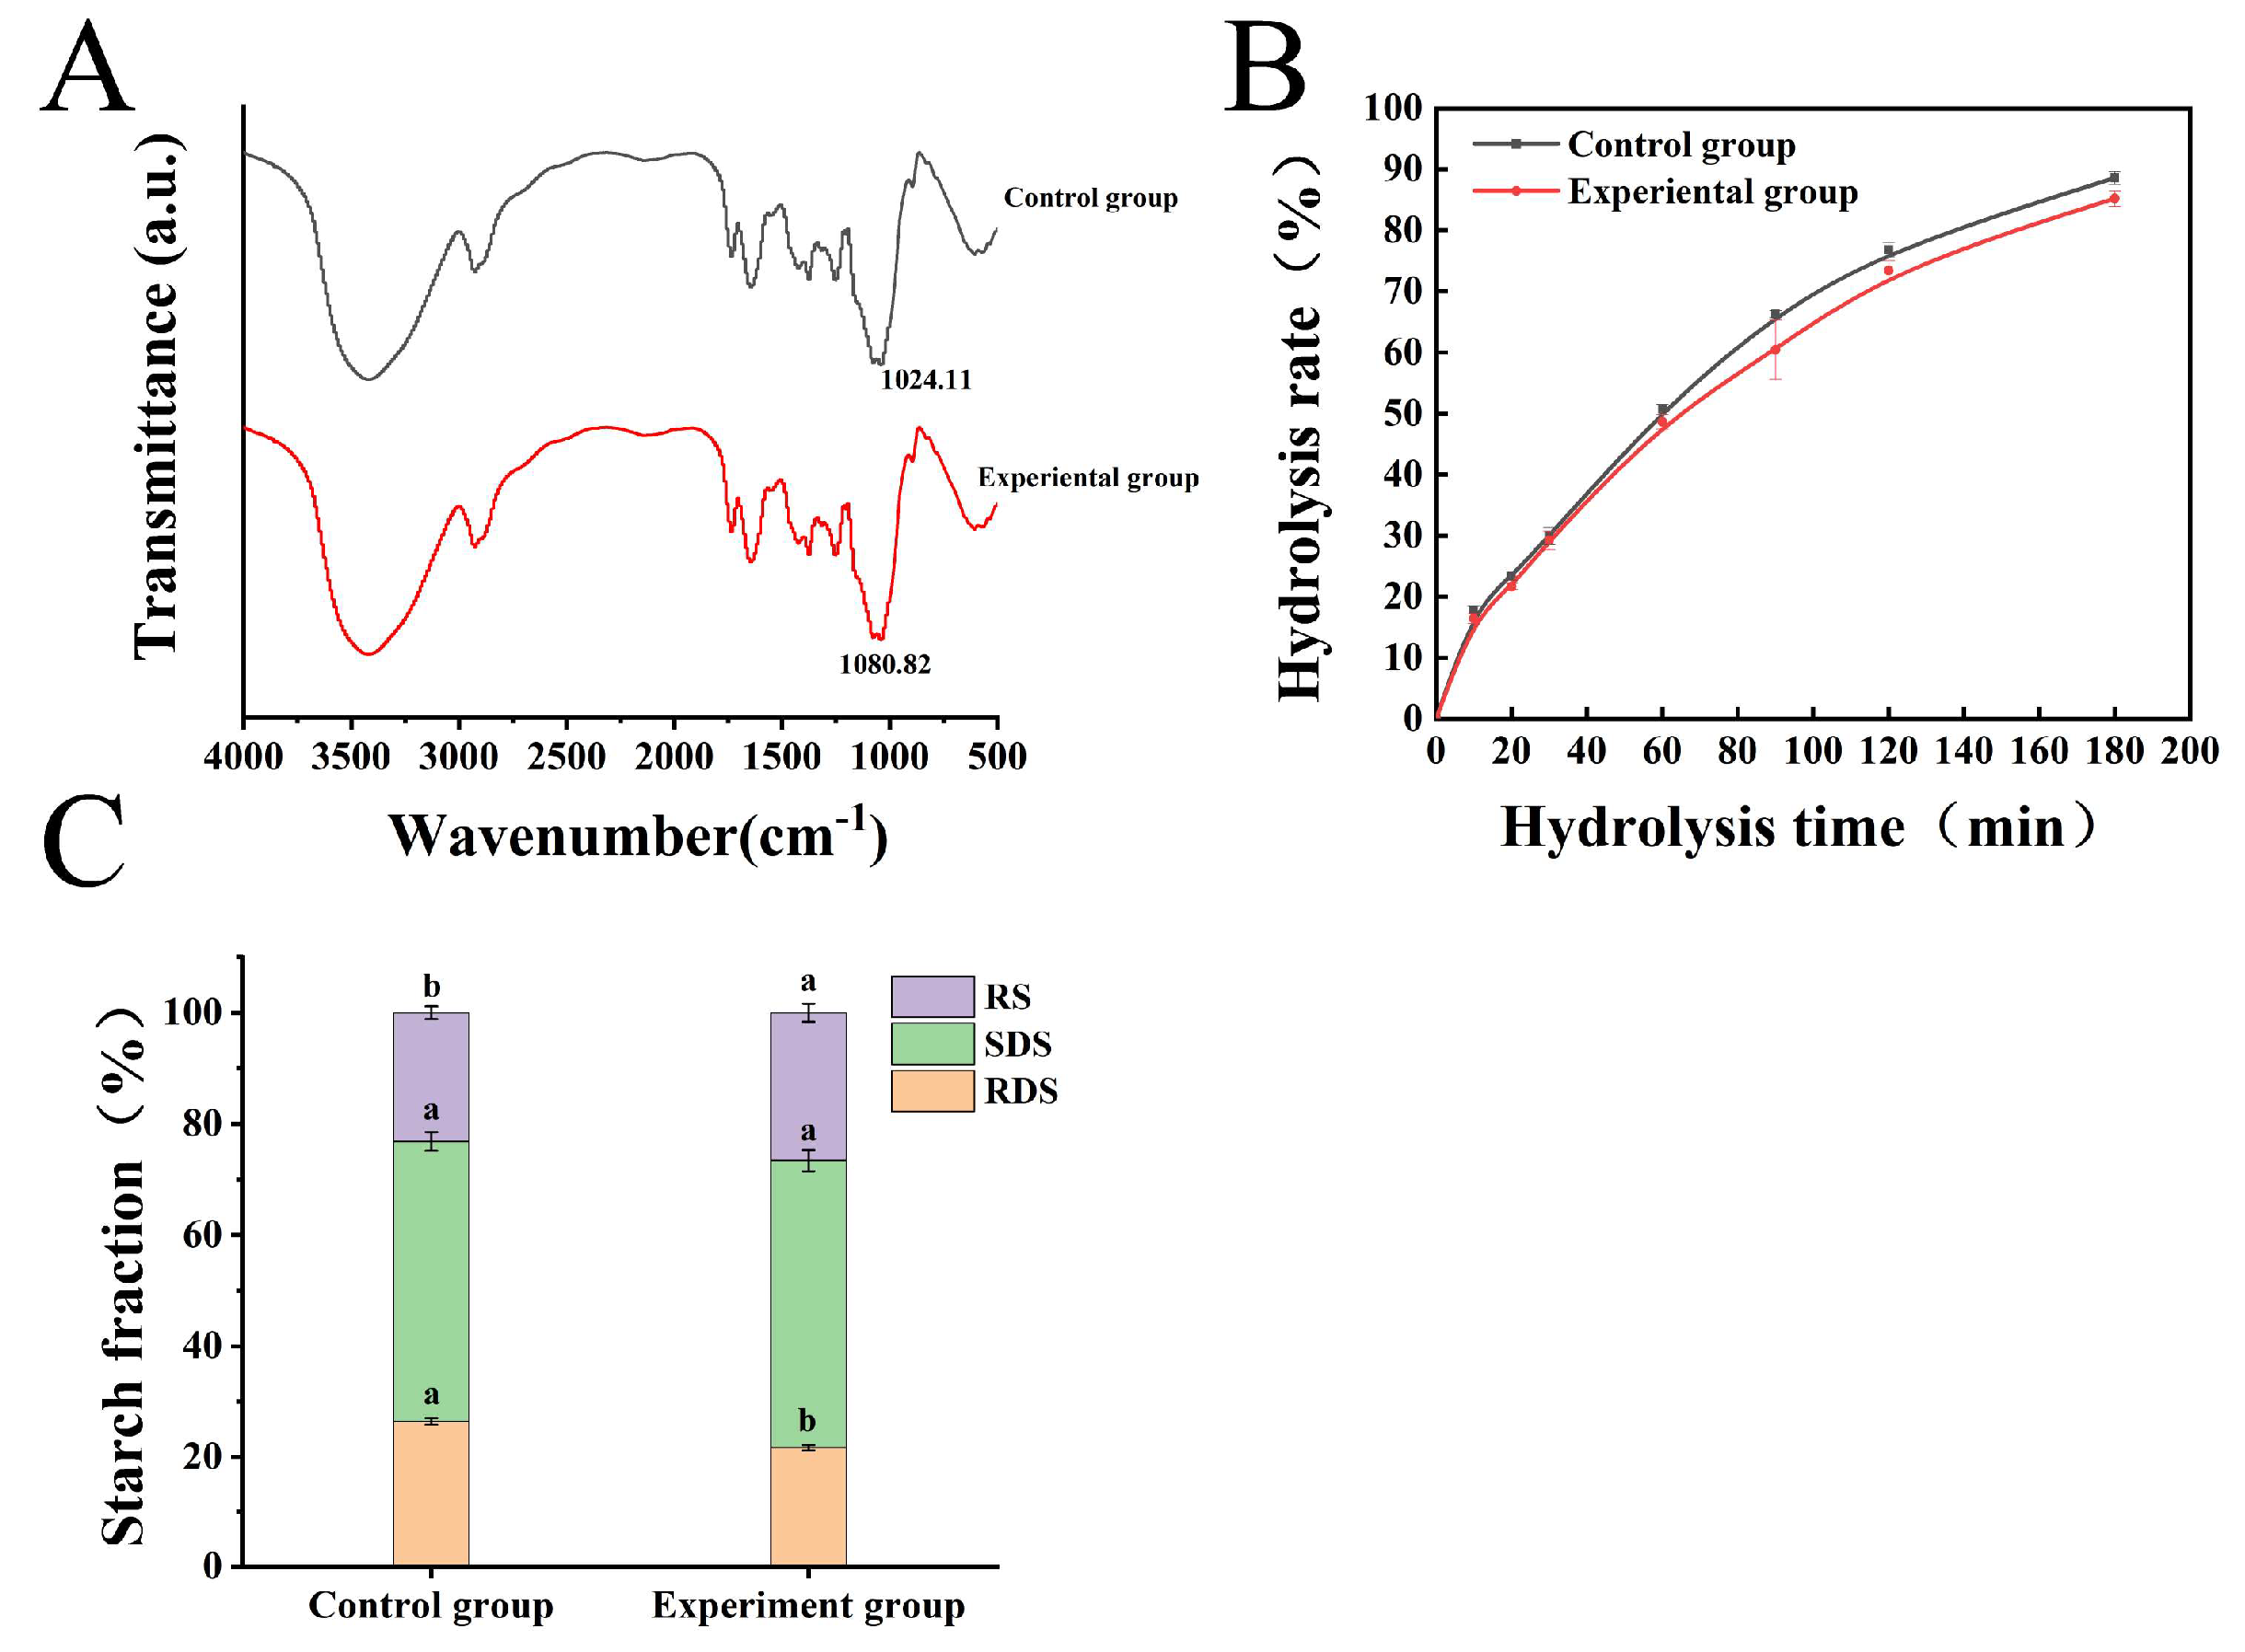
3.7. FTIR Analysis
3.8. In Vitro Digestibility
3.9. Quality Characteristic
3.9.1. Cooking Properties
3.9.2. Color Difference
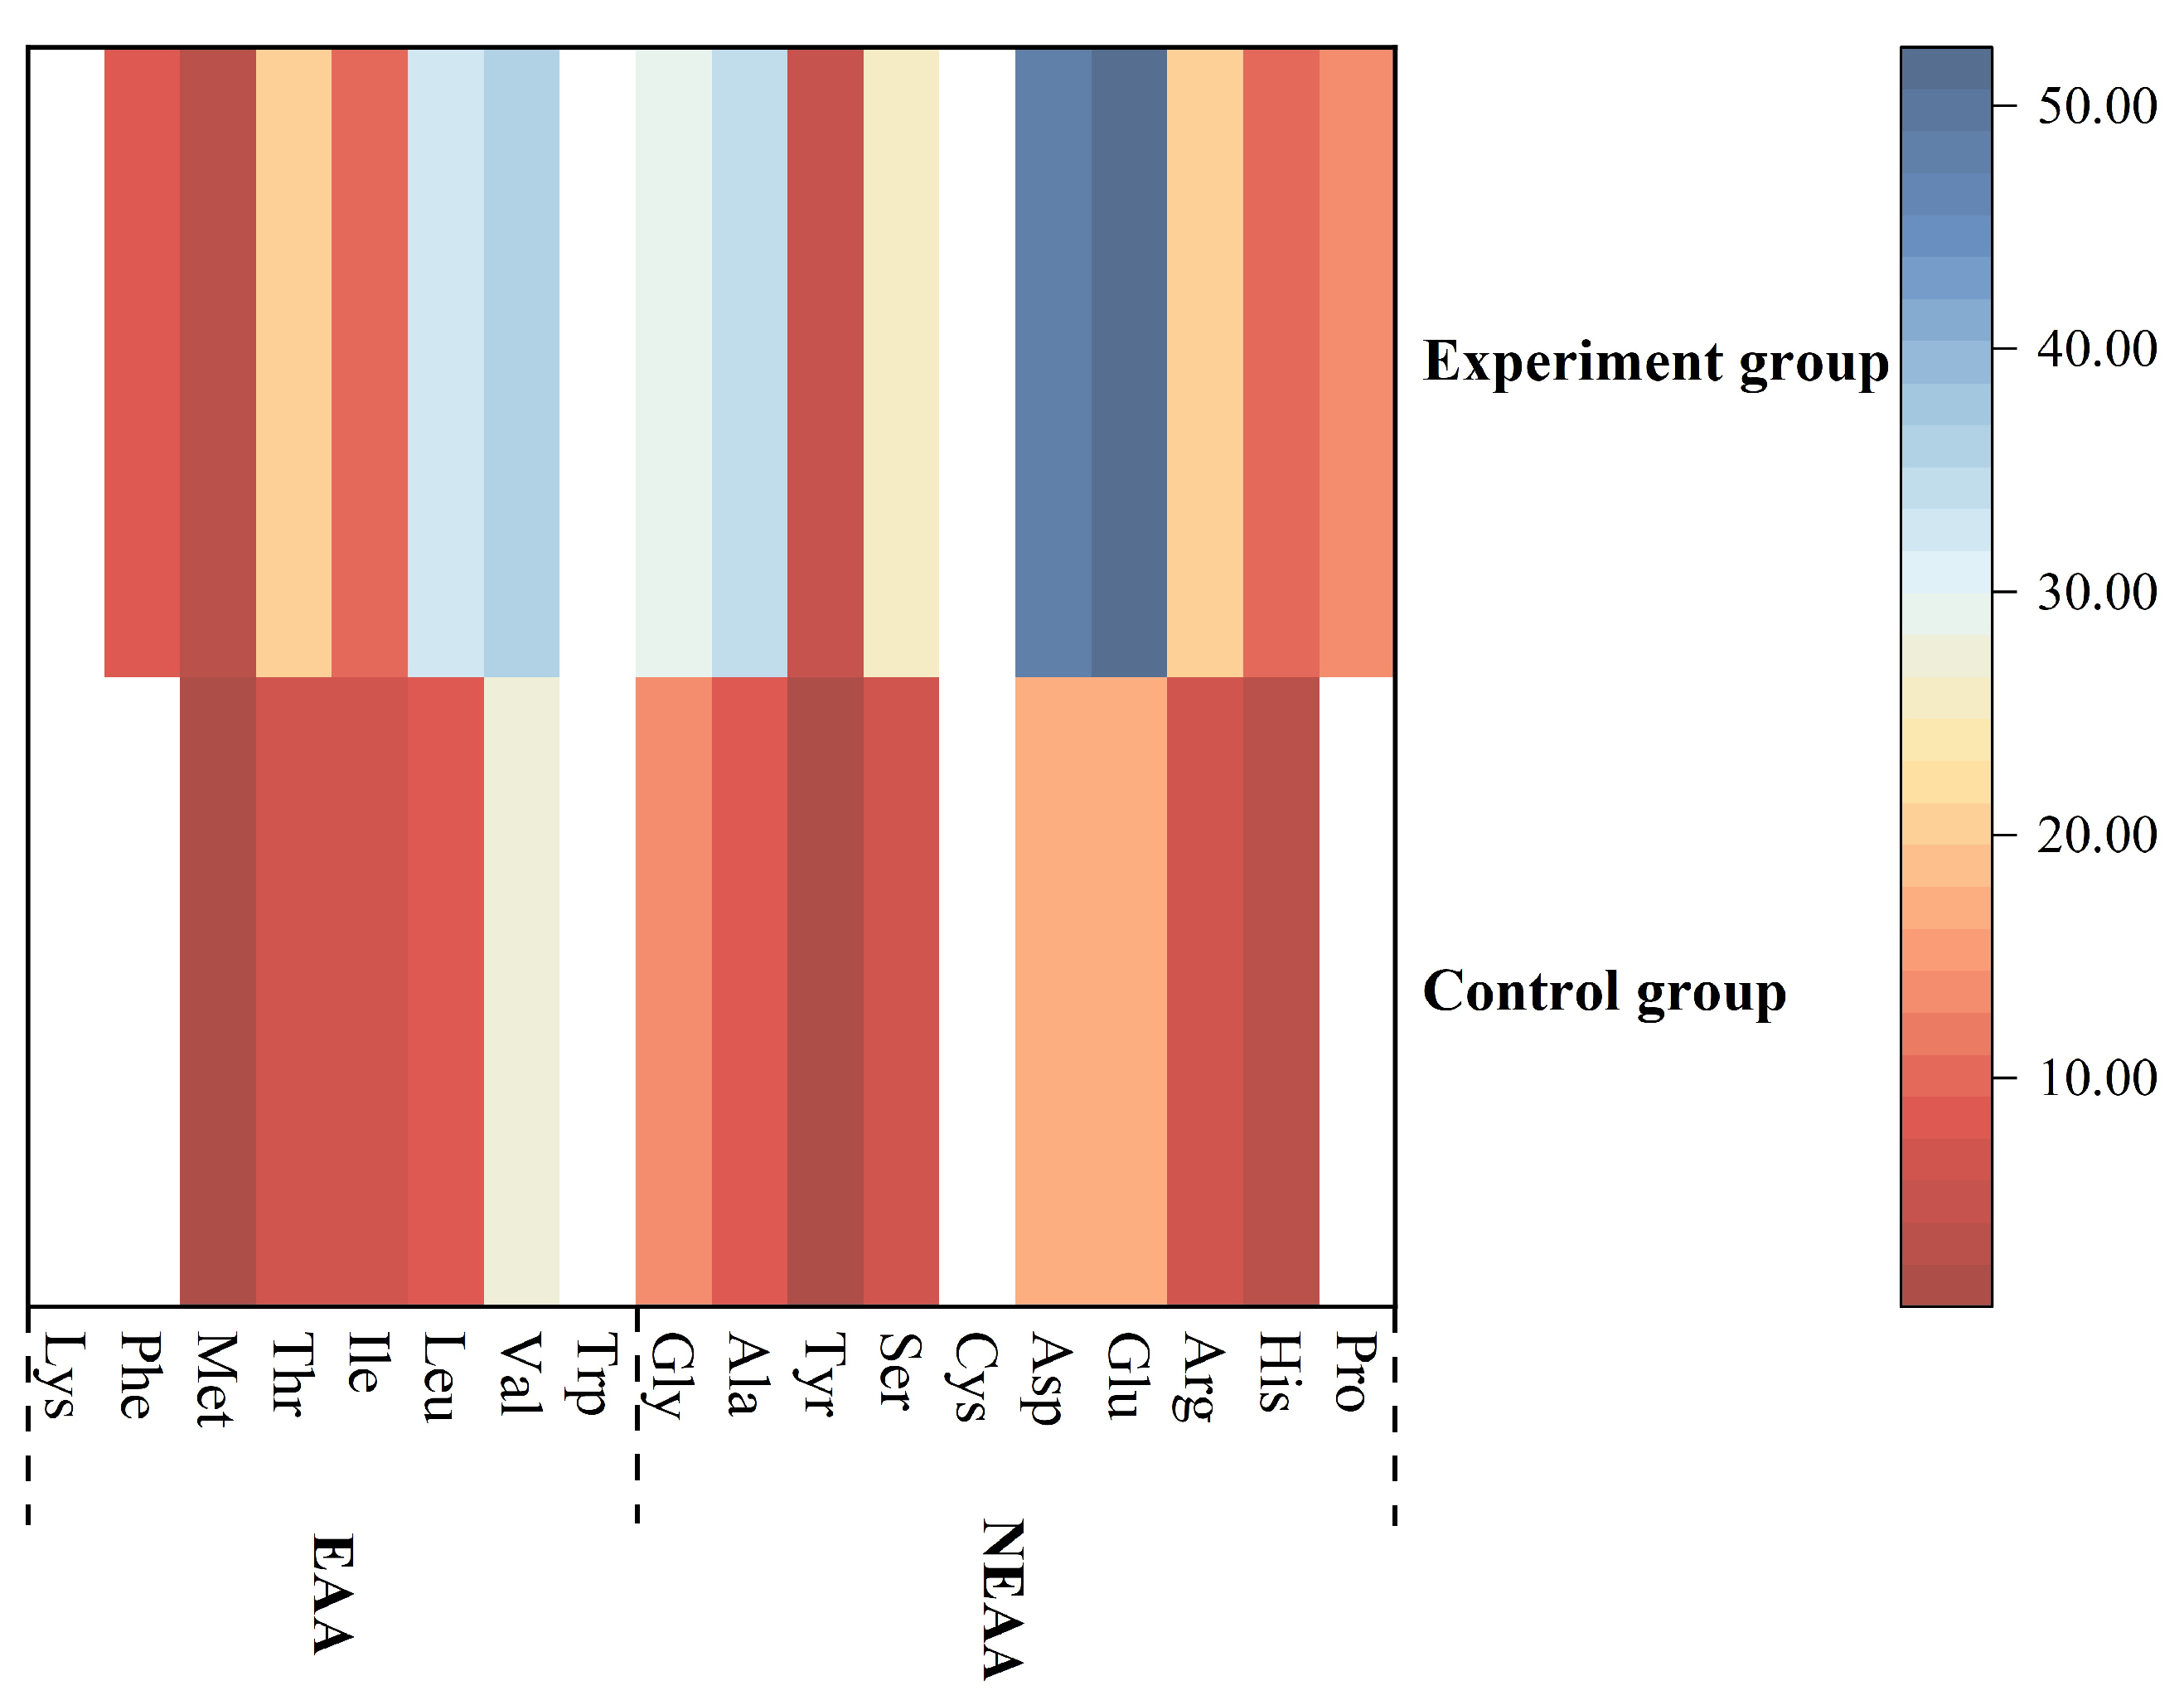
3.9.3. Hydrolyzed Amino Acid Analysis and Amino ACID Score
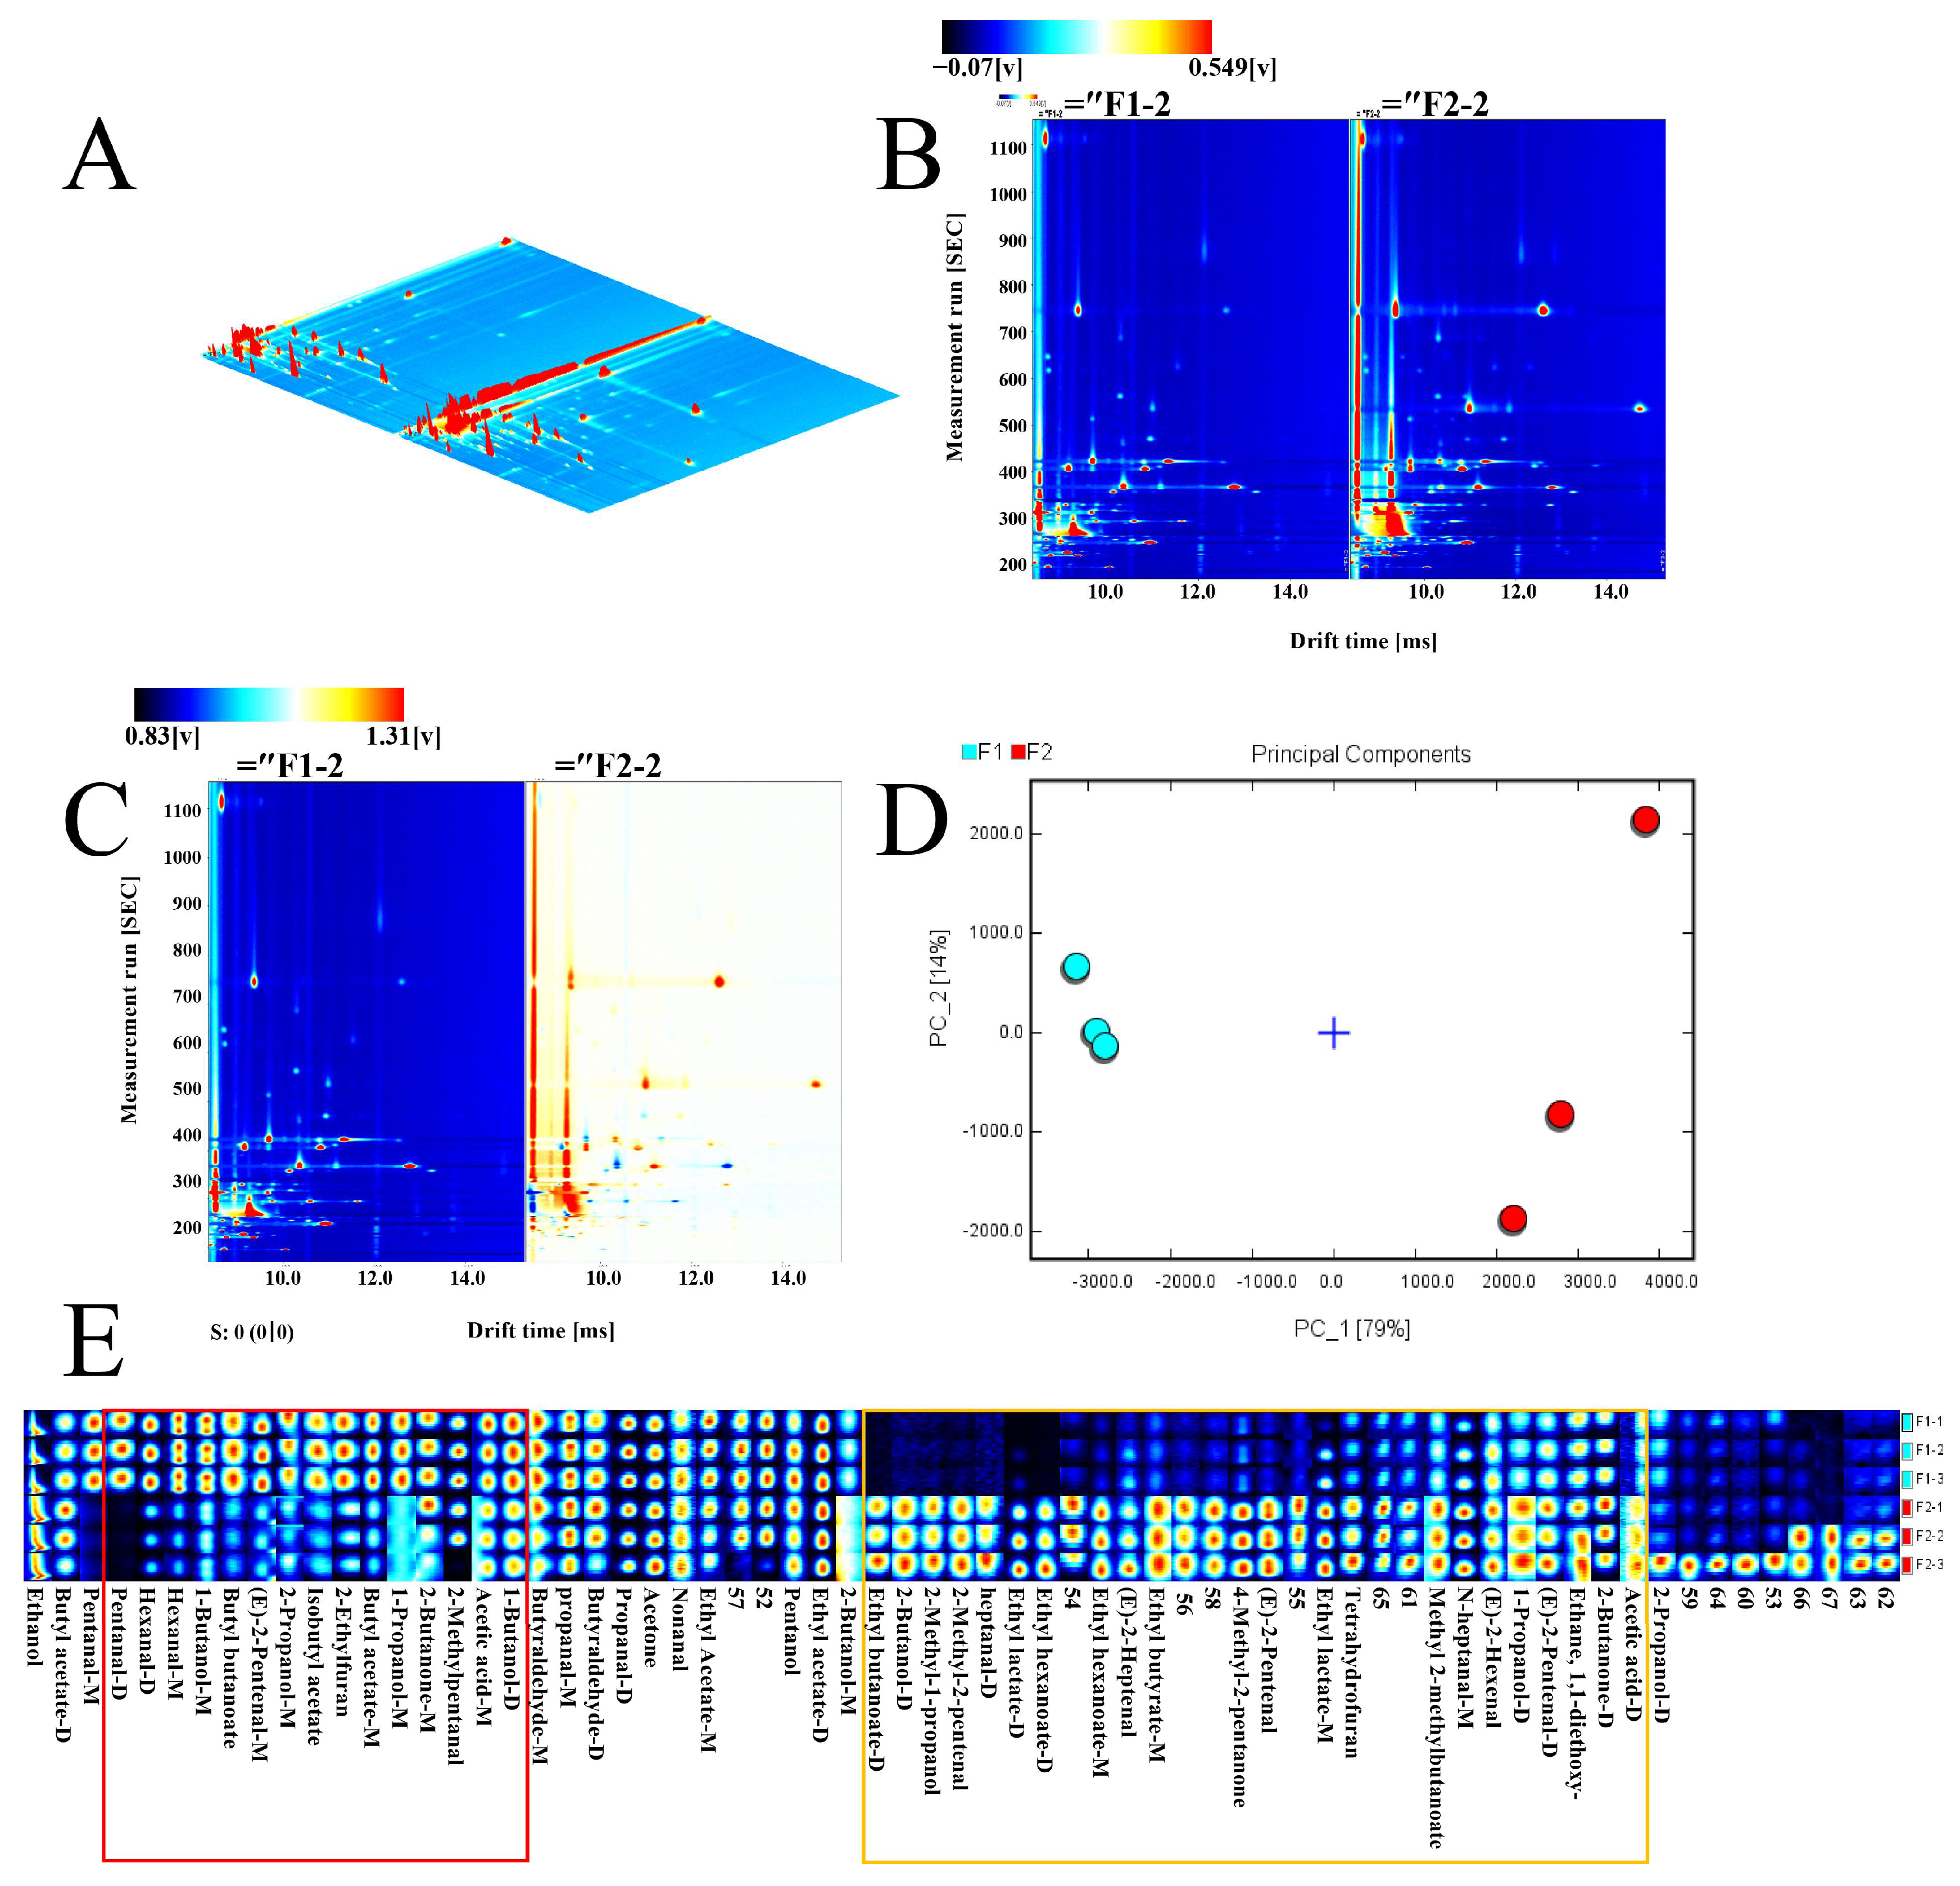
3.9.4. GC-IMS Detection
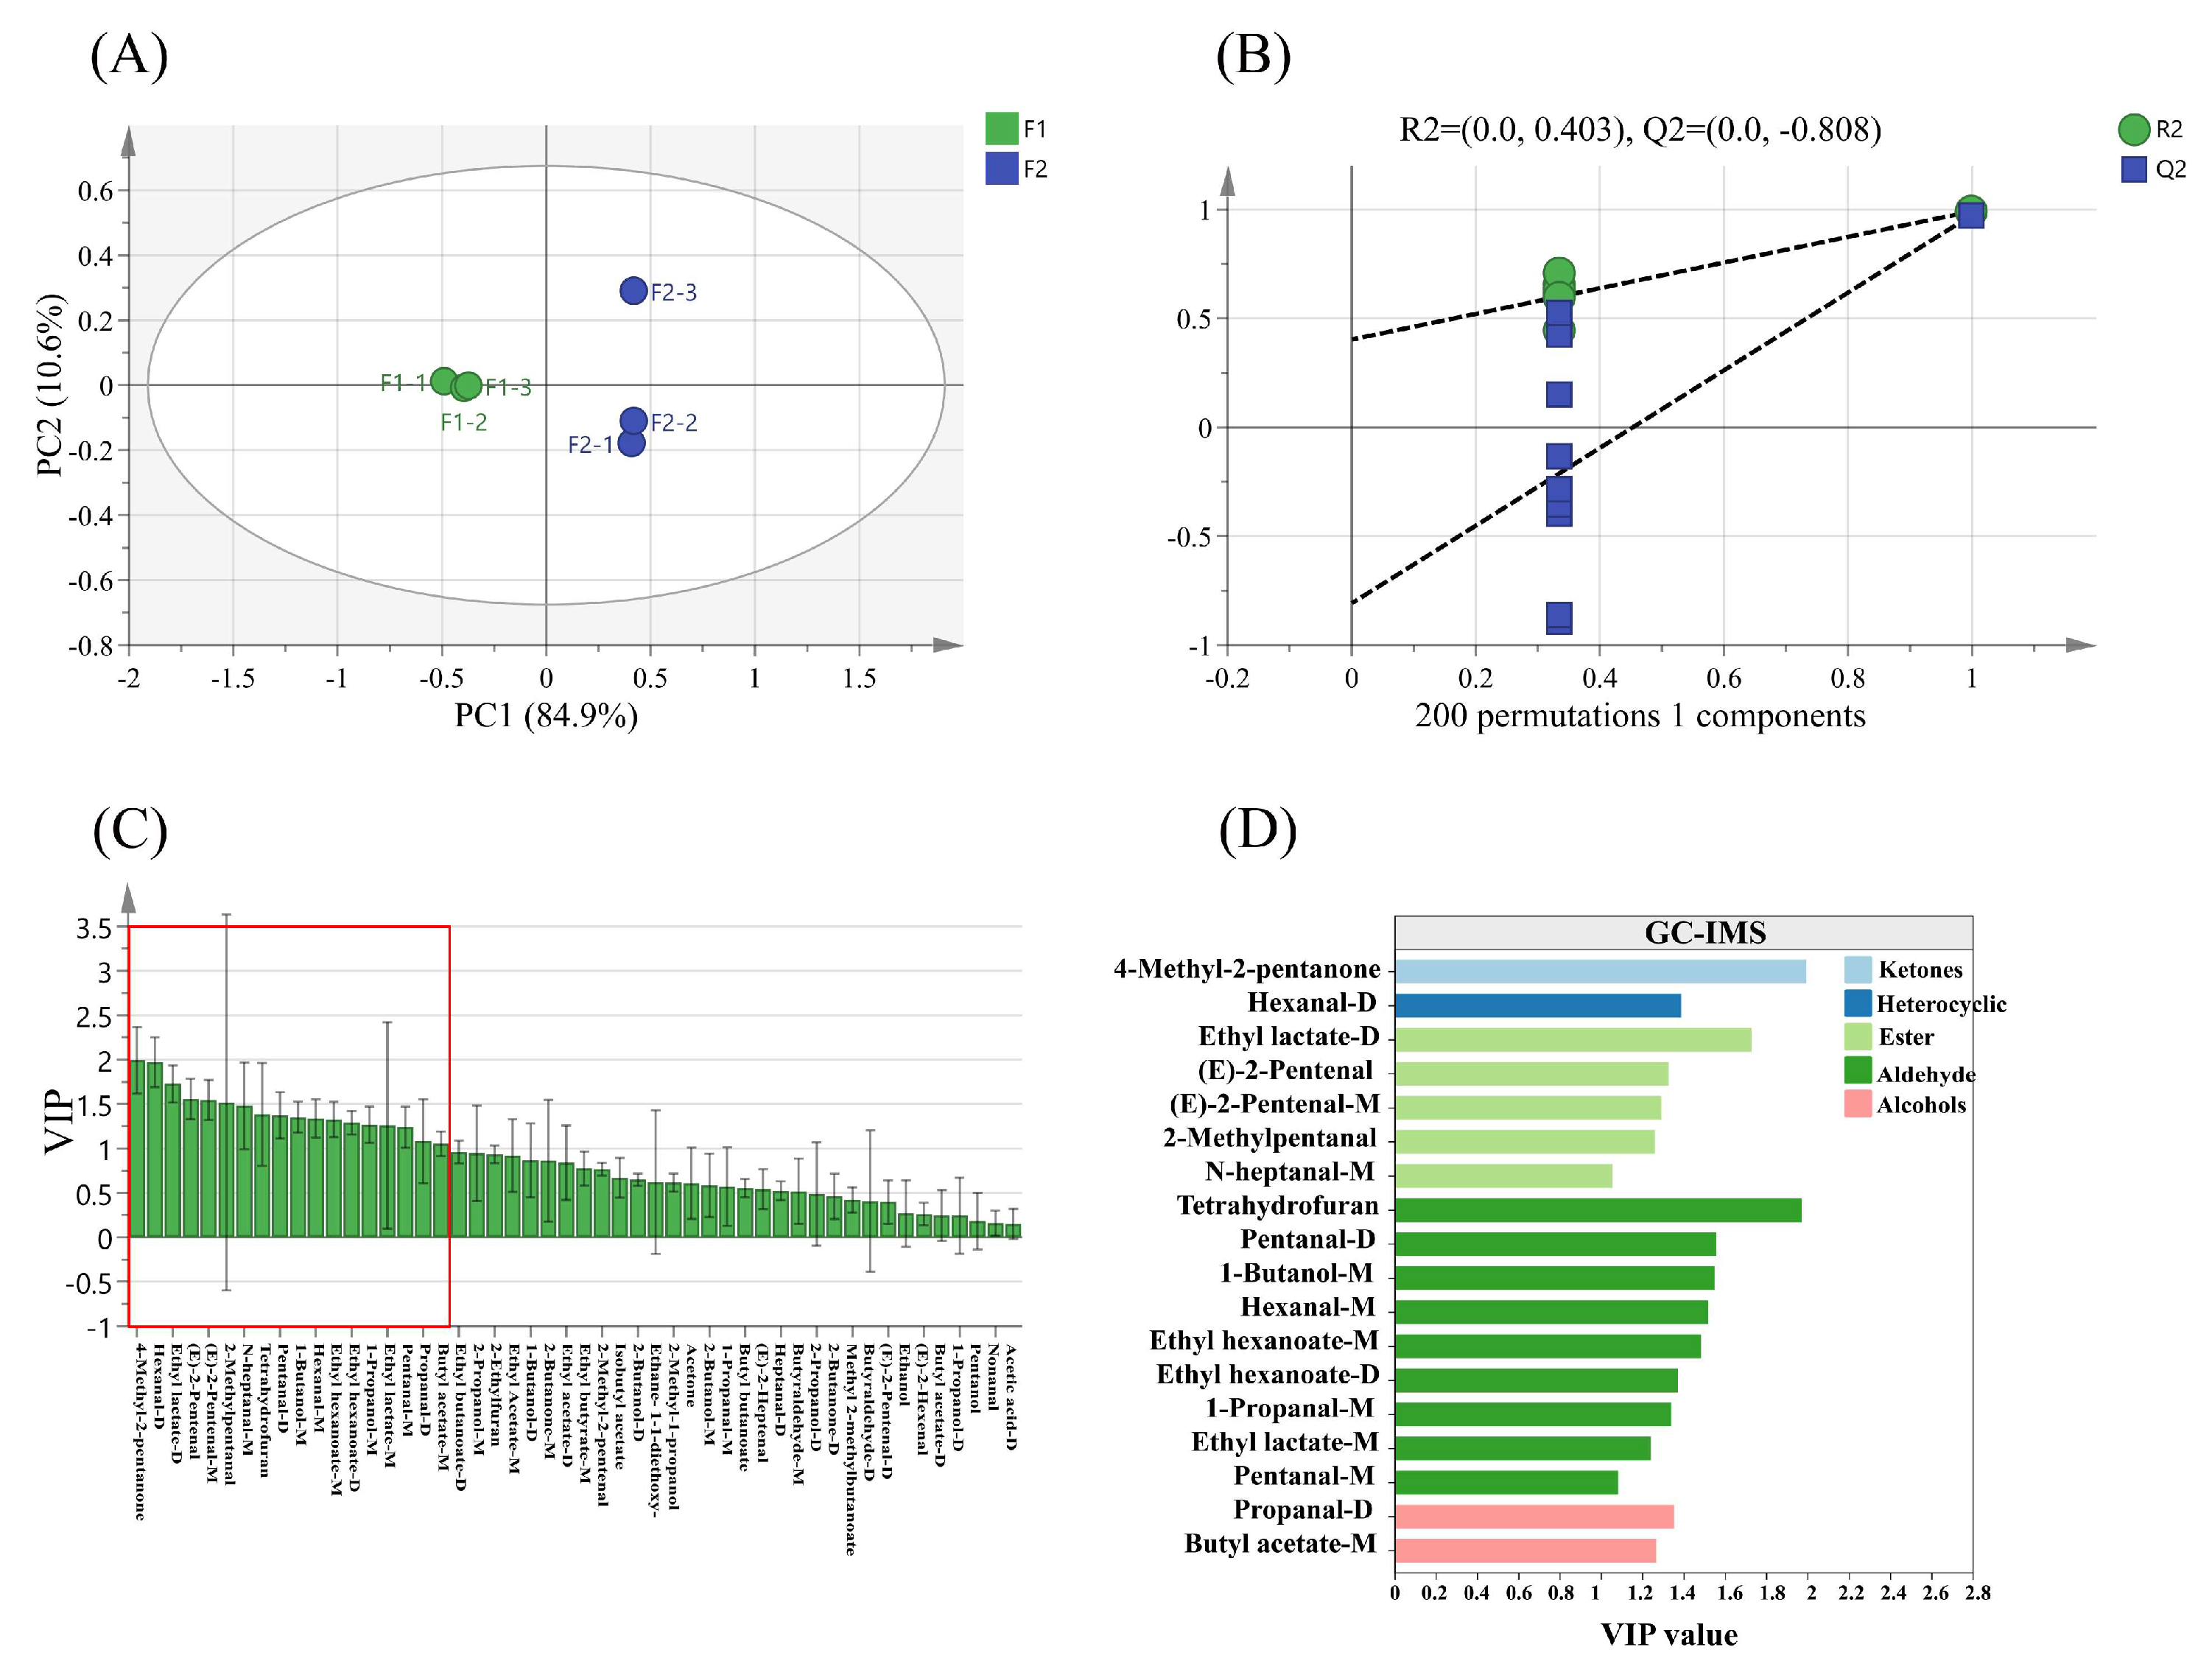
3.9.5. Distinction of Samples by OPLS-DA and Modeling Evaluation Analysis
3.9.6. Candidate Differential VOCs in Samples
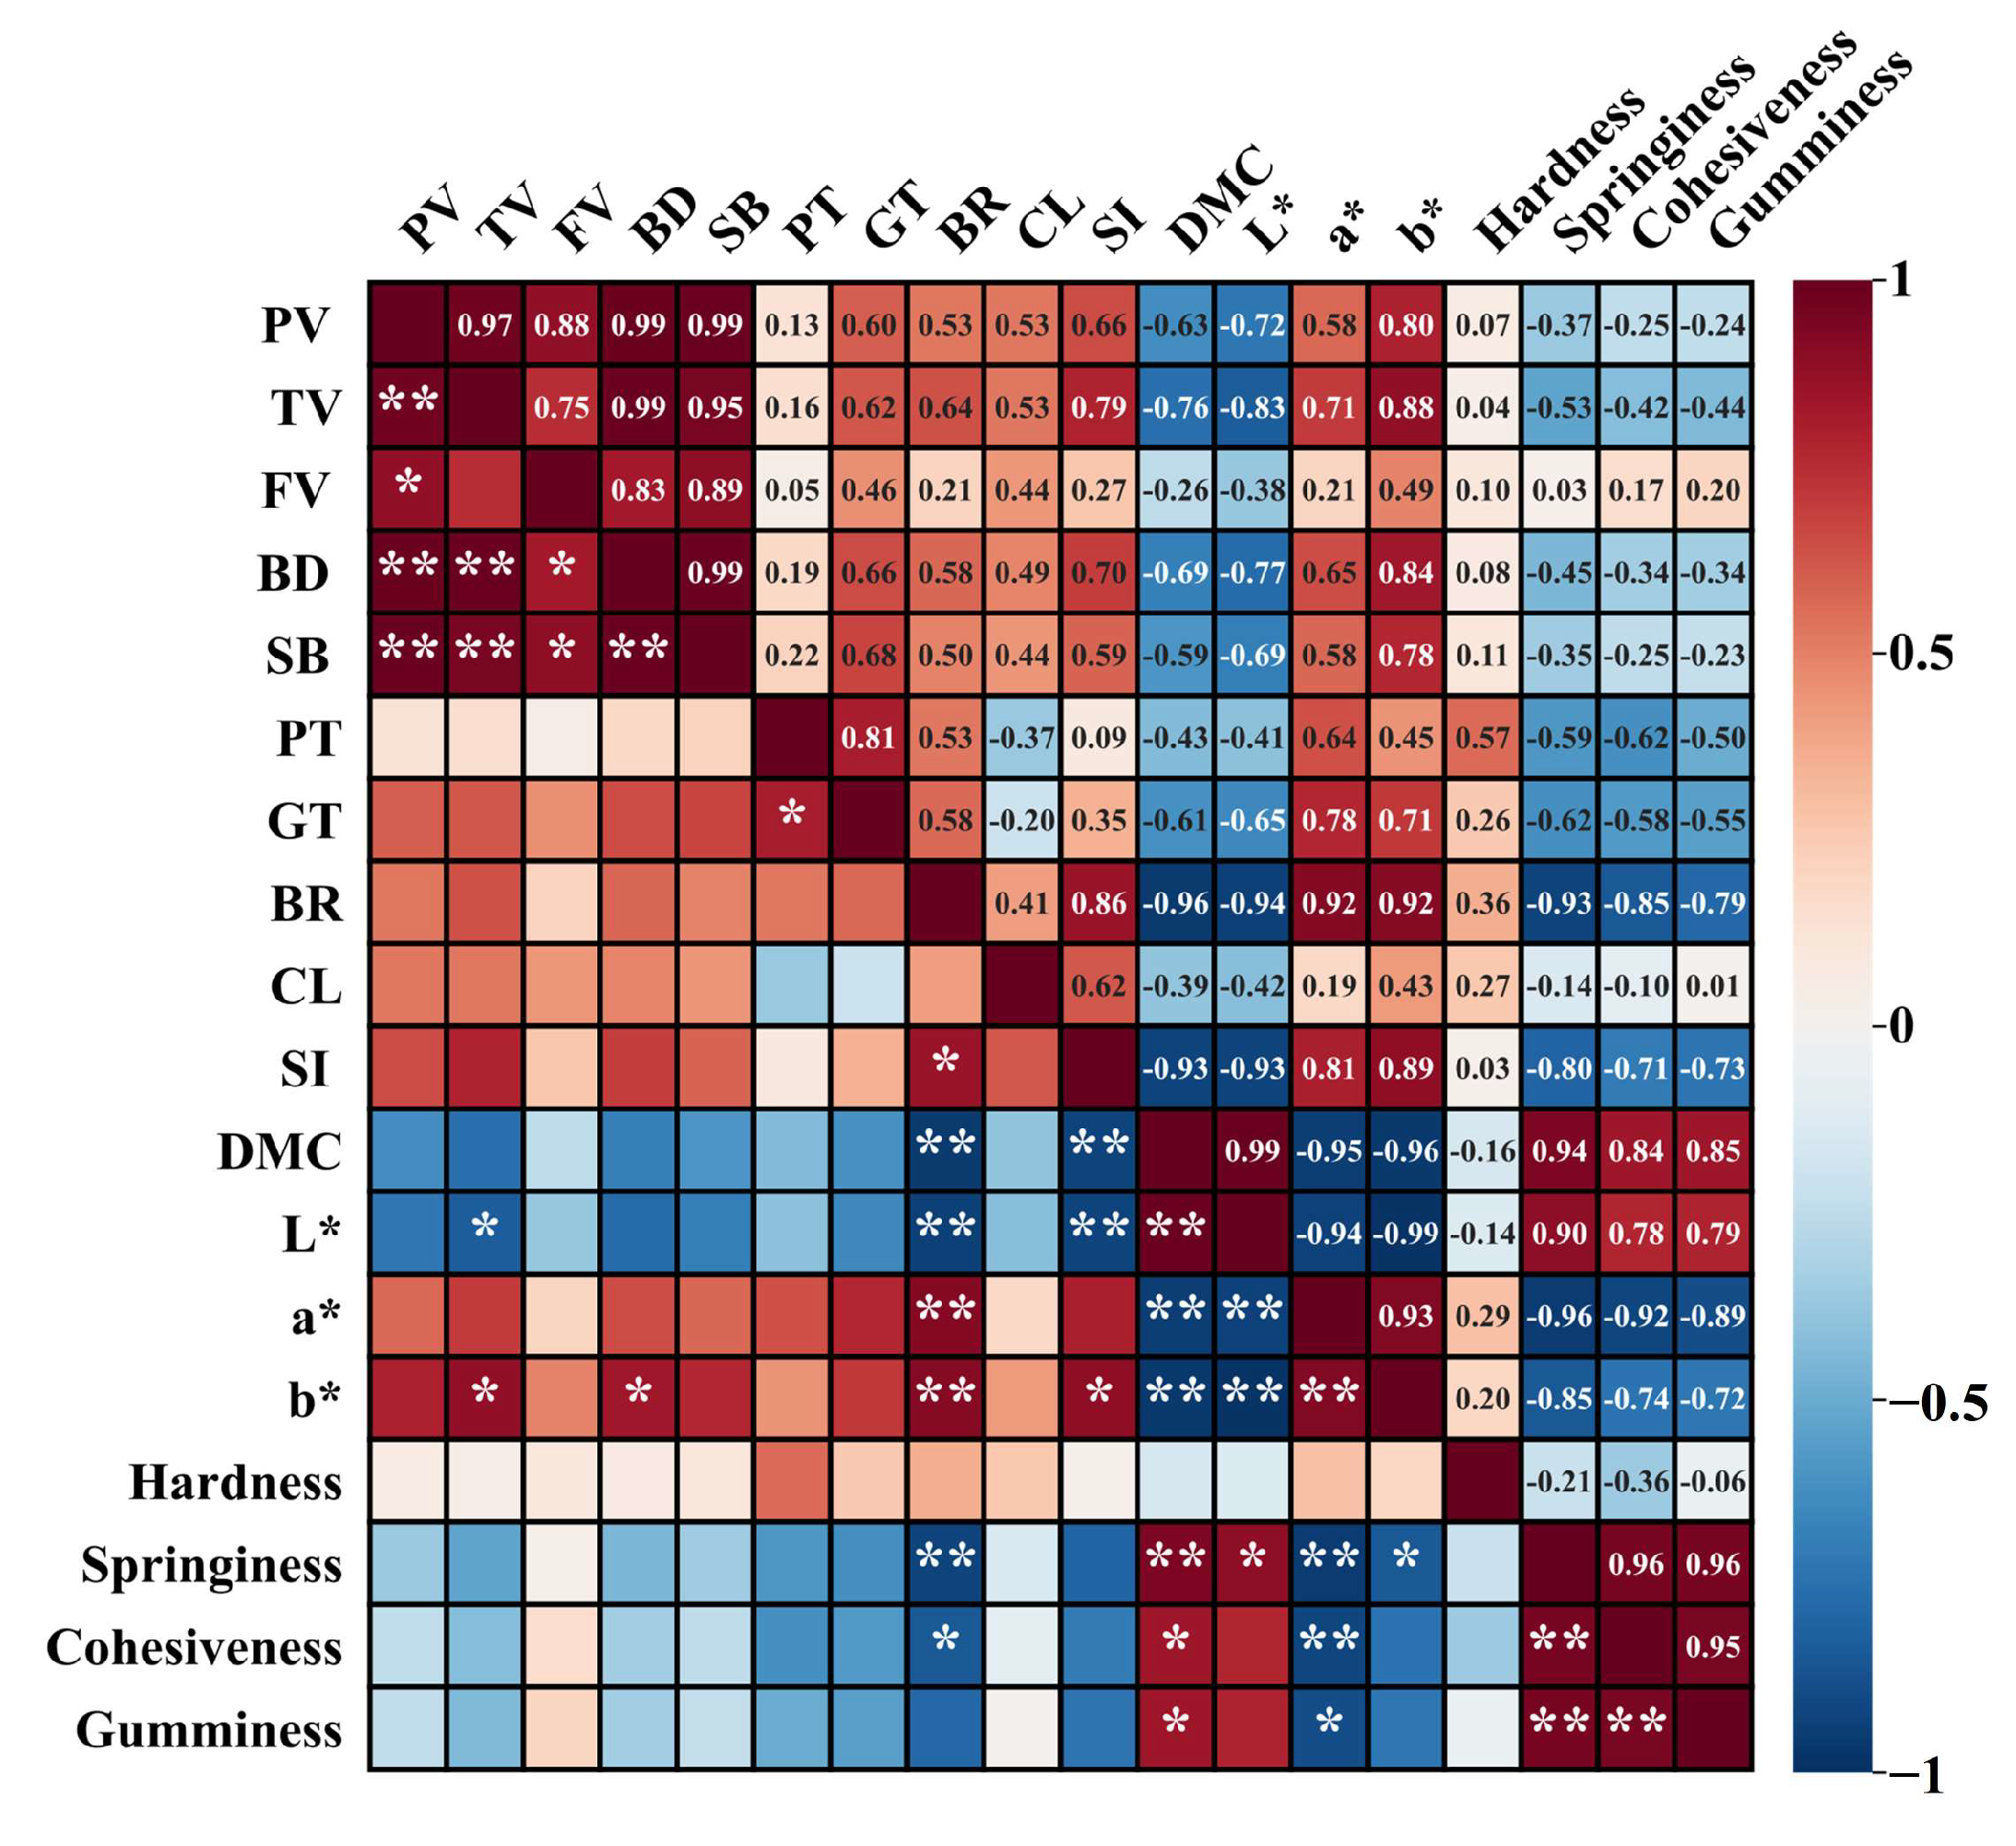
3.10. Pearson Correlations Analysis
4. Conclusions
Supplementary Materials
Author Contributions
Funding
Institutional Review Board Statement
Informed Consent Statement
Data Availability Statement
Acknowledgments
Conflicts of Interest
References
- Chen, Z.; Sagis, L.; Legger, A.; Linssen, J.P.H.; Schols, H.A.; Voragen, A.G.J. Evaluation of starch noodles made from three typical Chinese sweet-potato starches. J. Food Sci. 2002, 67, 3342–3347. [Google Scholar] [CrossRef]
- Tan, H.Z.; Li, Z.G.; Tan, B. Starch noodles: History, classification, materials, processing, structure, nutrition, quality evaluating and improving. Food Res. Int. 2009, 42, 551–576. [Google Scholar] [CrossRef]
- Kasemsuwan, T.; Bailey, T.; Jane, J. Preparation of clear noodles with mixtures of tapioca and high-amylose starches. Carbohydr. Polym. 1998, 36, 301–312. [Google Scholar] [CrossRef]
- Muhammad, K.; Kusnandar, F.; Mat Hashim, D.; Rahman, R.A. Application of native and phosphorylated tapioca starches in potato starch noodle. Int. J. Food Sci. Technol. 1999, 34, 275–280. [Google Scholar] [CrossRef]
- Menon, R.; Padmaja, G.; Jyothi, A.N.; Asha, V.; Sajeev, M.S. Gluten-free starch noodles from sweet potato with reduced starch digestibility and enhanced protein content. J. Food Sci. Technol. 2016, 53, 3532–3542. [Google Scholar] [CrossRef] [PubMed]
- Wang, D.; Jiang, X.; Teng, S.; Zhang, Y.; Liu, Y.; Li, X.; Li, Y. The antidiabetic and antinephritic activities of Auricularia cornea (an albino mutant strain) via modulation of oxidative stress in the db/db mice. Front. Immunol. 2019, 10, 1039. [Google Scholar] [CrossRef] [PubMed]
- Wang, J.; Liu, B.; Qi, Y.; Wu, D.; Liu, X.; Liu, C.; Min, W. Impact of Auricularia cornea var. Li polysaccharides on the physicochemical, textual, flavor, and antioxidant properties of set yogurt. Int. J. Biol. Macromol. 2022, 206, 148–158. [Google Scholar] [CrossRef] [PubMed]
- Wang, Y.; Guo, M. Purification and structural characterization of polysaccharides isolated from Auricularia cornea var. Li. Carbohydr. Polym. 2020, 230, 115680. [Google Scholar] [CrossRef] [PubMed]
- Chen, Y.; Lv, Z.; Liu, Z.; Li, X.; Li, C.; Sossah, F.L.; Li, Y. Effect of different drying temperatures on the rehydration of the fruiting bodies of Yu Muer (Auricularia cornea) and screening of browning inhibitors. Food Sci. Nutr. 2020, 8, 6037–6046. [Google Scholar] [CrossRef]
- Muszyńska, B.; Grzywacz-Kisielewska, A.; Kała, K.; Gdula-Argasińska, J. Anti-inflammatory properties of edible mushrooms: A review. Food Chem. 2018, 243, 373–381. [Google Scholar] [CrossRef]
- Wang, X.; Lan, Y.; Zhu, Y.; Li, S.; Liu, M.; Song, X.; Jia, L. Hepatoprotective effects of Auricularia cornea var. Li. polysaccharides against the alcoholic liver diseases through different metabolic pathways. Sci. Rep. 2018, 8, 7574. [Google Scholar] [CrossRef] [PubMed]
- Lee, S.-Y.; Woo, K.S.; Lim, J.K.; Kim, H.I.; Lim, S.T. Effect of processing variables on texture of sweet potato starch noodles prepared in a nonfreezing process. Cereal Chem. 2005, 82, 475. [Google Scholar] [CrossRef]
- AOAC. Official Methods of Analysis, 17th ed.; The Association of Official Analytical Chemists: Gaithersburg, MD, USA, 2000. [Google Scholar]
- Xiao, Y.; Liu, S.; Shen, M.; Jiang, L.; Ren, Y.; Luo, Y.; Xie, J. Effect of different Mesona chinensis polysaccharides on pasting, gelation, structural properties and in vitro digestibility of tapioca starch-Mesona chinensis polysaccharides gels. Food Hydrocoll. 2020, 99, 105327. [Google Scholar] [CrossRef]
- Zhu, Z.; Wang, C.; Mei, L.; Xue, W.; Sun, C.; Wang, Y.; Du, X. Effects of soy protein isolate hydrolysate on physicochemical properties and in vitro digestibility of corn starch with various amylose contents. LWT 2022, 169, 114043. [Google Scholar] [CrossRef]
- Ma, S.; Zhu, P.; Wang, M. Effects of konjac glucomannan on pasting and rheological properties of corn starch. Food Hydrocoll. 2019, 89, 234–240. [Google Scholar] [CrossRef]
- Feng, Y.Y.; Mu, T.H.; Zhang, M.; Ma, M.M. Effects of different polysaccharides and proteins on dough rheological properties, texture, structure and in vitro starch digestibility of wet sweet potato starch noodles. Int. J. Biol. Macromol. 2020, 148, 1–10. [Google Scholar] [CrossRef]
- Luo, Y.; Xiao, Y.; Shen, M.; Wen, H.; Ren, Y.; Yang, J.; Xie, J. Effect of Mesona chinensis polysaccharide on the retrogradation properties of maize and waxy maize starches during storage. Food Hydrocoll. 2020, 101, 105538. [Google Scholar] [CrossRef]
- Fu, Y.; Zhou, J.; Liu, D.; Castagnini, J.M.; Barba, F.J.; Yan, Y.; Wang, X. Effect of mulberry leaf polysaccharides on the physicochemical, rheological, microstructure properties and in vitro starch digestibility of wheat starch during the freeze-thaw cycles. Food Hydrocoll. 2023, 144, 109057. [Google Scholar] [CrossRef]
- Ye, J.; Yang, R.; Liu, C.; Luo, S.; Chen, J.; Hu, X.; Wu, J. Improvement in freeze-thaw stability of rice starch gel by inulin and its mechanism. Food Chem. 2018, 268, 324–333. [Google Scholar] [CrossRef]
- Chen, C.; Fu, W.; Chang, Q.; Zheng, B.; Zhang, Y.; Zeng, H. Moisture distribution model describes the effect of water content on the structural properties of lotus seed resistant starch. Food Chem. 2019, 286, 449–458. [Google Scholar] [CrossRef]
- Luo, Y.; Han, X.; Shen, M.; Yang, J.; Ren, Y.; Xie, J. Mesona chinensis polysaccharide on the thermal, structural and digestibility properties of waxy and normal maize starches. Food Hydrocoll. 2021, 112, 106317. [Google Scholar] [CrossRef]
- Yang, S.; Zhang, M.N.; Shan, C.S.; Chen, Z.G. Evaluation of cooking performance, structural properties, storage stability and shelf life prediction of high-moisture wet starch noodles. Food Chem. 2021, 357, 129744. [Google Scholar] [CrossRef] [PubMed]
- Shao, Z.; Han, J.; Wang, J.; Sun, Y.; Li, X.; Liang, J. Process optimization, digestibility and antioxidant activity of extruded rice with Agaricus bisporus. LWT 2021, 152, 112350. [Google Scholar] [CrossRef]
- Englyst, K.N.; Englyst, H.N.; Hudson, G.J.; Cole, T.J.; Cummings, J.H. Rapidly available glucose in foods: An in vitro measurement that reflects the glycemic response. Am. J. Clin. Nutr. 1999, 69, 448–454. [Google Scholar] [CrossRef] [PubMed]
- Guo, X.N.; Wu, S.H.; Zhu, K.X. Effect of superheated steam treatment on quality characteristics of whole wheat flour and storage stability of semi-dried whole wheat noodle. Food Chem. 2020, 322, 126738. [Google Scholar] [CrossRef] [PubMed]
- Jo, Y.; An, K.A.; Arshad, M.S.; Kwon, J.H. Effects of e-beam irradiation on amino acids, fatty acids, and volatiles of smoked duck meat during storage. Inn. Food Sci. Emer. Technol. 2018, 47, 101–109. [Google Scholar] [CrossRef]
- Li, J.; Ma, J.; Fan, S.; Mi, S.; Zhang, Y. Comparison of the nutritional and taste characteristics of 5 edible fungus powders based on the composition of hydrolyzed amino acids and free amino acids. J. Food Qual. 2022, 2022, 3618002. [Google Scholar] [CrossRef]
- FAO/WHO Protein Quality Evaluation: Report of the Joint FAO/WHO Expert Consultation; Food and Agriculture Organization of the United Nations: Rome, Italy, 1991.
- Zhang, X.; Gao, Y.; Wang, R.; Sun, Y.; Li, X.; Liang, J. Effects of Adding Blueberry Residue Powder and Extrusion Processing on Nutritional Components, Antioxidant Activity and Volatile Organic Compounds of Indica Rice Flour. Biology 2022, 11, 1817. [Google Scholar] [CrossRef] [PubMed]
- Zhou, D.N.; Zhang, B.; Chen, B.; Chen, H.Q. Effects of oligosaccharides on pasting, thermal and rheological properties of sweet potato starch. Food Chem. 2017, 230, 516–523. [Google Scholar] [CrossRef]
- Lan, X.; Wang, Y.; Deng, S.; Zhao, J.; Wang, L.; Yao, K.; Jia, D. Physicochemical and rheological properties of Tremella fuciformis polysaccharide fractions by ethanol precipitation. CYTA-J. Food. 2021, 19, 645–655. [Google Scholar] [CrossRef]
- Zhang, L.; Chen, J.; Xu, F.; Han, R.; Quan, M. Effect of Tremella fuciformis and Different Hydrocolloids on the Quality Characteristics of Wheat Noodles. Foods 2022, 11, 2617. [Google Scholar] [CrossRef] [PubMed]
- Wang, W.; Li, C.; Du, G.; Zhang, X.; Zhang, H. Characteristics and rheological properties of polysaccharide nanoparticles from edible mushrooms (Flammulina velutipes). J. Food Sci. 2017, 82, 687–693. [Google Scholar] [CrossRef] [PubMed]
- Wang, Y.; Wang, C.; Guo, M. Effects of ultrasound treatment on extraction and rheological properties of polysaccharides from Auricularia cornea var. Li. Molecules 2019, 24, 939. [Google Scholar] [CrossRef]
- Chen, L.; Tian, Y.; Tong, Q.; Zhang, Z.; Jin, Z. Effect of pullulan on the water distribution, microstructure and textural properties of rice starch gels during cold storage. Food Chem. 2017, 214, 702–709. [Google Scholar] [CrossRef] [PubMed]
- Zhou, J.; Jia, Z.; Wang, M.; Wang, Q.; Barba, F.J.; Wan, L.; Fu, Y. Effects of Laminaria japonica polysaccharides on gelatinization properties and long-term retrogradation of wheat starch. Food Hydrocoll. 2022, 133, 107908. [Google Scholar] [CrossRef]
- Sangpring, Y.; Fukuoka, M.; Ratanasumawong, S. The effect of sodium chloride on microstructure, water migration, and texture of rice noodle. LWT 2015, 64, 1107–1113. [Google Scholar] [CrossRef]
- Xiang, Z.; Ye, F.; Zhou, Y.; Wang, L.; Zhao, G. Performance and mechanism of an innovative humidity-controlled hot-air drying method for concentrated starch gels: A case of sweet potato starch noodles. Food Chem. 2018, 269, 193–201. [Google Scholar] [CrossRef] [PubMed]
- Hu, F.; Li, J.Y.; Zou, P.R.; Thakur, K.; Zhang, J.G.; Khan, M.R.; Wei, Z.J. Effects of Lycium barbarum on gluten structure, in vitro starch digestibility, and compound noodle quality. Food Biochem. 2023, 54, 102915. [Google Scholar] [CrossRef]
- Van Soest, J.J.; Tournois, H.; de Wit, D.; Vliegenthart, J.F. Short-range structure in (partially) crystalline potato starch determined with attenuated total reflectance Fourier-transform IR spectroscopy. Carbohydr. Res. 1995, 279, 201–214. [Google Scholar] [CrossRef]
- Wang, S.; Li, C.; Copeland, L.; Niu, Q.; Wang, S. Starch retrogradation: A comprehensive review. Compr. Rev. Food Sci. Food Saf. 2015, 14, 568–585. [Google Scholar] [CrossRef]
- Ambigaipalan, P.; Hoover, R.; Donner, E.; Liu, Q. Retrogradation characteristics of pulse starches. Food Res. Int. 2013, 54, 203–212. [Google Scholar] [CrossRef]
- Srikaeo, K.; Laothongsan, P.; Lerdluksamee, C. Effects of gums on physical properties, microstructure and starch digestibility of dried-natural fermented rice noodles. Int. J. Biol. Macromol. 2018, 109, 517–523. [Google Scholar] [CrossRef] [PubMed]
- GB/T 23587-2009; Vermicelli. China National Centre for Quality Supervision and Test of Agriculture Sideline Production and Wine; Standards Press of China: Beijing, China, 2009.
- Hasanzadeh, M.; Zargami, A.; Baghban, H.N.; Mokhtarzadeh, A.; Shadjou, N.; Mahboob, S. Aptamer-based assay for monitoring genetic disorder phenylketonuria (PKU). Int. J. Biol. Macromol. 2018, 116, 735–743. [Google Scholar] [CrossRef] [PubMed]
- Burlina, A.P.; Cazzorla, C.; Massa, P.; Polo, G.; Loro, C.; Gueraldi, D.; Burlina, A.B. Large neutral amino acid therapy increases tyrosine levels in adult patients with phenylketonuria: A long-term study. Nutrients 2019, 11, 2541. [Google Scholar] [CrossRef]
- Srimarut, Y.; Phanphuet, A.; Trithavisup, T.; Rattanawongsa, W.; Saenmuangchin, R.; Klamchuen, A.; Malila, Y. Estimating In Vitro Protein Digestion and Protein Digestibility Corrected Amino Acid Score of Chicken Breasts Affected by White Striping and Wooden Breast Abnormalities. Foods 2024, 13, 159. [Google Scholar] [CrossRef] [PubMed]
- Liu, N.; Shen, S.; Huang, L.; Deng, G.; Wei, Y.; Ning, J.; Wang, Y. Revelation of volatile contributions in green teas with different aroma types by GC–MS and GC–IMS. Food Res. Int. 2023, 169, 112845. [Google Scholar] [CrossRef] [PubMed]
- Yang, Y.; Qian, M.C.; Deng, Y.; Yuan, H.; Jiang, Y. Insight into aroma dynamic changes during the whole manufacturing process of chestnut-like aroma green tea by combining GC-E-Nose, GC-IMS, and GC× GC-TOFMS. Food Chem. 2022, 387, 132813. [Google Scholar] [CrossRef] [PubMed]
- Hou, G.G.; Saini, R.; Ng, P.K. Relationship between physicochemical properties of wheat flour, wheat protein composition, and textural properties of cooked Chinese white salted noodles. Cereal Chem. 2013, 90, 419–429. [Google Scholar] [CrossRef]
- Zhang, Q.; Jin, M.; An, D.; Ahmed, Z.; Qi, Y.; Xu, B. Modelling dried noodle quality: Contribution of starch and protein physicochemical properties of 32 wheat cultivars. Food Res. Int. 2023, 174, 113501. [Google Scholar] [CrossRef]


| Samples | Control Group | Experimental Group |
|---|---|---|
| Total starch (%) | 84.09 ± 0.81 a | 68.87 ± 0.37 b |
| Protein (%) | 0.94 ± 0.004 a | 0.92 ± 0.02 a |
| Ash (%) | 0.71 ± 0.007 b | 0.78 ± 0.02 a |
| Fats (%) | 0.15 ± 0.004 a | 0.15 ± 0.003 a |
| Soluble dietary fiber (%) | 0.52 ± 0.03 b | 0.88 ± 0.03 a |
| Insoluble dietary fiber (%) | 5.05 ± 0.17 b | 6.89 ± 0.16 a |
| Reducing sugar (%) | 0.27 ± 0.002 b | 4.01 ± 0.06 a |
| Samples | Control Group | Experimental Group |
|---|---|---|
| PV (cP) | 2893 ± 50.51 a | 3093 ± 126.51 a |
| TV (cP) | 2138 ± 49.01 b | 2296 ± 60.01 a |
| FV (cP) | 3202 ± 83.76 a | 3489 ± 147.63 a |
| BD (cP) | 755 ± 1.53 b | 797 ± 66.94 a |
| SB (cP) | 1063 ± 34.93 a | 1193 ± 89.27 a |
| PT (min) | 5.14 ± 0.04 a | 5.20 ± 0.07 a |
| GT (°C) | 75.80 ± 0.00 a | 76.40 ± 0.52 a |
| Samples | Hardness (g) | Springiness | Cohesiveness | Gumminess |
|---|---|---|---|---|
| CG-1d | 223.39 ± 5.29 c | 0.55 ± 0.02 b | 0.72 ± 0.02 b | 151.70 ± 5.04 b |
| CG-3d | 308.77 ± 45.20 a | 0.72 ± 0.13 a | 0.39 ± 0.05 c | 121.56 ± 28.54 b |
| CG-7d | 288.00 ± 3.35 ab | 0.47 ± 0.02 b | 0.82 ± 0.08 ab | 235.98 ± 25.83 a |
| CG-14d | 249.34 ± 25.16 bc | 0.37 ± 0.01 c | 0.83 ± 0.02 a | 206.16 ± 18.18 a |
| EG-1d | 246.60 ± 3.83 b | 0.44 ± 0.02 b | 0.77 ± 0.01 b | 188.84 ± 2.52 b |
| EG-3d | 369.72 ± 71.69 a | 0.59 ± 0.02 a | 0.77 ± 0.03 b | 284.14 ± 50.18 a |
| EG-7d | 267.65 ± 12.32 b | 0.43 ± 0.03 b | 0.83 ± 0.01 a | 222.51 ± 13.81 b |
| EG-14d | 239.12 ± 11.90 b | 0.41 ± 0.01 c | 0.83 ± 0.04 a | 198.01 ± 18.61 b |
| Syneresis (%) | Control Group | Experimental Group |
|---|---|---|
| FTC-1 | 17.14 ± 0.90 e | 21.72 ± 0.48 e |
| FTC-2 | 28.14 ± 1.51 d | 29.00 ± 0.29 d |
| FTC-3 | 36.40 ± 0.50 c | 32.79 ± 1.20 c |
| FTC-4 | 39.60 ± 1.50 b | 36.32 ± 1.44 b |
| FTC-5 | 42.13 ± 1.60 b | 38.33 ± 1.29 a |
| FTC-6 | 45.71 ± 1.68 a | 38.65 ± 1.09 a |
| FTC-7 | 41.62 ± 1.62 b | 39.79 ± 0.96 a |
| Samples | Control Group | Experimental Group |
|---|---|---|
| T21 (ms) | 0.93 | 0.81 |
| P21 (%) | 99.493 | 98.845 |
| T22 (ms) | 93.31 | 16.52 |
| P22 (%) | 0.484 | 1.057 |
| T23 (ms) | 982.84 | 443.22 |
| P23 (%) | 0.023 | 0.098 |
| Samples | Control Group | Experimental Group |
|---|---|---|
| 1047 cm−1 | 85.80 | 75.28 |
| 1022 cm−1 | 85.31 | 73.75 |
| IR ratio 1047/1022 cm−1 | 1.01 | 1.02 |
| Syneresis (%) | Control Group | Experimental Group |
|---|---|---|
| RDS (%) | 26.46 ± 0.6 a | 21.68 ± 0.49 b |
| SDS (%) | 50.4 ± 1.69 a | 51.74 ± 1.9 a |
| RS (%) | 23.14 ± 1.18 b | 26.58 ± 1.64 a |
| C∞ (%) | 97.73 ± 0.51 a | 94.71 ± 1.03 b |
| k (min−1) | 0.0128 ± 0.0003 a | 0.0123 ± 0.0008 a |
| Samples | Control Group | Experimental Group |
|---|---|---|
| BR (%) | 26.67 ± 2.89 b | 38.33 ± 2.89 a |
| CL (%) | 7.55 ± 0.47 a | 8.15 ± 1.01 a |
| SI (%) | 475.71 ± 6.84 b | 514.18 ± 15.14 a |
| DMC (g/100g) | 0.90 ± 0.003 a | 0.88 ± 0.001 b |
| L* | 37.27 ± 0.34 a | 27.1 ± 1.07 b |
| a* | 0.17 ± 0.02 b | 0.30 ± 0.04 a |
| b* | 0.22 ± 0.02 b | 1.05 ± 0.02 a |
| Amino Acids (mg/g) | Control Group | Experimental Group |
|---|---|---|
| EAA | ||
| Lysine (Lys) | ND | ND |
| Phenylalanine (Phe) | ND | 8.89 |
| Methionine (Met) | 1.39 | 3.20 |
| Threonine (Thr) | 6.62 | 19.80 |
| Isoleucine (Ile) | 6.83 | 9.95 |
| Leucine (Leu) | 8.40 | 31.96 |
| Valine (Val) | 27.39 | 36.59 |
| Tryptophan (Trp) | ND | ND |
| Total | 50.62 | 110.39 |
| NEAA | ||
| Glycine (Gly) | 13.37 | 29.33 |
| Alanine (Ala) | 8.30 | 34.82 |
| Tyrosine (Tyr) | 0.79 | 4.98 |
| Serine (Ser) | 6.29 | 25.00 |
| Cysteine (Cys) | ND | ND |
| Aspartic acid (Asp) | 16.52 | 48.47 |
| Glutamic acid (Glu) | 17.33 | 52.26 |
| Arginine (Arg) | 6.01 | 21.07 |
| Histidine (His) | 2.42 | 9.42 |
| Proline (Pro) | ND | 14.16 |
| Total | 71.03 | 239.53 |
| TAA | 121.66 | 349.91 |
| Amino Acids | Reference a (mg/g Food Protein) | Control Group | Experimental Group |
|---|---|---|---|
| Pre-schoolchildren (2–5 years old) | |||
| Histidine (His) | 19 | 0.13 | 0.50 |
| Isoleucine (Ile) | 28 | 0.24 | 0.36 |
| Leucine (Leu) | 66 | 0.13 | 0.48 |
| Lysine (Lys) | 58 | ND | ND |
| Methionine (Met) + cysteine (Cys) | 25 | 0.06 | 0.13 |
| Phenylalanine (Phe) + tyrosine (Tyr) | 63 | 0.01 | 0.22 |
| Threonine (Thr) | 34 | 0.19 | 0.58 |
| Valine (Val) | 35 | 0.78 | 1.05 |
| Schoolchildren (10–12 years old) | |||
| Histidine (His) | 19 | 0.13 | 0.50 |
| Isoleucine (Ile) | 28 | 0.24 | 0.36 |
| Leucine (Leu) | 44 | 0.19 | 0.73 |
| Lysine (Lys) | 44 | ND | ND |
| Methionine (Met) + cysteine (Cys) | 22 | 0.06 | 0.15 |
| Phenylalanine (Phe) + tyrosine (Tyr) | 22 | 0.04 | 0.63 |
| Threonine (Thr) | 28 | 0.24 | 0.71 |
| Valine (Val) | 25 | 1.10 | 1.46 |
| Adults (>18 years old) | |||
| Histidine (His) | 16 | 0.15 | 0.59 |
| Isoleucine (Ile) | 13 | 0.53 | 0.77 |
| Leucine (Leu) | 19 | 0.44 | 1.68 |
| Lysine (Lys) | 16 | ND | ND |
| Methionine (Met) + cysteine (Cys) | 17 | 0.08 | 0.19 |
| Phenylalanine (Phe) + tyrosine (Tyr) | 19 | 0.04 | 0.73 |
| Threonine (Thr) | 9 | 0.74 | 2.20 |
| Valine (Val) | 13 | 2.11 | 2.81 |
| Category | No. | Compounds | GAS | Formula | MW | RI a | Rt b | Dt c | Comment |
|---|---|---|---|---|---|---|---|---|---|
| Alcohols | |||||||||
| 1 | 1-Butanol | C71363 | C4H10O | 74.1 | 1153.3 | 422.751 | 1.1828 | Monomer | |
| 2 | 1-Butanol | C71363 | C4H10O | 74.1 | 1153.3 | 422.751 | 1.3871 | Dimer | |
| 3 | Ethanol | C64175 | C2H6O | 46.1 | 945.4 | 271.931 | 1.135 | ||
| 4 | Pentanol | C71410 | C5H12O | 88.1 | 1260.9 | 563.347 | 1.2594 | ||
| 5 | 1-Propanol | C71238 | C3H8O | 60.1 | 1046.6 | 330.38 | 1.1111 | Monomer | |
| 6 | 1-Propanol | C71238 | C3H8O | 60.1 | 1046.6 | 330.38 | 1.2547 | Dimer | |
| 7 | 2-Propanol | C67630 | C3H8O | 60.1 | 928.4 | 263.693 | 1.0924 | Monomer | |
| 8 | 2-Propanol | C67630 | C3H8O | 60.1 | 927.8 | 263.444 | 1.2188 | Dimer | |
| 9 | 2-Butanol | C78922 | C4H10O | 74.1 | 1047.1 | 330.749 | 1.1521 | Monomer | |
| 10 | 2-Butanol | C78922 | C4H10O | 74.1 | 1047.1 | 330.749 | 1.3182 | Dimer | |
| 11 | 2-Methyl-1-propanol | C78831 | C4H10O | 74.1 | 1046.5 | 330.348 | 1.3831 | ||
| Aldehyde | |||||||||
| 12 | Hexanal | C66251 | C6H12O | 100.2 | 1098.3 | 367.534 | 1.2655 | Monomer | |
| 13 | Hexanal | C66251 | C6H12O | 100.2 | 1099.7 | 368.822 | 1.5635 | Dimer | |
| 14 | Pentanal | C110623 | C5H10O | 86.1 | 992.1 | 295.78 | 1.1939 | Monomer | |
| 15 | Pentanal | C110623 | C5H10O | 86.1 | 991.3 | 295.333 | 1.421 | Dimer | |
| 16 | 2-Methylpentanal | C123159 | C6H12O | 100.2 | 767.8 | 197.452 | 1.2277 | ||
| 17 | Propanal | C123386 | C3H6O | 58.1 | 833.5 | 222.289 | 1.0706 | Monomer | |
| 18 | Propanal | C123386 | C3H6O | 58.1 | 832.4 | 221.851 | 1.1443 | Dimer | |
| 19 | (E)-2-Pentenal | C1576870 | C5H8O | 84.1 | 1140.6 | 409.273 | 1.1189 | Monomer | |
| 20 | (E)-2-Pentenal | C1576870 | C5H8O | 84.1 | 1143 | 411.809 | 1.3617 | Dimer | |
| 21 | (E)-2-Heptenal | C18829555 | C7H12O | 112.2 | 1329.3 | 688.717 | 1.2568 | ||
| 22 | (E)-2-Hexenal | C6728263 | C6H10O | 98.1 | 1227.1 | 513.589 | 1.1835 | ||
| 23 | Ethane, 1,1-diethoxy- | C105577 | C6H14O2 | 118.2 | 891 | 246.523 | 1.1283 | ||
| 24 | Butyraldehyde | C123728 | C4H8O | 72.1 | 906.5 | 253.49 | 1.096 | Monomer | |
| 25 | Butyraldehyde | C123728 | C4H8O | 72.1 | 911.3 | 255.73 | 1.2884 | Dimer | |
| 26 | 2-Methyl-2-pentenal | C623369 | C6H10O | 98.1 | 1143.6 | 412.414 | 1.5154 | ||
| 27 | N-heptanal | C111717 | C7H14O | 114.2 | 1140.3 | 408.958 | 1.3215 | Monomer | |
| 28 | Heptanal | C111717 | C7H14O | 114.2 | 1144.7 | 413.578 | 1.6802 | Dimer | |
| 29 | (E)-2-Pentenal | C1576870 | C5H8O | 84.1 | 1099 | 368.147 | 1.366 | ||
| Esters | |||||||||
| 30 | Ethyl lactate | C97643 | C5H10O3 | 118.1 | 1355.4 | 747.429 | 1.1421 | Monomer | |
| 31 | Ethyl lactate | C97643 | C5H10O3 | 118.1 | 1355.4 | 747.429 | 1.5427 | Dimer | |
| 32 | Ethyl hexanoate | C123660 | C8H16O2 | 144.2 | 1243.7 | 537.384 | 1.3441 | Monomer | |
| 33 | Ethyl hexanoate | C123660 | C8H16O2 | 144.2 | 1242 | 534.913 | 1.8007 | Dimer | |
| 34 | Butyl acetate | C123864 | C6H12O2 | 116.2 | 1086.1 | 358.245 | 1.2371 | Monomer | |
| 35 | Butyl acetate | C123864 | C6H12O2 | 116.2 | 1086.1 | 358.245 | 1.6172 | Dimer | |
| 36 | Ethyl Acetate | C141786 | C4H8O2 | 88.1 | 893.8 | 247.767 | 1.0967 | Monomer | |
| 37 | Ethyl Acetate | C141786 | C4H8O2 | 88.1 | 900.4 | 250.753 | 1.3373 | Dimer | |
| 38 | Isobutyl acetate | C110190 | C6H12O2 | 116.2 | 1027.7 | 317.846 | 1.2417 | ||
| 39 | Methyl 2-methylbutanoate | C868575 | C6H12O2 | 116.2 | 1003 | 302.141 | 1.1832 | ||
| 40 | Ethyl butyrate | C105544 | C6H12O2 | 116.2 | 1046.5 | 330.348 | 1.1995 | Monomer | |
| 41 | Ethyl butanoate | C105544 | C6H12O2 | 116.2 | 1046.5 | 330.348 | 1.5592 | Dimer | |
| 42 | Butyl butanoate | C109217 | C8H16O2 | 144.2 | 1195.4 | 470.759 | 1.337 | ||
| 43 | (E)-2-Pentenal | C1576870 | C5H8O | 84.1 | 1099 | 368.147 | 1.366 | ||
| Ketones | |||||||||
| 44 | 4-Methyl-2-pentanone | C108101 | C6H12O | 100.2 | 1022.1 | 314.223 | 1.1795 | ||
| 45 | Acetone | C67641 | C3H6O | 58.1 | 850.8 | 229.302 | 1.115 | ||
| 46 | 2-Butanone | C78933 | C4H8O | 72.1 | 912.5 | 256.26 | 1.0602 | Monomer | |
| 47 | 2-Butanone | C78933 | C4H8O | 72.1 | 913 | 256.479 | 1.2453 | Dimer | |
| Acids | |||||||||
| 48 | Acetic acid | C64197 | C2H4O2 | 60.1 | 1483.1 | 1115.625 | 1.0557 | Monomer | |
| 49 | Acetic acid | C64197 | C2H4O2 | 60.1 | 1482.4 | 1113.194 | 1.1562 | Dimer | |
| Heterocycles | |||||||||
| 50 | 2-Ethylfuran | C3208160 | C6H8O | 96.1 | 990.4 | 294.886 | 1.2953 | ||
| 51 | Tetrahydrofuran | C109999 | C4H8O | 72.1 | 869.9 | 237.316 | 1.0594 |
Disclaimer/Publisher’s Note: The statements, opinions and data contained in all publications are solely those of the individual author(s) and contributor(s) and not of MDPI and/or the editor(s). MDPI and/or the editor(s) disclaim responsibility for any injury to people or property resulting from any ideas, methods, instructions or products referred to in the content. |
© 2024 by the authors. Licensee MDPI, Basel, Switzerland. This article is an open access article distributed under the terms and conditions of the Creative Commons Attribution (CC BY) license (https://creativecommons.org/licenses/by/4.0/).
Share and Cite
Gao, Y.; Zhang, X.; Wang, R.; Sun, Y.; Li, X.; Liang, J. Physicochemical, Quality and Flavor Characteristics of Starch Noodles with Auricularia cornea var. Li. Powder. Foods 2024, 13, 1185. https://doi.org/10.3390/foods13081185
Gao Y, Zhang X, Wang R, Sun Y, Li X, Liang J. Physicochemical, Quality and Flavor Characteristics of Starch Noodles with Auricularia cornea var. Li. Powder. Foods. 2024; 13(8):1185. https://doi.org/10.3390/foods13081185
Chicago/Turabian StyleGao, Yang, Xinzhen Zhang, Ran Wang, Yue Sun, Xueling Li, and Jin Liang. 2024. "Physicochemical, Quality and Flavor Characteristics of Starch Noodles with Auricularia cornea var. Li. Powder" Foods 13, no. 8: 1185. https://doi.org/10.3390/foods13081185