Article

Near-Infrared Spectroscopy Machine-Learning Spectral Analysis Tool for Blueberries (Vaccinium corymbosum) Cultivar Discrimination

CBQF—Centro de Biotecnologia e Química Fina—Laboratório Associado, Escola Superior de Biotecnologia, Universidade Católica Portuguesa, Rua de Diogo Botelho 1327, 4169-005 Porto, Portugal
*
Author to whom correspondence should be addressed.
Foods 2025, 14(8), 1428; https://doi.org/10.3390/foods14081428
Submission received: 17 March 2025 / Revised: 12 April 2025 / Accepted: 16 April 2025 / Published: 21 April 2025
(This article belongs to the Section Food Analytical Methods)

Abstract

:
Vaccinium corymbosum is one of the main sources of commercialized blueberries across the world. This species has a large number of distinct cultivars, leading to significantly different berries characteristics such as size, sweetness, production rate, and growing season. In this context, accurate cultivar discrimination is of significant relevance, and currently, it is mostly performed through berries examination. In this work, we developed a method to discriminate 19 cultivars from the V. corymbosum species through their leaves’ near-infrared spectra. Spectra were acquired from fresh blueberry leaves collected from two geographic regions and across three seasons. Machine-learning-based models, selected from a pool of 10 classifiers based on their discrimination power under a twofold stratified cross-validation process, were trained/tested with 1 to 20 components obtained by the application of data dimensionality reduction (DDR) techniques (dictionary learning, factor analysis, fast individual component analysis, and principal component analysis) to different near-infrared (NIR) spectra regions’ data, to either analyze a single spectral region and season or combine spectral regions and/or seasons for each side of the blueberry leaf. The percentage of correct cultivar discrimination ranged from 52.27 to 100%, with the best spectral results obtained with the adaxial side of the leaves in the fall (100% A c c u r a c y ) and the abaxial side of the leaves in the winter (100% A c c u r a c y ); the fast ICA DDR technique was present in 83.33% of the best analyses (five out of six); and the LinearSVC was present in 66.67% (four out six best analyses). The results obtained in this work denote that near-infrared spectroscopy is a suitable and accurate technique for V. corymbosum cultivar discrimination.

1. Introduction

The Vaccinium genus from the Ericaceae family encompasses about 450 species, widespread mostly in the Northern Hemisphere [1,2,3]. Some of its species are of particular relevance due to their highly appreciated small berries. V. corymbosum, one of the main sources of commercialized blueberries, is among them. This species encompasses a high number of cultivars possessing different characteristics such as production rates and growing seasons, fruit sweetness, and size, and requires distinct edaphoclimatic conditions for their optimum development (such as temperature, soil pH, and daylight hours), among others. Therefore, accurate discrimination of such cultivars is of the utmost relevance either in agricultural practices or in the food industry. Currently, blueberry cultivar identification is mostly performed by farmers based on visual inspection of the phenotypic characteristics of the berries [4]. However, due to their high similarity, there is a high rate of misidentification. Indeed, to the best of our knowledge, only two attempts for blueberry cultivar identification have been performed: one based on germplasm characterization [5], and the other on EST-PCR markers [6]. Despite presenting a high potential for subspecies identification, these techniques are expensive and time-consuming. Therefore, it is important to find reliable and cost-effective alternative techniques. Spectroscopic-based techniques, due to their advantages of low cost, speed, absence of sample preparation, real-time results, and reagent-free operation, could be an interesting alternative and are gathering strong acceptance in the typing context, mainly at the genus and species levels [7,8,9,10]. However, the infra-species level has been barely explored, particularly in plants with only a few works published [11,12,13,14,15,16,17]. Among these, Kim S. et al. [11] demonstrated that Fourier-transform infrared (FT-IR) spectroscopy combined with multivariate analysis allows rapid and effective discrimination between commercial strawberry cultivars based on their metabolic profiles. Similarly, a 2012 study [12] showed that Fourier-transform mid-infrared (FT-MIR) spectroscopy and chemometric analysis could effectively distinguish five Tunisian olive cultivars using the chemical composition of their leaves. Moura L. et al. [13], in 2015, used spectral reflectance analysis with nonlinear regression and principal component analysis to automatically classify different lettuce cultivars. That same year, Li X. et al. [14] demonstrated that near-infrared (NIR) spectroscopy combined with pattern recognition methods such as backpropagation neural network (BPNN) and least-squares support vector machines (LS-SVMs) effectively identified various Pummelo cultivars. More recently, Kasampalis D. et al. [15] used visible/near-infrared (Vis/NIR) spectral reflectance data from potato tuber skin to assess postharvest freshness and distinguish between cultivars. Yilmaz-Düezyaman H. et al. [17] showed that NIRS can predict oxidative stability and differentiate extra virgin olive oil cultivars, while Difante G. et al. [16] applied NIR spectroscopy combined with machine-learning (ML) models to differentiate Panicum maximum cultivars based on leaf spectral reflectance. Despite previous studies, further research is necessary as NIR spectroscopy has not yet been applied to the identification of V. corymbosum cultivars.
The present study explores the potential of NIR spectroscopy combined with ML tools to discriminate 19 cultivars of V. corymbosum based on the infrared spectra of their fresh leaves (adaxial and abaxial sides). For that, the spectra were collected from two geographic regions across three different seasons, and a pool of 10 ML-based approaches are evaluated for discriminating V. corymbosum blueberry cultivars using NIR spectra across different seasons and leaf sides (abaxial and adaxial). Thus, the classifiers are fed with NIR data selected from the ANOVA F-value method (p < 0.05) and reduced to 1 to 20 components using four data dimensionality reduction (DDR) techniques: dictionary learning (DL), factor analysis (FA), fast independent component analysis (fast ICA), and principal component analysis (PCA). It should be noted that we discarded at the beginning the possibility of using deep-learning models instead of ML models, as they often require large amounts of labeled data and significant computational resources, and they can be seen as “black boxes”, making it difficult to interpret the results and understand the underlying decision-making process.

2. Materials and Methods

2.1. Vaccinium Cultivar Leaves

Different numbers of adult leaves of V. corymbosum belonging to 19 distinct cultivars, fully healthy, 3.7 to 7.2 cm long and 1.1 to 2.6 cm wide, and exposed to sunlight, were collected in 2 distinct regions in the north of Portugal during 3 seasons of 2017:
  • Spring: 44 plants—44 leaves, 1 per plant;
  • Fall: 22 plants—22 leaves, 1 per plant;
  • Winter: 32 plants—32 leaves, 1 per plant.
Leaves from Region 1 (R1) were collected in three seasons: spring, fall, and winter, while leaves from the second region (R2) were collected only in spring. Details about the samples are presented in Table 1. Eng. Paulo Lúcio Gomes, an expert on the area from Bagas de Portugal (https://www.bagasdeportugal.pt/, accessed on 11 April 2025), identified the species.

2.2. Infrared Spectra Acquisition

NIR spectra were acquired from fresh leaves. Spectra were collected from two distinct leaves per plant on both the adaxial and abaxial surfaces, in two separate spots. A total of eight spectra per plant (2 × 2 × 2) were obtained, avoiding rib leaves. The NIR spectra were acquired using a Fourier-transform near-infrared spectrometer (FTLA 2000, ABB, Québec, QC, Canada) equipped with an indium–gallium–arsenide (InGaAs) detector in diffuse reflectance mode. Each spectrum was the result of an average of 64 scans with a resolution of 8 cm−1, within the wavenumber interval of 10,000 to 4000 cm−1. Bomen-Grams software (version 7, ABB, Québec, QC, Canada) was used to control the equipment.

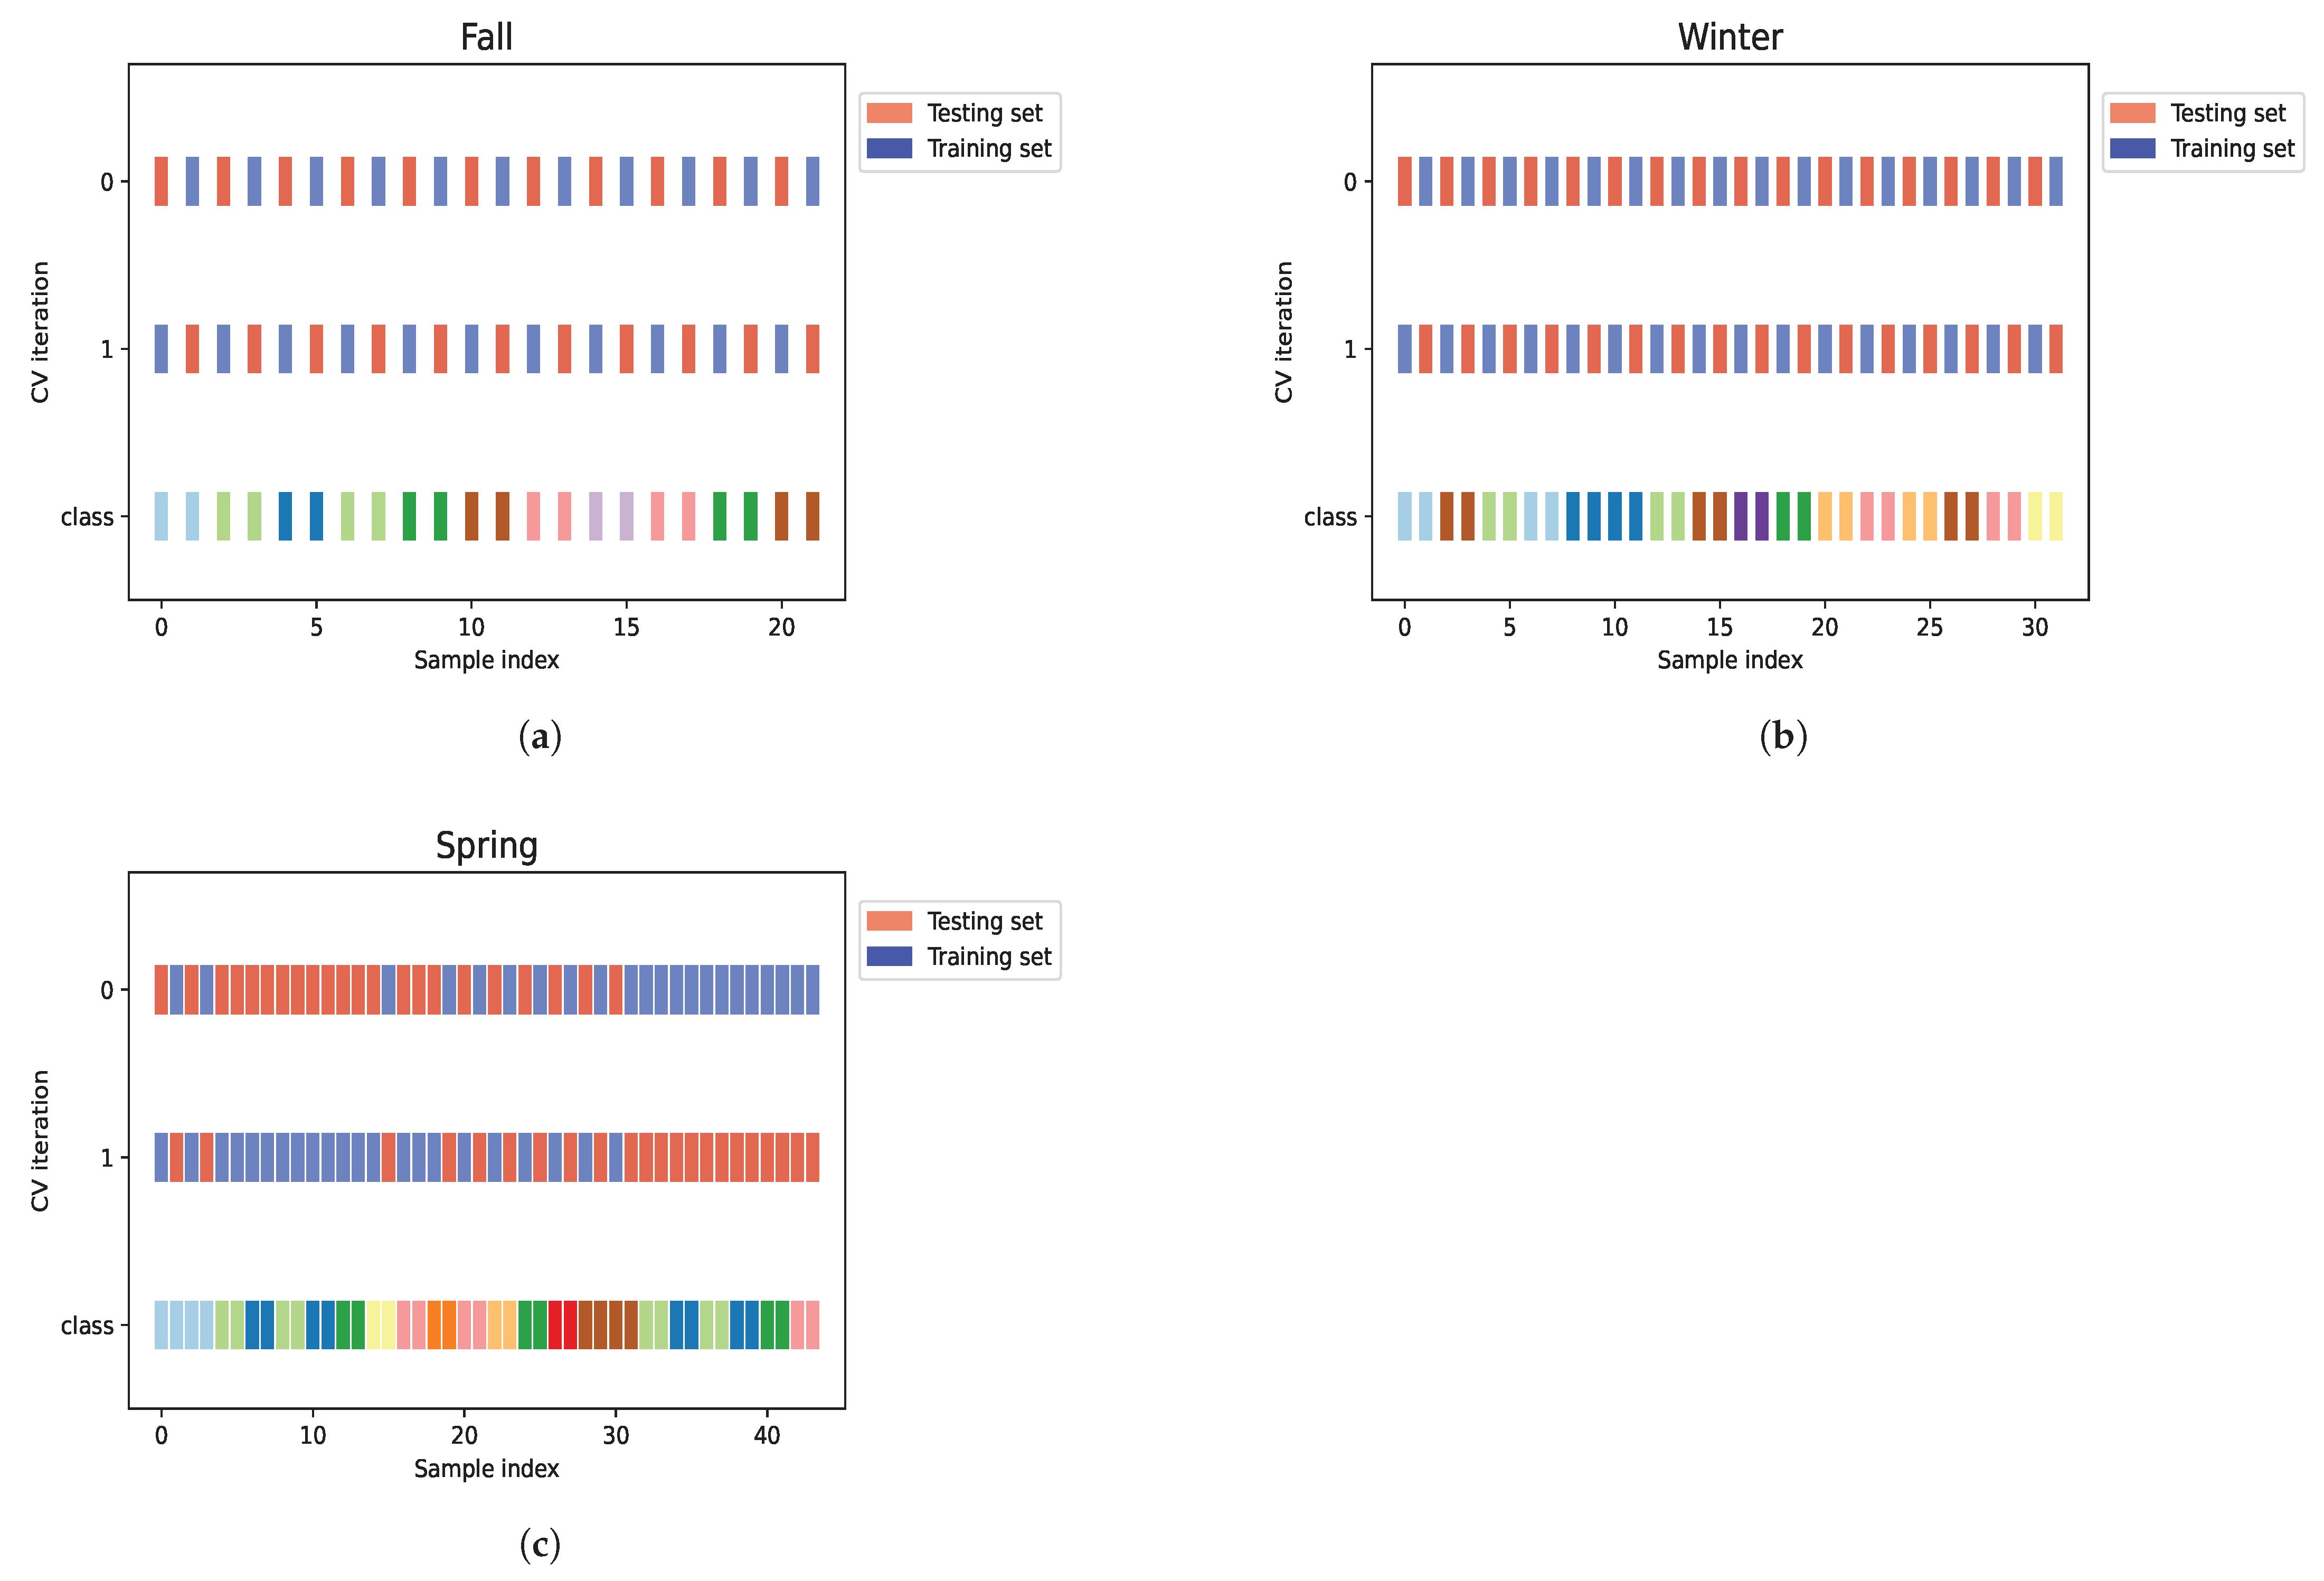
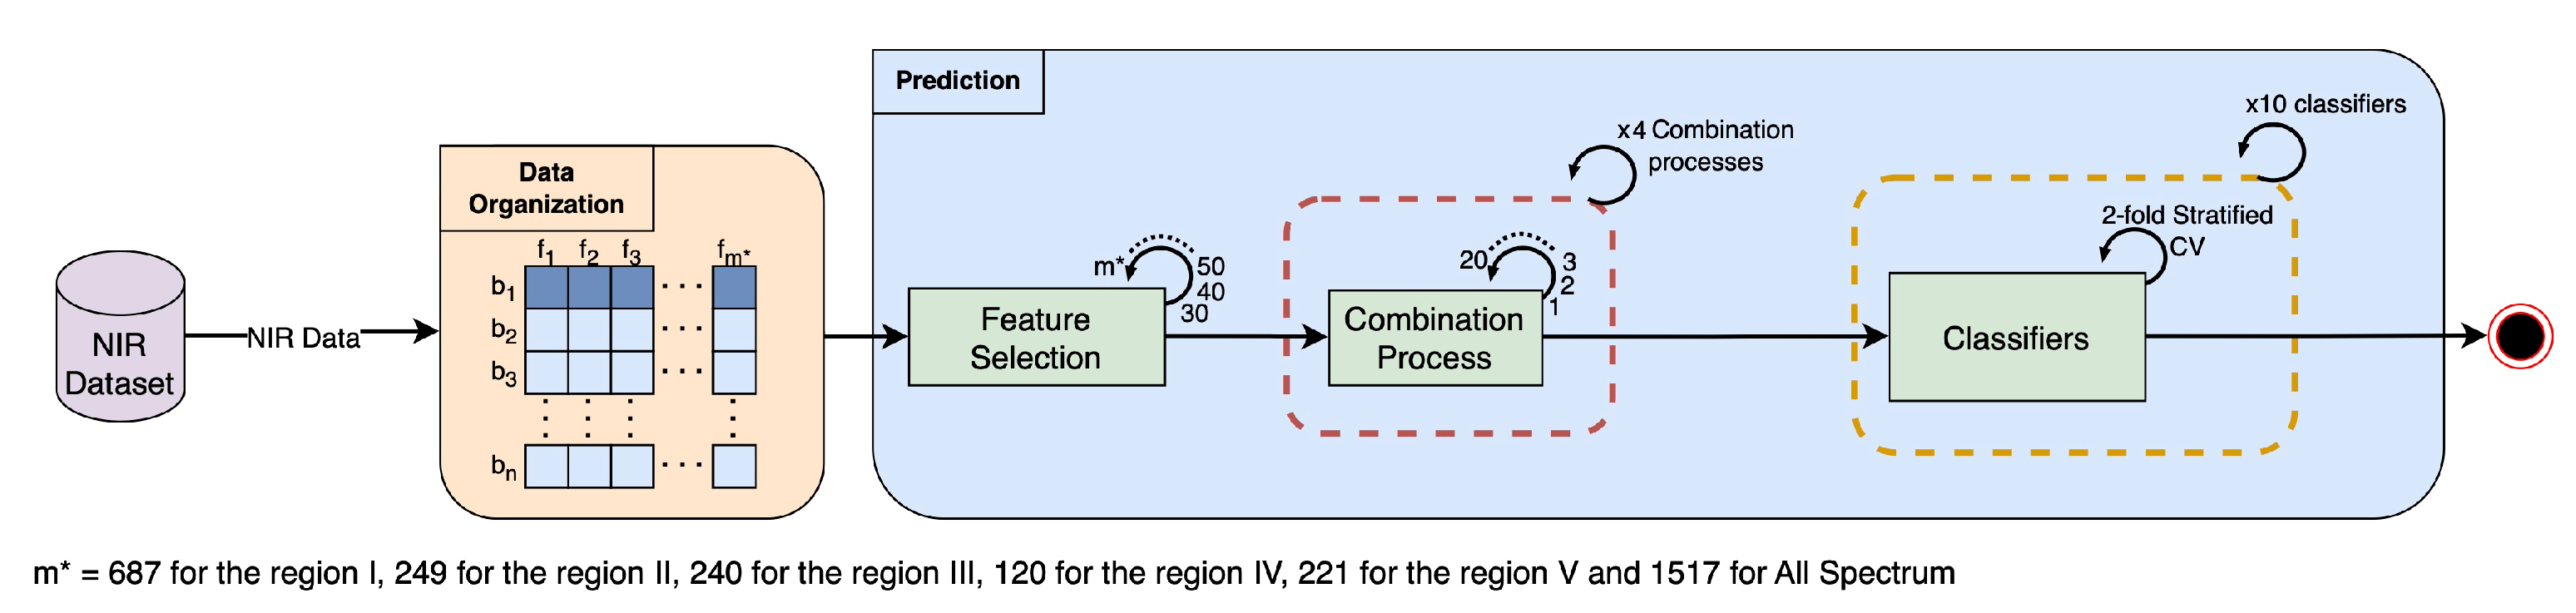
2.3. Data Analysis and Prediction

The infrared spectra were imported into Python (version 3.9.21, developed by the Python Software Foundation, Wilmington, DE, USA) and adjusted by applying the z-score normalization method. Five different regions (Region I: 9920–7275 cm−1; Region II: 7274–6314 cm−1, Region III: 6313–5390 cm−1, Region IV: 5389–4924 cm−1, and Region V: 4923–4073 cm−1) and the whole NIR spectra were evaluated to find information for maximizing the performance of ML models and to check if there is a region that provides better information for discrimination. For that, in those regions and in the whole spectrum, the ANOVA F-value method was applied for feature selection (p < 0.05) to select frequency bins ranging from 30 to the maximum bins available per region of analysis (687 for Region I, 249 for Region II, 240 for Region III, 120 for Region IV, 221 for Region V, and 1517 for whole spectra), with increments of 10 bins, in an iterative process. After that, the models were trained and tested with varying numbers of components using four DDR: DL, FA, fast ICA, and PCA, ranging from 1 to 20, with the rest of the hyperparameters being set to default, to guarantee that the discrimination power to classify the V. corymbosum species was optimized. In addition to that, 10 pre-designed scikit-learn ML models were used for the classification task. Table 2 shows the classifiers used and their configuration. The choice of the best model considered their discrimination power using a 2-fold stratified cross-validation process (see Figure 1) to ensure the same proportion of class labels per fold and to maximize the performance of the model [18]. To validate the performance of each model, the classification report with values of A c c u r a c y , P r e c i s i o n , R e c a l l , F1-score, and area under the receiver operating characteristic (ROC) curve ( A U C ) was obtained.
The Accuracy was calculated using the equation below and represents the proportion of correctly classified classes relative to all cases [19]:
A c c u r a c y = T P + T N T P + T N + F P + F N × 100 %
where T P , T N , F P , and F N correspond to true positives, true negatives, false positives, and false negatives, respectively [20].
Precision represents the ratio of correctly classified positive cases to the total cases predicted as positive [21]:
P r e c i s i o n = T P T P + F P × 100 %
Recall represents the ratio of correctly predicted positive cases to the total number of actual positive cases [21]:
R e c a l l = T P T P + F N × 100 %
The F1-score is the harmonic mean of Recall and Precision [22]:
F 1 Score = 2 × P r e c i s i o n × R e c a l l P r e c i s i o n + R e c a l l × 100 %
AUC evaluates the model’s capability to distinguish between positive and negative classes by analyzing true positive ( T P ) and false positive ( F P ) rates across different thresholds. AUC values range from 0 to 1, where 1 represents a perfect classifier, and 0.5 indicates random classification [23].
A summary of the data analysis and prediction methodology is illustrated in Figure 2.

3. Results

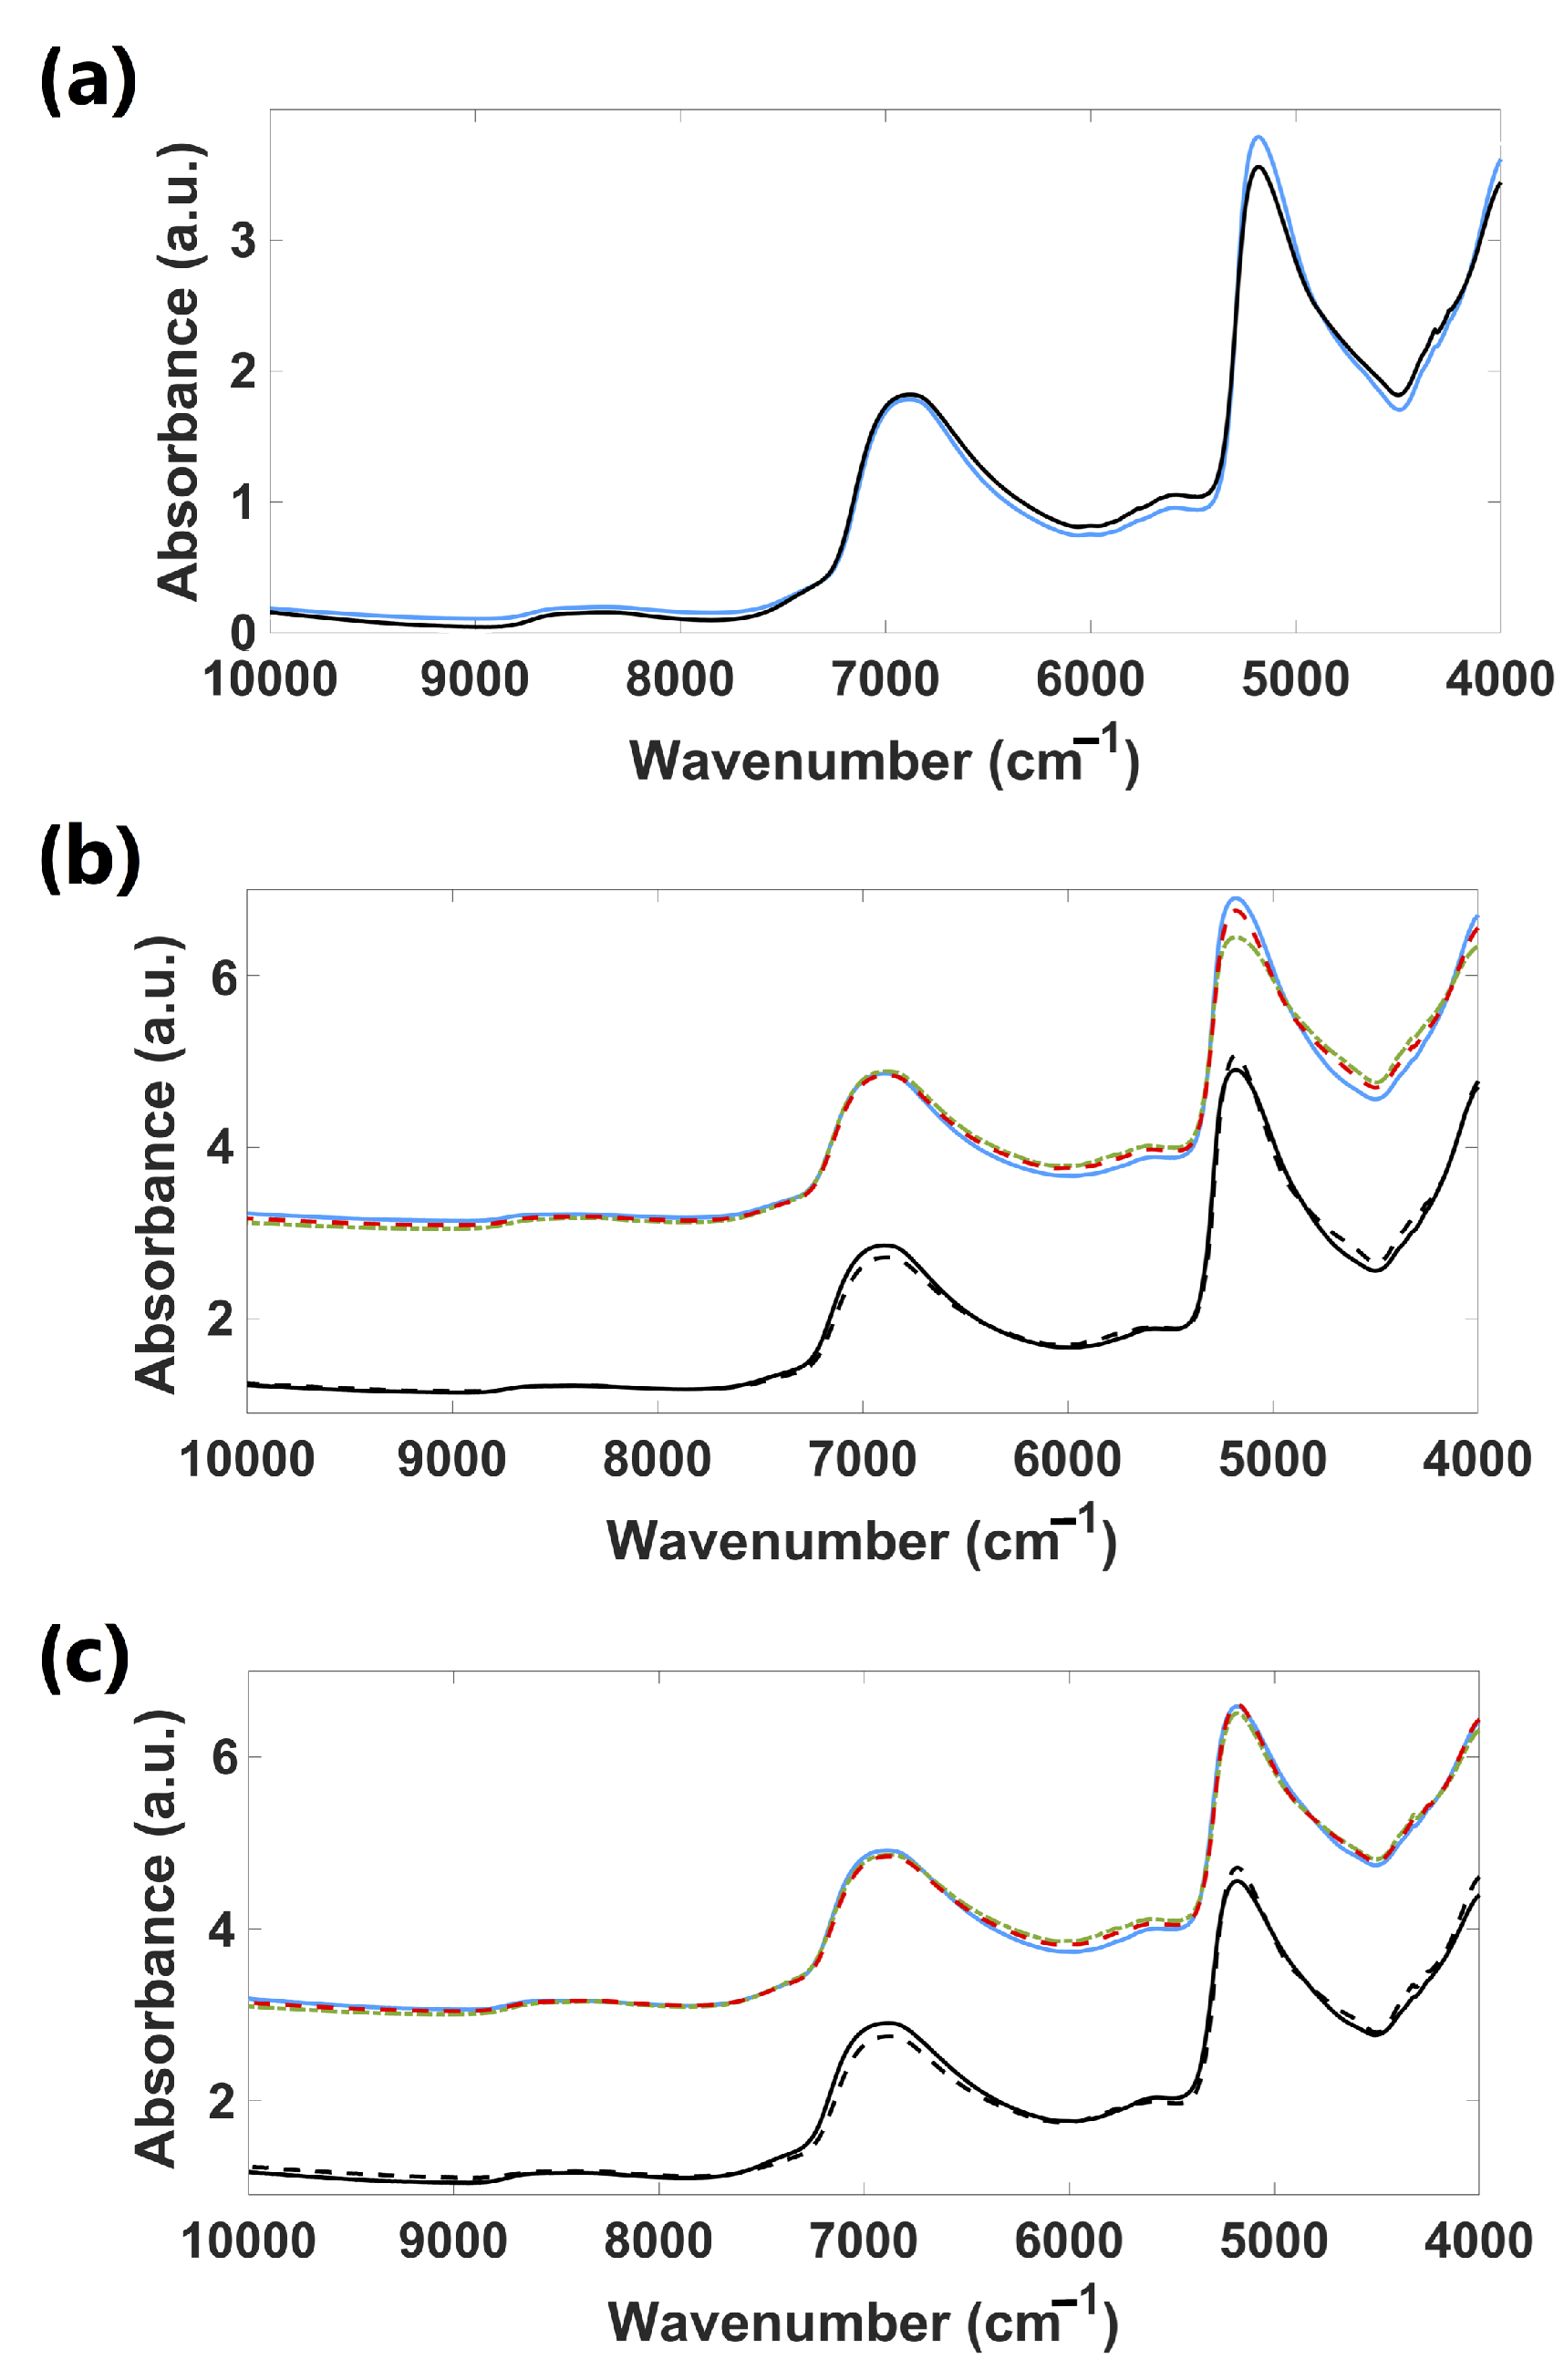
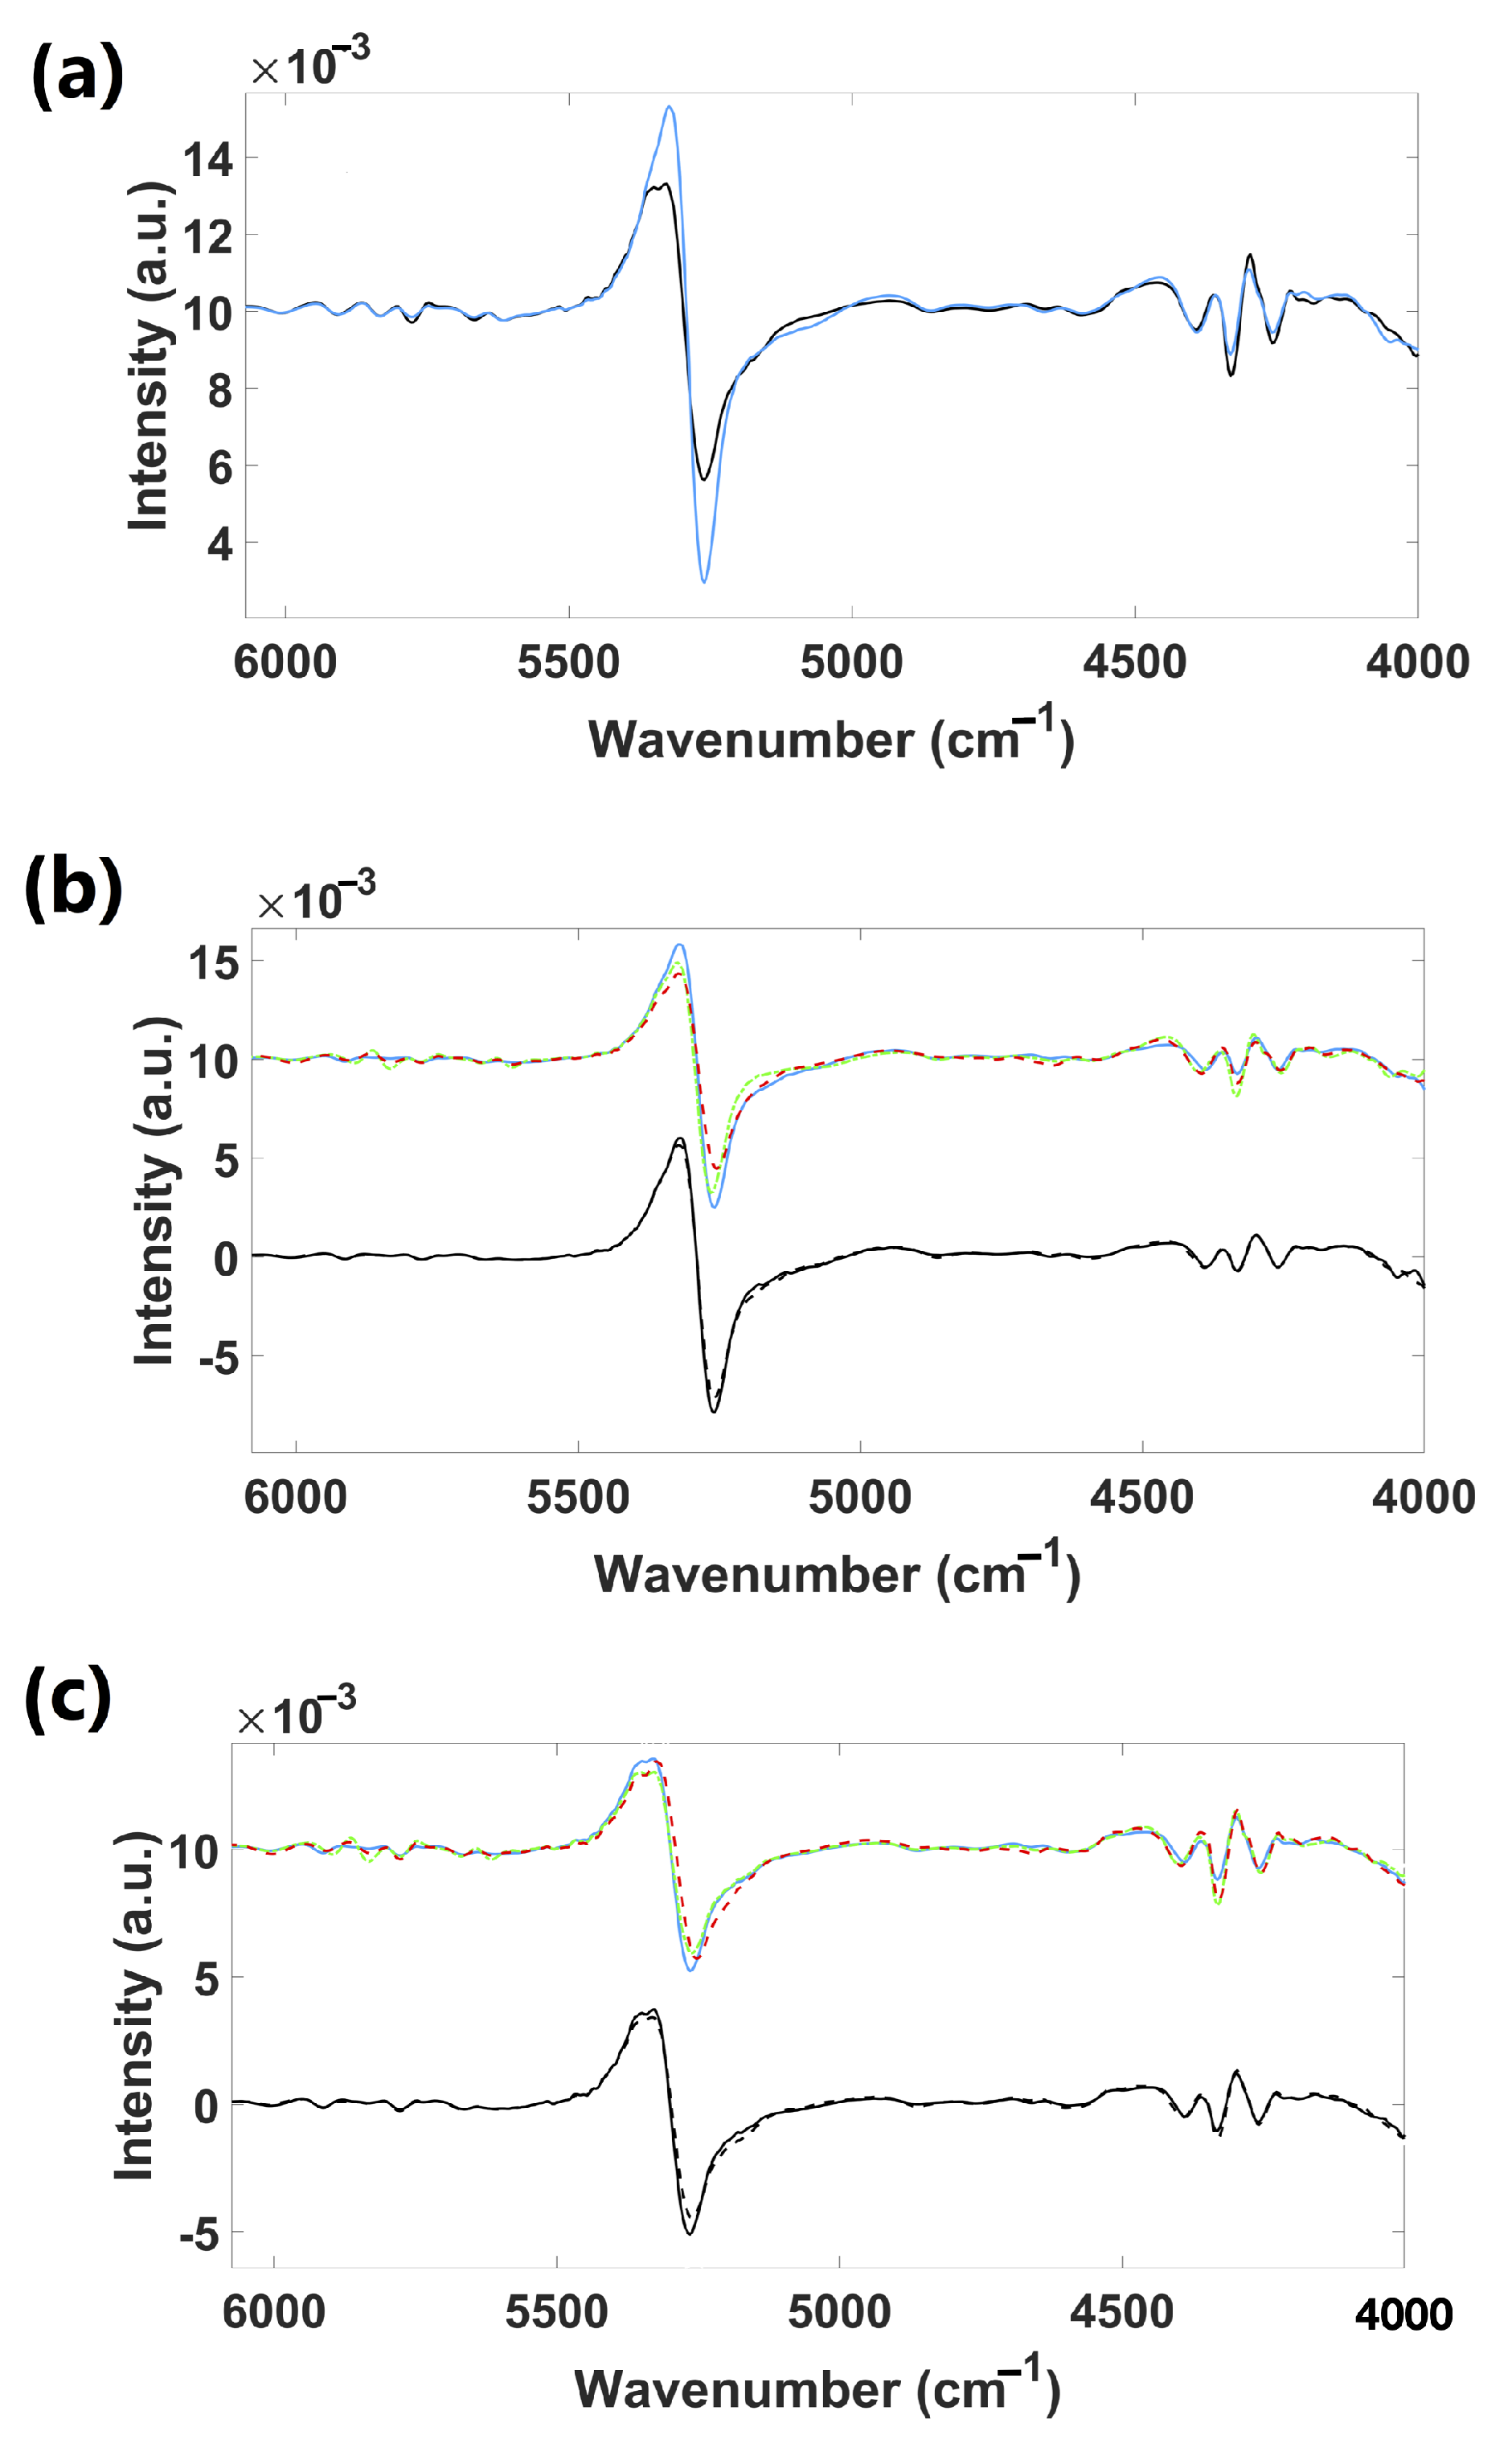
3.1. Spectral Analysis Results

Figure 3a presents the mean NIR spectra of all the samples (cultivars) of the fresh leaves (adaxial and abaxial sides), and Figure 4a, the corresponding derivatives. The spectra of both sides are quite similar, with only slight differences. Broad bands at 5200 and 7000 cm−1 are associated with the O–H combination and the first O–H overtones of water, respectively [24]. Vibration bands around 5800–5650 cm−1, 4900–4500 cm−1, and 4300–4200 cm−1 were observed. Bands within 5800–5650 cm−1 can be attributed to C–H vibrations in the first overtone region, connected to cellulose [25]. Bands from 4900 to 4500 cm−1 are associated with N–H and N–H plus C–H combinations, related to starch, pectin, and cellulose [25]. Bands around 4300–4200 cm−1 are located in the C–H plus C–C combination band regions, linked to cellulose and proteins [26].
Figure 3b,c present the mean NIR spectra for the Chandler cultivar (adaxial and abaxial sides of fresh leaves), and Figure 4b,c, the corresponding derivatives. Spectra of three different seasons (spring, fall, and winter) obtained from region R1 and spectra from spring leaves of R2 were presented. Spectra showed great similarity, especially those from the abaxial side of fresh leaves. Few or no naked-eye differences were observed between spectra from different seasons except for regions from 5900 to 5300 cm−1 (C–H first overtone, C=O second overtone vibrations, and O–H combinations associated with lignin, cellulose, sugars, starch, and proteins [26]), and 4900 to 4200 cm−1 (N–H combinations, N–H + C–H combinations, C–H + C–H combinations, and C–H + C–C combinations related to starch, proteins, pectin, and cellulose [25,26]) of the adaxial side spectra. Fall and winter spectra seem to have slightly more intense vibration bands in these regions. The spring leaves spectra from R1 and R2 showed slight differences in the region from 4900 to 4200 cm−1.

3.2. Machine-Learning Classification Results

Figure 5 illustrates the ROC curves derived from the discrimination analysis of V. corymbosum cultivars, per season and leaf region. The curves were generated from models trained with NIR data dimensionality reductive by four different techniques: DL, FA, fast ICA, and PCA.
In Table 3, the A c c u r a c y and A U C results for the best models fed with data from different spectral regions (I: 9920–7275 cm−1, II: 7274–6314 cm−1, III: 6313–5390 cm−1, IV: 5389–4924 cm−1, and V: 4923–4073 cm−1) and from the entire spectrum are presented, categorized by season and leaf side. Highlighted in green are the best results achieved for each season and leaf side, based on the highest A c c u r a c y and A U C values.
Table 4 provides a summary of the overall best model’s performance results highlighted in green in Table 3 per season, and adaxial–abaxial leaf face. This summary includes A c c u r a c y , P r e c i s i o n , R e c a l l , F1-score, and A U C , considering the number of components and the number of frequency bins (features).
Considering the best overall results, the confusion matrices for the discrimination process of V. corymbosum cultivar are presented in Figure 6,Figure 7,Figure 8, per season and leaf side.

4. Discussion

Near- and mid-infrared spectroscopy are being used for plant typing at different taxonomic levels [7,11,12,13,14], disease detection [27], antioxidant properties [28], and storage duration estimations [29], among others. Of the different plant constituents commonly explored, leaves are the ones that yield the best results. Despite the success of these techniques for typing purposes, their ability for cultivar discrimination has barely been explored, with few published studies [11,14], and has never been tested to discriminate blueberry cultivars. In this context, this work aimed to evaluate the ability of NIR spectroscopy to discriminate V. corymbosum cultivars from two different geographical regions and different seasons.

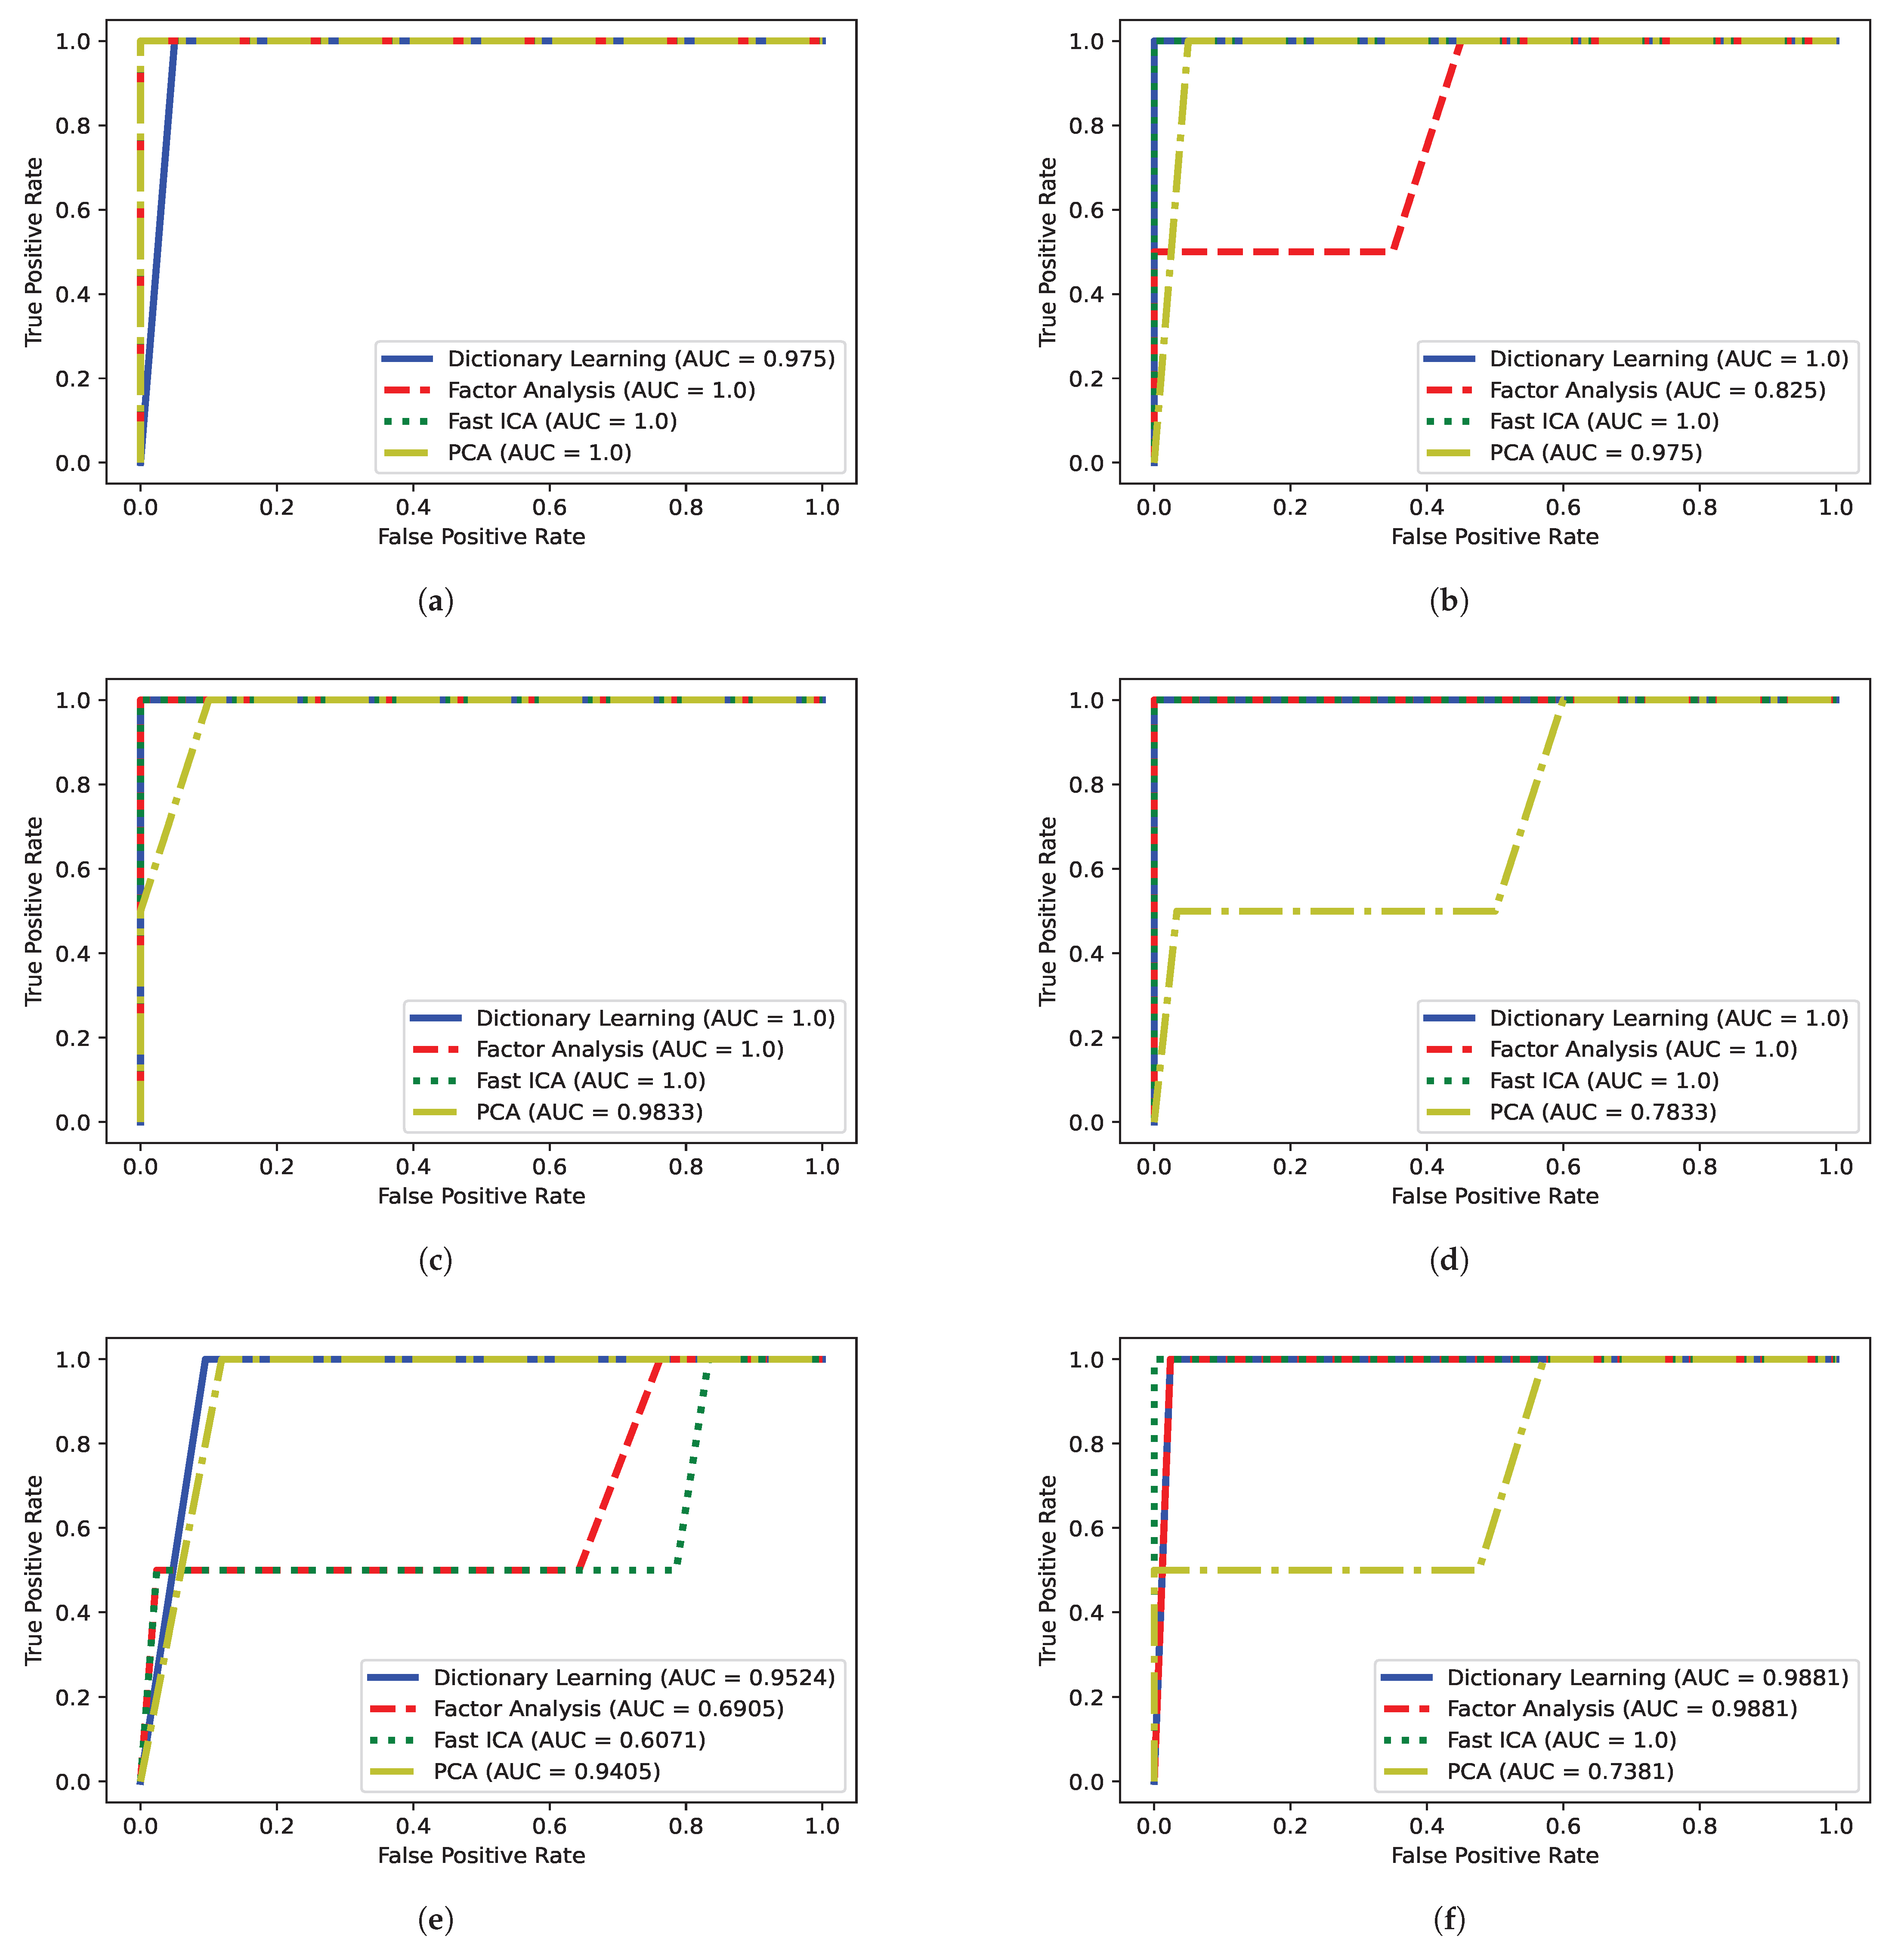
4.1. Choosing the Best DDR Method for Each Season and Leaf Side Using the A U C ROC Curves

Looking at the results presented in Figure 5, it can be seen that the fast ICA was the best overall DDR process, with 83.33% (five out of six) figures indicating an AUC of 1. The DL and the FA reached an AUC value of 1 in 50% (three out of six) of the cases. Lastly, the PCA DDR process achieved an AUC of 1 in 16.67% (one out of six) of the possible cases. With these results in mind, we see that the fast ICA is the best DDR technique choice for the majority of the cases, except when classifying the leaves’ adaxial side in spring, where DL proved to be a superior technique for DDR. This can be explained due to our data probably following a non-Gaussian distribution in which fast ICA performs better. In the case of PCA and FA, these techniques have an advantage in Gaussian distributions [30]. The DL possibly did not show a better result because it requires careful fine-tuning [31].

4.2. Choosing the Best Spectral Region for Each Season and Leaf Side Using A U C and A c c u r a c y

In Table 3, we present the best spectral region results for the optimal DDR process, categorized by season and leaf side. The selection of the best region was based on the A U C and A c c u r a c y metrics. In the fall, when we used the leaves’ adaxial side, we can see that the best results came from the spectral region III, with the A U C and A c c u r a c y obtaining the results of 1 and 100%, respectively. In the case of the leaves’ abaxial side for the same season, the best region was region III, with an A U C of 1 and an A c c u r a c y of 95.45. For the spring, the best results for the leaves’ abaxial side came from the all spectrum region, with an A U C of 0.619 and an A c c u r a c y of 52.27%. The best results from the abaxial leaves in spring came from region III, with an A U C and A c c u r a c y of 1 and 70.45%, respectively. In the case of the winter season, the adaxial of the leaves obtained the best results in region V, reaching 1 of A U C and a 96.88% A c c u r a c y . For the abaxial of the leaves in the case of the winter season, the best results were 1 of A U C , and 100% of A c c u r a c y illustrated in region V, as well. Globally, we can see a clear dominance of region III, corresponding to 50% (three out of six) of the cases, followed by region V with 33.33% (two out of six), and last was region II, which represented 16.67% (1 out of 6).

4.3. Analysis of the Best Overall Results

In Table 4, we see that the fall and winter seasons yielded the best results. The Adaxial_Fall and Abaxial_Winter achieved 100% in Accuracy, Precision, Recall, and F1-score, with the AUC reaching 1. The Adaxial_Spring had an Accuracy of 52.27%, a Precision of 38.54%, a Recall of 48.44%, an F1-score of 40.63%, and an AUC of 0.619.
The Adaxial_Winter achieved an Accuracy, Precision, Recall, F1-score, and AUC of 96.88%, 95.31%, 96.88%, 95.83%, and 1, respectively. The Abaxial_Fall demonstrated an Accuracy of 95.45%, a Precision of 93.18%, a Recall of 95.45%, an F1-score of 93.94%, and an AUC of 1. The Abaxial_Spring had an Accuracy of 70.45%, a Precision of 61.46%, a Recall of 70.31%, an F1-score of 64.69%, and an AUC of 1.
The best classifier was the LinearSVC, representing 66.67% (four out of six) of the models. A possible reason why a simple classifier, such as LinearSVC, achieves the best results in most comparison groups is the size of the dataset. More complex classifiers tend to introduce higher variance, which is disadvantageous for small datasets [32].
Globally, better results were achieved with fall and winter leaves. Spring leaves yielded poorer cultivar identification rates, which could be related to their higher water and chlorophyll contents. Water and chlorophyll are, particularly in spring leaves, major components and could mask spectra, making other components (discriminant ones) less visible to the infrared light [33].

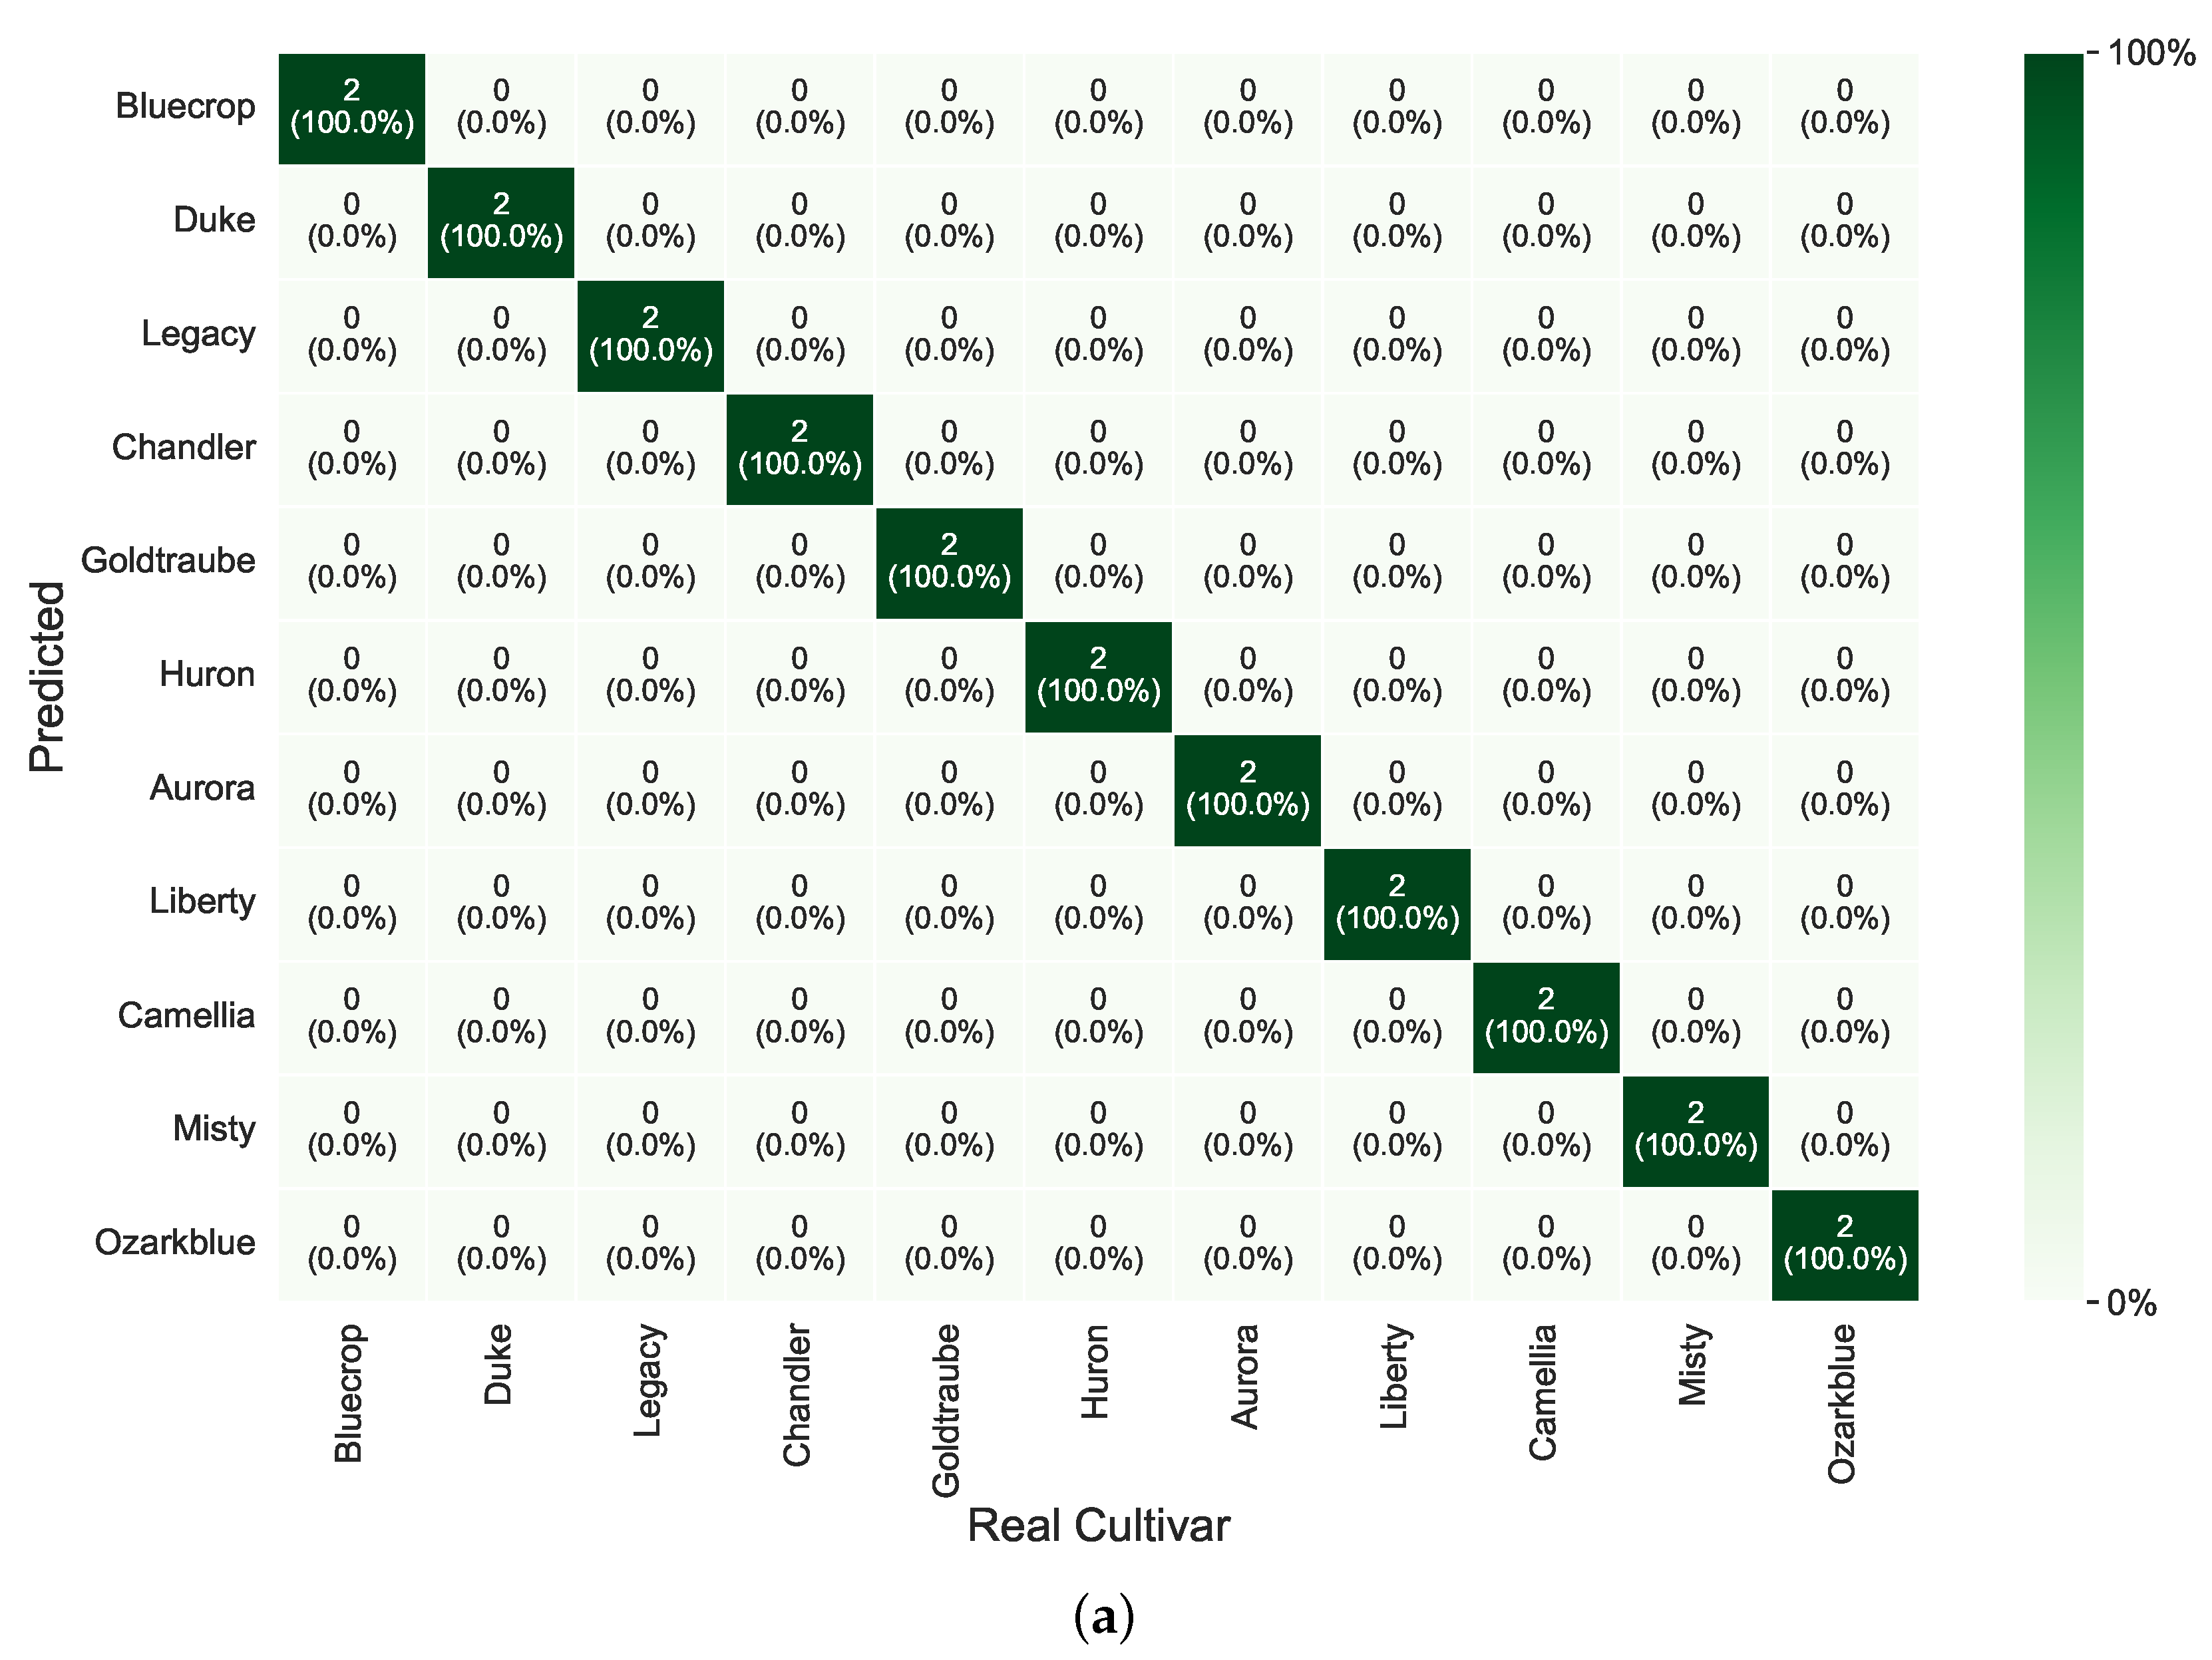
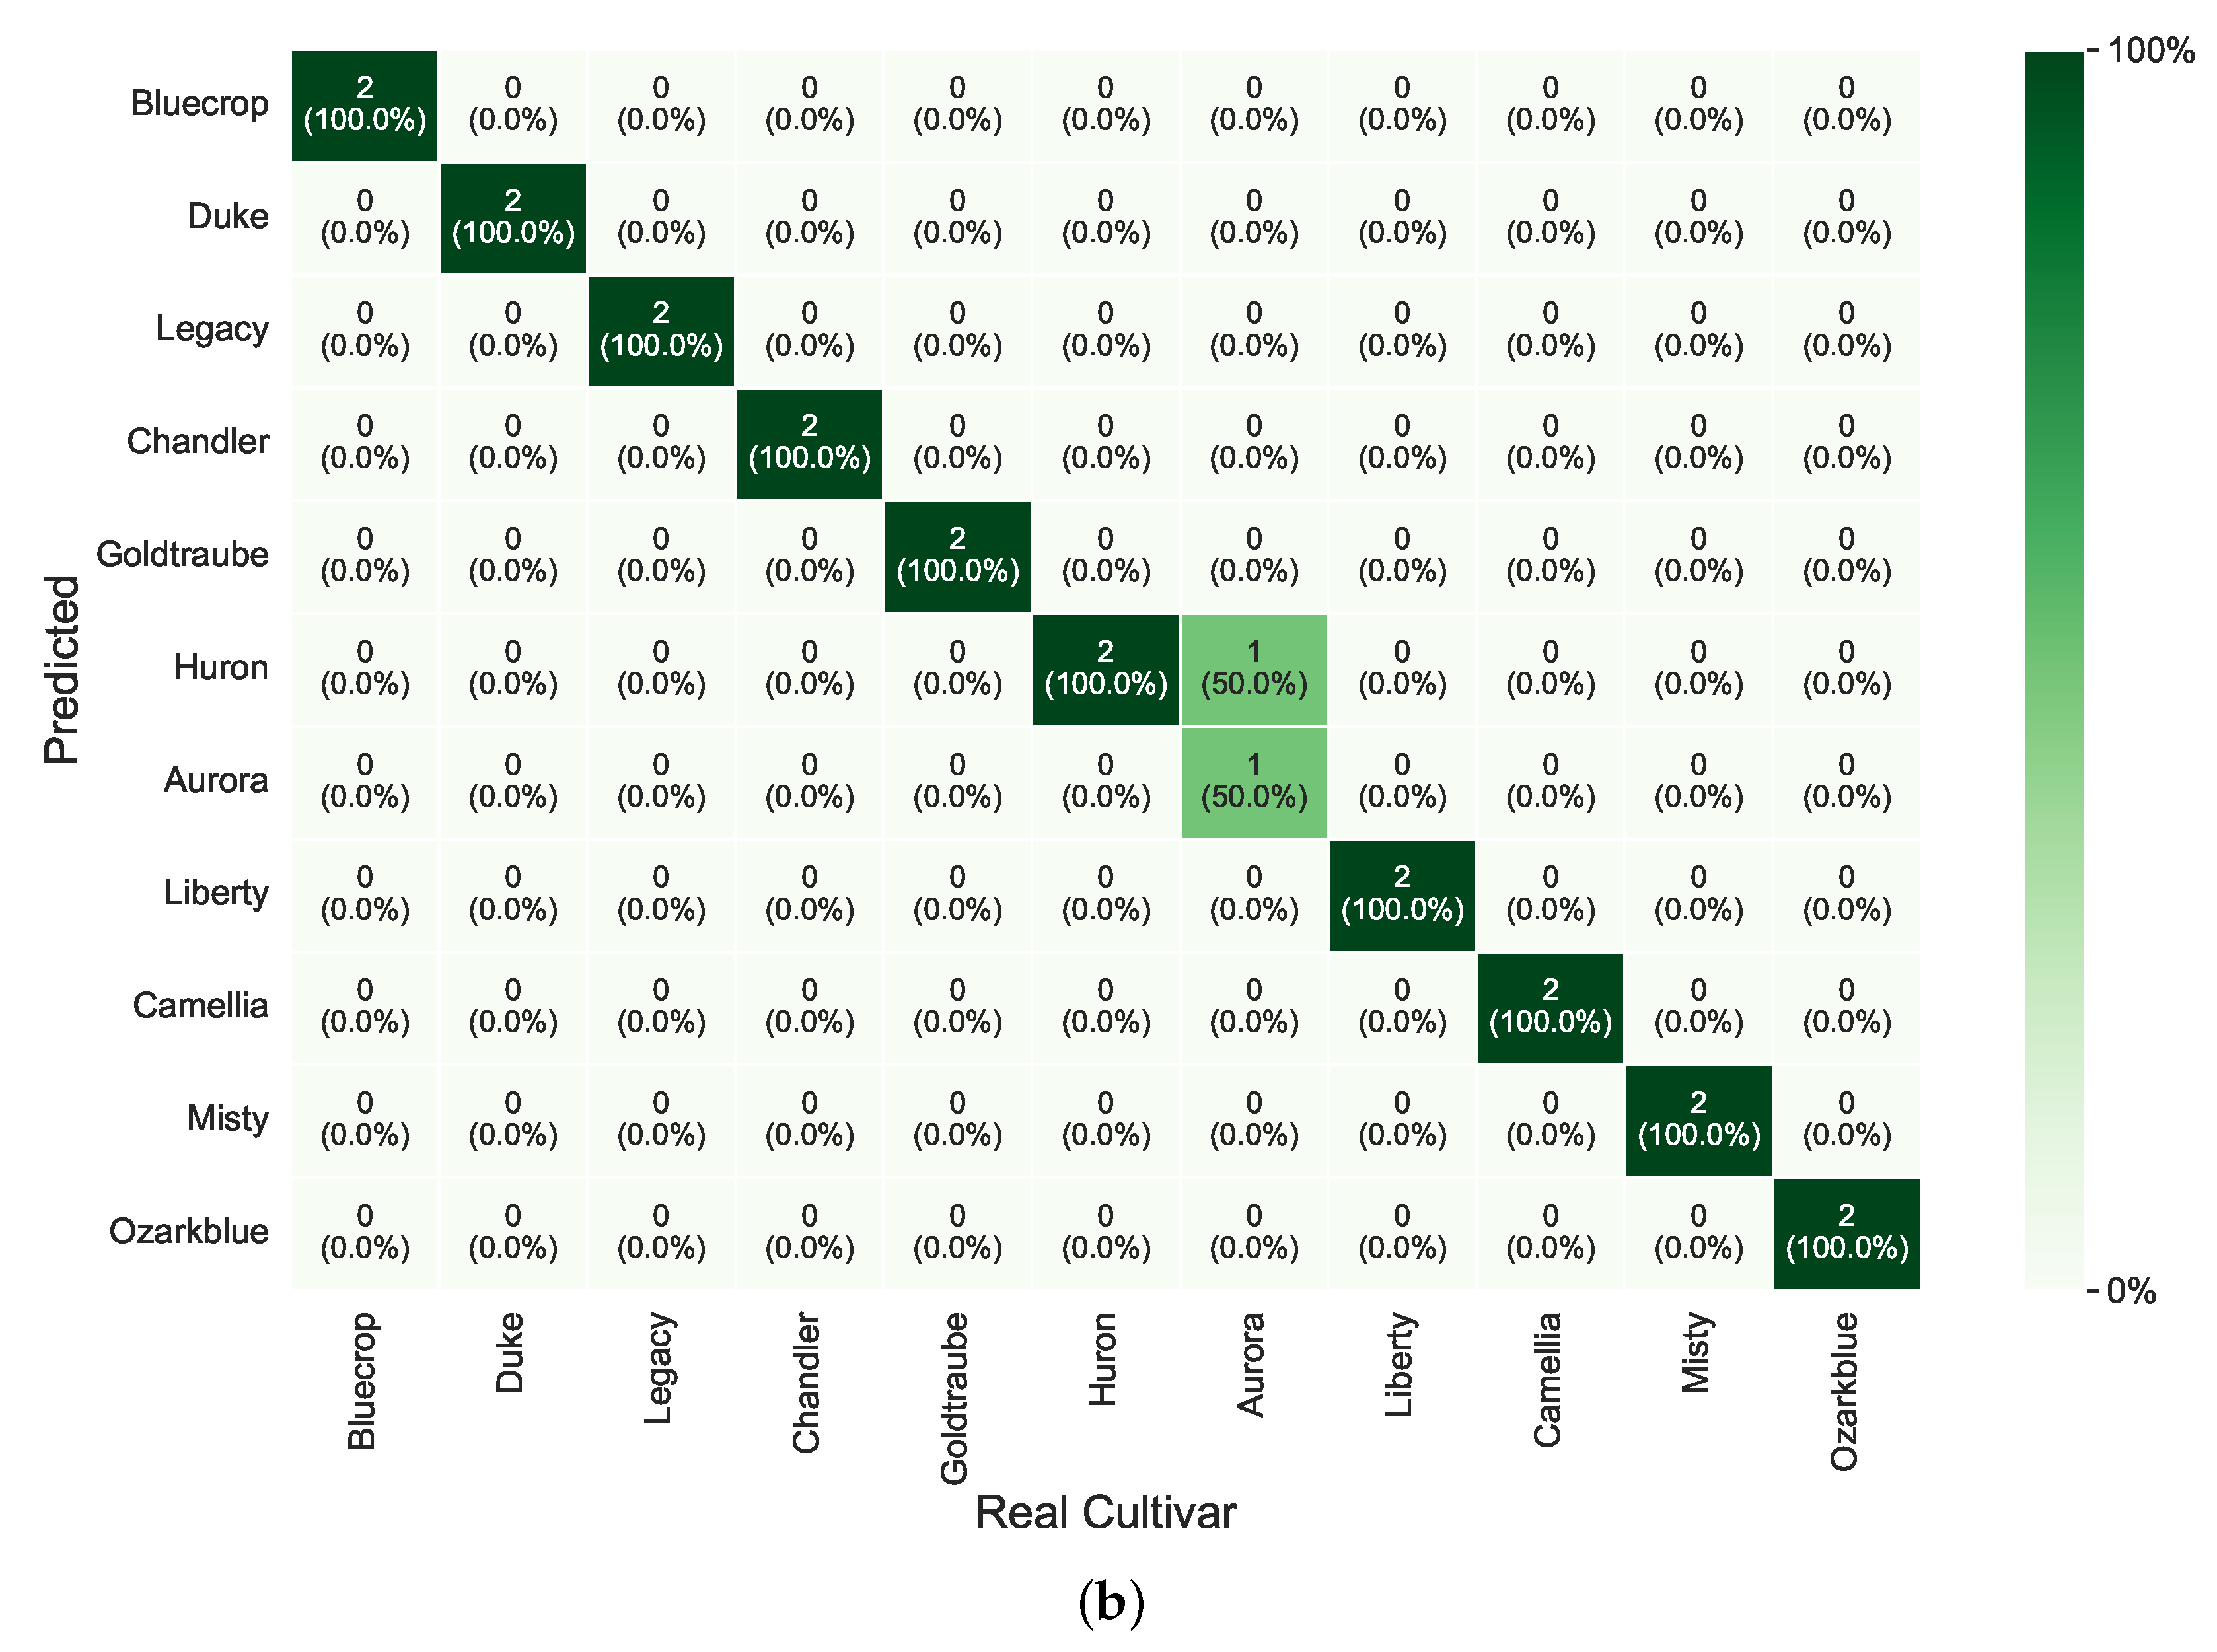
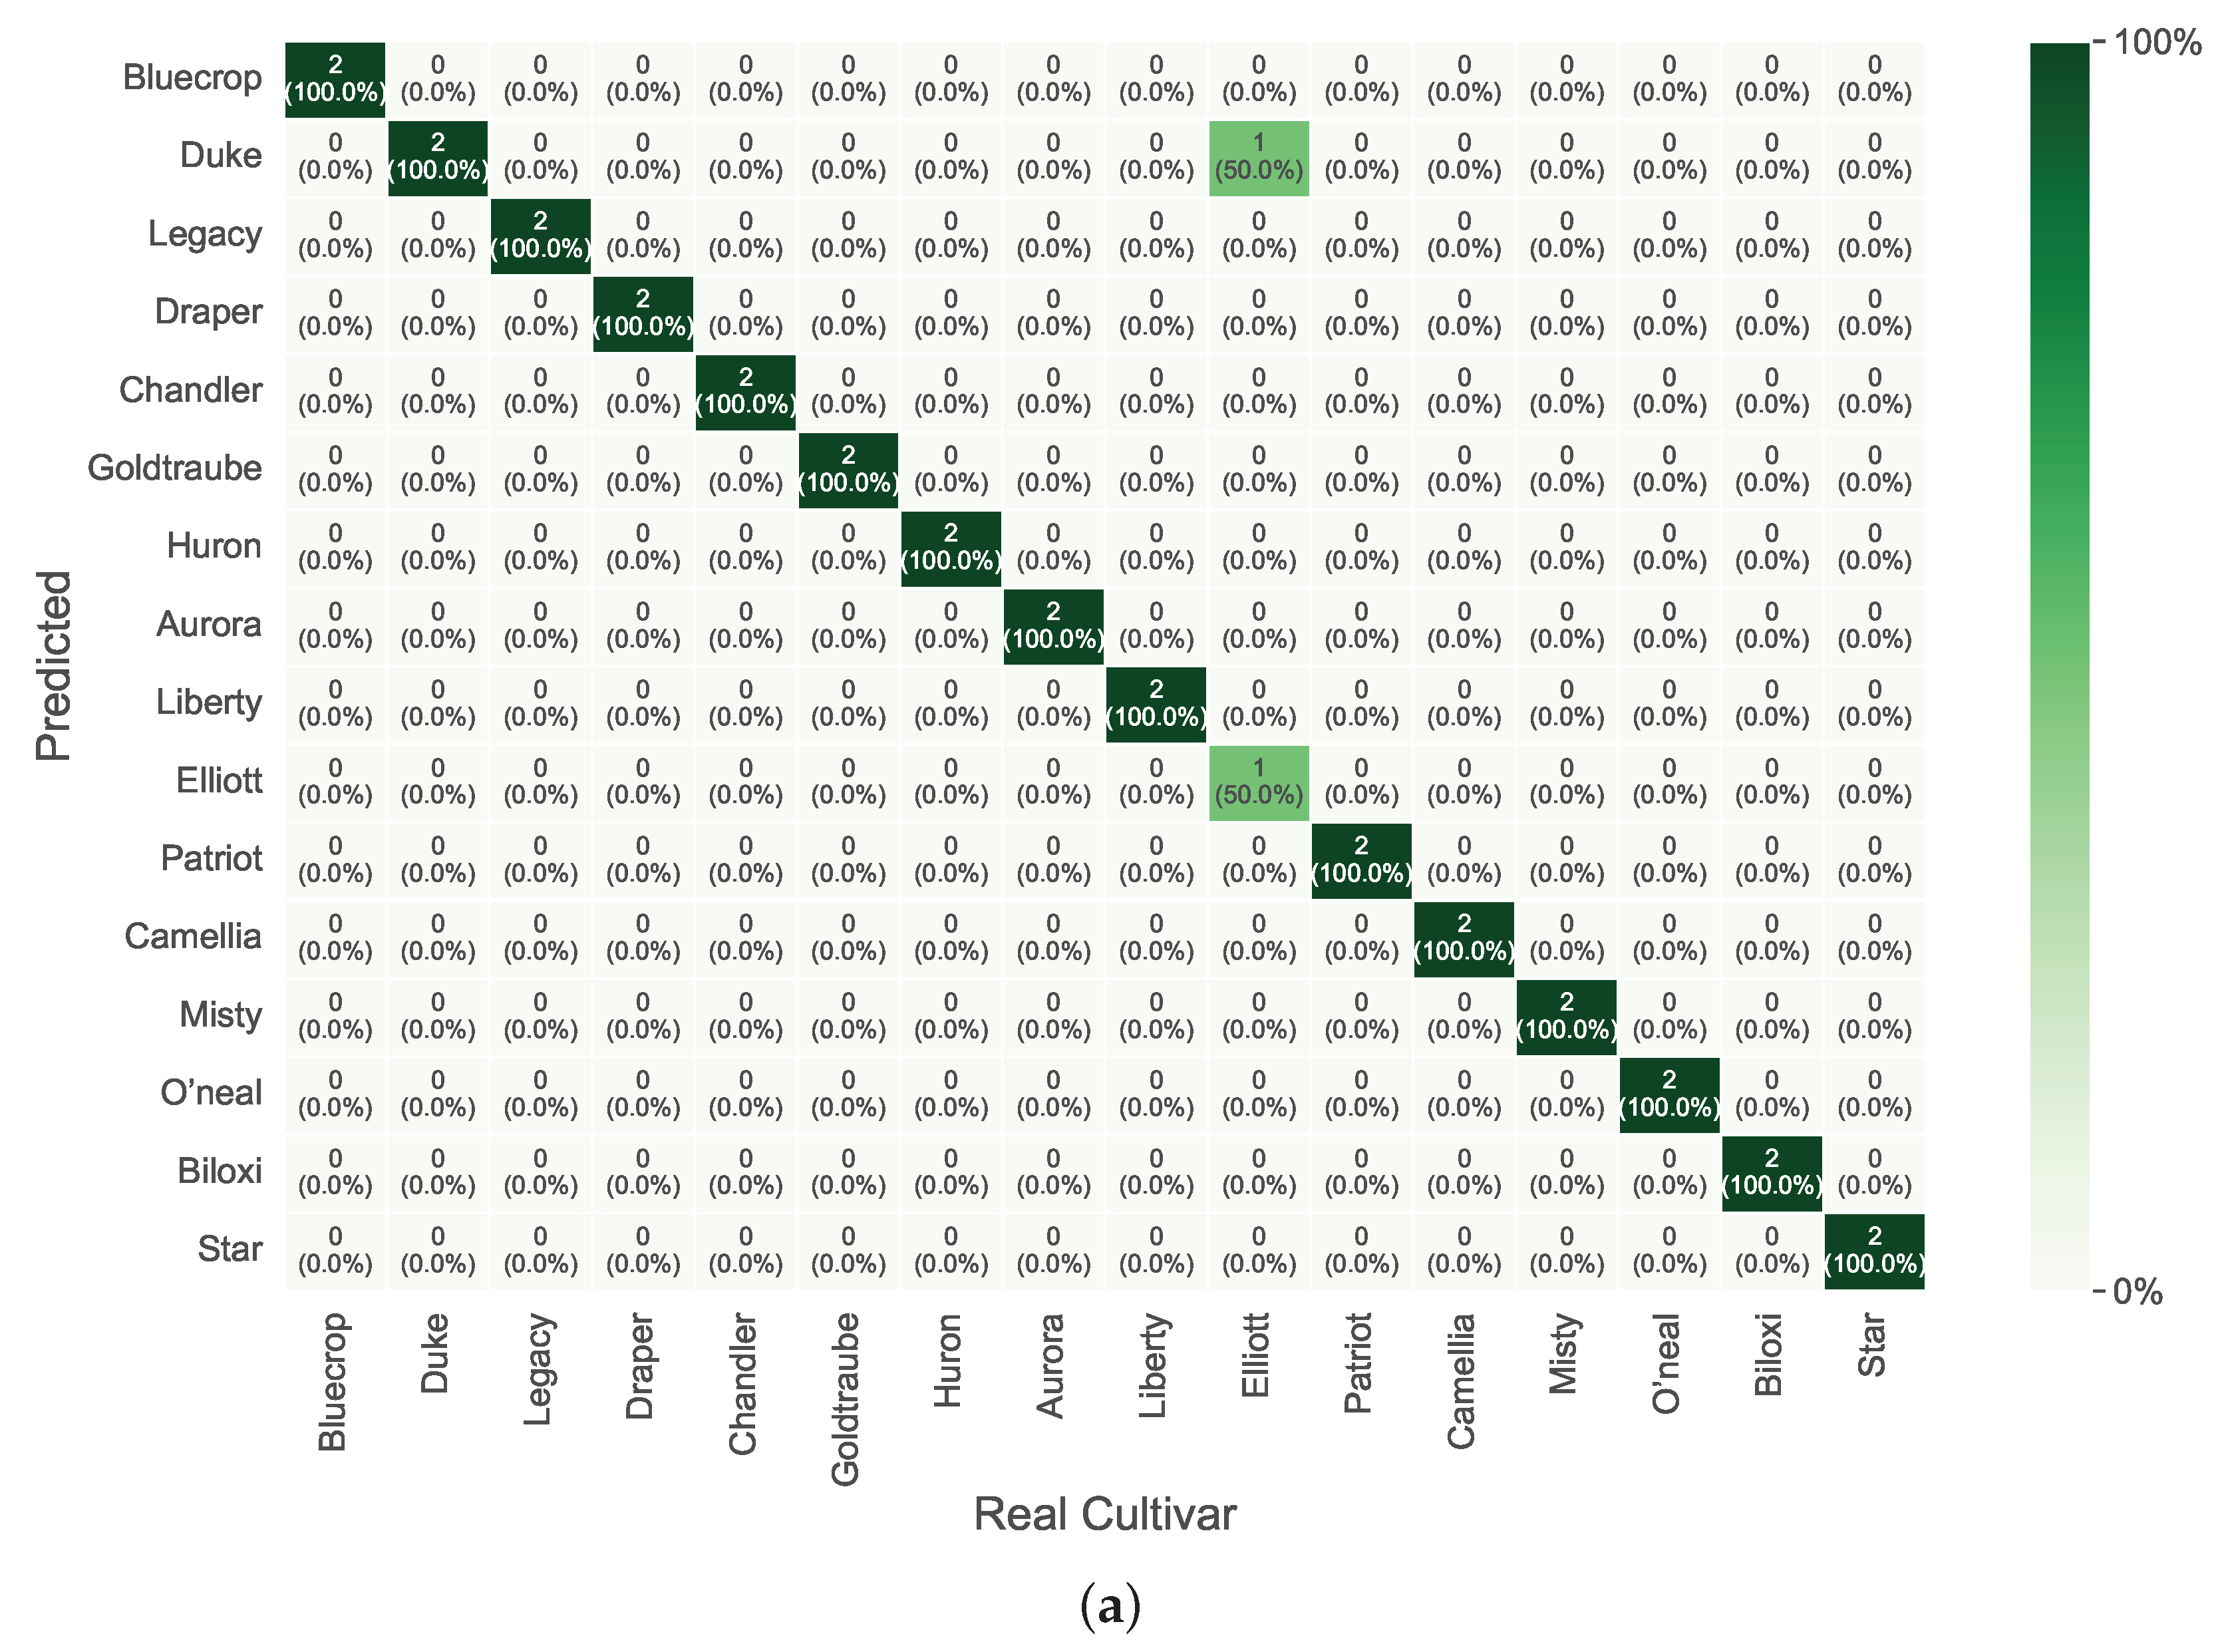
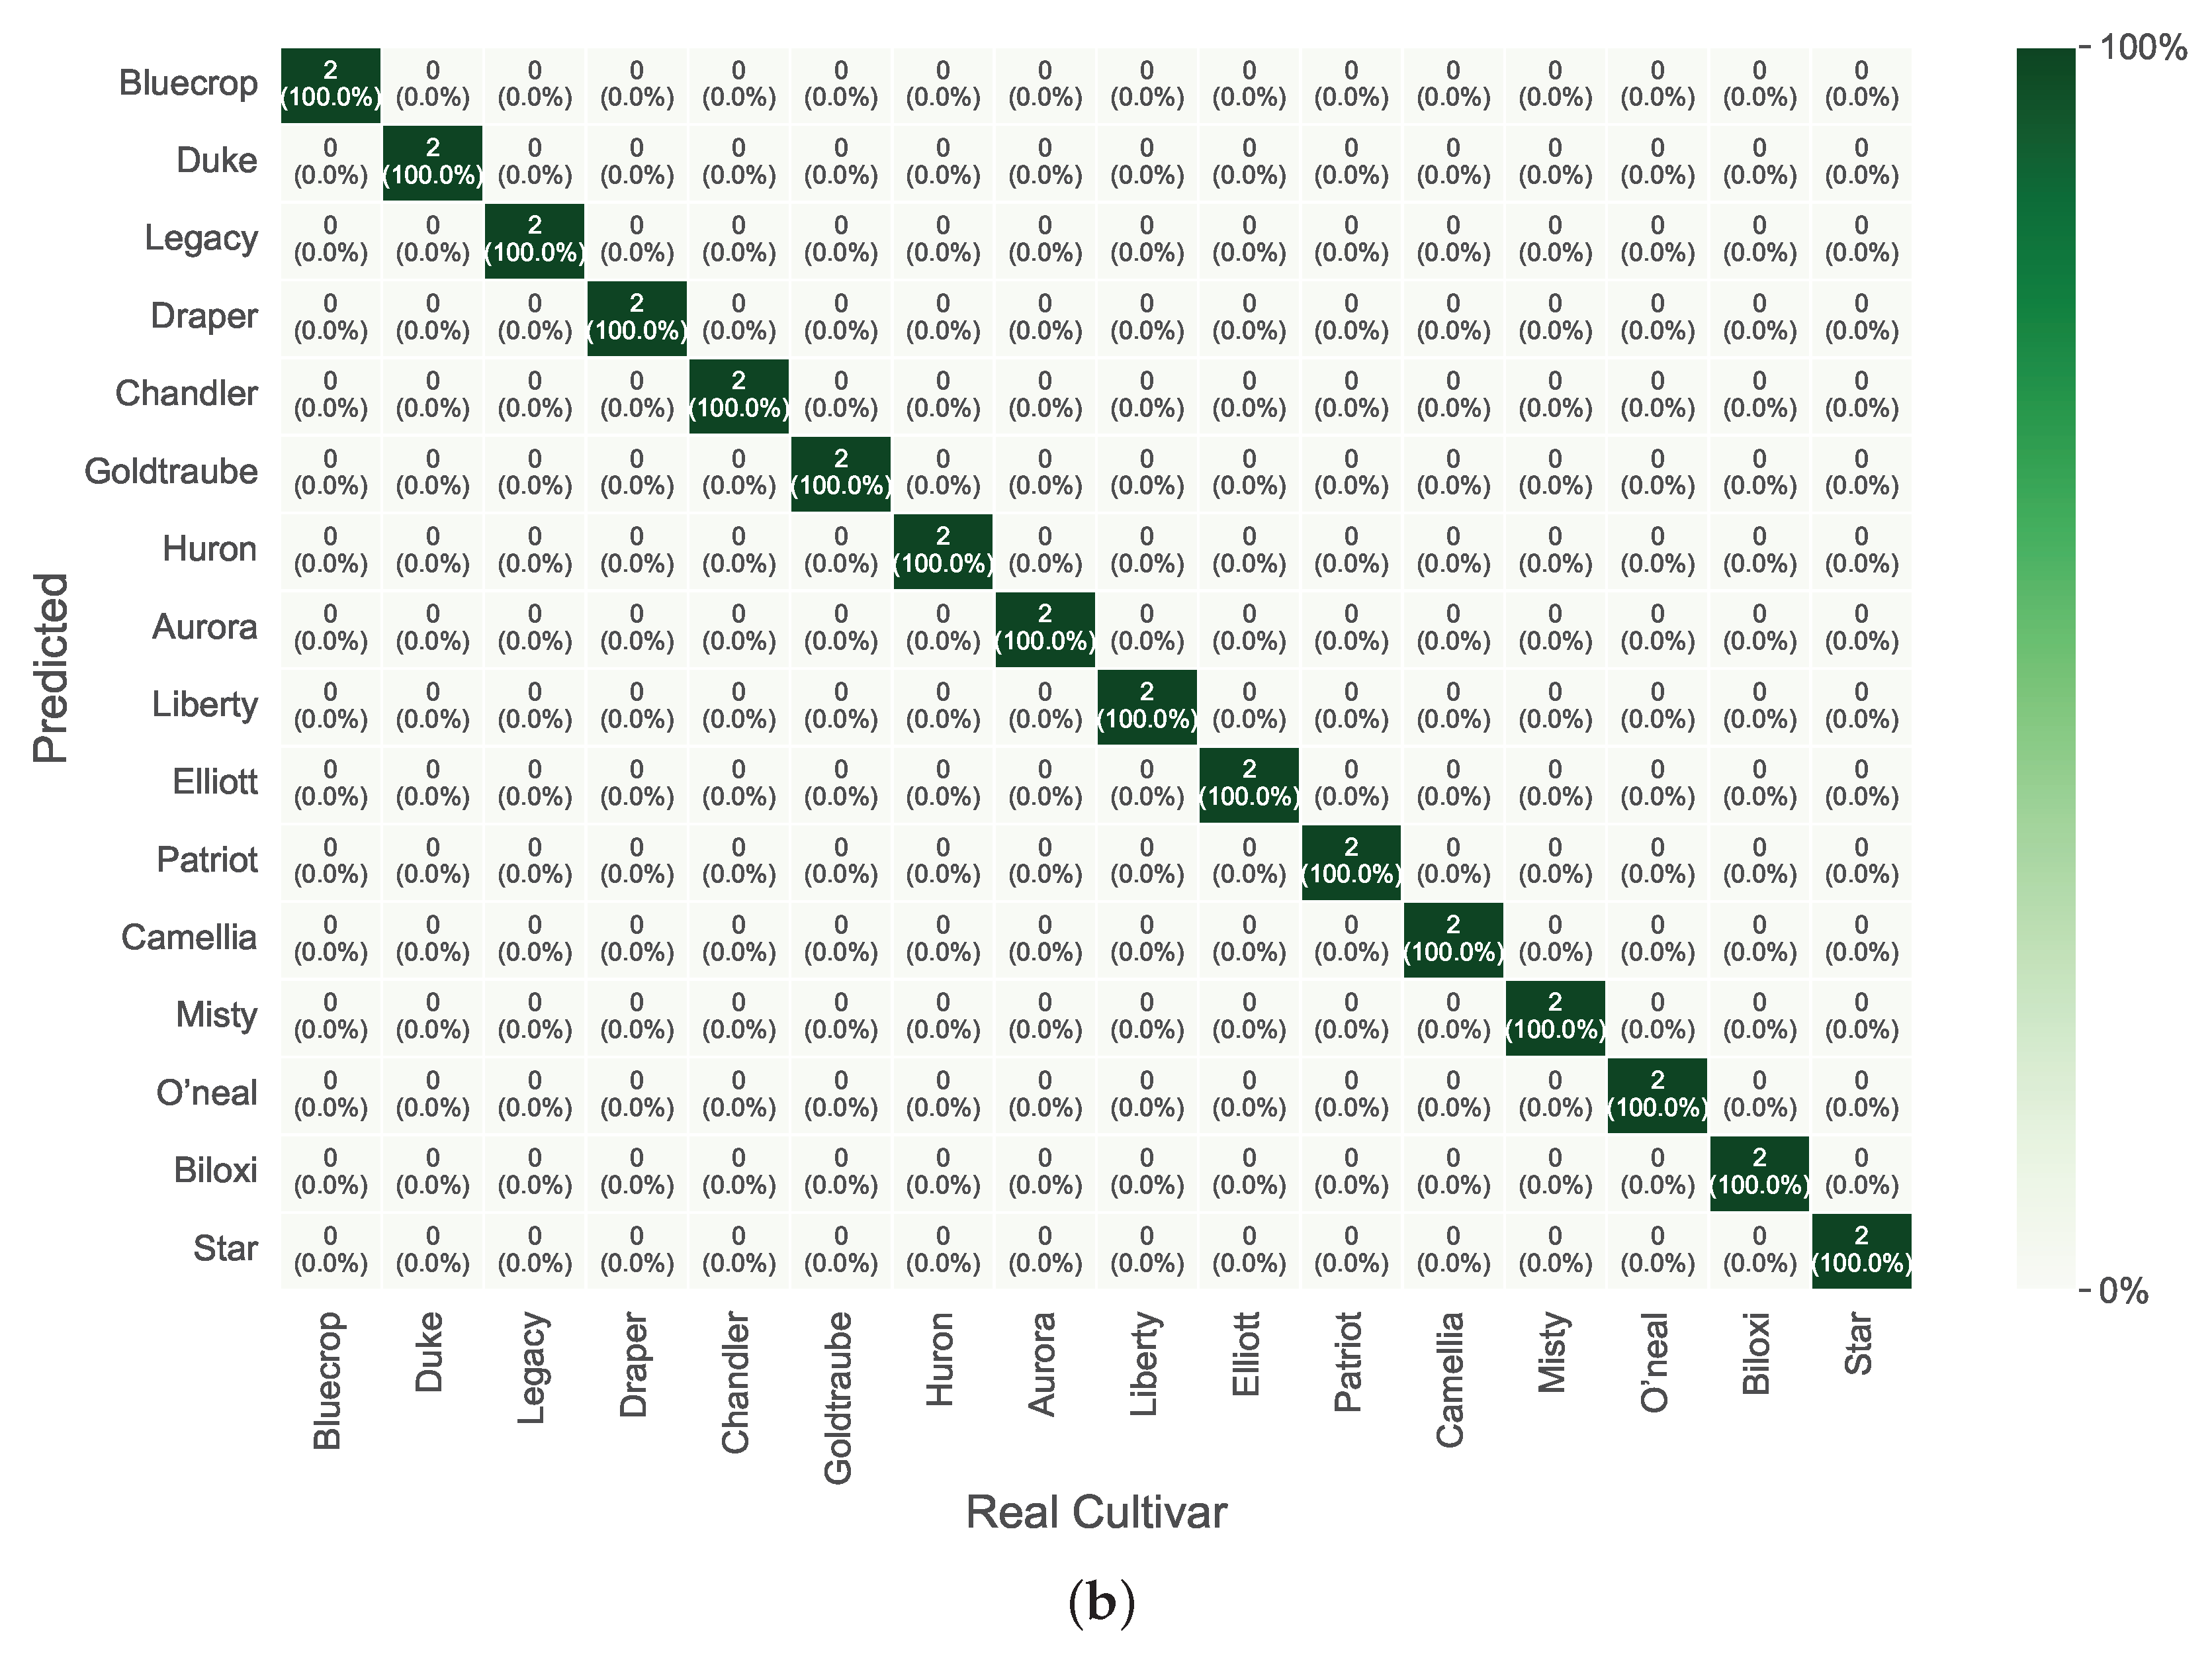
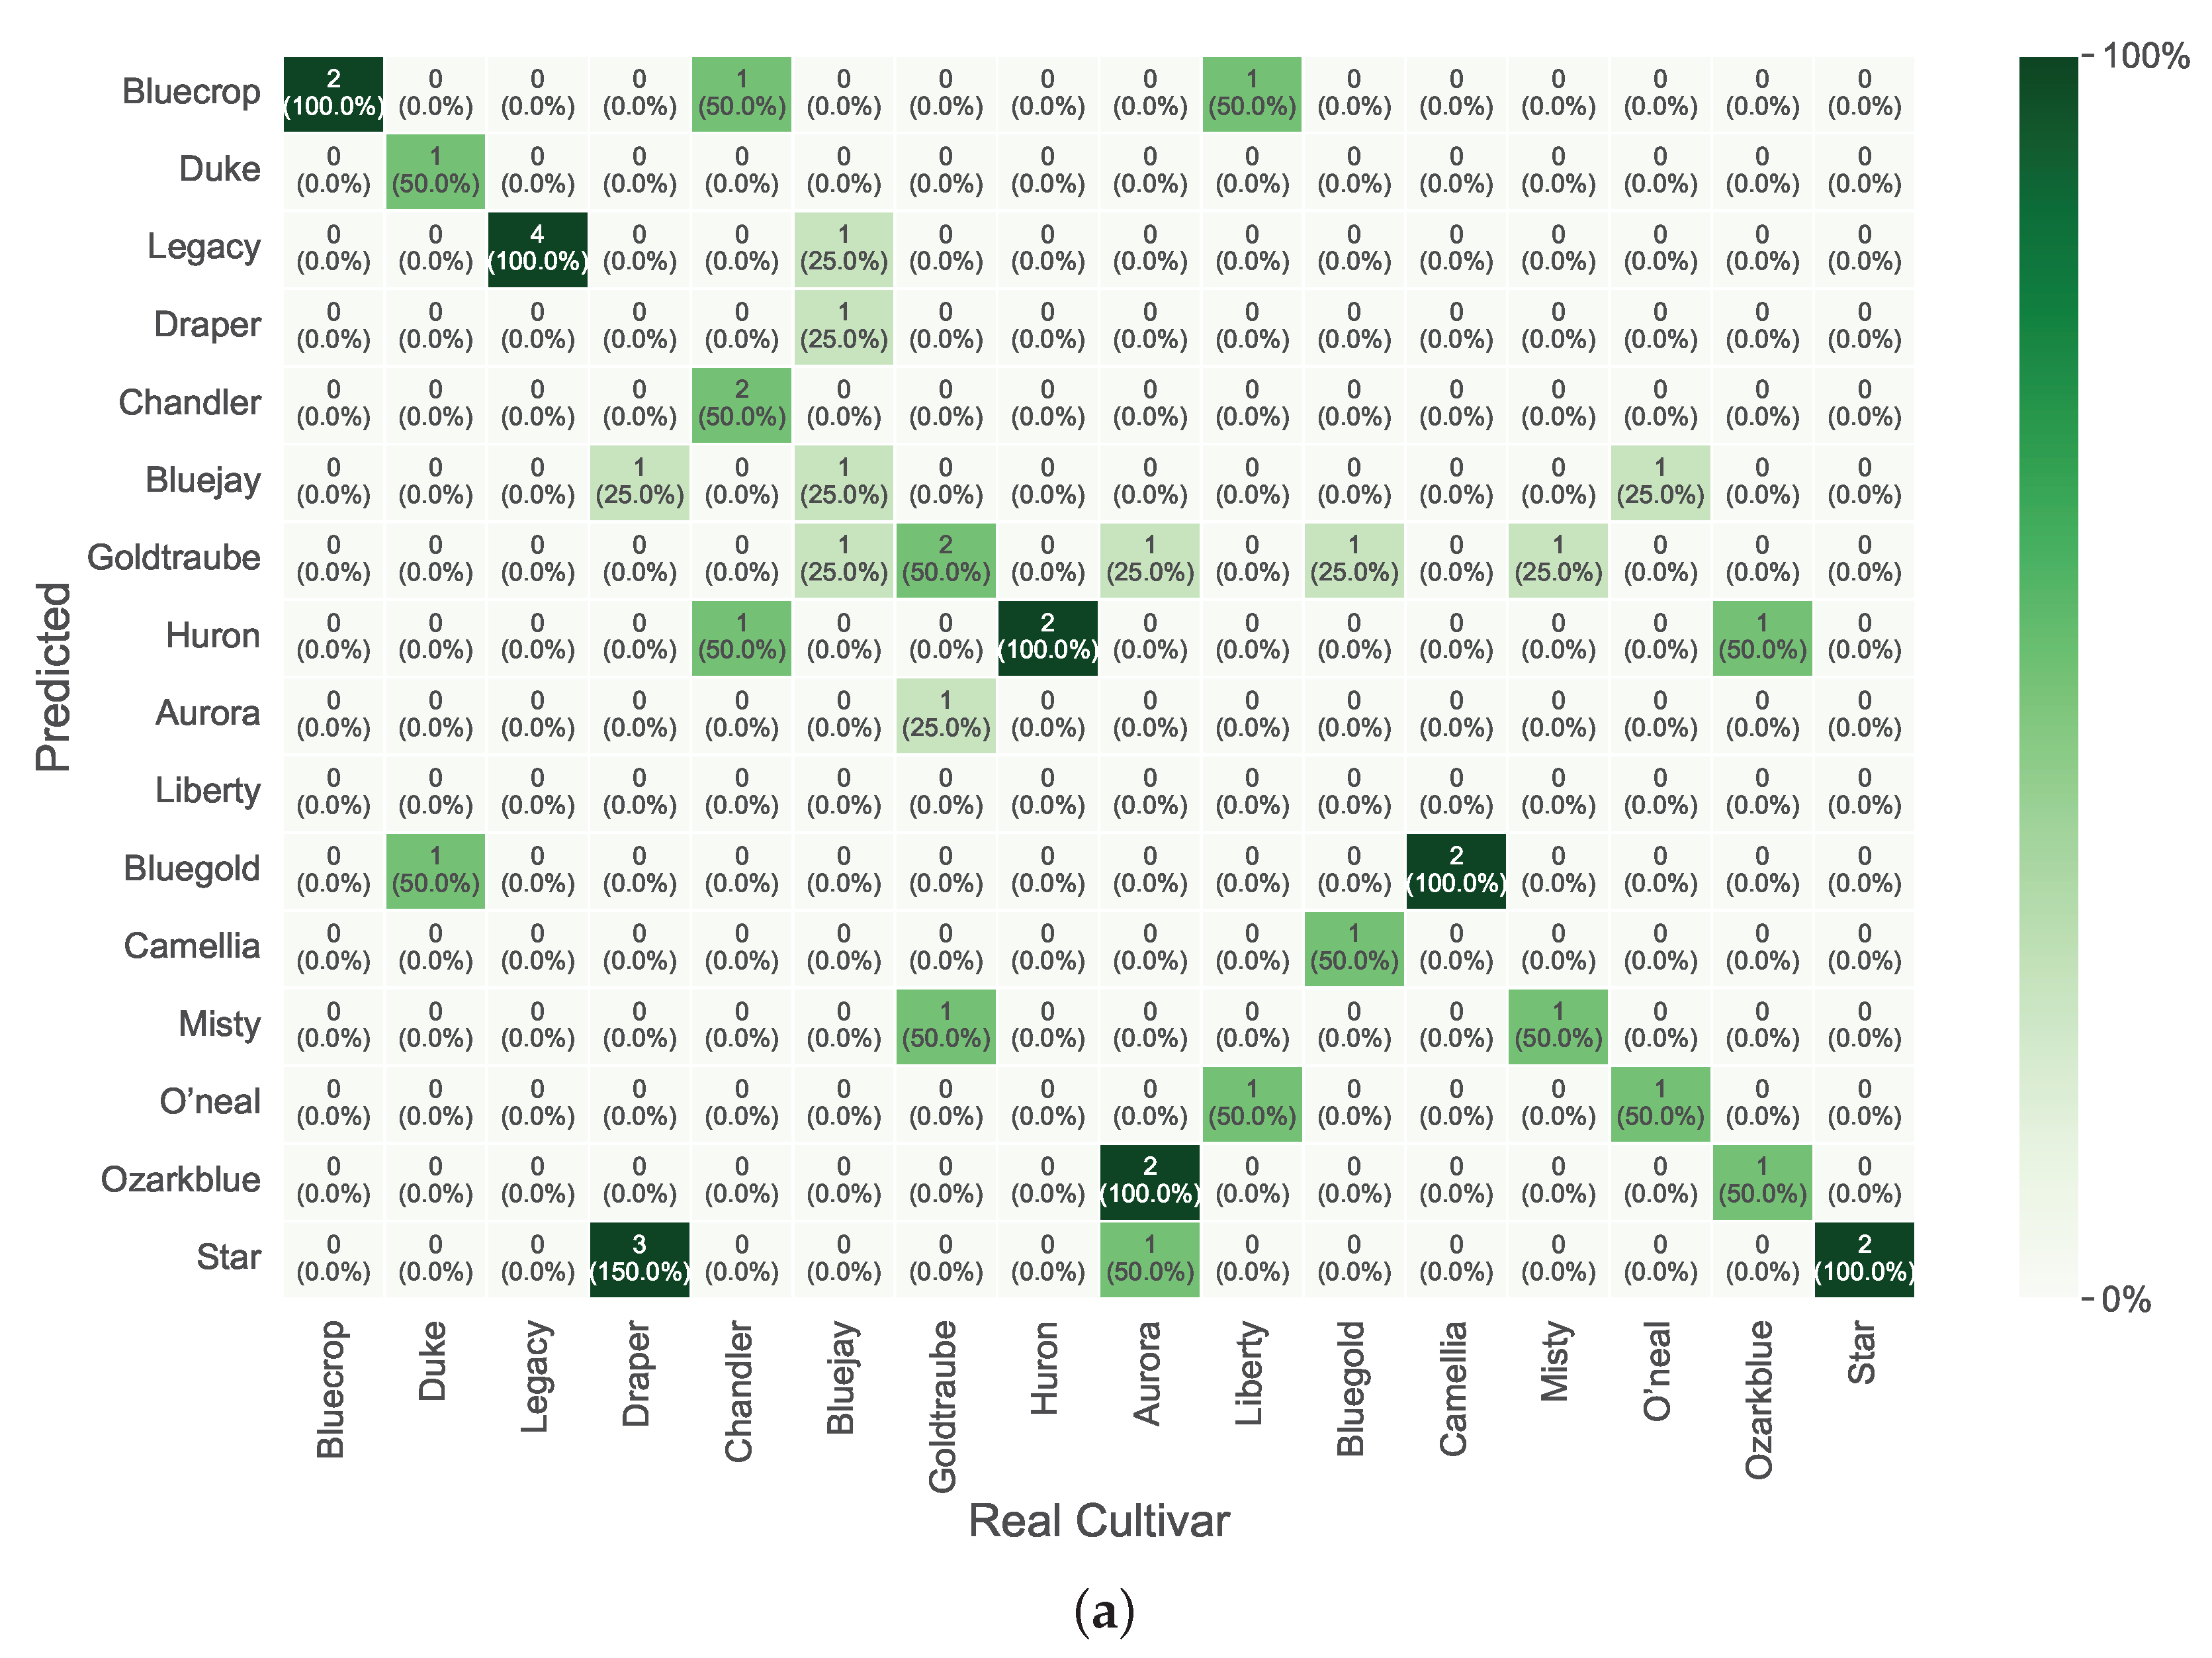
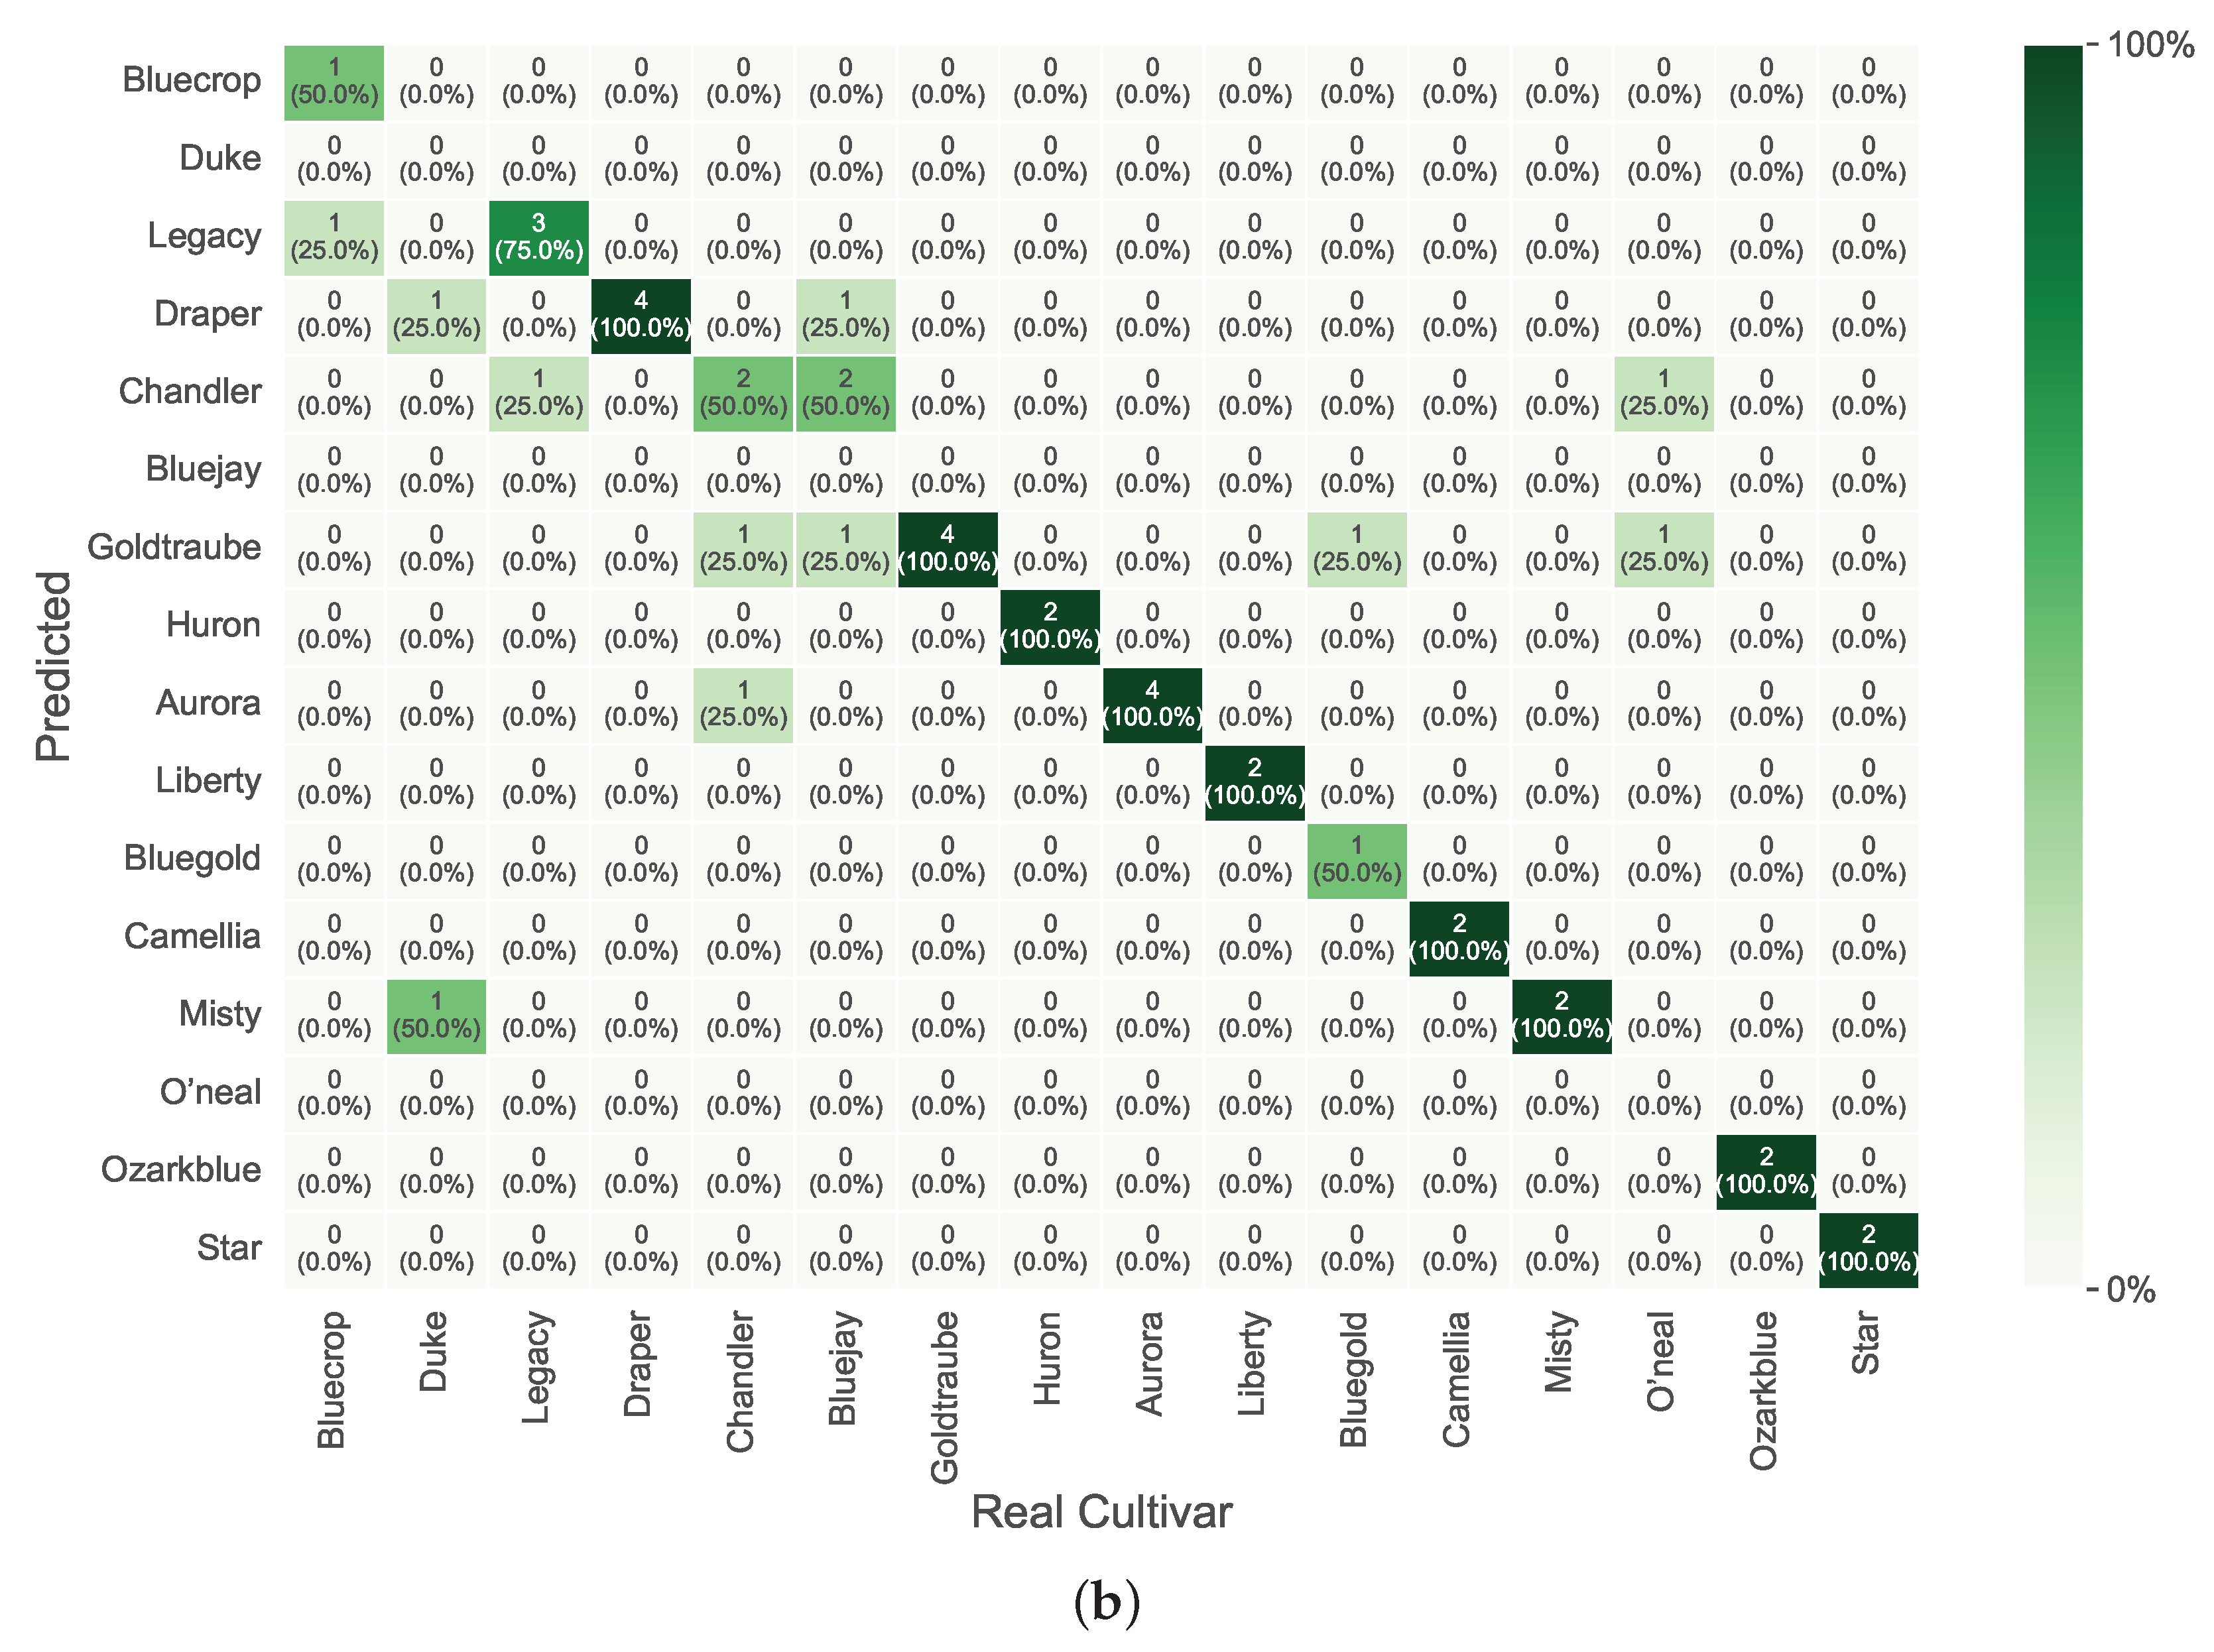
4.4. Analysis of Confusion Matrices Related to the Best Overall Results

Figure 6 shows the confusion matrices for the leaves’ sides in the fall. We can see that the adaxial side did not have any difficulty discriminating between classes. However, on the abaxial side, there is a slight difficulty with the Aurora and Huran classes.
Figure 7 illustrates the confusion matrices for the leaves’ sides in winter. The adaxial side presented some difficulty in correctly discriminating the Elliott class, which was often predicted as the Duke class. In contrast, the abaxial side showed clear discrimination between all classes.
Figure 8 presents the confusion matrices for the leaves’ sides in spring. The adaxial side shows a significant difficulty in correctly discriminating the classes, with only the Bluecrop, Legacy, Huron, and Star classes being correctly classified. On the abaxial side, there is a small improvement compared to the adaxial side in the same season. However, there is still some difficulty in correctly classifying the O’neal, Bluegold, Bluejay, Chandler, Legacy, Duke, and Bluecrop classes. Overall, the cultivar discrimination success cannot be linked to a specific leaf side (adaxial or abaxial). The best results seem to be randomly achieved with one leaf side.

5. Conclusions

Overall, this study demonstrated the potential of NIR spectroscopy for infra-species typing and established a reliable method for blueberry cultivar identification, addressing a clear gap in the literature. The proposal model’s discrimination A c c u r a c y of cultivars with air-dried and fresh leaf spectra ranged from 52.27% to 100%, with the highest spectral performance achieved using the adaxial side of the leaves in fall and winter, both with 100% A c c u r a c y in spectral regions III and V, respectively. It is important to highlight the higher number of cultivars tested (19 different cultivars) correctly classified with a low number of LVs. To the best of our knowledge, no prior studies have reported spectral recognition results for V. corymbosum leaves that are optimized in fall and winter; therefore, a comparison between studies was not possible. This aspect should be explored in future research to better understand how seasonal factors influence model performance.
Additionally, our proposed methodological approach showed that a calibration model must be used to carefully identify cultivars from different geographic regions or seasons, enabling an accurate identification of blueberry cultivars without the need for berries on the plant. Based on these findings, a calibrated and validated portable NIR device can allow farmers to conduct on-site cultivar identification and real-time decision making without the need for expert support. To enhance the current study, future research will focus on optimizing the hyperparameters of classifiers and DDR techniques. Additionally, the incorporation of more samples will facilitate the application of advanced deep-learning-based data analysis, thereby improving the generalizability of the results.

Author Contributions

Conceptualization, P.R., M.I.B. and P.M.R.; methodology, P.R., M.I.B., P.R., C.S. and P.M.R.; validation, C.S. and P.M.R.; investigation, P.R., M.I.B., C.S. and P.M.R.; writing—original draft, P.R. and M.I.B.; writing—review and editing, P.R., M.I.B., C.S. and P.M.R.; supervision, P.M.R.; funding acquisition, P.M.R. All authors have read and agreed to the published version of the manuscript.

Funding

This research received no external funding.

Informed Consent Statement

Not applicable.

Data Availability Statement

The data presented in this study are available on request from the corresponding author due to privacy reasons.

Acknowledgments

This work was supported by Fundação para a Ciência e a Tecnologia (FCT), Portugal, through the project UIDB/50016/2020. The authors acknowledge Eng. Paulo Lúcio Gomes for providing Vaccinium spp. leaves through the co-op Bagas de Portugal (https://www.bagasdeportugal.pt/, accessed on 11 April 2025).

Conflicts of Interest

The authors declare no conflicts of interest.

References

  1. Luteyn, J.L. Diversity, adaptation, and endemism in neotropical Ericaceae: Biogeographical patterns in the Vaccinieae. Bot. Rev. 2002, 68, 55–87. [Google Scholar] [CrossRef]
  2. Vander Kloet, S.P.; Avery, T.S. Vaccinium on the Edge. Edinb. J. Bot. 2010, 67, 7–24. [Google Scholar] [CrossRef]
  3. Vander Kloet, S.P.; Dickinson, T.A. A subgeneric classification of the genus Vaccinium and the metamorphosis of V. section Bracteata Nakai: More terrestrial and less epiphytic in habit, more continental and less insular in distribution. J. Plant Res. 2009, 122, 253–268. [Google Scholar] [CrossRef]
  4. Carvalho, M.; Matos, M.; Crespí, A.; Lopes, V.R.; Carnide, V. Genetic Diversity and Identification of Vaccinium Species Through Microsatellite Analysis. Plants 2024, 13, 3488. [Google Scholar] [CrossRef]
  5. Palmieri, L.; Saviane, A.; Sordo, M.; Grando, M.; Giongo, L. Blueberry: Germplasm Characterization and Food Traceability by the Use of Molecular Markers. Acta Hortic. 2009, 810, 167–172. [Google Scholar] [CrossRef]
  6. Bell, D.J.; Rowland, L.J.; Polashock, J.J.; Drummond, F.A. Suitability of EST-PCR Markers Developed in Highbush Blueberry for Genetic Fingerprinting and Relationship Studies in Lowbush Blueberry and Related Species. J. Am. Soc. Hortic. Sci. 2008, 133, 701–707. [Google Scholar] [CrossRef]
  7. Lu, H.F.; Shen, J.B.; Lin, X.Y.; Fu, J.L. Relevance of Fourier transform infrared spectroscopy and leaf anatomy for species classification in Camellia (Theaceae). TAXON 2008, 57, 1274. [Google Scholar] [CrossRef]
  8. Sousa, C.; Silva, L.; Grosso, F.; Nemec, A.; Lopes, J.; Peixe, L. Discrimination of the Acinetobacter calcoaceticus–Acinetobacter baumannii complex species by Fourier transform infrared spectroscopy. Eur. J. Clin. Microbiol. Infect. Dis. 2014, 33, 1345–1353. [Google Scholar] [CrossRef]
  9. Silva, S.; Tobaldini-Valerio, F.; Costa-de Oliveira, S.; Henriques, M.; Azeredo, J.; Ferreira, E.C.; Lopes, J.A.; Sousa, C. Discrimination of clinically relevant Candida species by Fourier-transform infrared spectroscopy with attenuated total reflectance (FTIR-ATR). RSC Adv. 2016, 6, 92065–92072. [Google Scholar] [CrossRef]
  10. Quintelas, C.; Ferreira, E.C.; Lopes, J.A.; Sousa, C. An Overview of the Evolution of Infrared Spectroscopy Applied to Bacterial Typing. Biotechnol. J. 2017, 13. [Google Scholar] [CrossRef]
  11. Kim, S.W.; Min, S.R.; Kim, J.; Park, S.K.; Kim, T.I.; Liu, J.R. Rapid discrimination of commercial strawberry cultivars using Fourier transform infrared spectroscopy data combined by multivariate analysis. Plant Biotechnol. Rep. 2008, 3, 87–93. [Google Scholar] [CrossRef]
  12. Aouidi, F.; Dupuy, N.; Artaud, J.; Roussos, S.; Msallem, M.; Perraud-Gaime, I.; Hamdi, M. Discrimination of five Tunisian cultivars by Mid InfraRed spectroscopy combined with chemometric analyses of olive Olea europaea leaves. Food Chem. 2012, 131, 360–366. [Google Scholar] [CrossRef]
  13. de Oliveira Moura, L.; de Carvalho Lopes, D.; Steidle Neto, A.J.; de Castro Louback Ferraz, L.; de Almeida Carlos, L.; Martins, L.M. Evaluation of Techniques for Automatic Classification of Lettuce Based on Spectral Reflectance. Food Anal. Methods 2015, 9, 1799–1806. [Google Scholar] [CrossRef]
  14. Li, X.l.; Yi, S.l.; He, S.l.; Lv, Q.; Xie, R.j.; Zheng, Y.q.; Deng, L. Identification of pummelo cultivars by using Vis/NIR spectra and pattern recognition methods. Precis. Agric. 2015, 17, 365–374. [Google Scholar] [CrossRef]
  15. Kasampalis, D.S.; Tsouvaltzis, P.; Ntouros, K.; Gertsis, A.; Moshou, D.; Siomos, A.S. Rapid Nondestructive Postharvest Potato Freshness and Cultivar Discrimination Assessment. Appl. Sci. 2021, 11, 2630. [Google Scholar] [CrossRef]
  16. Difante, G.d.S.; Monteiro, G.O.d.A.; Santana, J.C.S.; Frontado, N.E.V.; Rodrigues, J.G.; Chaves, A.R.D.; Santana, D.C.; Oliveira, I.C.d.; Ítavo, L.C.V.; Baio, F.H.R.; et al. Can Different Cultivars of Panicum maximum Be Identified Using a VIS/NIR Sensor and Machine Learning? AgriEngineering 2024, 6, 3739–3751. [Google Scholar] [CrossRef]
  17. Yılmaz-Düzyaman, H.; de la Rosa, R.; Núñez-Sánchez, N.; León, L. Global and Specific NIR Models for Oxidative Stability Prediction and Cultivar Discrimination in Extra Virgin Olive Oil. Horticulturae 2025, 11, 177. [Google Scholar] [CrossRef]
  18. Widodo, S.; Brawijaya, H.; Samudi, S. Stratified K-fold cross validation optimization on machine learning for prediction. Sinkron 2022, 7, 2407–2414. [Google Scholar] [CrossRef]
  19. Sammut, C.; Webb, G.I. Accuracy. In Encyclopedia of Machine Learning and Data Mining; Springer: New York, NY, USA, 2017; p. 8. [Google Scholar] [CrossRef]
  20. Doğan, O. Data Linkage Methods for Big Data Management in Industry 4.0. In Optimizing Big Data Management and Industrial Systems With Intelligent Techniques; IGI Global: Hershey, PA, USA, 2019; pp. 108–127. [Google Scholar] [CrossRef]
  21. Ting, K.M. Precision and Recall. In Encyclopedia of Machine Learning and Data Mining; Springer: New York, NY, USA, 2017; pp. 990–991. [Google Scholar] [CrossRef]
  22. Goutte, C.; Gaussier, E. A Probabilistic Interpretation of Precision, Recall and F-Score, with Implication for Evaluation. In Advances in Information Retrieval; Springer: Berlin/Heidelberg, Germany, 2005; pp. 345–359. [Google Scholar] [CrossRef]
  23. Nahm, F. Receiver operating characteristic curve: Overview and practical use for clinicians. Korean J. Anesthesiol. 2022, 75, 25–36. [Google Scholar] [CrossRef]
  24. Páscoa, R.; Lopo, M.; Teixeira dos Santos, C.; Graça, A.; Lopes, J. Exploratory study on vineyards soil mapping by visible/near-infrared spectroscopy of grapevine leaves. Comput. Electron. Agric. 2016, 127, 15–25. [Google Scholar] [CrossRef]
  25. Kokaly, R. Spectroscopic Determination of Leaf Biochemistry Using Band-Depth Analysis of Absorption Features and Stepwise Multiple Linear Regression. Remote. Sens. Environ. 1999, 67, 267–287. [Google Scholar] [CrossRef]
  26. Curran, P.J. Remote sensing of foliar chemistry. Remote. Sens. Environ. 1989, 30, 271–278. [Google Scholar] [CrossRef]
  27. Bajwa, S.; Rupe, J.; Mason, J. Soybean Disease Monitoring with Leaf Reflectance. Remote. Sens. 2017, 9, 127. [Google Scholar] [CrossRef]
  28. Páscoa, R.N.M.J.; Teixeira, A.M.; Sousa, C. Antioxidant capacity of Camellia japonica cultivars assessed by near- and mid-infrared spectroscopy. Planta 2018, 249, 1053–1062. [Google Scholar] [CrossRef]
  29. Camps, C.; Guillermin, P.; Mauget, J.; Bertrand, D. Discrimination of Storage Duration of Apples Stored in a Cooled Room and Shelf-Life by Visible-Near Infrared Spectroscopy. J. Near Infrared Spectrosc. 2007, 15, 169–177. [Google Scholar] [CrossRef]
  30. Bishop, C.M.; Nasrabadi, N.M. Pattern Recognition and Machine Learning (Information Science and Statistics); Springer: New York, NY, USA, 2006; Volume 4, pp. 591–592. [Google Scholar]
  31. Lee, H.; Battle, A.; Raina, R.; Ng, A. Efficient sparse coding algorithms. In Advances in Neural Information Processing Systems; Schölkopf, B., Platt, J., Hoffman, T., Eds.; MIT Press: Cambridge, MA, USA, 2006; Volume 19. [Google Scholar]
  32. Ying, X. An Overview of Overfitting and its Solutions. J. Physics Conf. Ser. 2019, 1168, 022022. [Google Scholar] [CrossRef]
  33. Deeva, A.; Lazaruk, G.; Pavlovskii, N.; Spiridovich, A.; Reshetnikov, V. Dynamics of photosynthetic pigments content in leaves of Vaccinium corymbosum L. during vegetation. Fiziologia Rastenij i Genetika 2021, 53, 55–62. [Google Scholar] [CrossRef]
Figure 1. The stratified k-fold approach employed for data classification using ML models, per season: (a) fall, (b) winter, and (c) spring.
Foods 14 01428 g001
Figure 2. Data processing and prediction workflow.
Foods 14 01428 g002
Figure 3. Vaccinium leaves mean NIR spectra (Chandler cultivar) of (a) fresh adaxial () and abaxial (—) surfaces; (b) fresh adaxial and (c) fresh abaxial of: spring (), fall (– ·), and winter (— —) leaves from R1 and spring leaves from regions R1 (—) and R2 (— —). Note: Just for illustrative purposes, we separated the NIR spectra by magnitude to effectively show the differences to the naked eye. This separation was necessary because the spectral frequency bins significantly overlap along the wavenumber, making it difficult to distinguish the spectra visually. That is why in the present figure, NIR spectra of different cultivars exhibit higher values compared to those associated with regions.
Foods 14 01428 g003
Figure 4. Vaccinium leaves second derivative [SavGol filter (15, 2, 2)] mean NIR spectra (Chandler cultivar) of (a) fresh adaxial () and abaxial (—) surfaces; (b) fresh adaxial and (c) fresh abaxial of: spring (), fall (– ·), and winter (— —) leaves from R1 and spring leaves from regions R1 (—) and R2 (— —). Note: (1) We zoomed into the 6100–4000 cm−1 region as it provided more differences within the second derivative mean NIR spectra. (2) Just for illustrative purposes, we separated the NIR spectra by magnitude to effectively show the differences to the naked eye. This separation was necessary because the spectral frequency bins significantly overlap along the wavenumber, making it difficult to distinguish the spectra visually. That is why in the present figure, NIR spectra of different cultivars exhibit higher values compared to those associated with regions.
Foods 14 01428 g004
Figure 5. AUC ROC curves obtained with different DDR processes for each season and both sides of the leaves. (a) ROC curve of the adaxial side of the leaf during fall; (b) ROC curve of the abaxial side of the leaf during fall; (c) ROC curve of the adaxial side of the leaf during winter; (d) ROC curve of the abaxial side of the leaf during winter; (e) ROC curve of the adaxial side of the leaf during spring; (f) ROC curve of the abaxial side of the leaf during spring.
Foods 14 01428 g005
Figure 6. Confusion matrices with prediction A c c u r a c y in percentage (%) for the best overall results during fall. (a) Adaxial side of the leaf. (b) Abaxial side of the leaf.
Foods 14 01428 g006aFoods 14 01428 g006b
Figure 7. Confusion matrices with prediction A c c u r a c y in percentage (%) for the best overall results during winter. (a) Adaxial side of the leaf. (b) Abaxial side of the leaf.
Foods 14 01428 g007aFoods 14 01428 g007b
Figure 8. Confusion matrices with prediction A c c u r a c y in percentage (%) for the best overall results during spring. (a) Adaxial side of the leaf. (b) Abaxial side of the leaf.
Foods 14 01428 g008aFoods 14 01428 g008b
Table 1. V. corymbosum leaves collection included in this work.
SpeciesBlueberry TypeCultivarSpring (30th May)Fall (1st September)Winter (1st December)
R1R2R1R1
V. corymbosumNorthernBluecrop2222
Duke2222
Legacy2222
Draper22 2
Chandler2222
Bluejay2
Goldtraube2 22
Huron2 22
Aurora2 22
Liberty2 22
Elliott 2
Patriot 2
Bluegold 2
SouthernCamellia2222
Misty2 22
O’neal2 2
Ozarkblue2 2
Biloxi 2
Star2 2
Table 2. 10 Scikit-learn ML classifier configurations.
ClassifierHyperparameters
AdaBoostClassifier (AdaBoost)Default parameters
BaggingClassifier (BaggC)Default parameters
DecisionTreeClassifier (DeTreeC)max_depth: 5
GaussianNB (GauNB)Default parameters
KNearestNeighborsClassifier (KNN)Default parameters
LinearDiscriminantAnalysis (LinDis)Default parameters
LinearSVC (LinSVC)random_state = 0
LogisticRegression (LogReg)solver: “lbfgs”
QuadraticDiscriminantAnalysis (QuadDis)Default parameters
Support-vector Machines (SVC)γ: “auto”, probability = 1
Table 3. Accuracy and AUC results for each spectra region and for the whole spectrum (per season and leaves side).
DDRI (9920–7275 cm 1 )II (7274–6314 cm 1 )III (6313–5390 cm 1 )IV (5389–4924 cm 1 )V (4923–4073 cm 1 )All Spectrum (9920–4073  cm 1 )
ProcessAUCAccuracyAUCAccuracyAUCAccuracyAUCAccuracyAUCAccuracyAUCAccuracy
Adaxial_FallFast ICA0.881.820.97577.281100168.19190.9181.82
Adaxial_SpringDL0.583340.910.952443.180.6429500.61940.910.571445.450.61952.27
Adaxial_WinterFast ICA0.9833750.983384.38193.750.983378.13196.880.9666784.38
Abaxial_FallFast ICA0.977.270.577.27195.450.72581.82186.360.97590.91
Abaxial_SpringFast ICA0.952434.09152.27170.450.988150159.090.988154.55
Abaxial_WinterFast ICA171.88184.38193.750.7587.51100187.5
Note: Highlighted in green are the best results achieved per season and leaf side, based on the highest A c c u r a c y and A U C values.
Table 4. Best overall results for the best region highlighted in Table 3.
Spectral RegionDDR Process# of Components# of FeaturesClassifierAccuracyPrecisionRecallF1-ScoreAUC
Adaxial_FallIIIFast ICA12140LinSVC1001001001001
Adaxial_SpringAll SpectrumDL15330LinSVC52.2738.5448.4440.630.619
Adaxial_WinterVFast ICA14120LogReg96.8895.3196.8895.831
Abaxial_FallIIIFast ICA10110LogReg95.4593.1895.4593.941
Abaxial_SpringIIIFast ICA13190LinSVC70.4561.4670.3164.691
Abaxial_WinterVFast ICA15190LinSVC1001001001001
Disclaimer/Publisher’s Note: The statements, opinions and data contained in all publications are solely those of the individual author(s) and contributor(s) and not of MDPI and/or the editor(s). MDPI and/or the editor(s) disclaim responsibility for any injury to people or property resulting from any ideas, methods, instructions or products referred to in the content.

