

Comparative Analysis of Polyphenolic Acids from Various Zea mays Parts in Ultrasound-Assisted Extraction


Abstract
1. Introduction
2. Materials and Methods
2.1. Chemicals
2.2. Sample Preparation
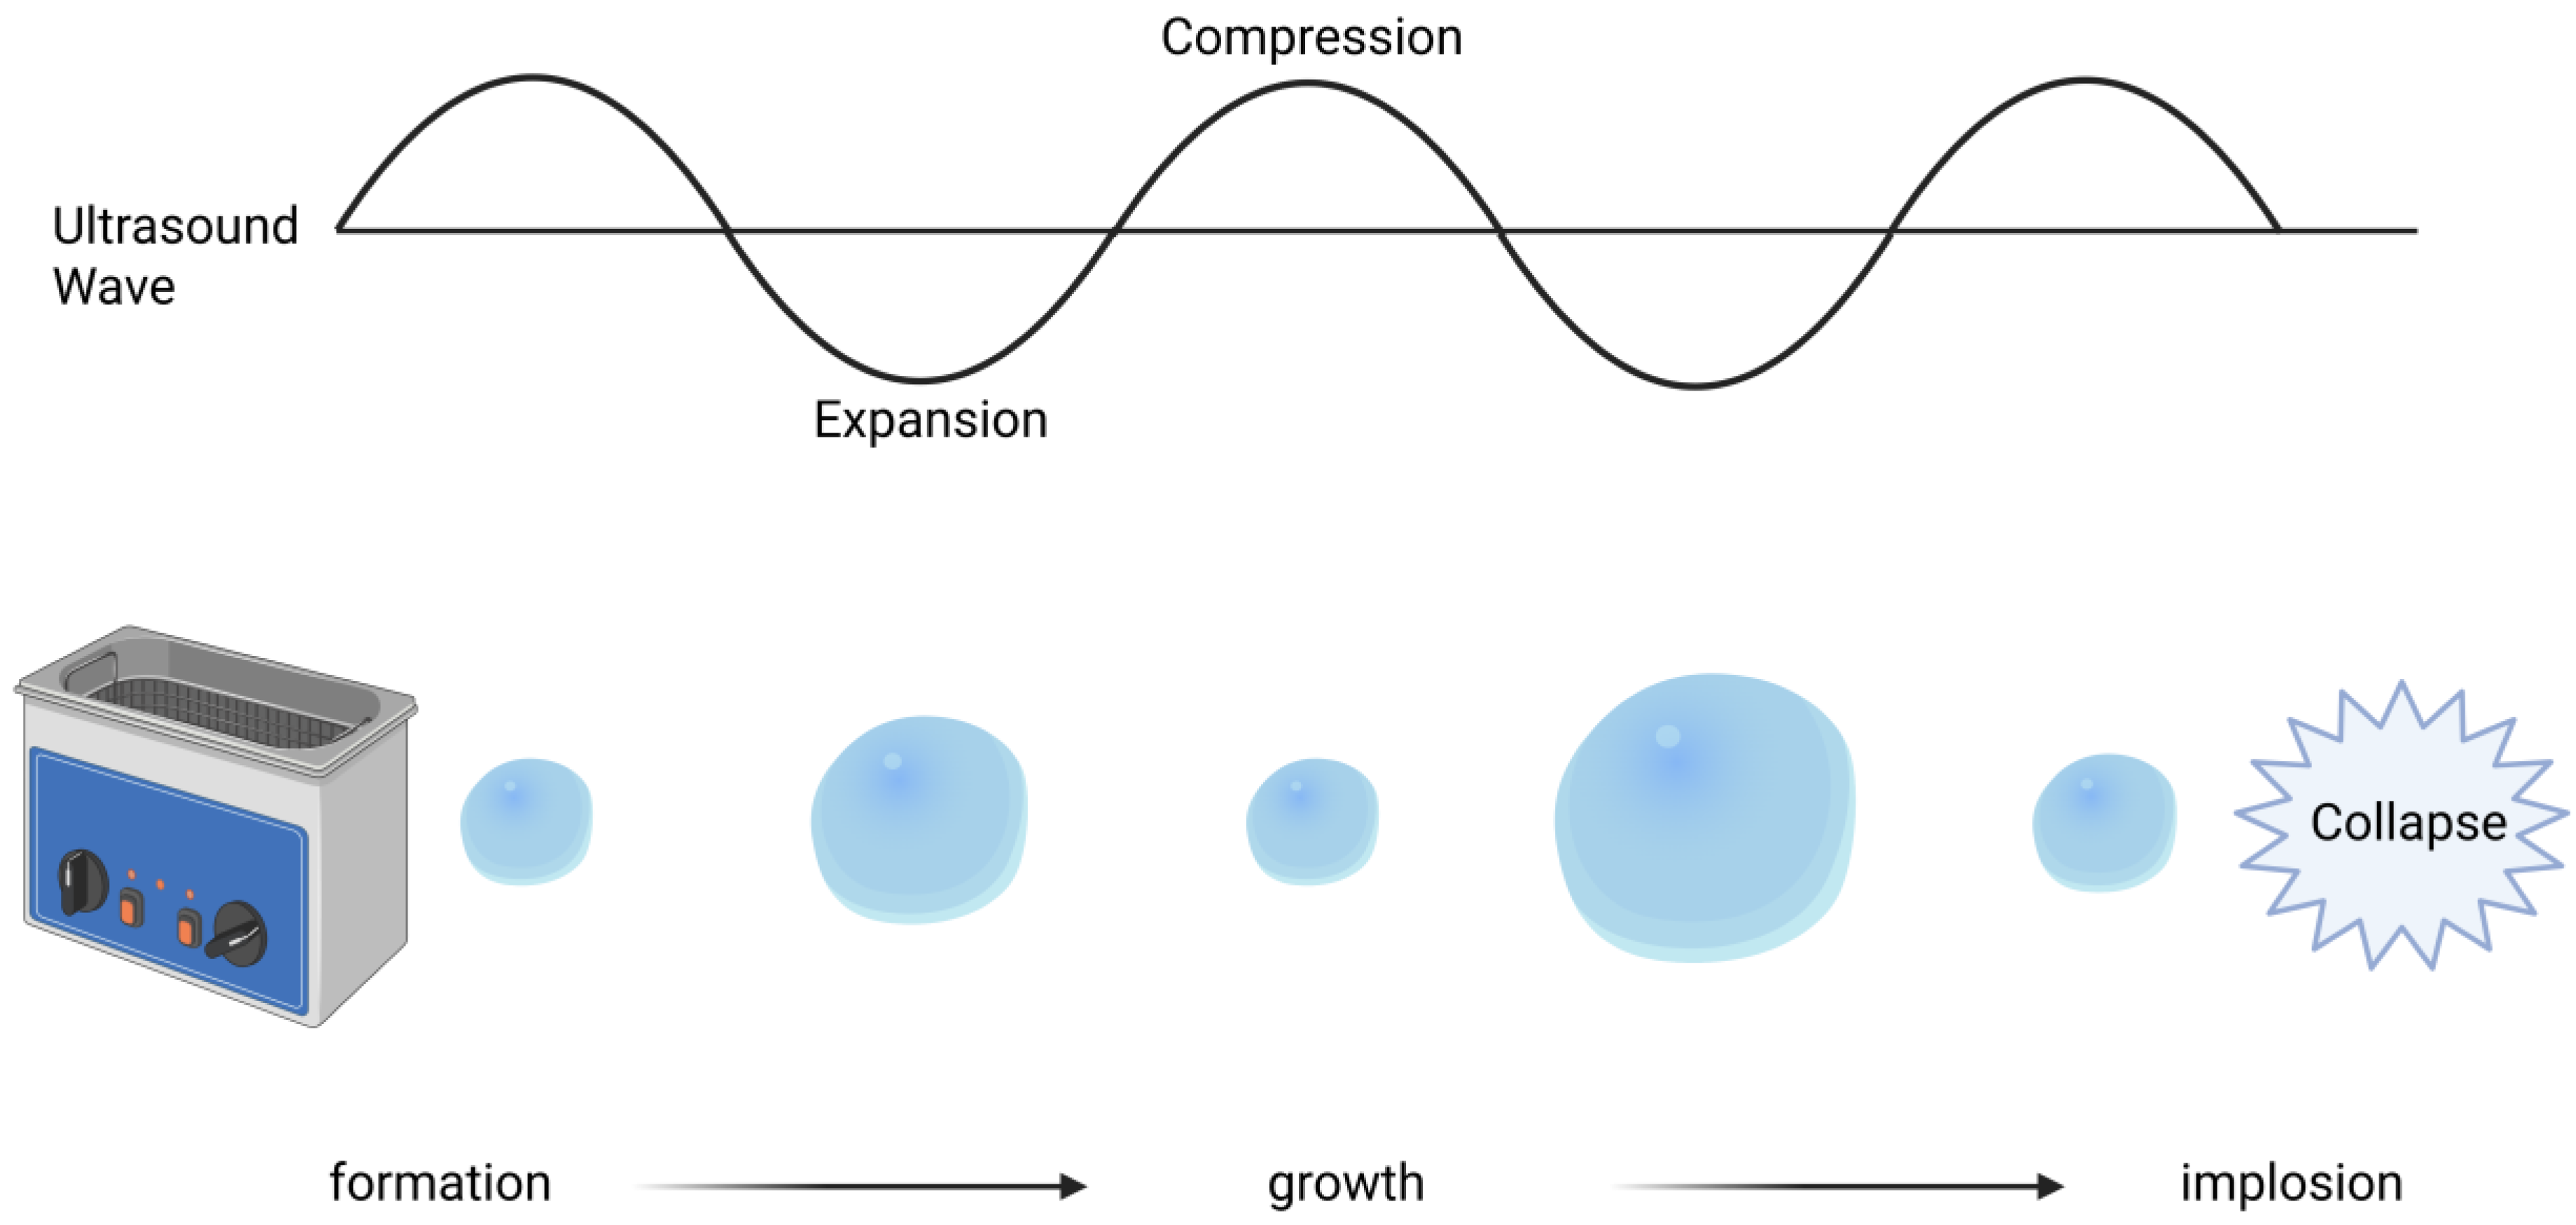
2.3. Ultrasound-Assisted Extraction
2.4. UV–Vis Analysis
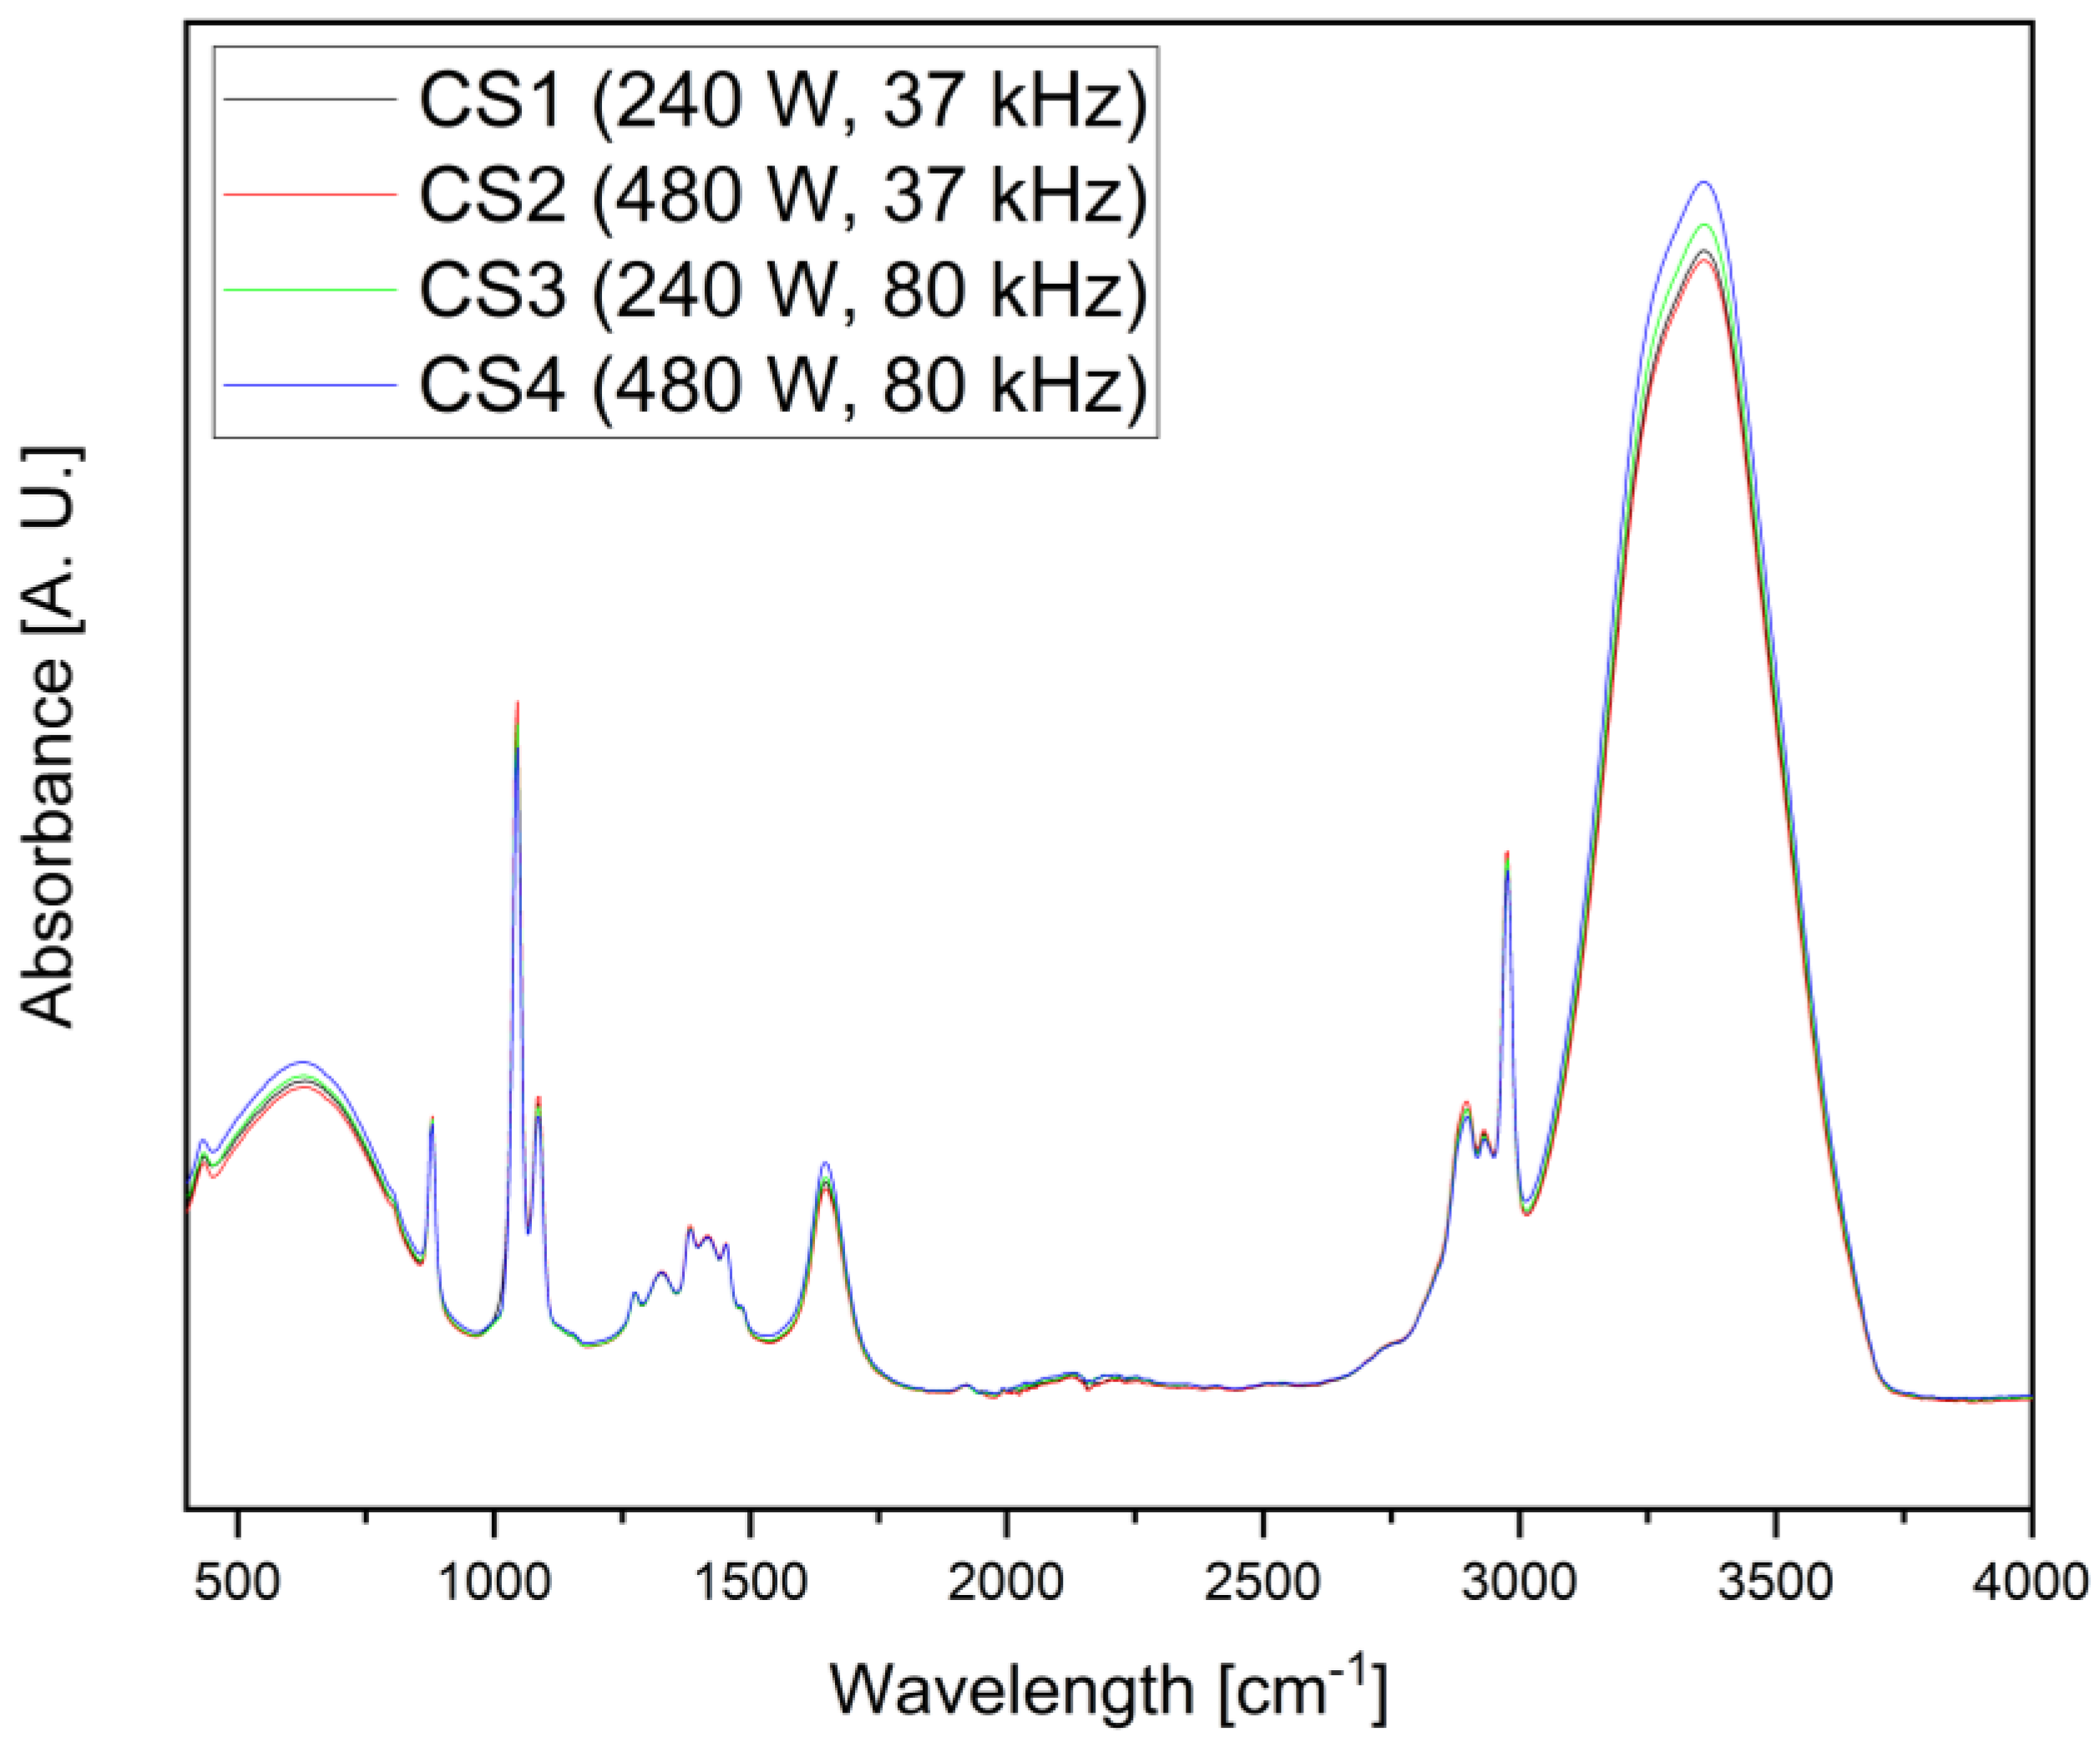
2.5. Attenuated Total Reflectance Analysis
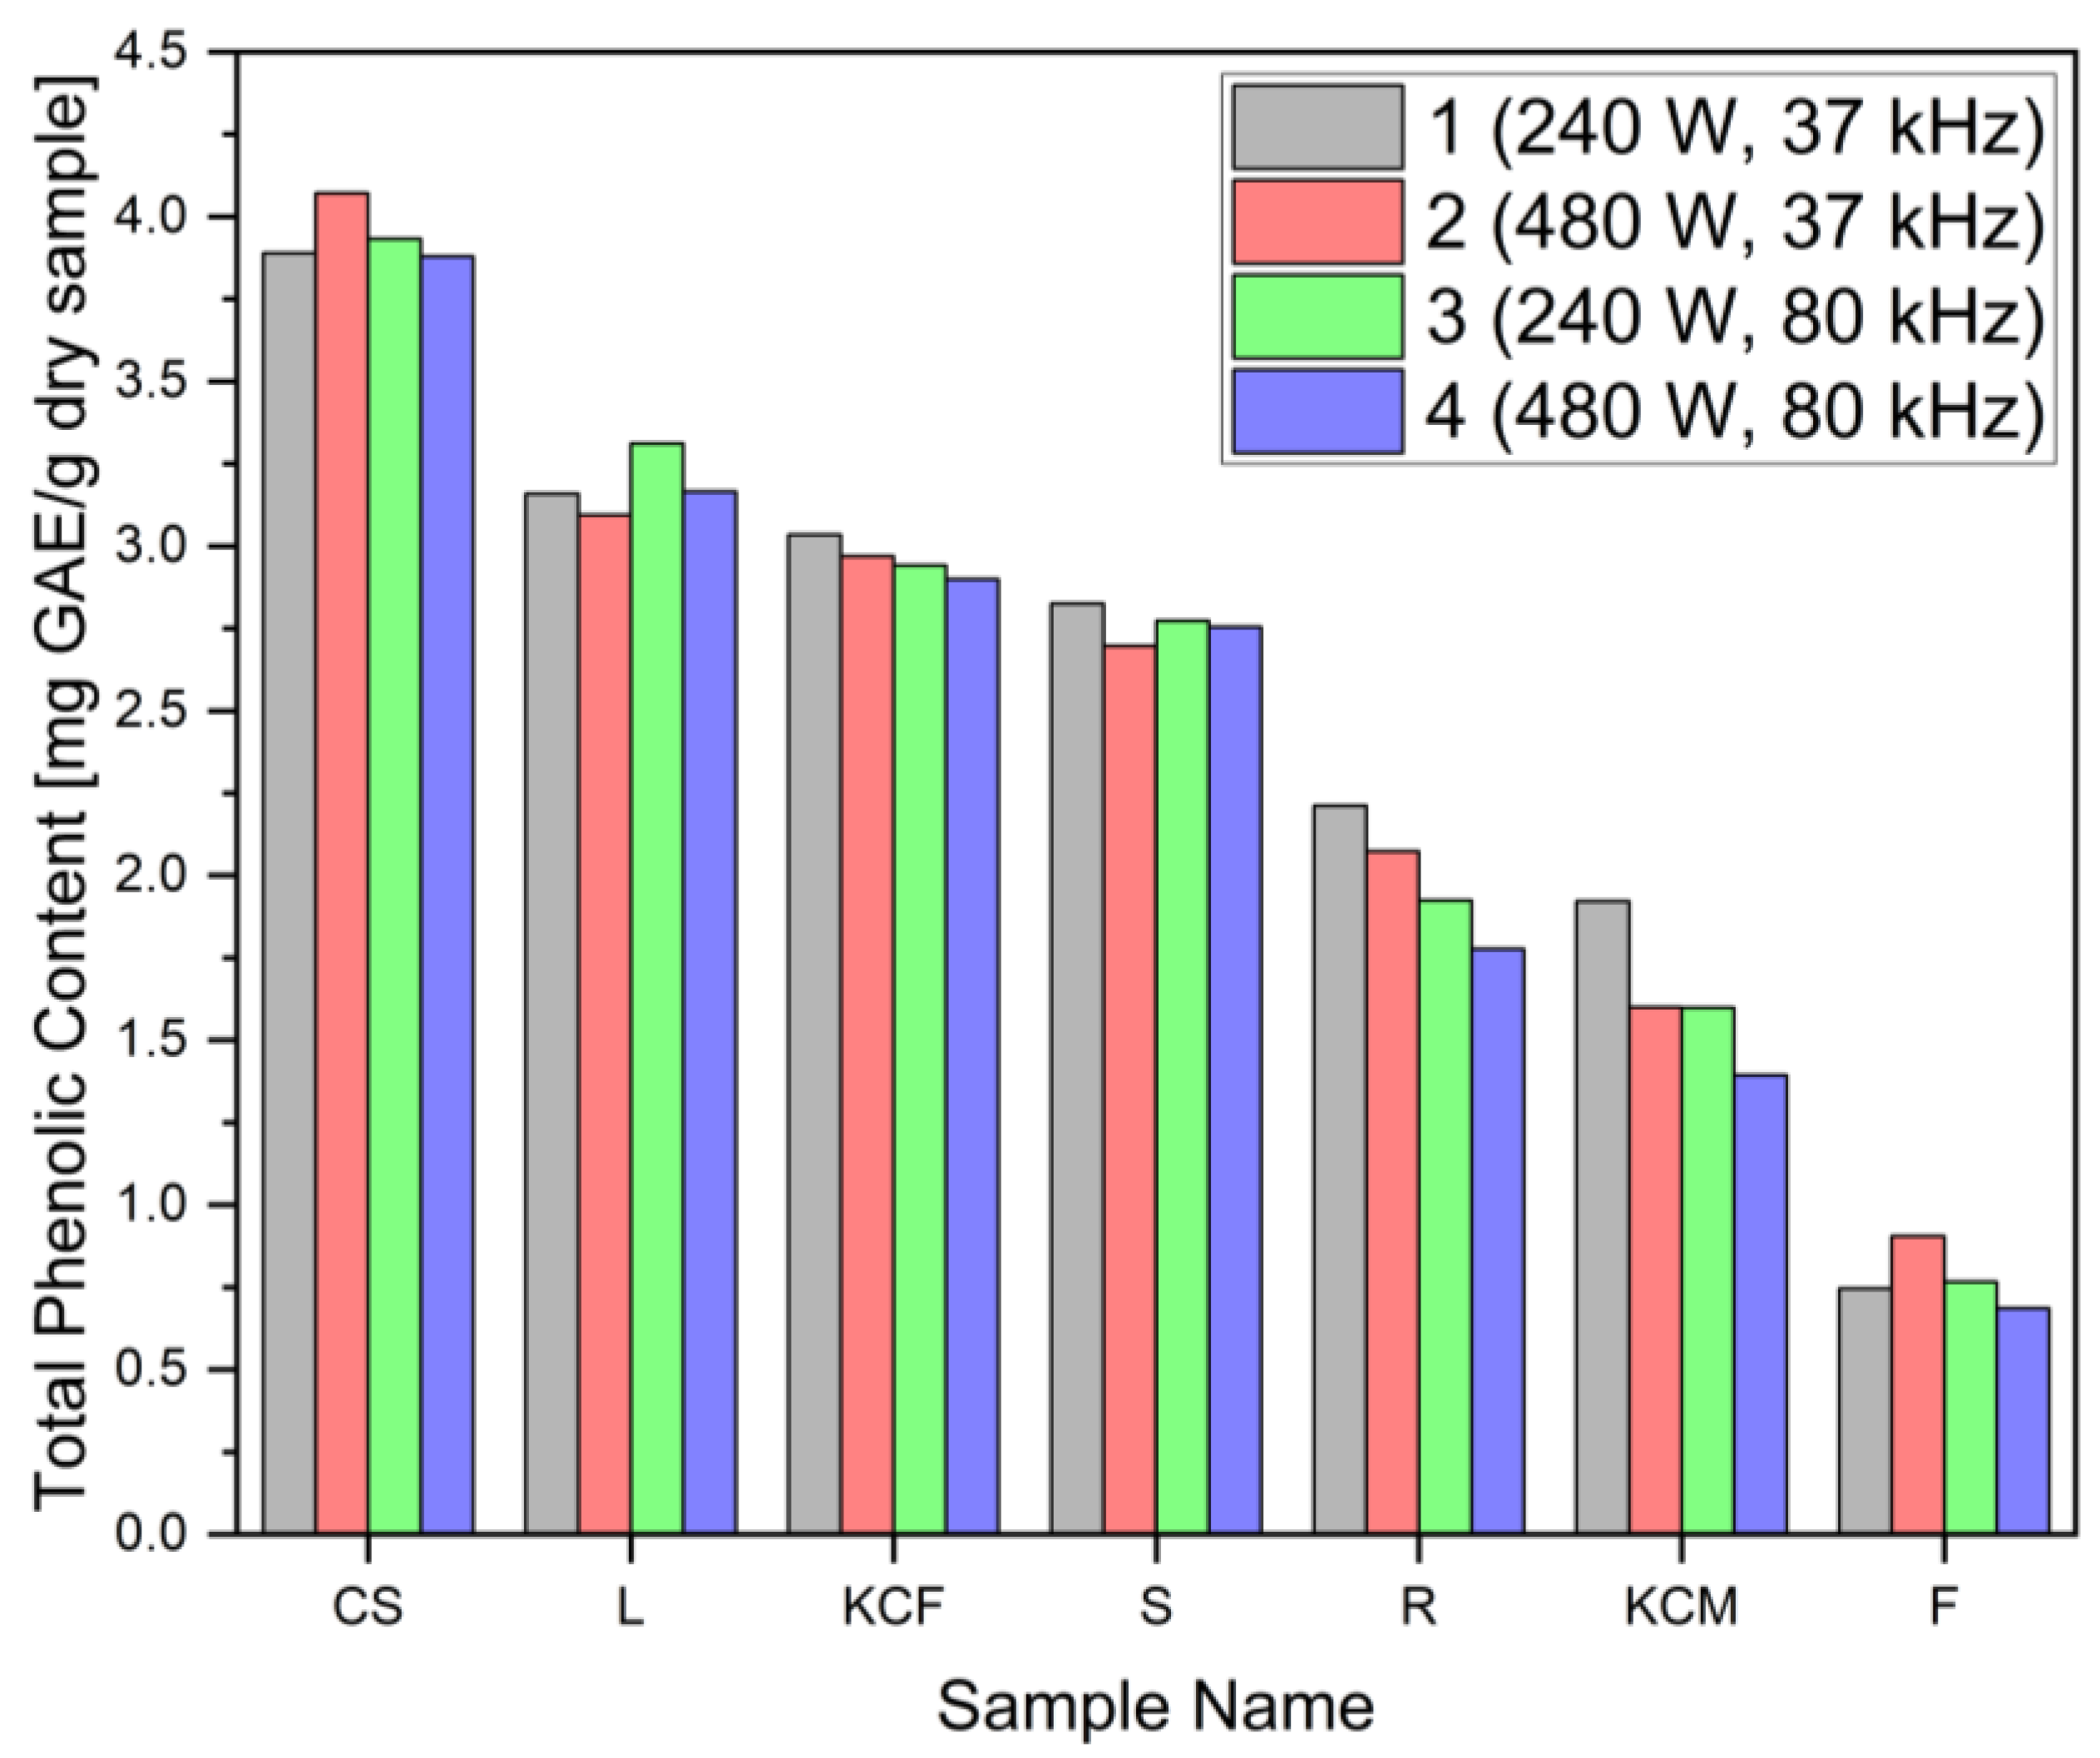
2.6. Total Phenolic Content
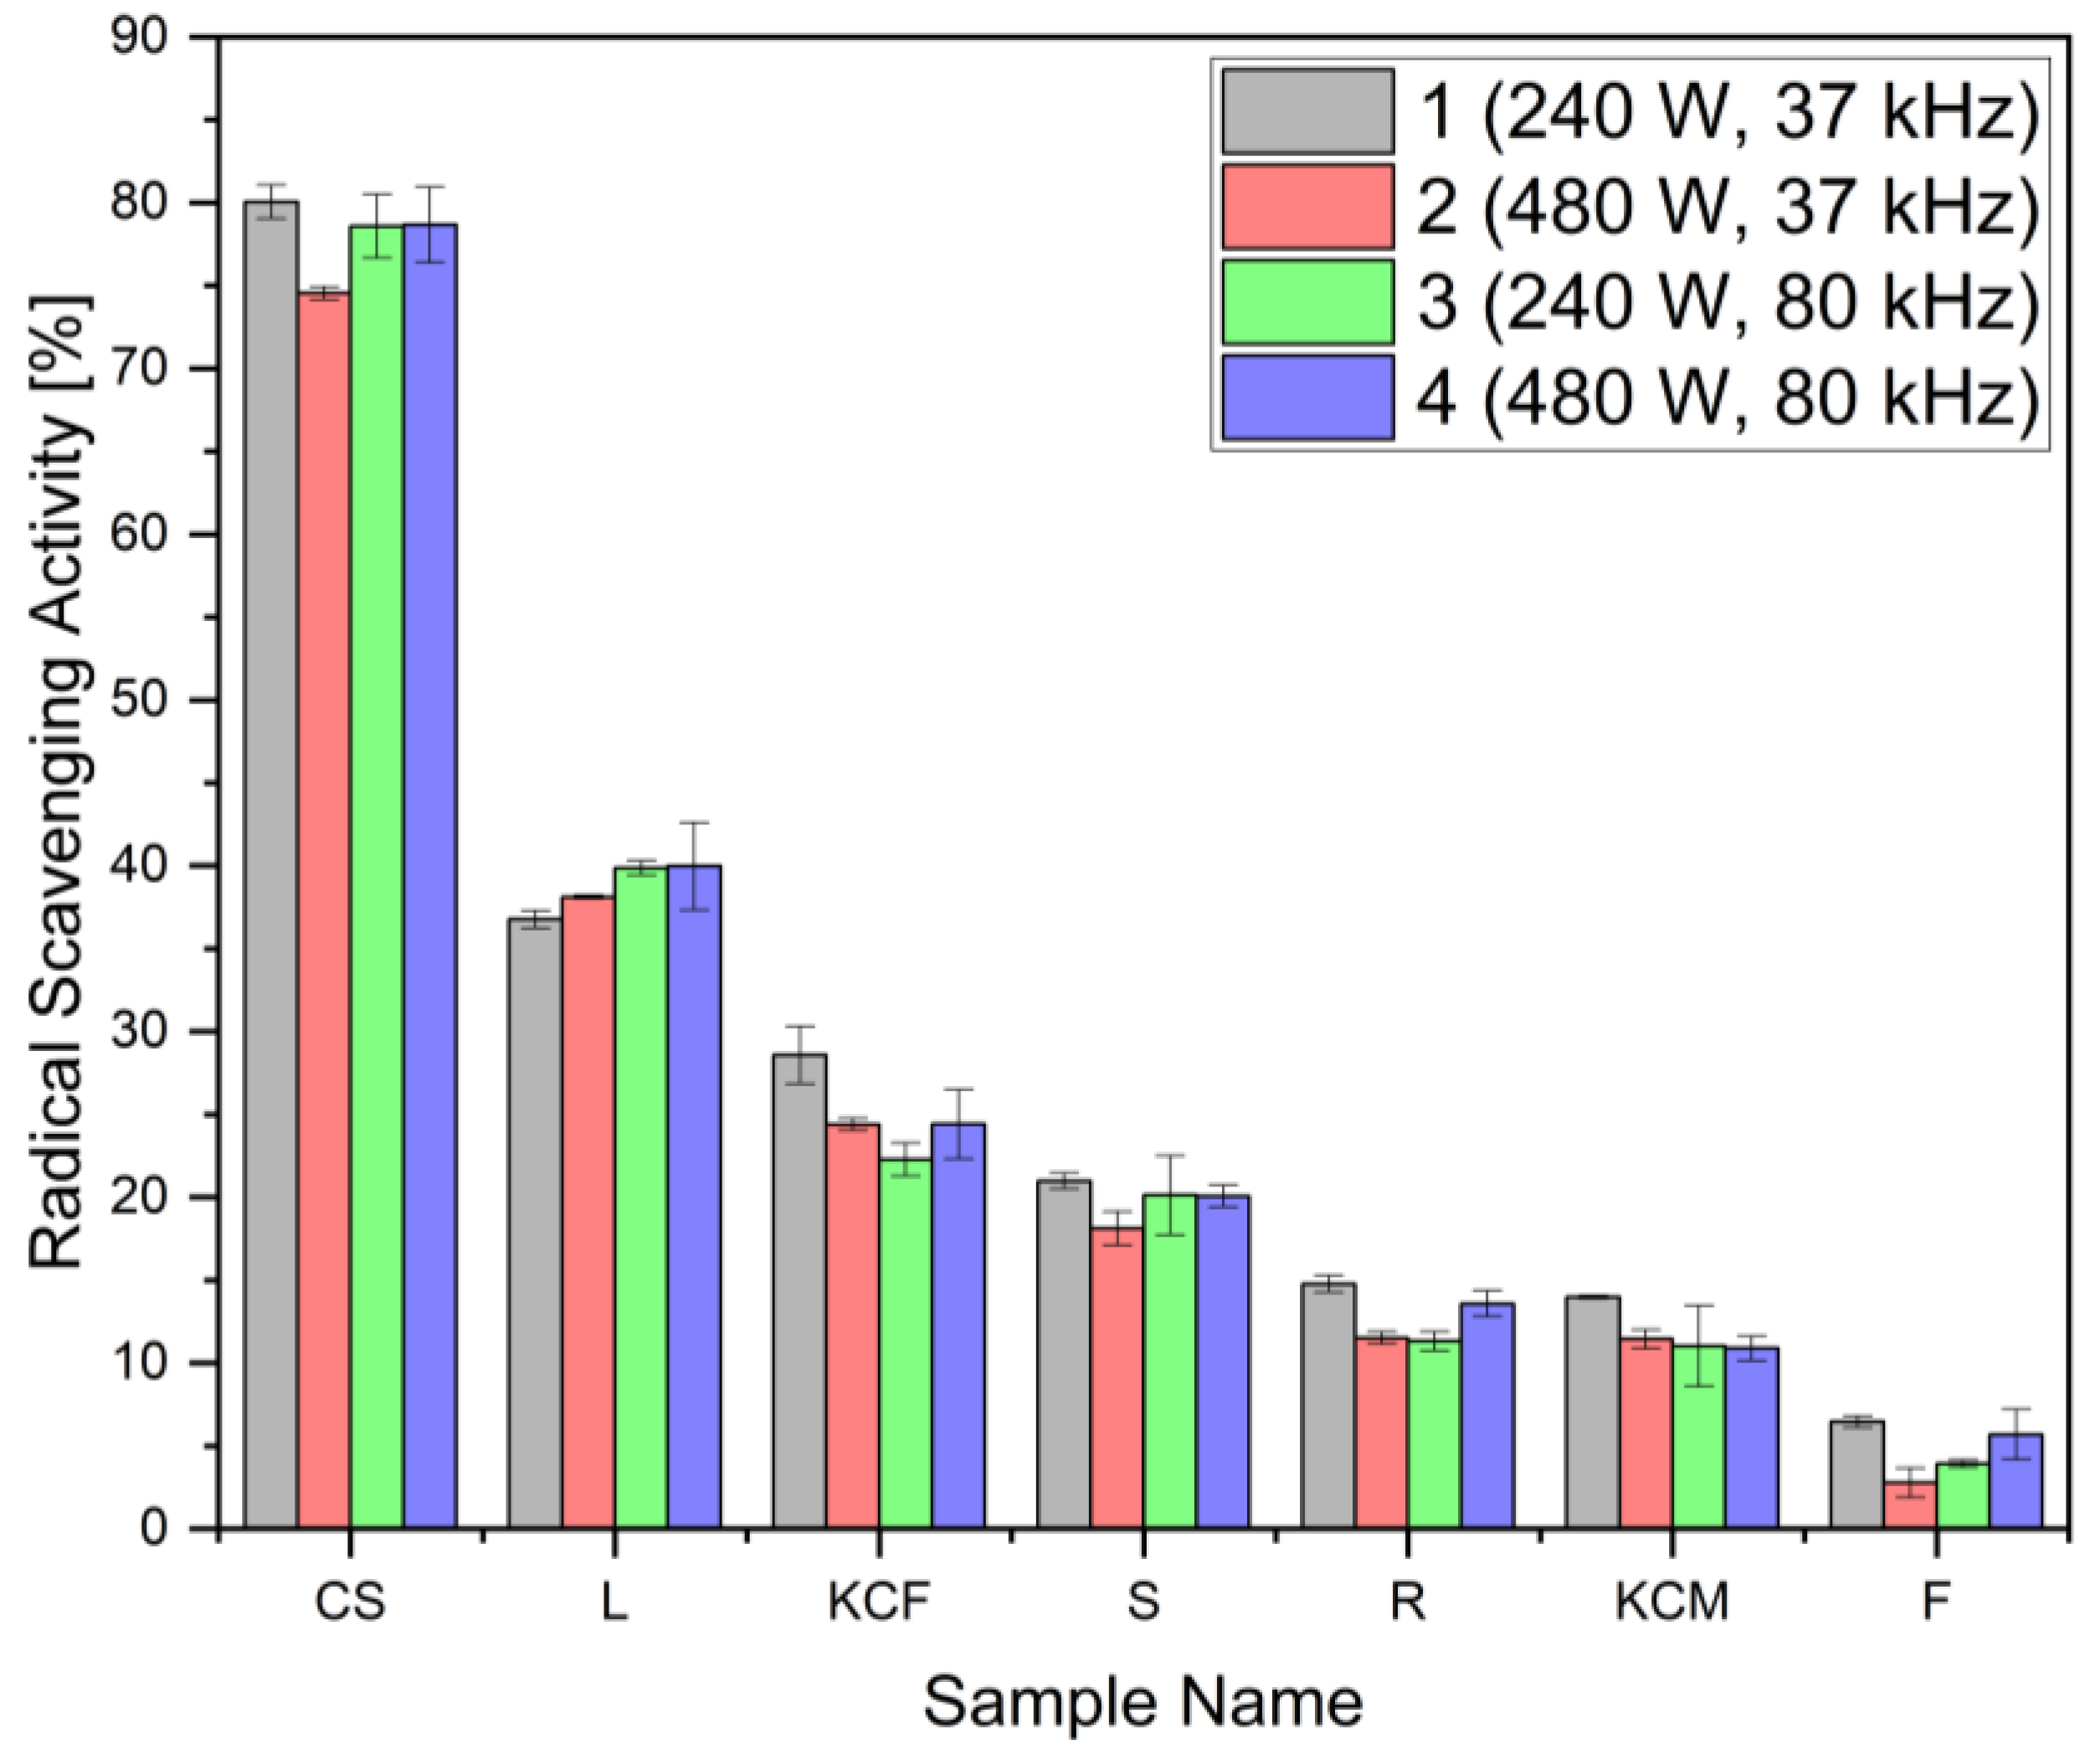
2.7. Radical Scavenging Activity
2.8. HPLC Analysis
2.9. Statistical Analysis
3. Results and Discussion
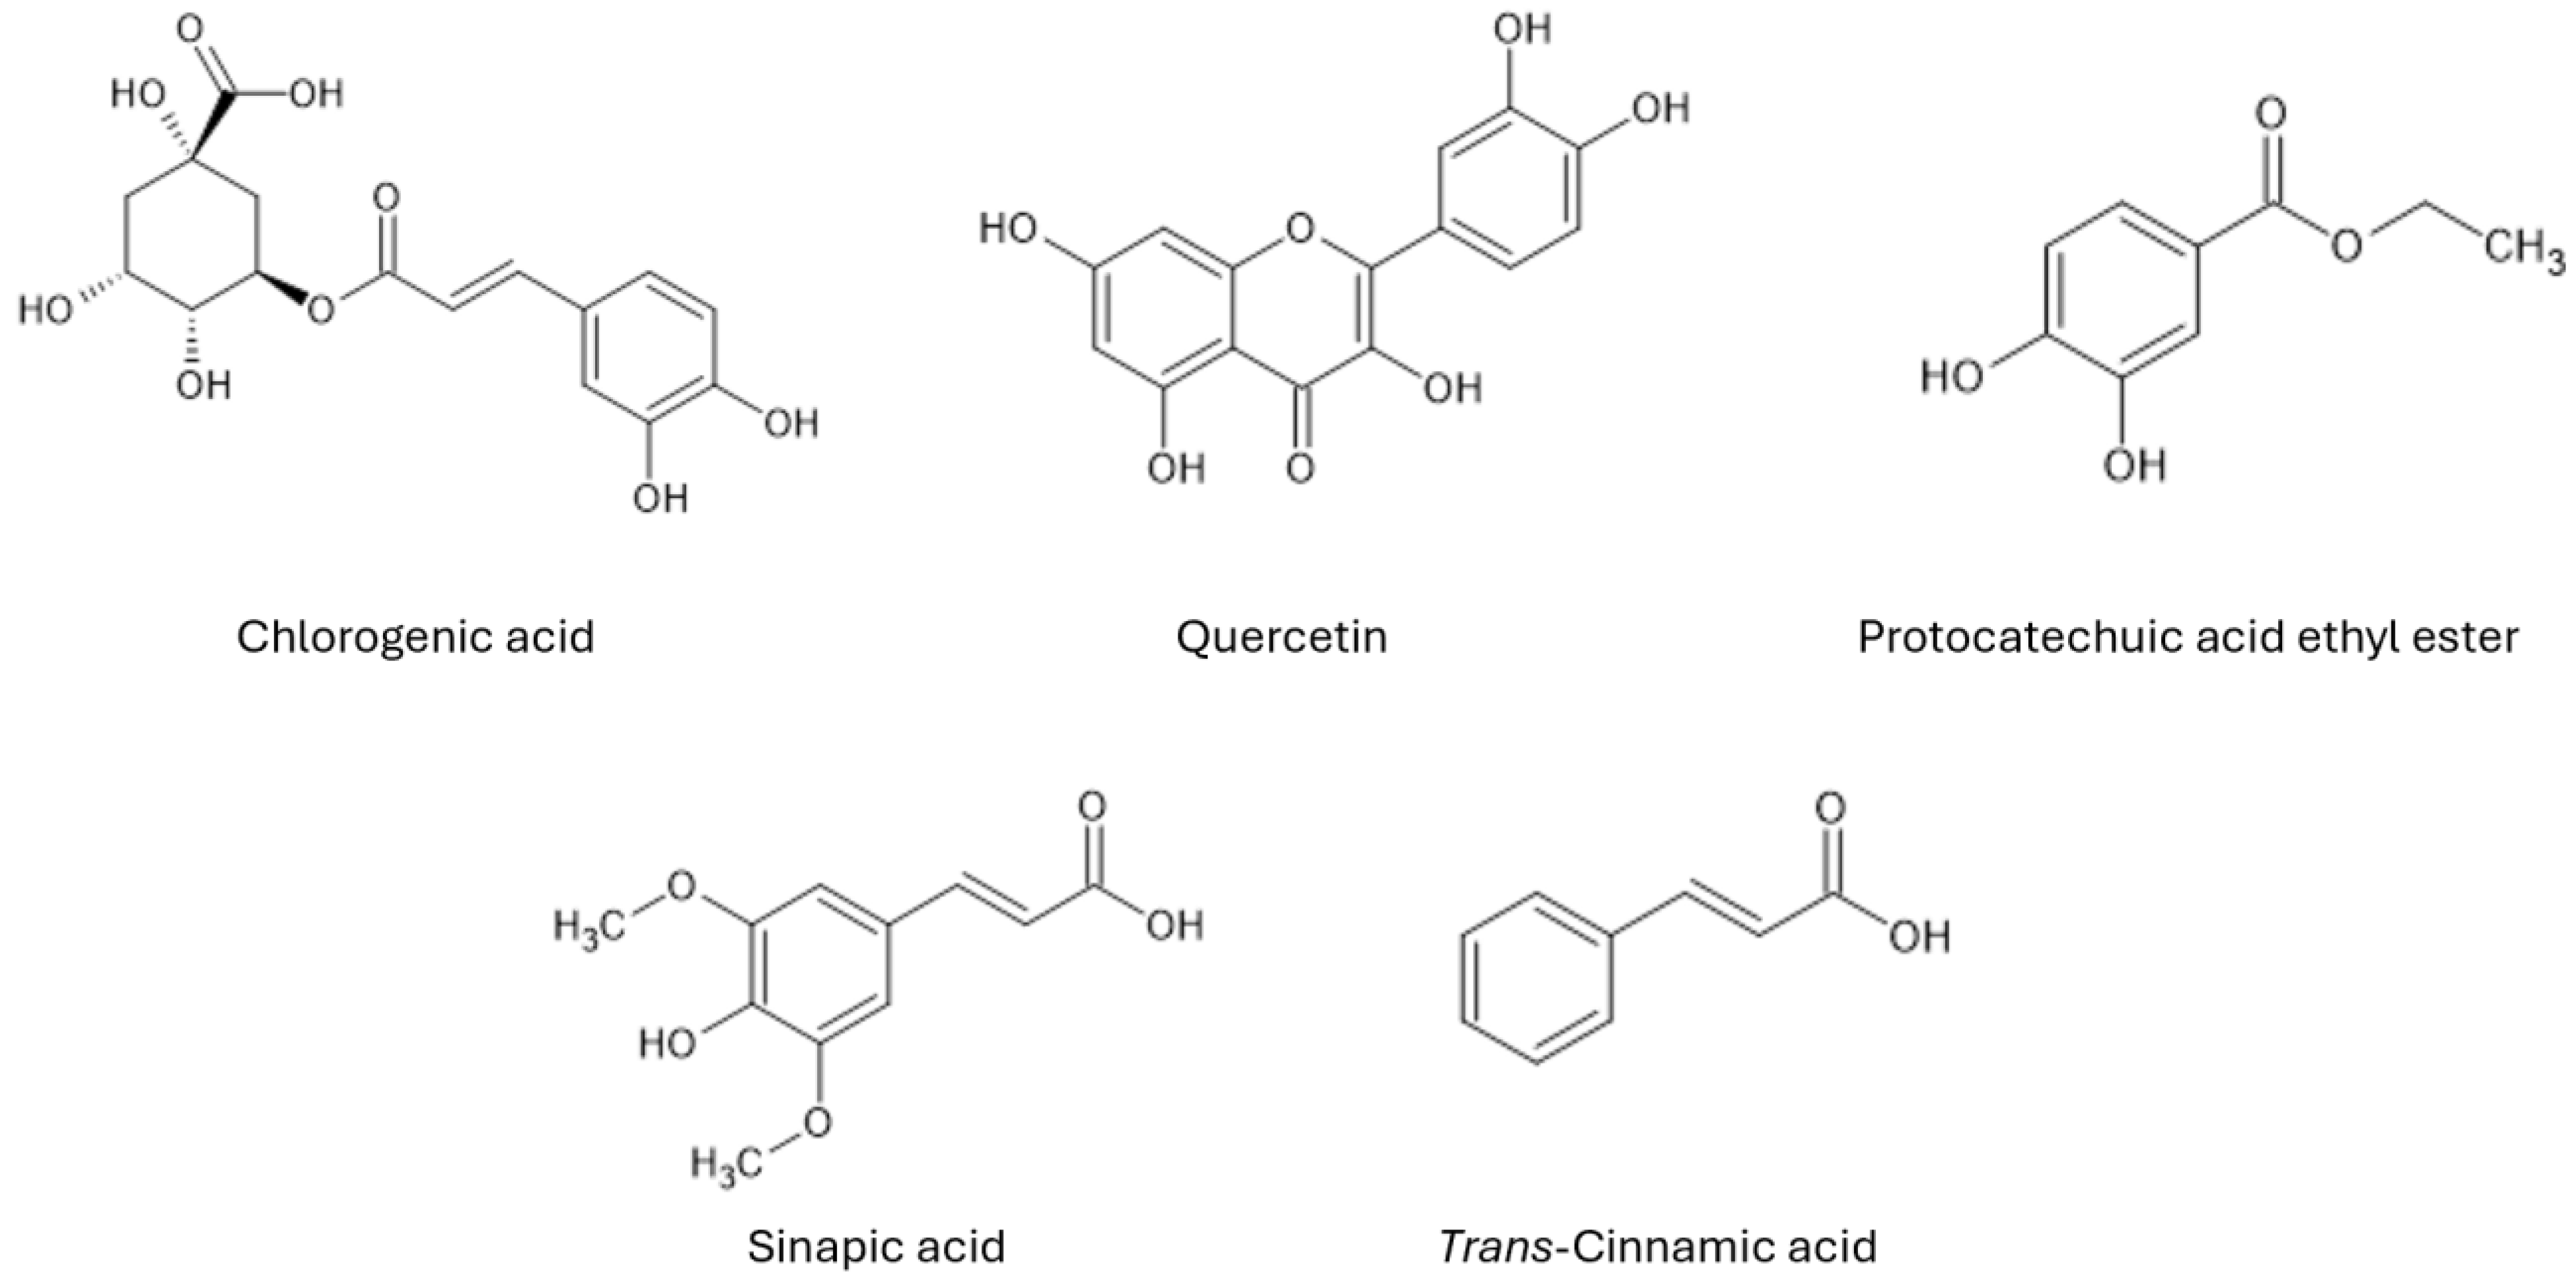
Quantitative and Qualitative Analysis of Polyphenols in Maize Samples
4. Conclusions
Supplementary Materials
Author Contributions
Funding
Data Availability Statement
Acknowledgments
Conflicts of Interest
Abbreviations
| AAE | ascorbic acid equivalent |
| CS | corn silk |
| DPPH | 2,2-Diphenyl-1-picrylhydrazyl |
| F | kernel |
| FCR | Folin–Ciocalteu reagent |
| GAE | gallic acid equivalent |
| KCF | whole fermented plant |
| KCM | whole plant |
| L | leaf |
| R | root |
| ROS | reactive oxygen species |
| RSA | radical scavenging activity |
| S | stem |
| TPC | total phenolic content |
| UAE | ultrasound-assisted extraction |
References
- Corn|USDA Foreign Agricultural Service. Available online: https://www.fas.usda.gov/data/production/commodity/0440000 (accessed on 15 January 2025).
- Corn|History, Cultivation, Uses, & Description|Britannica. Available online: https://www.britannica.com/plant/corn-plant (accessed on 15 January 2025).
- Pellagra: Definition, Symptoms & Treatment. Available online: https://my.clevelandclinic.org/health/diseases/23905-pellagra (accessed on 3 March 2025).
- Samad, N.; Manzoor, N.; Batool, A.; Noor, A.; Khaliq, S.; Aurangzeb, S.; Bhatti, S.A.; Imran, I. Protective Effects of Niacin Following High Fat Rich Diet: An In-Vivo and In-Silico Study. Sci. Rep. 2023, 13, 21343. [Google Scholar] [CrossRef] [PubMed]
- Trofin, D.-M.; Sardaru, D.-P.; Trofin, D.; Onu, I.; Tutu, A.; Onu, A.; Onită, C.; Galaction, A.I.; Matei, D.V. Oxidative Stress in Brain Function. Antioxidants 2025, 14, 297. [Google Scholar] [CrossRef]
- Tang, K.; Sham, H.; Hui, E.; Kirkland, J.B. Niacin Deficiency Causes Oxidative Stress in Rat Bone Marrow Cells but Not through Decreased NADPH or Glutathione Status. J. Nutr. Biochem. 2008, 19, 746–753. [Google Scholar] [CrossRef] [PubMed]
- Zhu, Y.; Wang, K.; Jia, X.; Fu, C.; Yu, H.; Wang, Y. Antioxidant Peptides, the Guardian of Life from Oxidative Stress. Med. Res. Rev. 2023, 44, 275–364. [Google Scholar] [CrossRef]
- Więdłocha, M.; Zborowska, N.; Marcinowicz, P.; Dębowska, W.; Dębowska, M.; Zalewska, A.; Maciejczyk, M.; Waszkiewicz, N.; Szulc, A. Oxidative Stress Biomarkers among Schizophrenia Inpatients. Brain Sci. 2023, 13, 490. [Google Scholar] [CrossRef]
- Orfali, R.; Alwatban, A.Z.; Orfali, R.S.; Lau, L.; Chea, N.; Alotaibi, A.M.; Nam, Y.W.; Zhang, M. Oxidative Stress and Ion Channels in Neurodegenerative Diseases. Front. Physiol. 2024, 15, 1320086. [Google Scholar] [CrossRef]
- Amponsah-Offeh, M.; Diaba-Nuhoho, P.; Speier, S.; Morawietz, H. Oxidative Stress, Antioxidants and Hypertension. Antioxidants 2023, 12, 281. [Google Scholar] [CrossRef]
- Abbas, M.; Saeed, F.; Anjum, F.M.; Afzaal, M.; Tufail, T.; Bashir, M.S.; Ishtiaq, A.; Hussain, S.; Suleria, H.A.R. Natural Polyphenols: An Overview. Int. J. Food Prop. 2017, 20, 1689–1699. [Google Scholar] [CrossRef]
- Mandal, M.K.; Domb, A.J. Antimicrobial Activities of Natural Bioactive Polyphenols. Pharmaceutics 2024, 16, 718. [Google Scholar] [CrossRef]
- Li, Z.; Kanwal, R.; Yue, X.; Li, M.; Xie, A. Polyphenols and Intestinal Microorganisms: A Review of Their Interactions and Effects on Human Health. Food Biosci. 2024, 62, 105220. [Google Scholar] [CrossRef]
- Kim, Y.; Keogh, J.B.; Clifton, P.M. Polyphenols and Glycemic Control. Nutrients 2016, 8, 17. [Google Scholar] [CrossRef] [PubMed]
- Ciupei, D.; Colişar, A.; Leopold, L.; Stănilă, A.; Diaconeasa, Z.M. Polyphenols: From Classification to Therapeutic Potential and Bioavailability. Foods 2024, 13, 4131. [Google Scholar] [CrossRef] [PubMed]
- Jomova, K.; Alomar, S.Y.; Valko, R.; Liska, J.; Nepovimova, E.; Kuca, K.; Valko, M. Flavonoids and Their Role in Oxidative Stress, Inflammation, and Human Diseases. Chem.-Biol. Interact. 2025, 413, 111489. [Google Scholar] [CrossRef]
- Bouyahya, A.; Omari, N.E.; Hachlafi, N.E.; Jemly, M.E.; Hakkour, M.; Balahbib, A.; Menyiy, N.E.; Bakrim, S.; Mrabti, H.N.; Khouchlaa, A.; et al. Chemical Compounds of Berry-Derived Polyphenols and Their Effects on Gut Microbiota, Inflammation, and Cancer. Molecules 2022, 27, 3286. [Google Scholar] [CrossRef]
- Pap, N.; Fidelis, M.; Azevedo, L.; Do Carmo, M.A.V.; Wang, D.; Mocan, A.; Pereira, E.P.R.; Xavier-Santos, D.; Sant’Ana, A.S.; Yang, B.; et al. Berry Polyphenols and Human Health: Evidence of Antioxidant, Anti-Inflammatory, Microbiota Modulation, and Cell-Protecting Effects. Curr. Opin. Food Sci. 2021, 42, 167–186. [Google Scholar] [CrossRef]
- Wan, C.; Langyan, S.; Echeverría, J.; Devkota, H.P.; Tewari, D.; Moosavi, M.A.; Ezzat, S.M.; Perez-Vazquez, A.; Fraga-Corral, M.; Cravotto, G.; et al. Edible Fruits and Berries as a Source of Functional Polyphenols: Current Scene and Future Perspectives. Phytochem. Rev. 2023. [Google Scholar] [CrossRef]
- Pérez-Jiménez, J.; Neveu, V.; Vos, F.; Scalbert, A. Identification of the 100 Richest Dietary Sources of Polyphenols: An Application of the Phenol-Explorer Database. Eur. J. Clin. Nutr. 2010, 64, S112–S120. [Google Scholar] [CrossRef]
- Sánchez-Nuño, Y.A.; Zermeño-Ruiz, M.; Vázquez-Paulino, O.D.; Nuño, K.; Villarruel-López, A. Bioactive Compounds from Pigmented Corn (Zea mays L.) and Their Effect on Health. Biomolecules 2024, 14, 338. [Google Scholar] [CrossRef]
- Feregrino-Pérez, A.A.; Mercado-Luna, A.; Murillo-Cárdenas, C.A.; González-Santos, R.; Chávez-Servín, J.L.; Vargas-Madriz, A.F.; Luna-Sánchez, E. Polyphenolic Compounds and Antioxidant Capacity in Native Maize of the Sierra Gorda of Querétaro. Agronomy 2024, 14, 142. [Google Scholar] [CrossRef]
- Liu, Y.; Shi, Y.; Zhang, M.; Han, F.; Liao, W.; Duan, X. Natural Polyphenols for Drug Delivery and Tissue Engineering Construction: A Review. Eur. J. Med. Chem. 2024, 266, 116141. [Google Scholar] [CrossRef]
- El-Saadony, M.T.; Yang, T.; Saad, A.M.; Alkafaas, S.S.; Elkafas, S.S.; Eldeeb, G.S.; Mohammed, D.M.; Salem, H.M.; Korma, S.A.; Loutfy, S.A.; et al. Polyphenols: Chemistry, Bioavailability, Bioactivity, Nutritional Aspects and Human Health Benefits: A Review. Int. J. Biol. Macromol. 2024, 277, 134223. [Google Scholar] [CrossRef] [PubMed]
- Parcheta, M.; Swisłocka, R.; Orzechowska, S.; Akimowicz, M.; Nska, R.C.; Lewandowski, W.; Batista, K.A.; Fernandes, K.F. Recent Developments in Effective Antioxidants: The Structure and Antioxidant Properties. Materials 2021, 14, 1984. [Google Scholar] [CrossRef] [PubMed]
- Zahra, M.; Abrahamse, H.; George, B.P. Flavonoids: Antioxidant Powerhouses and Their Role in Nanomedicine. Antioxidants 2024, 13, 922. [Google Scholar] [CrossRef]
- Fukui, K.; You, F.; Kato, Y.; Yuzawa, S.; Kishimoto, A.; Hara, T.; Kanome, Y.; Harakawa, Y.; Yoshikawa, T. A Blended Vitamin Supplement Improves Spatial Cognitive and Short-Term Memory in Aged Mice. Int. J. Mol. Sci. 2024, 25, 2804. [Google Scholar] [CrossRef] [PubMed]
- Mao, S.; Wang, K.; Lei, Y.; Yao, S.; Lu, B.; Huang, W. Antioxidant Synergistic Effects of Osmanthus Fragrans Flowers with Green Tea and Their Major Contributed Antioxidant Compounds. Sci. Rep. 2017, 7, 46501. [Google Scholar] [CrossRef]
- Chakraborty, S.; Bhattacharjee, P. Ultrasonication-Assisted Extraction of a Phytomelatonin-Rich, Erucic Acid-Lean Nutraceutical Supplement from Mustard Seeds: An Antioxidant Synergy in the Extract by Reductionism. J. Food Sci. Technol. 2020, 57, 1278–1289. [Google Scholar] [CrossRef]
- Neacșu, S.M.; Mititelu, M.; Ozon, E.A.; Musuc, A.M.; Iuga, I.D.M.; Manolescu, B.N.; Petrescu, S.; Pandele Cusu, J.; Rusu, A.; Surdu, V.-A.; et al. Comprehensive Analysis of Novel Synergistic Antioxidant Formulations: Insights into Pharmacotechnical, Physical, Chemical, and Antioxidant Properties. Pharmaceuticals 2024, 17, 690. [Google Scholar] [CrossRef]
- Peng, S.; Zhu, M.; Li, S.; Ma, X.; Hu, F. Ultrasound-Assisted Extraction of Polyphenols from Chinese Propolis. Front. Sustain. Food Syst. 2023, 7, 1131959. [Google Scholar] [CrossRef]
- Zafra-Rojas, Q.Y.; Cruz-Cansino, N.S.; Quintero-Lira, A.; Gómez-Aldapa, C.A.; Alanís-García, E.; Cervantes-Elizarrarás, A.; Güemes-Vera, N.; Ramírez-Moreno, E. Application of Ultrasound in a Closed System: Optimum Condition for Antioxidants Extraction of Blackberry (Rubus fructicosus) Residues. Molecules 2016, 21, 950. [Google Scholar] [CrossRef]
- Siddiqui, S.A.; Redha, A.A.; Salauddin, M.; Harahap, I.A.; Rupasinghe, H.P.V. Factors Affecting the Extraction of (Poly)Phenols from Natural Resources Using Deep Eutectic Solvents Combined with Ultrasound-Assisted Extraction. Crit. Rev. Anal. Chem. 2023, 55, 139–160. [Google Scholar] [CrossRef]
- Zeković, Z.; Bušić, A.; Komes, D.; Vladić, J.; Adamović, D.; Pavlić, B. Coriander Seeds Processing: Sequential Extraction of Non-Polar and Polar Fractions Using Supercritical Carbon Dioxide Extraction and Ultrasound-Assisted Extraction. Food Bioprod. Process. 2015, 95, 218–227. [Google Scholar] [CrossRef]
- Thangaiah, A.; Gunalan, S.; Rathnasamy, V.K.; Aruliah, R.; AlSalhi, M.S.; Devanesan, S.; Rajamohan, R.; Malik, T. Optimization of Ultrasound-Assisted Phytomolecules Extraction from Moringa Leaves (Moringa oleifera Lam) Using Response Surface Methodology. Cogent Food Agric. 2024, 10, 2309834. [Google Scholar] [CrossRef]
- Senrayan, J.; Venkatachalam, S. Ultrasonic Acoustic-Cavitation as a Novel and Emerging Energy Efficient Technique for Oil Extraction from Kapok Seeds. Innov. Food Sci. Emerg. Technol. 2020, 62, 102347. [Google Scholar] [CrossRef]
- Dalmau, E.; Rosselló, C.; Eim, V.; Ratti, C.; Simal, S. Ultrasound-Assisted Aqueous Extraction of Biocompounds from Orange Byproduct: Experimental Kinetics and Modeling. Antioxidants 2020, 9, 352. [Google Scholar] [CrossRef]
- Thiruvalluvan, M.; Gupta, R.; Kaur, B.P. Optimization of Ultrasound-Assisted Extraction Conditions for the Recovery of Phenolic Compounds from Sweet Lime Peel Waste. Biomass Convers. Biorefinery 2024, 15, 6781–6803. [Google Scholar] [CrossRef]
- Luque-Alcaraz, A.G.; Hernández-Téllez, C.N.; Graciano-Verdugo, A.Z.; Toledo-Guillén, A.R.; Hernández-Abril, P.A. Exploring Antioxidant Potential and Phenolic Compound Extraction from Vitis vinifera L. Using Ultrasound-Assisted Extraction. Green Process. Synth. 2024, 13, 20230141. [Google Scholar] [CrossRef]
- Zia, S.; Khan, M.R.; Aadil, R.M.; Medina-Meza, I.G. Bioactive Recovery from Watermelon Rind Waste Using Ultrasound-Assisted Extraction. ACS Food Sci. Technol. 2024, 4, 687–699. [Google Scholar] [CrossRef]
- Kumar, G.; Jayasree, T.J.; Rout, R.K.; Rao, P.S.; Manchikanti, P. Ultrasound Assisted Green Extraction of Phenolic Components from Basella alba. J. Food Meas. Charact. 2024, 18, 5904–5915. [Google Scholar] [CrossRef]
- Christou, A.; Parisis, N.A.; Tzakos, A.G.; Gerothanassis, I.P.; Goulas, V. Optimization of β-Cyclodextrin Based Ultrasound-Assisted Extraction: A Green Strategy to Enhance the Extraction of Bioactive Compounds from Taro Leaf Byproduct. Sustain. Chem. Pharm. 2024, 41, 101728. [Google Scholar] [CrossRef]
- Sawangwong, W.; Kiattisin, K.; Somwongin, S.; Wongrattanakamon, P.; Chaiyana, W.; Poomanee, W.; Sainakham, M. The Assessment of Composition, Biological Properties, Safety and Molecular Docking of Corn Silk (Zea mays L.) Extracts from the Valorization of Agricultural Waste Products in Thailand. Ind. Crops Prod. 2024, 212, 118352. [Google Scholar] [CrossRef]
- Boateng, I.D.; Kumar, R.; Daubert, C.R.; Flint-Garcia, S.; Mustapha, A.; Kuehnel, L.; Agliata, J.; Li, Q.; Wan, C.; Somavat, P. Sonoprocessing Improves Phenolics Profile, Antioxidant Capacity, Structure, and Product Qualities of Purple Corn Pericarp Extract. Ultrason. Sonochemistry 2023, 95, 106418. [Google Scholar] [CrossRef] [PubMed]
- Molole, G.J.; Gure, A.; Abdissa, N. Determination of Total Phenolic Content and Antioxidant Activity of Commiphora mollis (Oliv.) Engl. Resin. BMC Chem. 2022, 16, 48. [Google Scholar] [CrossRef] [PubMed]
- Lozano-Sánchez, J.; Borrás-Linares, I.; Sass-Kiss, A.; Segura-Carretero, A. Chapter 13—Chromatographic Technique: High-Performance Liquid Chromatography (HPLC). In Modern Techniques for Food Authentication, 2nd ed.; Sun, D.-W., Ed.; Academic Press: Cambridge, MA, USA, 2018; pp. 459–526. ISBN 978-0-12-814264-6. [Google Scholar]
- Rammohan, A.; Reddy, J.S.; Sravya, G.; Rao, C.N.; Zyryanov, G.V. Chalcone Synthesis, Properties and Medicinal Applications: A Review. Environ. Chem. Lett. 2020, 18, 433–458. [Google Scholar] [CrossRef]
- Shi, J.-Y.; Zou, X.-B.; Zhao, J.-W.; Mel, H.; Wang, K.-L.; Wang, X.; Chen, H. Determination of Total Flavonoids Content in Fresh Ginkgo Biloba Leaf with Different Colors Using near Infrared Spectroscopy. Spectrochim. Acta Part A Mol. Biomol. Spectrosc. 2012, 94, 271–276. [Google Scholar] [CrossRef]
- Kong, K.W.; Mat-Junit, S.; Ismail, A.; Aminudin, N.; Abdul-Aziz, A. Polyphenols in Barringtonia racemosa and Their Protection against Oxidation of LDL, Serum and Haemoglobin. Food Chem. 2014, 146, 85–93. [Google Scholar] [CrossRef]
- da Silva, C.; Prasniewski, A.; Calegari, M.A.; de Lima, V.A.; Oldoni, T.L.C. Determination of Total Phenolic Compounds and Antioxidant Activity of Ethanolic Extracts of Propolis Using ATR–FT-IR Spectroscopy and Chemometrics. Food Anal. Methods 2018, 11, 2013–2021. [Google Scholar] [CrossRef]
- Hao, J.-W.; Chen, Y.; Chen, N.-D. Assessment of ATR-NIR and ATR-MIR Spectroscopy as an Analytical Tool for the Quantification of the Total Polyphenols in Dendrobium huoshanense. Phytochem. Anal. 2020, 31, 366–374. [Google Scholar] [CrossRef]
- Trifunschi, S.; Munteanu, M.F.; Agotici, V.; Pintea, S.; Gligor, R. Determination of Flavonoid and Polyphenol Compounds in Viscum album and Allium sativum Extracts. Int. Curr. Pharm. J. 2015, 4, 382–385. [Google Scholar] [CrossRef]
- Oliveira, R.N.; Mancini, M.C.; Oliveira, F.C.S.d.; Passos, T.M.; Quilty, B.; da Silva Moreira Thiré, R.M.; McGuinness, G.B. FTIR Analysis and Quantification of Phenols and Flavonoids of Five Commercially Available Plants Extracts Used in Wound Healing. Matéria (Rio J.) 2016, 21, 767–779. [Google Scholar] [CrossRef]
- Agatonovic-Kustrin, S.; Gegechkori, V.; Petrovich, D.S.; Ilinichna, K.T.; Morton, D.W. HPTLC and FTIR Fingerprinting of Olive Leaves Extracts and ATR-FTIR Characterisation of Major Flavonoids and Polyphenolics. Molecules 2021, 26, 6892. [Google Scholar] [CrossRef]
- Suriano, S.; Balconi, C.; Valoti, P.; Redaelli, R. Comparison of Total Polyphenols, Profile Anthocyanins, Color Analysis, Carotenoids and Tocols in Pigmented Maize. LWT 2021, 144, 111257. [Google Scholar] [CrossRef]
- Rodriguez, M.D.; Monsierra, L.; Mansilla, P.S.; Pérez, G.T.; de Pascual-Teresa, S. Phenolic Characterization of a Purple Maize (Zea mays Cv. “Moragro”) by HPLC–QTOF-MS and Study of Its Bioaccessibility Using a Simulated In Vitro Digestion/Caco-2 Culture Model. J. Agric. Food Chem. 2024, 72, 6327–6338. [Google Scholar] [CrossRef]
- Zagoskina, N.V.; Zubova, M.Y.; Nechaeva, T.L.; Kazantseva, V.V.; Goncharuk, E.A.; Katanskaya, V.M.; Baranova, E.N.; Aksenova, M.A. Polyphenols in Plants: Structure, Biosynthesis, Abiotic Stress Regulation, and Practical Applications (Review). Int. J. Mol. Sci. 2023, 24, 13874. [Google Scholar] [CrossRef]
- Saini, N.; Anmol, A.; Kumar, S.; Wani, A.W.; Bakshi, M.; Dhiman, Z. Exploring Phenolic Compounds as Natural Stress Alleviators in Plants—A Comprehensive Review. Physiol. Mol. Plant Pathol. 2024, 133, 102383. [Google Scholar] [CrossRef]
- Wang, X.; Zhao, H.; Ma, C.; Lv, L.; Feng, J.; Han, S. Gallic Acid Attenuates Allergic Airway Inflammation via Suppressed Interleukin-33 and Group 2 Innate Lymphoid Cells in Ovalbumin-Induced Asthma in Mice. Int. Forum Allergy Rhinol. 2018, 8, 1284–1290. [Google Scholar] [CrossRef] [PubMed]
- Macedo, C.; Costa, P.C.; Rodrigues, F. Bioactive Compounds from Actinidia arguta Fruit as a New Strategy to Fight Glioblastoma. Food Res. Int. 2024, 175, 113770. [Google Scholar] [CrossRef]
- Kakkar, S.; Bais, S. A Review on Protocatechuic Acid and Its Pharmacological Potential. Int. Sch. Res. Not. 2014, 2014, 952943. [Google Scholar] [CrossRef]
- Cadena-Iniguez, J.; Santiago-Osorio, E.; Sanchez-Flores, N.; Salazar-Aguilar, S.; Soto-Hernandez, R.M.; de la Luz Riviello-Flores, M.; Macias-Zaragoza, V.M.; Aguiniga-Sanchez, I. The Cancer-Protective Potential of Protocatechuic Acid: A Narrative Review. Molecules 2024, 29, 1439. [Google Scholar] [CrossRef]
- Song, J.; He, Y.; Luo, C.; Feng, B.; Ran, F.; Xu, H.; Ci, Z.; Xu, R.; Han, L.; Zhang, D. New Progress in the Pharmacology of Protocatechuic Acid: A Compound Ingested in Daily Foods and Herbs Frequently and Heavily. Pharmacol. Res. 2020, 161, 105109. [Google Scholar] [CrossRef]
- Navarro-Orcajada, S.; Matencio, A.; Vicente-Herrero, C.; García-Carmona, F.; López-Nicolás, J.M. Study of the Fluorescence and Interaction between Cyclodextrins and Neochlorogenic Acid, in Comparison with Chlorogenic Acid. Sci. Rep. 2021, 11, 3275. [Google Scholar] [CrossRef]
- Jakobek, L.; Pöc, K.; Valenteković, M.; Matić, P. The Behavior of Phenolic Compounds from Apples during Simulated Gastrointestinal Digestion with Focus on Chlorogenic Acid. Foods 2024, 13, 693. [Google Scholar] [CrossRef]
- Che, J.; Zhao, T.; Liu, W.; Chen, S.; Yang, G.; Li, X.; Liu, D. Neochlorogenic Acid Enhances the Antitumor Effects of Pingyangmycin via Regulating TOP2A. Mol. Med. Rep. 2021, 23, 158. [Google Scholar] [CrossRef] [PubMed]
- Manuja, R.; Sachdeva, S.; Jain, A.; Chaudhary, J. A Comprehensive Review on Biological Activities of P-Hydroxy Benzoic Acid and Its Derivatives. Int. J. Pharm. Sci. Rev. Res. 2013, 22, 109–115. [Google Scholar]
- Joshi, A.N.; Chandrakar, A.K.; Wasewar, K.L. Reactive Extraction of 4 Hydroxybenzoic Acid Using Tri-n-Butyl Phosphate in Toluene and Petroleum Ether at 298 K. J. Chem. Eng. Data 2022, 67, 2505–2513. [Google Scholar] [CrossRef]
- Vergote, D.; Cren-Olivé, C.; Chopin, V.; Toillon, R.-A.; Rolando, C.; Hondermarck, H.; Bourhis, X.L. (−)-Epigallocatechin (EGC) of Green Tea Induces Apoptosis of Human Breast Cancer Cells but Not of Their Normal Counterparts. Breast Cancer Res. Treat. 2002, 76, 195–201. [Google Scholar] [CrossRef]
- Chen, X.-Q.; Wang, X.-B.; Guan, R.-F.; Tu, J.; Gong, Z.-H.; Zheng, N.; Yang, J.-H.; Zhang, Y.-Y.; Ying, M.-M. Blood Anticoagulation and Antiplatelet Activity of Green Tea (−)-Epigallocatechin (EGC) in Mice. Food Funct. 2013, 4, 1521–1525. [Google Scholar] [CrossRef]
- Sirasunthorn, N.; Jantho, T.; Ubolsaard, T. Catechin Detection in Tea Samples Based on Catechin-Induced Conformational Changes in Papain. J. Food Compos. Anal. 2024, 132, 106313. [Google Scholar] [CrossRef]
- Ding, Y.; Li, H.; Cao, S.; Yu, Y. Effects of Catechin on the Malignant Biological Behavior of Gastric Cancer Cells through the PI3K/Akt Signaling Pathway. Toxicol. Appl. Pharmacol. 2024, 490, 117036. [Google Scholar] [CrossRef]
- Tsai, Y.-J.; Chen, B.-H. Preparation of Catechin Extracts and Nanoemulsions from Green Tea Leaf Waste and Their Inhibition Effect on Prostate Cancer Cell PC-3. Int. J. Nanomed. 2016, 11, 1907–1926. [Google Scholar] [CrossRef]
- Matejczyk, M.; Ofman, P.; Juszczuk-Kubiak, E.; Świsłocka, R.; Shing, W.L.; Kesari, K.K.; Prakash, B.; Lewandowski, W. Biological Effects of Vanillic Acid, Iso-Vanillic Acid, and Orto-Vanillic Acid as Environmental Pollutants. Ecotoxicol. Environ. Saf. 2024, 277, 116383. [Google Scholar] [CrossRef]
- Girawale, S.D.; Meena, S.N.; Nandre, V.S.; Waghmode, S.B.; Kodam, K.M. Biosynthesis of Vanillic Acid by Ochrobactrum anthropi and Its Applications. Bioorganic Med. Chem. 2022, 72, 117000. [Google Scholar] [CrossRef] [PubMed]
- Eshwar, D.S.; Antony, F.M.; Kumar, A.; Wasewar, K.L. Extraction Equilibrium of Vanillic Acid Using Natural Solvents. Chem. Data Collect. 2023, 44, 101007. [Google Scholar] [CrossRef]
- Neamțu, A.-A.; Maghiar, T.A.; Turcuș, V.; Maghiar, P.B.; Căpraru, A.-M.; Lazar, B.-A.; Dehelean, C.-A.; Pop, O.L.; Neamțu, C.; Totolici, B.D.; et al. A Comprehensive View on the Impact of Chlorogenic Acids on Colorectal Cancer. Curr. Issues Mol. Biol. 2024, 46, 6783–6804. [Google Scholar] [CrossRef] [PubMed]
- Ho, C.-Y.; Tang, C.-H.; Ho, T.-L.; Wang, W.-L.; Yao, C.-H. Chlorogenic Acid Prevents Ovariectomized-Induced Bone Loss by Facilitating Osteoblast Functions and Suppressing Osteoclast Formation. Aging 2024, 16, 4832–4840. [Google Scholar] [CrossRef]
- Deguchi, Y.; Ito, M. Caffeic Acid and Rosmarinic Acid Contents in Genus Perilla. J. Nat. Med. 2020, 74, 834–839. [Google Scholar] [CrossRef]
- Mudgal, J.; Basu Mallik, S.; Nampoothiri, M.; Kinra, M.; Hall, S.; Grant, G.D.; Anoopkumar-Dukie, S.; Davey, A.K.; Rao, C.M.; Arora, D. Effect of Coffee Constituents, Caffeine and Caffeic Acid on Anxiety and Lipopolysaccharide-Induced Sickness Behavior in Mice. J. Funct. Foods 2020, 64, 103638. [Google Scholar] [CrossRef]
- Takeda, H.; Tsuji, M.; Inazu, M.; Egashira, T.; Matsumiya, T. Rosmarinic Acid and Caffeic Acid Produce Antidepressive-like Effect in the Forced Swimming Test in Mice. Eur. J. Pharmacol. 2002, 449, 261–267. [Google Scholar] [CrossRef]
- Okur, M.E.; Sakul, A.A. Mechanism of Antinociceptive Action of Syringic Acid. J. Res. Pharm. 2021, 25, 277–286. [Google Scholar] [CrossRef]
- Bartel, I.; Mandryk, I.; Horbańczuk, J.O.; Wierzbicka, A.; Koszarska, M. Nutraceutical Properties of Syringic Acid in Civilization Diseases—Review. Nutrients 2024, 16, 10. [Google Scholar] [CrossRef]
- Wang, Z.; Lu, Z.; Chen, Y.; Wang, C.; Gong, P.; Jiang, R.; Liu, Q. Targeting the AKT-P53/CREB Pathway with Epicatechin for Improved Prognosis of Traumatic Brain Injury. CNS Neurosci. Ther. 2024, 30, e14364. [Google Scholar] [CrossRef]
- Tapia-Curimil, G.; Castro-Sepulveda, M.; Zbinden-Foncea, H. Effect of Epicatechin Consumption on the Inflammatory Pathway and Mitochondria Morphology in PBMC from a R350P Desminopathy Patient: A Case Report. Physiol. Rep. 2024, 12, e16020. [Google Scholar] [CrossRef] [PubMed]
- Zhang, J.; Liu, J.; Han, Z.; He, X.; Herrera-Balandrano, D.D.; Xiang, J. Comprehensive Evaluation on Phenolic Derivatives and Antioxidant Activities of Diverse Yellow Maize Varieties. Food Chem. 2025, 464, 141602. [Google Scholar] [CrossRef] [PubMed]
- Wang, C.; Huang, X.-L.; Mu, Y.-M.; Li, Y.-S.; He, Y.-M.; Tang, H.-B. Synergistic Effects of Trans-p-Coumaric Acid Isolated from the Ethanol Extract of Gynura procumbens in Promoting Intestinal Absorption of Chlorogenic Acid and Reversing Alcoholic Fatty Liver Disease. J. Ethnopharmacol. 2022, 295, 115407. [Google Scholar] [CrossRef]
- Zhai, Y.; Wang, T.; Fu, Y.; Yu, T.; Ding, Y.; Nie, H. Ferulic Acid: A Review of Pharmacology, Toxicology, and Therapeutic Effects on Pulmonary Diseases. Int. J. Mol. Sci. 2023, 24, 8011. [Google Scholar] [CrossRef]
- Khan, K.A.; Saleem, M.H.; Afzal, S.; Hussain, I.; Ameen, F.; Fahad, S. Ferulic Acid: Therapeutic Potential Due to Its Antioxidant Properties, Role in Plant Growth, and Stress Tolerance. Plant Growth Regul. 2024, 104, 1329–1353. [Google Scholar] [CrossRef]
- Sherefedin, U.; Belay, A.; Gudishe, K.; Kebede, A.; Kumela, A.G.; Asemare, S. Photophysical Properties of Sinapic Acid and Ferulic Acid and Their Binding Mechanism with Caffeine. J. Fluoresc. 2024. online ahead of print. [Google Scholar] [CrossRef]
- Precupas, A.; Popa, V.T. Impact of Sinapic Acid on Bovine Serum Albumin Thermal Stability. Int. J. Mol. Sci. 2024, 25, 936. [Google Scholar] [CrossRef]
- Kaczmarek-Szczepańska, B.; Kleszczyński, K.; Zasada, L.; Chmielniak, D.; Hollerung, M.B.; Dembińska, K.; Pałubicka, K.; Steinbrink, K.; Swiontek Brzezinska, M.; Grabska-Zielińska, S. Hyaluronic Acid/Ellagic Acid as Materials for Potential Medical Application. Int. J. Mol. Sci. 2024, 25, 5891. [Google Scholar] [CrossRef] [PubMed]
- Tang, Y.; Jiang, X. Effect of Solubilization with Surfactant on the Antioxidant Activity of Ellagic Acid. Tenside Surfactants Deterg. 2024, 61, 250–258. [Google Scholar] [CrossRef]
- Wang, L.; Zhao, J.; Mao, Y.; Liu, L.; Li, C.; Wu, H.; Zhao, H.; Wu, Q. Tartary Buckwheat Rutin: Accumulation, Metabolic Pathways, Regulation Mechanisms, and Biofortification Strategies. Plant Physiol. Biochem. 2024, 208, 108503. [Google Scholar] [CrossRef]
- Sirotkin, A.V. Positive Effects of Rutin on Female Reproduction. Reprod. Domest. Anim. 2024, 59, e14540. [Google Scholar] [CrossRef] [PubMed]
- Sen, A.; Atmaca, P.; Terzioglu, G.; Arslan, S. Anticarcinogenic Effect and Carcinogenic Potential of the Dietary Phenolic Acid: O-Coumaric Acid. Nat. Prod. Commun. 2013, 8, 1269–1274. [Google Scholar] [CrossRef] [PubMed]
- Maheshwari, A.; Kishore, N. Deciphering the Spectroscopic and Thermodynamic Aspects of Binding of Biologically Important Antioxidants with the Alkali Induced State of Human Serum Albumin. Phys. Chem. Chem. Phys. 2024, 26, 28689–28704. [Google Scholar] [CrossRef]
- Torrisi, C.; Malfa, G.A.; Acquaviva, R.; Castelli, F.; Sarpietro, M.G. Effect of Protocatechuic Acid Ethyl Ester on Biomembrane Models: Multilamellar Vesicles and Monolayers. Membranes 2022, 12, 283. [Google Scholar] [CrossRef]
- Miklasińska, M.; Kępa, M.; Wojtyczka, R.D.; Idzik, D.; Zdebik, A.; Orlewska, K.; Wąsik, T.J. Antibacterial Activity of Protocatechuic Acid Ethyl Ester on Staphylococcus aureus Clinical Strains Alone and in Combination with Antistaphylococcal Drugs. Molecules 2015, 20, 13536–13549. [Google Scholar] [CrossRef]
- Koc, T.Y.; Dogan, S.; Karadayi, M. Potential Using of Resveratrol and Its Derivatives in Medicine. Eurasian J. Med. 2024, 56, 136–141. [Google Scholar] [CrossRef] [PubMed]
- Bulut, O.; Baydemir, I.; Kilic, G.; Domínguez-Andrés, J.; Netea, M.G. Resveratrol Potentiates BCG-Induced Trained Immunity in Human Monocytes. J. Leukoc. Biol. 2025, 117, qiae241. [Google Scholar] [CrossRef]
- Jia, K.; Shi, P.; Zhang, L.; Yan, X.; Xu, J.; Liao, K. Trans-Cinnamic Acid Alleviates High-Fat Diet-Induced Renal Injury via JNK/ERK/P38 MAPK Pathway. J. Nutr. Biochem. 2025, 135, 109769. [Google Scholar] [CrossRef]
- Yilmaz, S.; Sova, M.; Ergün, S. Antimicrobial Activity of Trans-cinnamic Acid and Commonly Used Antibiotics against Important Fish Pathogens and Nonpathogenic Isolates. J. Appl. Microbiol. 2018, 125, 1714–1727. [Google Scholar] [CrossRef]
- Periferakis, A.; Periferakis, K.; Badarau, I.A.; Petran, E.M.; Popa, D.C.; Caruntu, A.; Costache, R.S.; Scheau, C.; Caruntu, C.; Costache, D.O. Kaempferol: Antimicrobial Properties, Sources, Clinical, and Traditional Applications. Int. J. Mol. Sci. 2022, 23, 15054. [Google Scholar] [CrossRef]
- Ren, J.; Lu, Y.; Qian, Y.; Chen, B.; Wu, T.; Ji, G. Recent Progress Regarding Kaempferol for the Treatment of Various Diseases (Review). Exp. Ther. Med. 2019, 18, 2759–2776. [Google Scholar] [CrossRef] [PubMed]
- Shergujri, M.A.; Bhatt, D.; Chadha, A.; Bhaduri, G.A. Single-Step Process for Isolation of Pure Quercetin from Aqueous Extract of Waste Onion Peels. ACS Food Sci. Technol. 2024, 4, 2980–2988. [Google Scholar] [CrossRef]
- Giuliani, C.; Di Dalmazi, G.; Bucci, I.; Napolitano, G. Quercetin and Thyroid. Antioxidants 2024, 13, 1202. [Google Scholar] [CrossRef] [PubMed]


| Number | Power (W) | Frequency (kHz) |
|---|---|---|
| 1 | 240 | 37 |
| 2 | 480 | 37 |
| 3 | 240 | 80 |
| 4 | 480 | 80 |
| Sample | Radical Scavenging Activity (%) | mg AAE/g | mg GAE/g |
|---|---|---|---|
| CS1 | 80.06 ± 1.01 | 9.34 ± 0.0091 | 3.89 ± 0.0006 |
| CS2 | 74.55 ± 0.38 | 8.70 ± 0.0034 | 4.07 ± 0.0004 |
| CS3 | 78.58 ± 1.92 | 9.17 ± 0.0173 | 3.93 ± 0.0005 |
| CS4 | 78.66 ± 2.27 | 9.18 ± 0.0204 | 3.88 ± 0.0005 |
| R1 | 14.77 ± 0.50 | 1.73 ± 0.0045 | 2.21 ± 0.0006 |
| R2 | 11.51 ± 0.37 | 1.35 ± 0.0033 | 2.07 ± 0.0010 |
| R3 | 11.31 ± 0.58 | 1.33 ± 0.0052 | 1.92 ± 0.0004 |
| R4 | 13.58 ± 0.77 | 1.59 ± 0.0069 | 1.78 ± 0.0006 |
| F1 | 6.46 ± 0.35 | 0.76 ± 0.0031 | 0.75 ± 0.0002 |
| F2 | 2.77 ± 0.90 | 0.34 ± 0.0081 | 0.91 ± 0.0001 |
| F3 | 3.93 ± 0.23 | 0.47 ± 0.0021 | 0.77 ± 0.0002 |
| F4 | 5.68 ± 1.52 | 0.67 ± 0.0137 | 0.69 ± 0.00008 |
| L1 | 36.77 ± 0.53 | 4.30 ± 0.0048 | 3.16 ± 0.0003 |
| L2 | 38.11 ± 0.11 | 4.45 ± 0.0010 | 3.09 ± 0.0003 |
| L3 | 39.87 ± 0.43 | 4.66 ± 0.0038 | 3.31 ± 0.0001 |
| L4 | 39.97 ± 2.62 | 4.67 ± 0.0236 | 3.17 ± 0.00006 |
| KCM1 | 13.97 ± 0.11 | 1.64 ± 0.0010 | 1.92 ± 0.0008 |
| KCM2 | 11.44 ± 0.58 | 1.35 ± 0.0052 | 1.60 ± 0.0002 |
| KCM3 | 11.02 ± 2.44 | 1.30 ± 0.0220 | 1.60 ± 0.0006 |
| KCM4 | 10.88 ± 0.72 | 1.28 ± 0.0064 | 1.39 ± 0.0001 |
| S1 | 20.98 ± 0.47 | 2.46 ± 0.0043 | 2.82 ± 0.0002 |
| S2 | 18.13 ± 1.01 | 2.12 ± 0.0091 | 2.70 ± 0.0006 |
| S3 | 20.12 ± 2.38 | 2.36 ± 0.0214 | 2.77 ± 0.0010 |
| S4 | 20.07 ± 0.64 | 2.35 ± 0.0058 | 2.75 ± 0.0006 |
| KCF1 | 28.59 ± 1.72 | 3.34 ± 0.0155 | 3.03 ± 0.0003 |
| KCF2 | 24.39 ± 0.36 | 2.86 ± 0.0033 | 2.97 ± 0.0005 |
| KCF3 | 22.27 ± 0.99 | 2.61 ± 0.0089 | 2.94 ± 0.00008 |
| KCF4 | 24.41 ± 2.10 | 2.86 ± 0.0189 | 2.90 ± 0.0010 |
| Name of Compound | Activity | Maize Part with Highest Concentration | Highest Concentration (µg/g) |
|---|---|---|---|
| Gallic acid | Antioxidant Anti-inflammatory Antitumor [59,60] | Leaves | 35.53 ± 0.10 |
| 3,4-Dihydroxybenzoic (protocatechuic) acid | Antioxidant Anti-inflammatory Antibacterial Antitumor Antihyperlipidemic Antidiabetic Antiviral Neuroprotective [61,62,63] | KCF | 286.33 ± 5.29 |
| Neochlorogenic acid | Antioxidant Antifungal Anti-inflammatory Antitumor [64,65,66] | Stem | 125.5 ± 3.60 |
| 4-Hydroxybenzoic acid | Antioxidant Antimicrobial Antifungal Anti-inflammatory Antimutagenic Antisickling Antidiabetic Anticancer [67,68] | Corn silk | 8.94 ± 0.05 |
| Epigallocatechin | Antioxidant Antimutagenic Antitumor Antiplatelet Anticoagulation [69,70] | KCF | 545.44 ± 8.98 |
| Catechin | Antioxidant Anti-inflammatory Antidiabetic Antitumor [71,72,73] | KCF | 553.30 ± 7.27 |
| Vanillic acid | Antioxidant Anti-inflammatory Anti-venom Antimicrobial [74,75,76] | KCF | 174.69 ± 9.75 |
| Chlorogenic acid | Antioxidant Antibacterial Anti-inflammatory Anticarcinogenic [77,78] | Root | 2828.28 ± 56.32 |
| Caffeic acid | Antioxidant Anti-inflammatory Anti-anxiety Anti-depressive [79,80,81] | KCF | 459.49 ± 7.05 |
| Syringic acid | Antioxidant Anti-inflammatory Anticancer Antinociceptive Antimicrobial [82,83] | Leaves | 2117.48 ± 257.54 |
| Epicatechin | Antioxidant Anti-inflammatory [84,85] | KCF | 805.48 ± 6.52 |
| trans-p-Coumaric acid | Antioxidant Anti-inflammatory [86,87] | Leaves | 2952.06 ± 5.93 |
| Ferulic acid | Antioxidant Anti-inflammatory Anticarcinogenic Antimicrobial Antiviral Antidiabetic [88,89] | Leaves | 510.129 ± 26.90 |
| Sinapic acid | Antioxidant Anti-inflammatory Anticancer Antimicrobial Antidiabetic [90,91] | Leaves | 5100.68 ± 80.76 |
| Ellagic acid | Antioxidant Anticancer Antibacterial [92,93] | Corn silk | 399.91 ± 0.37 |
| Rutin | Antioxidant Anticancer Antidiabetic [94,95] | Kernel | 1253.04 ± 1.91 |
| trans-2-Hydroxycinnamic (o-coumaric) acid | Antioxidant Anticarcinogenic [96,97] | Corn silk | 1462.91 ± 1.36 |
| Protocatechuic acid ethyl ester | Antioxidant Antimicrobial Antitumor Anti-inflammatory [98,99] | Leaves | 4927.28 ± 97.37 |
| Resveratrol | Antioxidant Anti-inflammatory Anticancer Cardioprotective Neuroprotective [100,101] | Stem | 3175.9 ± 49.40 |
| trans-Cinnamic acid * | Antioxidant Anti-inflammatory Antimicrobial [102,103] | Stem | 6234.6 ± 19.60 |
| Kaempferol * | Antioxidant Anti-inflammatory Antibacterial Anticarcinogenic Antidiabetic [104,105] | Stem | 6234.6 ± 19.60 |
| Quercetin | Antioxidant Anti-inflammatory Cardioprotective Anticancer Antiviral [106,107] | Corn silk | 4820.44 ± 141.74 |
Disclaimer/Publisher’s Note: The statements, opinions and data contained in all publications are solely those of the individual author(s) and contributor(s) and not of MDPI and/or the editor(s). MDPI and/or the editor(s) disclaim responsibility for any injury to people or property resulting from any ideas, methods, instructions or products referred to in the content. |
© 2025 by the authors. Licensee MDPI, Basel, Switzerland. This article is an open access article distributed under the terms and conditions of the Creative Commons Attribution (CC BY) license (https://creativecommons.org/licenses/by/4.0/).
Share and Cite
Řepka, D.; Lapčík, L. Comparative Analysis of Polyphenolic Acids from Various Zea mays Parts in Ultrasound-Assisted Extraction. Foods 2025, 14, 1458. https://doi.org/10.3390/foods14091458
Řepka D, Lapčík L. Comparative Analysis of Polyphenolic Acids from Various Zea mays Parts in Ultrasound-Assisted Extraction. Foods. 2025; 14(9):1458. https://doi.org/10.3390/foods14091458
Chicago/Turabian StyleŘepka, David, and Lubomír Lapčík. 2025. "Comparative Analysis of Polyphenolic Acids from Various Zea mays Parts in Ultrasound-Assisted Extraction" Foods 14, no. 9: 1458. https://doi.org/10.3390/foods14091458
APA StyleŘepka, D., & Lapčík, L. (2025). Comparative Analysis of Polyphenolic Acids from Various Zea mays Parts in Ultrasound-Assisted Extraction. Foods, 14(9), 1458. https://doi.org/10.3390/foods14091458