


Spatial Spillover Effects of Digital Infrastructure on Food System Resilience: An Analysis Incorporating Threshold Effects and Spatial Decay Boundaries


Abstract
:1. Introduction
2. Theoretical Analysis and Research Hypothesis
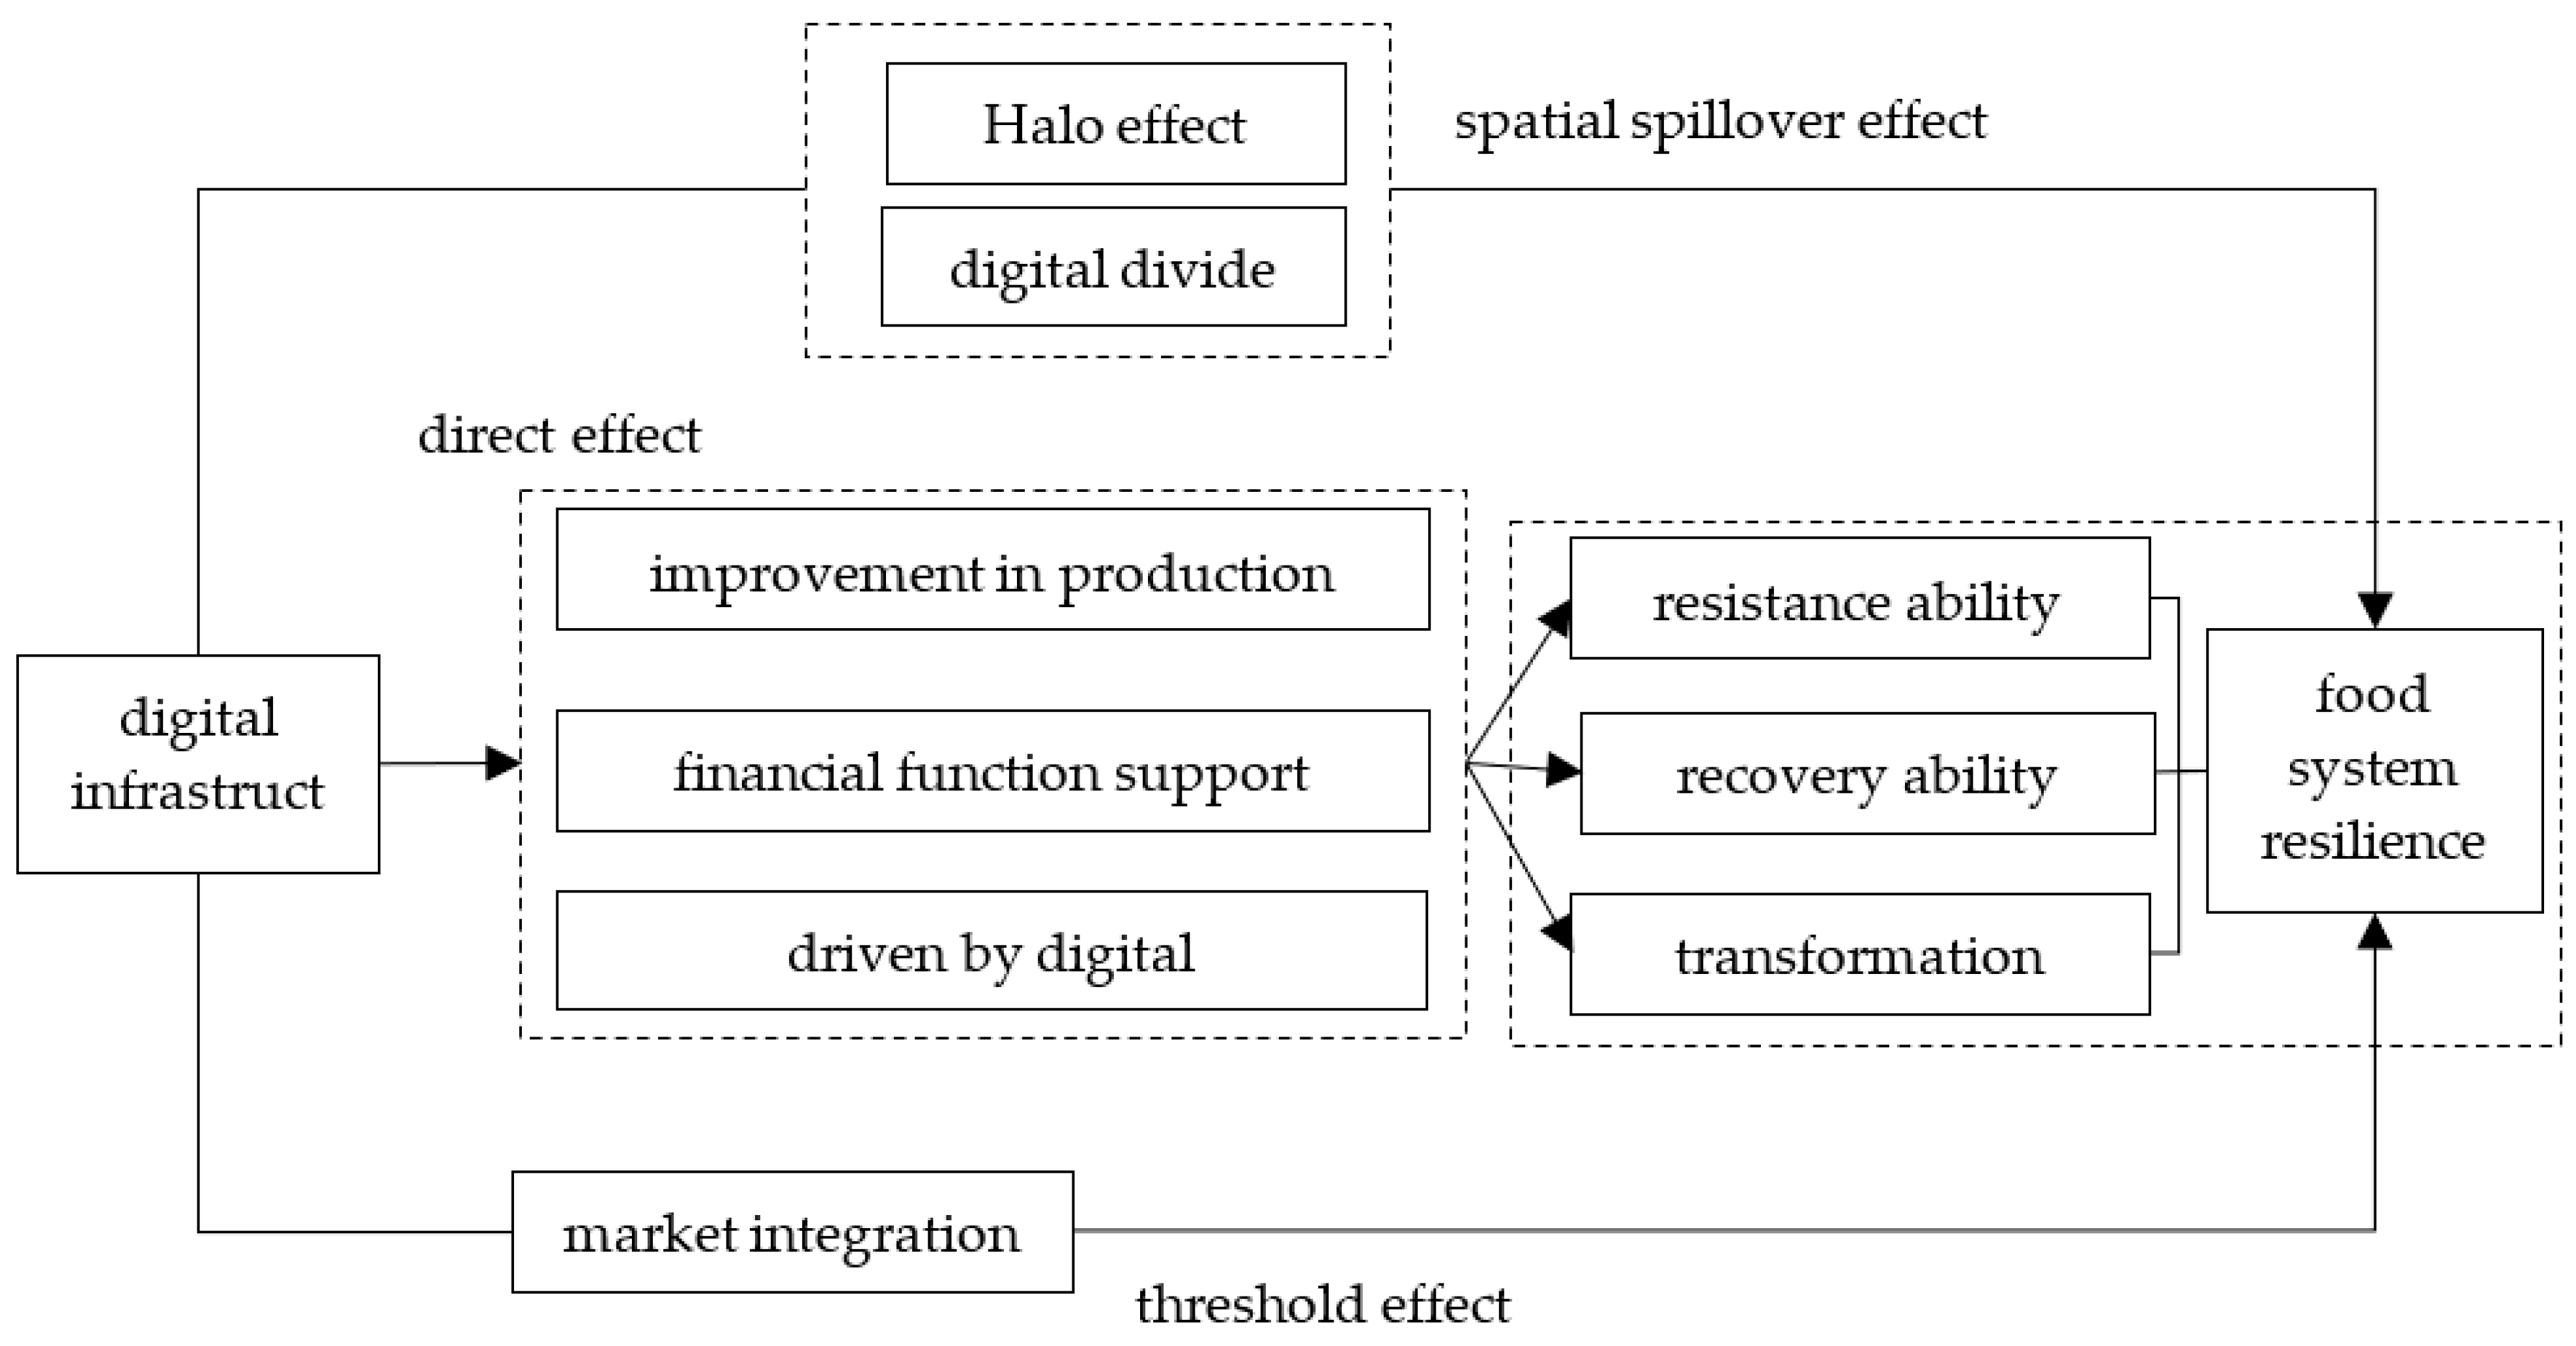
2.1. Digital Infrastructure, Direct Effects, and Food System Resilience
2.2. Digital Infrastructure, Spatial Spillover Effects, and Food System Resilience
2.3. Digital Infrastructure, Threshold Effects, and Food System Resilience
3. Methods and Data Description
3.1. Methods
3.1.1. Entropy Value Method
3.1.2. Spatial Econometric Model
3.2. Variable Selection
3.2.1. Dependent Variable
3.2.2. Core Explanatory Variable
3.2.3. Control Variables
3.3. Data Sources
4. Analysis of Research Results
4.1. Spatial Autocorrelation Test
4.1.1. Global Autocorrelation
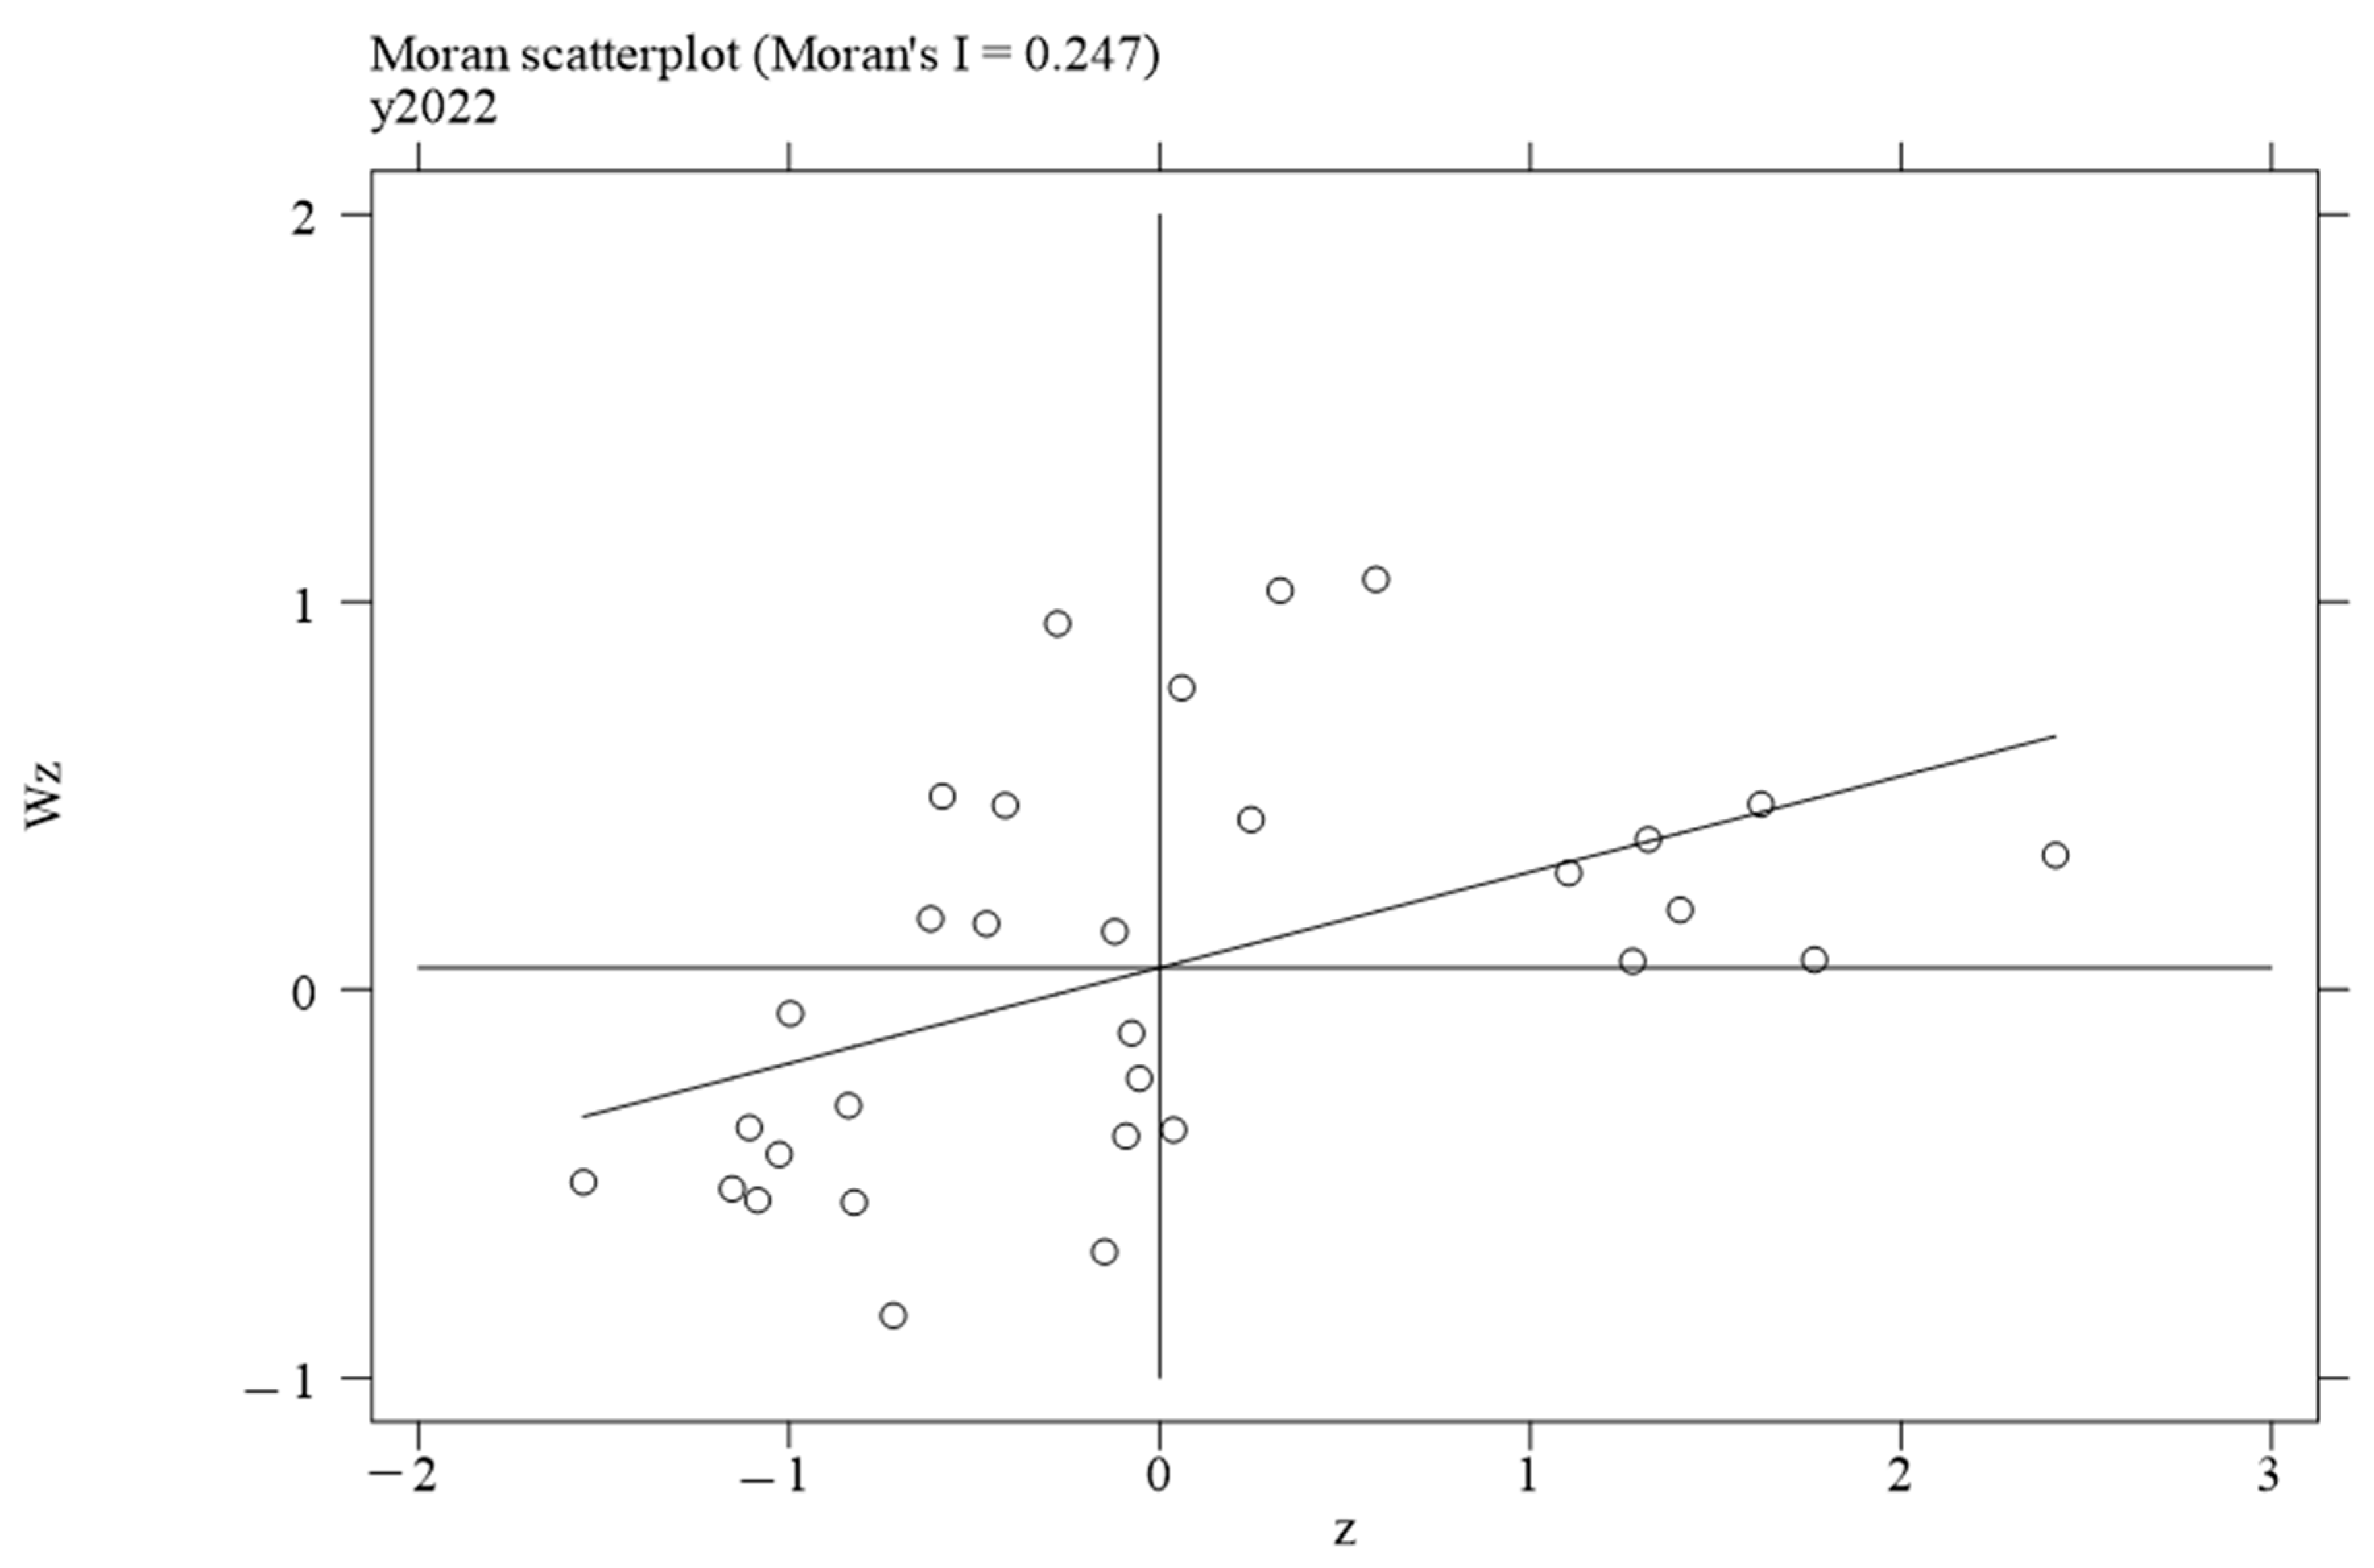
4.1.2. Local Autocorrelation
4.2. The Rationality of the Model
4.3. Regression Results
4.4. Endogeneity Treatment
4.5. Robustness Tests
4.6. Regional Heterogeneity Analysis
5. Further Analysis
5.1. Threshold Effect Analysis
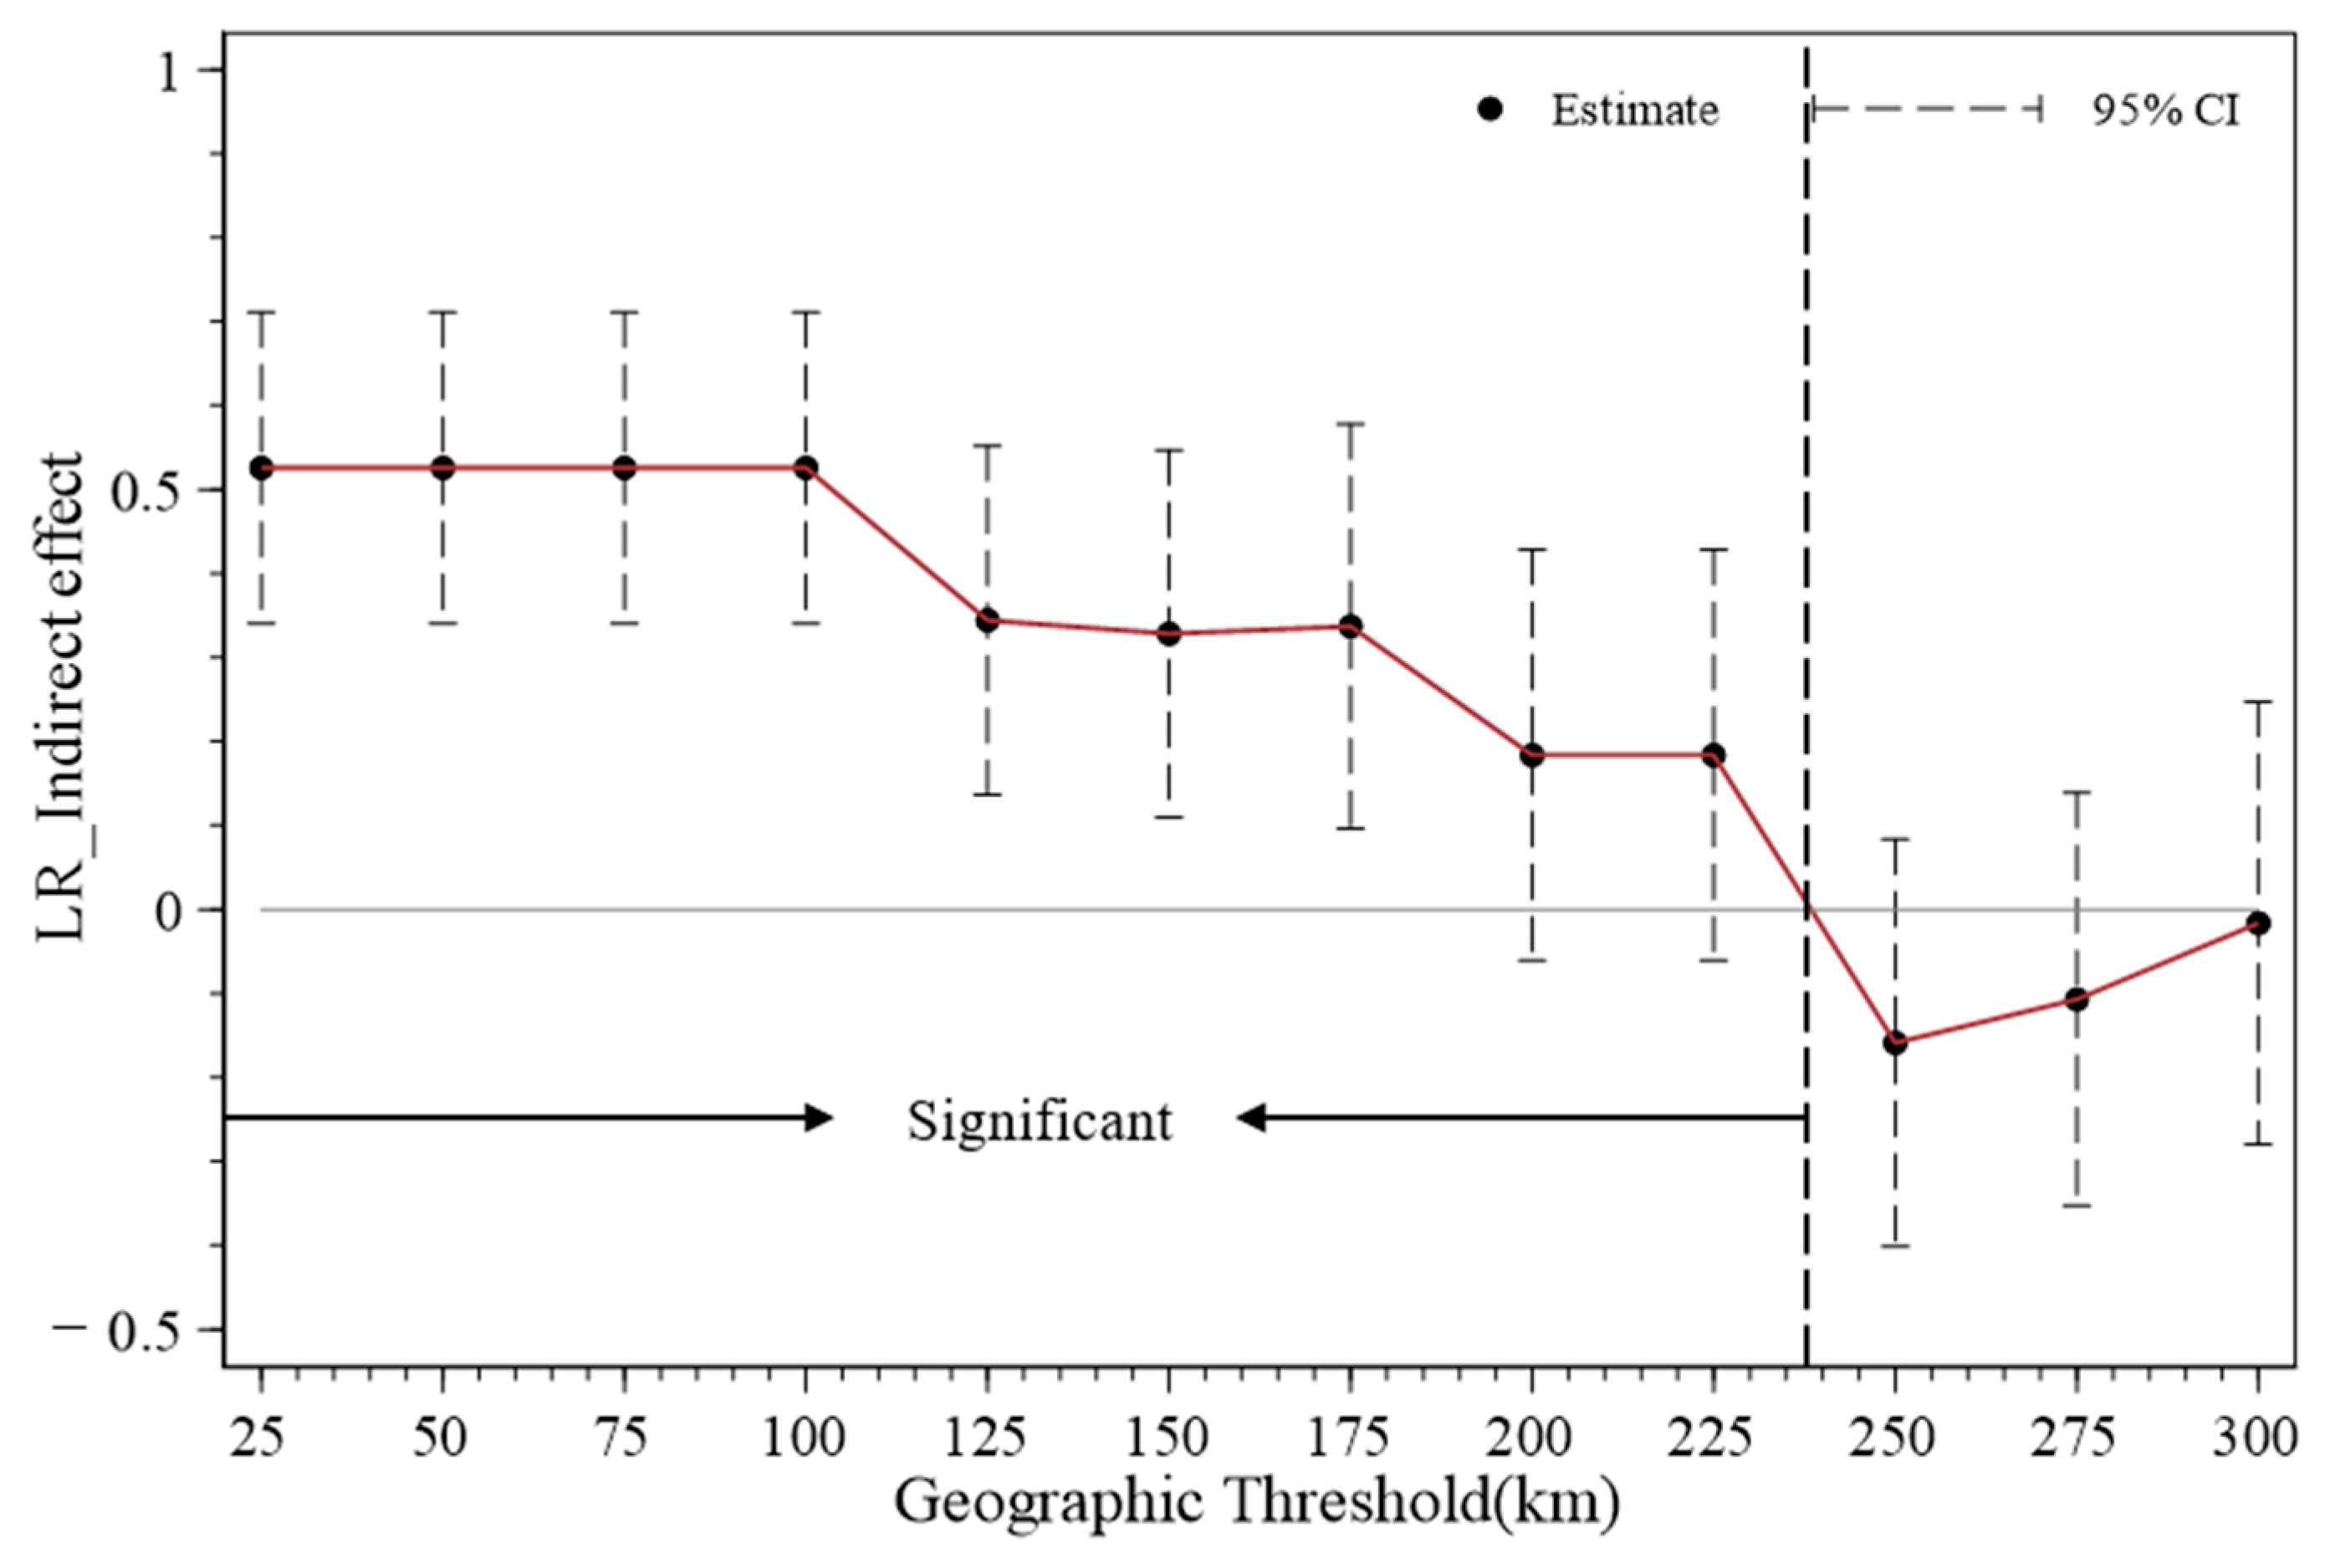
5.2. Analysis of the Decay Boundary of Spatial Spillover Effects
6. Discussion
6.1. Conclusions
6.2. Implications
6.3. Research Limitations
Author Contributions
Funding
Institutional Review Board Statement
Informed Consent Statement
Data Availability Statement
Conflicts of Interest
References
- Fraser, E.D.G.; Mabee, W.; Figge, F. A framework for assessing the vulnerability of food systems to future shocks. Futures 2005, 37, 465–479. [Google Scholar] [CrossRef]
- D’Odorico, P.; Laio, F.; Ridolfi, L. Does globalization of water reduce societal resilience to drought? J. Geophys. Res. Lett. 2010, 37, L13403. [Google Scholar] [CrossRef]
- Suweis, S.; Carr, J.A.; Maritan, A.; Rinaldo, A.; D’Odorico, P. Resilience and reactivity of global food security. Proc. Natl. Acad. Sci. USA 2015, 112, 6902–6907. [Google Scholar] [CrossRef]
- Puma, M.J.; Bose, S.; Chon, S.Y.; Cook, B.I. Assessing the evolving fragility of the global food system. Environ. Res. Lett. 2015, 10, 024007. [Google Scholar] [CrossRef]
- Marchand, P.; Carr, J.A.; Dell’Angelo, J.; Fader, M.; Gephart, J.A.; Kummu, M.; Magliocca, N.R.; Porkka, M.; Puma, M.J.; Ratajczak, Z.; et al. Reserves and trade jointly determine exposure to food supply shocks. Environ. Res. Lett. 2016, 11, 095009. [Google Scholar] [CrossRef]
- FSIN and Global Network Against Food Crises. 2024. R. UN World Food Programme. Rome. Available online: https://www.fsinplatform.org/sites/default/files/resources/files/GRFC2024-no-countries.pdf (accessed on 19 April 2025).
- Štreimikienė, D.; Baležentis, T.; Volkov, A.; Ribašauskienė, E.; Morkūnas, M.; Žičkienė, A. Negative effects of COVID-19 pandemic on agriculture: Systematic literature review in the frameworks of vulnerability, resilience and risks involved. J. Econ. Res.-Ekon. Istraživanja 2022, 35, 529–545. [Google Scholar] [CrossRef]
- Merchant, E.V.; Fatima, T.; Fatima, A.; Maiyo, N.; Mutuku, V.; Keino, S.; Simon, J.E.; Hoffman, D.J.; Downs, S.M. The influence of food environments on food Security resilience during the COVID-19 pandemic: An examination of urban and rural difference in Kenya. Nutrients 2022, 14, 2939. [Google Scholar] [CrossRef]
- Newell, J.P.; Foster, A.; Borgman, M.; Meerow, S. Ecosystem services of urban agriculture and prospects for scaling up production: A study of Detroit. Cities 2022, 125, 103664. [Google Scholar] [CrossRef]
- FAO. The State of Food and Agriculture 2021; FAO: Rome, Italy, 2021; ISBN 978-92-5-135208-3. [Google Scholar]
- COP26: Urgent Action Is Needed to Make Agriculture Greener and More Resilient. Available online: https://www.fao.org/newsroom/detail/FAO-cop26-agriculture-green-resilient-innovation-technology/en (accessed on 19 April 2025).
- Lamine, C. Sustainability and resilience in agrifood systems: Reconnecting agriculture, food and the environment. J. Sociol. Rural. 2015, 55, 41–61. [Google Scholar] [CrossRef]
- Berry, E.M. Food Security and Nutrition as the Neglected Missing Links in Cultural Evolution: The Role of the Sociotype. Rambam Maimonides Med. J. 2022, 13, e0020. [Google Scholar] [CrossRef]
- Seekell, D.; Carr, J.; Dell’Angelo, J.; D’Odorico, P.; Fader, M.; Gephart, J.; Kummu, M.; Magliocca, N.; Porkka, M.; Puma, M.; et al. Resilience in the global food system. Environ. Res. Lett. 2017, 12, 025010. [Google Scholar] [CrossRef]
- Schipanski, M.E.; MacDonald, G.K.; Rosenzweig, S.; Chappell, M.J.; Bennett, E.M.; Kerr, R.B.; Blesh, J.; Crews, T.; Drinkwater, L.; Lundgren, J.G.; et al. Realizing resilient food systems. BioScience 2016, 66, 600–610. [Google Scholar] [CrossRef]
- Zurek, M.; Ingram, J.; Sanderson Bellamy, A.; Goold, C.; Lyon, C.; Alexander, P.; Barnes, A.; Bebber, D.P.; Breeze, T.D.; Bruce, A.; et al. Food system resilience: Concepts, issues, and challenges. Annu. Rev. Environ. Resour. 2022, 47, 511–534. [Google Scholar] [CrossRef]
- Béné, C.; Headey, D.; Haddad, L.; von Grebmer, K. Is resilience a useful concept in the context of food security and nutrition programmers? Some conceptual and practical considerations. Food Secur. 2016, 8, 123–138. [Google Scholar] [CrossRef]
- Meuwissen, M.P.M.; Feindt, P.H.; Midmore, P.; Wauters, E.; Finger, R.; Appel, F.; Spiegel, A.; Mathijs, E.; Termeer, K.J.A.M.; Balmann, A.; et al. The struggle of farming systems in Europe: Looking for explanations through the lens of resilience. EuroChoices 2020, 19, 4–11. [Google Scholar] [CrossRef]
- Folke, C.; Carpenter, S.R.; Walker, B.; Scheffer, M.; Chapin, T.; Rockström, J. Resilience thinking: Integrating resilience, adaptability and transformability. Ecol. Soc. 2010, 15, 20. [Google Scholar] [CrossRef]
- Porkka, M.; Kummu, M.; Siebert, S.; Varis, O. From food insufficiency towards trade dependency: A historical analysis of global food availability. PLoS ONE 2013, 8, e82714. [Google Scholar] [CrossRef]
- Bhattachan, A.; D’odorico, P.; Dintwe, K.; Okin, G.S.; Collins, S.L. Resilience and recovery potential of duneland vegetation in the southern Kalahari. Ecosphere 2014, 5, 1–14. [Google Scholar] [CrossRef]
- Gephart, J.A.; Rovenskaya, E.; Dieckmann, U.; Pace, M.L.; Brännström, Å. Vulnerability to shocks in the global seafood trade network. Environ. Res. Lett. 2016, 11, 035008. [Google Scholar] [CrossRef]
- Xu, X.Y.; Feng, X.X. An Analysis of the Impact and Mechanisms of the Digital Economy on Economic Resilience in Urban Agricultural Areas in China—An Empirical Test Using System GMM and Dynamic Threshold Models. J. Chongqing Norm. Univ. (Ed. Soc. Sci.) 2023, 43, 50–63. (In Chinese) [Google Scholar]
- Lin, B.B. Resilience in agriculture through crop diversification: Adaptive management for environmental change. BioScience 2011, 61, 183–193. [Google Scholar] [CrossRef]
- Kray, H.A.; Heumesser, C.; Mikulcak, F.; Giertz, Å.; Bucik, M. Productive Diversification in African Agriculture and Its Effects on Resilience and Nutrition (English); World Bank Group: Washington, DC, USA; Available online: http://documents.worldbank.org/curated/en/942331530525570280 (accessed on 19 April 2025).
- Freeman, J.; Hancock, L. Energy and communication infrastructure for disaster resilience in rural and regional Australia. Reg. Stud. 2017, 51, 933–944. [Google Scholar] [CrossRef]
- Kuntke, F.; Linsner, S.; Steinbrink, E.; Franken, J.; Reuter, C. Resilience in agriculture: Communication and energy infrastructure dependencies of German farmers. Int. J. Disaster Risk Sci. 2022, 13, 214–229. [Google Scholar] [CrossRef]
- Belhadi, A.; Kamble, S.; Subramanian, N.; Singh, R.K.; Venkatesh, M. Digital capabilities to manage agri-food supply chain uncertainties and build supply chain resilience during compounding geopolitical disruptions. Int. J. Oper. Prod. Manag. 2024, 44, 1914–1950. [Google Scholar] [CrossRef]
- Coomes, O.T.; Barham, B.L.; MacDonald, G.K.; Ramankutty, N.; Chavas, J.P. Leveraging total factor productivity growth for sustainable and resilient farming. Nat. Sustain. 2019, 2, 22–28. [Google Scholar] [CrossRef]
- Nakasone, E.; Torero, M.; Minten, B. The power of information: The ICT revolution in agricultural development. Annu. Rev. Resour. Econ. 2014, 6, 533–550. [Google Scholar] [CrossRef]
- Weltzien, C. Digital agriculture or why agriculture 4.0 still offers only modest returns. Landtechnik 2016, 71, 66–68. [Google Scholar]
- Wolfert, S.; Ge, L.; Verdouw, C.; Bogaardt, M.J. Big data in smart farming—A review. Agric. Syst. 2017, 153, 69–80. [Google Scholar] [CrossRef]
- Alam, G.M.; Khatun, M.N.; Sarker, M.N.I.; Joshi, N.P.; Bhandari, H. Promoting agri-food systems resilience through ICT in developing countries amid COVID-19. Front. Sustain. Food Syst. 2023, 6, 972667. [Google Scholar] [CrossRef]
- Ma, J.K.; Li, G.S.; Han, D. Empowering the Resilience of Grain Supply Chains with the Digital Economy: Pathways and Policy Orientations. Soc. Sci. Xinjiang 2023, 1, 46–54. (In Chinese) [Google Scholar]
- Wang, J.J.; Qu, J. Study on the Effect and Regional Differentiation of Food Supply Chain Resilience Empowered by Digital Economy. J. Northwest Minzu Univ. (Philos. Soc. Sci.) 2024, 1, 138–154. (In Chinese) [Google Scholar]
- Gong, R.; Xie, L.; Wang, Y.F. Interactive Mechanism and Empirical Test of Agricultural High-quality Development and New Urbanization. Reform 2020, 7, 145–159. (In Chinese) [Google Scholar]
- Zhang, Z.X.; Li, C.; Jin, Y. Digital technology empowers high-quality agricultural development——Based on the analytical framework of the three major modern agricultural systems. Macroecon. Manag. 2022, 3, 63–69. (In Chinese) [Google Scholar]
- Zhang, Z.Z.; Xing, Z.T. Study on the Core Connotation and Dynamic Evolution of High-quality Coordinated Development of Urban-rural Integration System under Digital Economy. J. Stat. Inf. 2023, 38, 84–96. (In Chinese) [Google Scholar]
- Demertzis, M.; Merler, S.; Wolff, G.B. Capital markets union and the fintech opportunity. J. Financ. Regul. 2018, 4, 157–165. [Google Scholar] [CrossRef]
- Qin, Z.H.; Fan, Z.N.; Yu, S.M. The Digital Economy and the Agriculture and Rural Modernization: A Study Based on Prefecture Level Cities. J. Zhongnan Univ. Econ. Law 2024, 4, 108–119. (In Chinese) [Google Scholar]
- Zhang, X.W.; Sui, H.X. Innovation Practice and Reflection on the Modern Agricultural Science and Technology Service System: A Case Study of Chengdu. Rural. Econ. 2015, 12, 89–93. (In Chinese) [Google Scholar]
- Tian, L.C.; Zhang, W.W. How does digital infrastructure affect rural household entrepreneurship? J. China Popul. Resour. Environ. 2024, 34, 166–178. (In Chinese) [Google Scholar]
- Gao, Y.D.; Pei, X. The Impact of Digital Infrastructure Construction on Regional Economic Gap: A Quasi-Natural Experiment Based on the “Broadband China” Strategy. J. Res. Financ. Econ. Issues 2023, 8, 116–129. (In Chinese) [Google Scholar]
- Sun, Y.T.; Wang, J.J. The Generation Mechanism and Promotion Path of Digital Empowerment for Enhancing the Resilience of the Grain Industry Chain. Acad. J. Zhongzhou 2024, 8, 46–54. (In Chinese) [Google Scholar]
- Yu, Y.Z.; Hu, S.; Yang, F. The Barrier to Domestic Economic Cycle: Efficiency Loss of Regional Market Segmentation. J. China Ind. Econ. 2022, 12, 108–126. (In Chinese) [Google Scholar]
- Fu, Y.Q.; Zhu, Y.C. The Impact of Digital Infrastructure Construction on Agricultural Product Market Segmentation: AQuasi-Natural Experiment Based on the “Broadband China” Strategic Pilot Program. J. Chin. Rural. Econ. 2024, 1, 62–81. (In Chinese) [Google Scholar]
- Li, Z.C.; Wang, J.; Wang, H. The New Quality Productivity and Industrial Structure Upgrading: A Study Based on the Dual Perspective of Government and Market. J. Xi’an Univ. Financ. Econ. 2025, 38, 16–29. (In Chinese) [Google Scholar]
- Zhu, Z.; Wang, Z.; Yu, S.; Tang, Z.; Liu, B. The impact of the digital economy on food system resilience: Evidence from China. PLoS ONE 2024, 19, e0311689. [Google Scholar] [CrossRef]
- Wang, H.; Li, G.; Hu, Y. The Impact of the Digital Economy on Food System Resilience: Insights from a Study across 190 Chinese Towns. Sustainability 2023, 15, 16898. [Google Scholar] [CrossRef]
- Li, Y.H.; Li, X. Digital Infrastructure Construction and Regional Innovation. Stat. Decis. 2022, 38, 73–77. (In Chinese) [Google Scholar]
- Zhang, C.; Zhang, J.; Fu, Z.; Tian, M. A Study on the Impact of Population Aging on the Agricultural Socialized Services. Agriculture 2025, 15, 577. [Google Scholar] [CrossRef]
- Yu, Y.Q.; Chi, Z.X.; Huang, W.; Peng, L.X. Rural population aging and agricultural green development: Promote or inhibit? Chin. J. Eco-Agric. 2024, 32, 1968–1980. (In Chinese) [Google Scholar]
- Wang, S.H.; Li, X.; Zhang, W. Research on the Impact of New Quality Productive Forces on the Total Factor Carbon Productivity of Agriculture in the Yellow River Basin. J. Zhengzhou Univ. (Philos. Soc. Sci. Ed.) 2024, 57, 70–77. (In Chinese) [Google Scholar]
- You, J. Risk, under-investment in agricultural assets and dynamic asset poverty in rural China. J. China Econ. Rev. 2014, 29, 27–45. [Google Scholar] [CrossRef]
- Adepoju, A.A.; Salman, K.K. Increasing agricultural productivity through rural infrastructure: Evidence from Oyo and Osun States, Nigeria. Int. J. Appl. Agric. Apic. Res. 2013, 9, 1–10. [Google Scholar]
- Hao, A.M.; Tan, J.Y. Empowering Agricultural Resilience by Rural Industrial Integration: Influence Mechanism and Effect Analysis. J. Agrotech. Econ. 2023, 7, 88–107. (In Chinese) [Google Scholar]
- Tang, Y.; Chen, M. The impact of agricultural digitization on the high-quality development of agriculture: An empirical test based on provincial panel data. Land 2022, 11, 2152. [Google Scholar] [CrossRef]
- Dong, Y.; Qi, C.; Gu, Y.; Gui, C.; Fang, G. Citrus Industry Agglomeration and Citrus Green Total Factor Productivity in China: An Empirical Analysis Utilizing a Dynamic Spatial Durbin Model. Agriculture 2024, 14, 2059. [Google Scholar] [CrossRef]
- Han, F.; Yang, L.G. How Does the Agglomeration of Producer Services Promote the Upgrading of Manufacturing Structure?: An Integrated Framework of Agglomeration Economies and Schumpeter’s Endogenous Growth Theory. J. Manag. World 2020, 36, 72–94+219. (In Chinese) [Google Scholar]
- Drukker, D.M.; Prucha, I.R.; Raciborski, R. Maximum likelihood and generalized spatial two-stage least-squares estimators for a spatial-autoregressive model with spatial-autoregressive disturbances. Stata J. 2013, 13, 221–241. [Google Scholar] [CrossRef]
- Wang, J.; Guo, D. Siphon and radiation effects of ICT agglomeration on green total factor productivity: Evidence from a spatial Durbin model. J. Energy Econ. 2023, 126, 106953. [Google Scholar] [CrossRef]
- Liang, B.; He, G.; Wang, Y. The digital economy, market integration and environmental gains. Glob. Financ. J. 2024, 60, 100956. [Google Scholar] [CrossRef]
- Hansen, B.E. Threshold Effects in Non-Dynamic Panels: Estimation, Testing, and Inference. J. Econom. 1999, 93, 345–368. [Google Scholar] [CrossRef]
- Zhao, Y.L.; Liu, D.X.; Liu, J.Q. Integration, Opportunities’ Equalization and The Difference of China’s Wage Based on Market Access. J. Nankai Econ. Stud. 2011, 3, 125–142. (In Chinese) [Google Scholar]
- Fountas, S.; Espejo-García, B.; Kasimati, A.; Mylonas, N.; Darra, N. The future of digital agriculture: Technologies and opportunities. IT Prof. 2020, 22, 24–28. [Google Scholar] [CrossRef]
- Shen, Z.; Wang, S.; Boussemart, J.P.; Hao, Y. Digital transition and green growth in Chinese agriculture. Technol. Forecast. Soc. Change 2022, 181, 121742. [Google Scholar] [CrossRef]
- Brassesco, M.E.; Pintado, M.; Coscueta, E.R. Food system resilience thinking: From digital to integral. J. Sci. Food Agric. 2022, 102, 887–891. [Google Scholar] [CrossRef] [PubMed]
- Khatami, F.; Sanguineti, F.; Khatami, R. Breaking barriers: The role of digital platforms in enhancing the resilience of food entrepreneurs. Br. Food J. 2024, 126, 3822–3841. [Google Scholar] [CrossRef]


| Primary Indicators | Secondary Indicators | Indicator Calculation Method | Direction | Weight | Data Sources |
|---|---|---|---|---|---|
| Resistance ability (0.6449) | Basic guarantee (0.1666) | Total cultivated land area/total population at the end of the year | + | 0.0412 | China Statistical Yearbook |
| Grain output value/rural population | + | 0.0770 | National Bureau of Statistics of China | ||
| Effective irrigated area × a | + | 0.0484 | National Bureau of Statistics of China | ||
| Supply stability (0.2773) | Total grain output/total grain sown area | + | 0.0117 | National Bureau of Statistics of China | |
| Total grain output/total population | + | 0.0363 | National Bureau of Statistics of China | ||
| Density of grade highways | + | 0.1258 | National Bureau of Statistics of China | ||
| Employees in road, railway, and air transportation industries × (employees in primary industry/total employees in the whole society) | + | 0.0260 | China Statistical Yearbook of the Tertiary Industry | ||
| Purchase–sale difference of raw grains for state-owned grain enterprises | − | 0.0010 | National Bureau of Statistics of China | ||
| Stability of grain commodity consumption prices | + | 0.0765 | National Bureau of Statistics of China | ||
| Risk control (0.2010) | Number of grain emergency supply outlets | + | 0.0433 | National Bureau of Statistics of China | |
| Premium income/total output value of agriculture, forestry, animal husbandry, and fishery | + | 0.0729 0.0848 | EPS DATA | ||
| Premium income/total rural population | + | EPS DATA | |||
| Recovery ability (0.0420) | Recoverability (0.0374) | Total sown area of crops throughout the year/total cultivated land area | + | 0.0177 | National Bureau of Statistics of China |
| (Current total agricultural output value—previous total agricultural output value)/previous total agricultural output value | + | 0.0035 | National Bureau of Statistics of China | ||
| Per capita disposable income of rural residents | + | 0.0030 | National Bureau of Statistics of China | ||
| Average number of health clinic staff per village | + | 0.0132 | National Bureau of Statistics of China | ||
| Sustainability (0.0045) | Quantity of chemical fertilizers applied in agriculture/total sown area of crops × a | − | 0.0003 0.0003 | China Rural Statistical Yearbook | |
| Quantity of pesticides applied/total sown area of crops × a | − | China Rural Statistical Yearbook | |||
| Area of crops affected by disasters/total sown area of crops × a | − | 0.0040 | National Bureau of Statistics of China | ||
| Transformation ability (0.3132) | Industrial synergy (0.1942) | Total output value of agricultural, forestry, animal husbandry, and fishery services/total output value of agriculture, forestry, animal husbandry, and fishery | + | 0.0144 | China Statistical Yearbook of the Tertiary Industry |
| Number of agricultural product processing enterprises/rural population | + | 0.0472 | China Academy for Rural Development-Qiyan China Agri-research Database (CCAD), Zhejiang University | ||
| Total output value of grain and oil processing industry/total agricultural output value | + | 0.0519 | EPS DATA | ||
| Number of professional cooperatives between farmers/rural population | + | 0.0808 | China Rural Cooperative Management Statistical Annual Report China Rural Cooperative Economy Statistical Annual Report | ||
| Innovation synergy (0.0710) | Funds for agricultural science and technology activities/employees in primary industry | + | 0.0710 | China Population and Employment Statistical Yearbook | |
| Government synergy (0.0107) | Expenditure on agriculture, forestry, and water affairs/fiscal expenditure × b | + | 0.0107 | China Fiscal Yearbook | |
| Financial synergy (0.0373) | Agricultural loans × b | + | 0.0373 | EPS DATA |
| Variable Name | Variable Symbols | Obs | Mean | SD | Min | Max |
|---|---|---|---|---|---|---|
| Food system resilience | Resi | 527 | 0.1600 | 0.0680 | 0.0410 | 0.4170 |
| Digital infrastructure | Dig | 527 | 0.3770 | 0.2760 | 0.0170 | 1.0750 |
| Rural population aging | Aging | 527 | 0.1190 | 0.0440 | 0.0500 | 0.2750 |
| Level of agricultural economic development | Adev | 527 | 10.4170 | 5.5310 | 0.2000 | 30.2000 |
| Grain fixed asset investment | Inve | 527 | 9.4680 | 12.0980 | 0.0000 | 82.6270 |
| Rural electricity consumption | Elec | 527 | 0.1770 | 0.5210 | 0.0030 | 4.8670 |
| Educational attainment of rural residents | Educ | 527 | 7.6000 | 0.8670 | 3.8190 | 10.1150 |
| Year | Digital Infrastructure | Food System Resilience | ||
|---|---|---|---|---|
| I | p-Value | I | p-Value | |
| 2006 | 0.2630 | 0.0000 | 0.1910 | 0.0080 |
| 2007 | 0.2710 | 0.0000 | 0.1270 | 0.0600 |
| 2008 | 0.2670 | 0.0000 | 0.1330 | 0.0490 |
| 2009 | 0.2700 | 0.0000 | 0.1400 | 0.0440 |
| 2010 | 0.2910 | 0.0000 | 0.1520 | 0.0270 |
| 2011 | 0.3740 | 0.0000 | 0.1830 | 0.0120 |
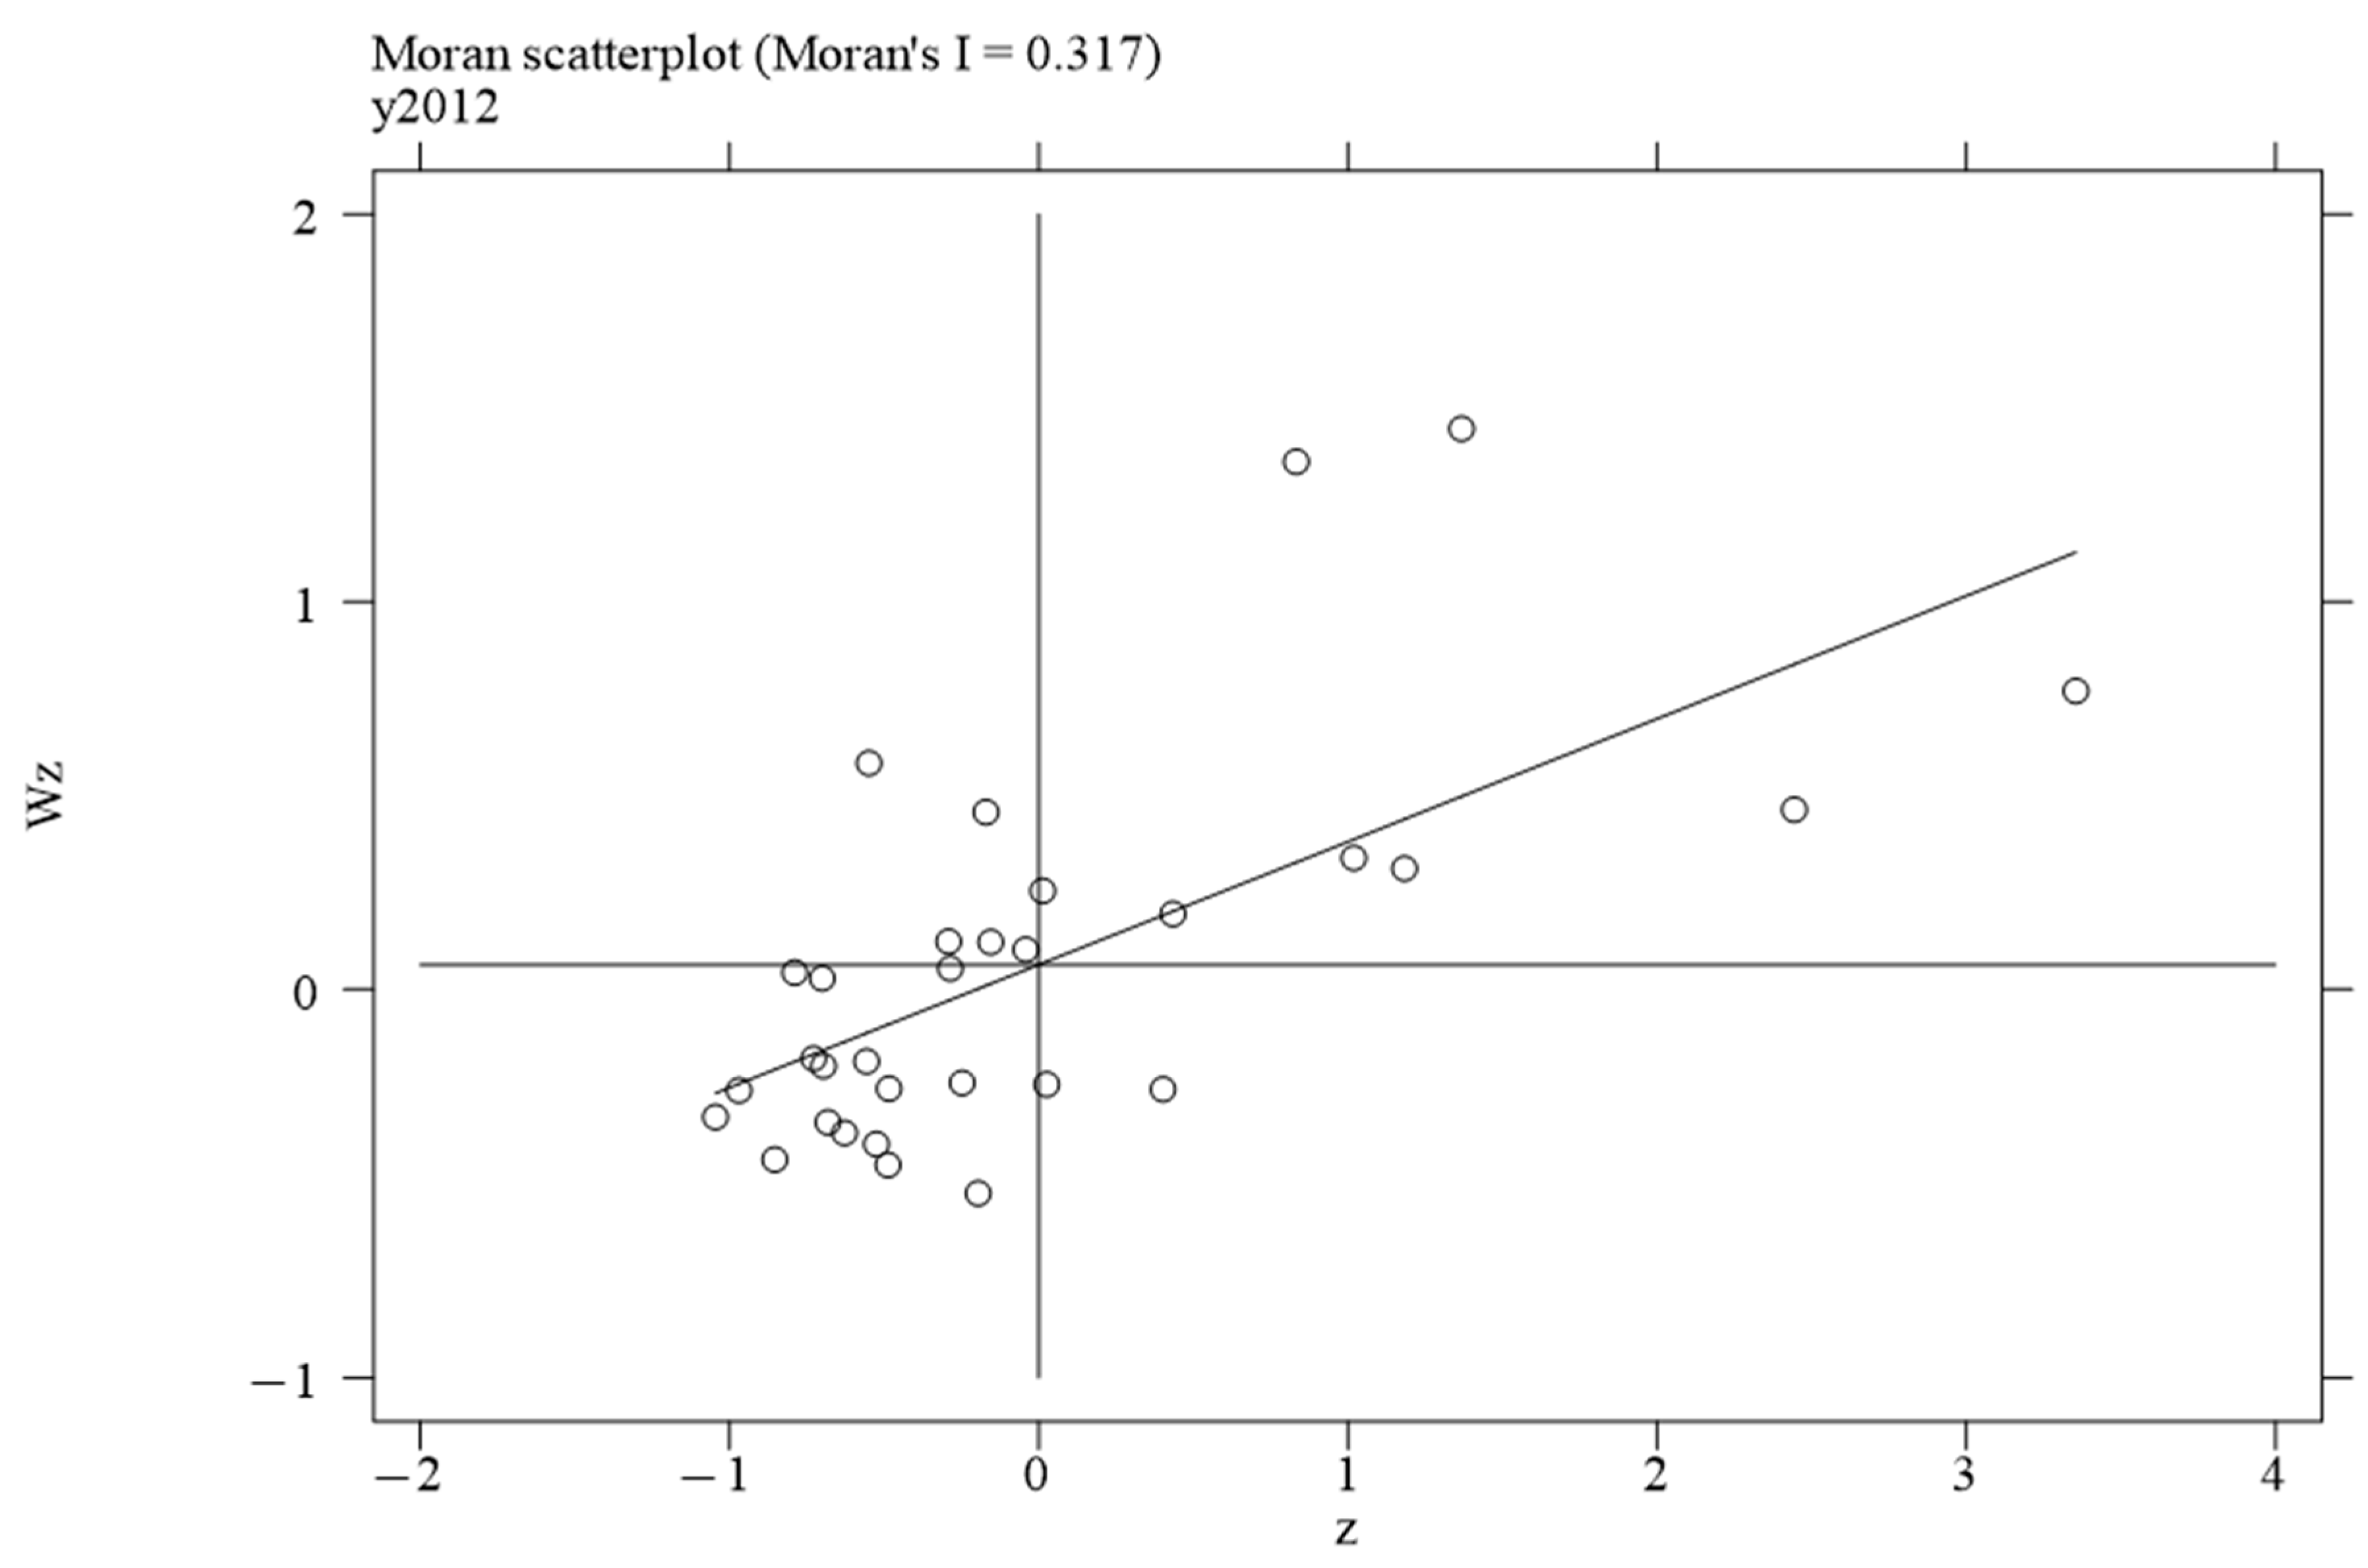
| 2012 | 0.3170 | 0.0000 | 0.2070 | 0.0050 |
| 2013 | 0.2140 | 0.0030 | 0.1630 | 0.0230 |
| 2014 | 0.2090 | 0.0050 | 0.1890 | 0.0100 |
| 2015 | 0.1650 | 0.0210 | 0.1690 | 0.0190 |
| 2016 | 0.2240 | 0.0030 | 0.1920 | 0.0090 |
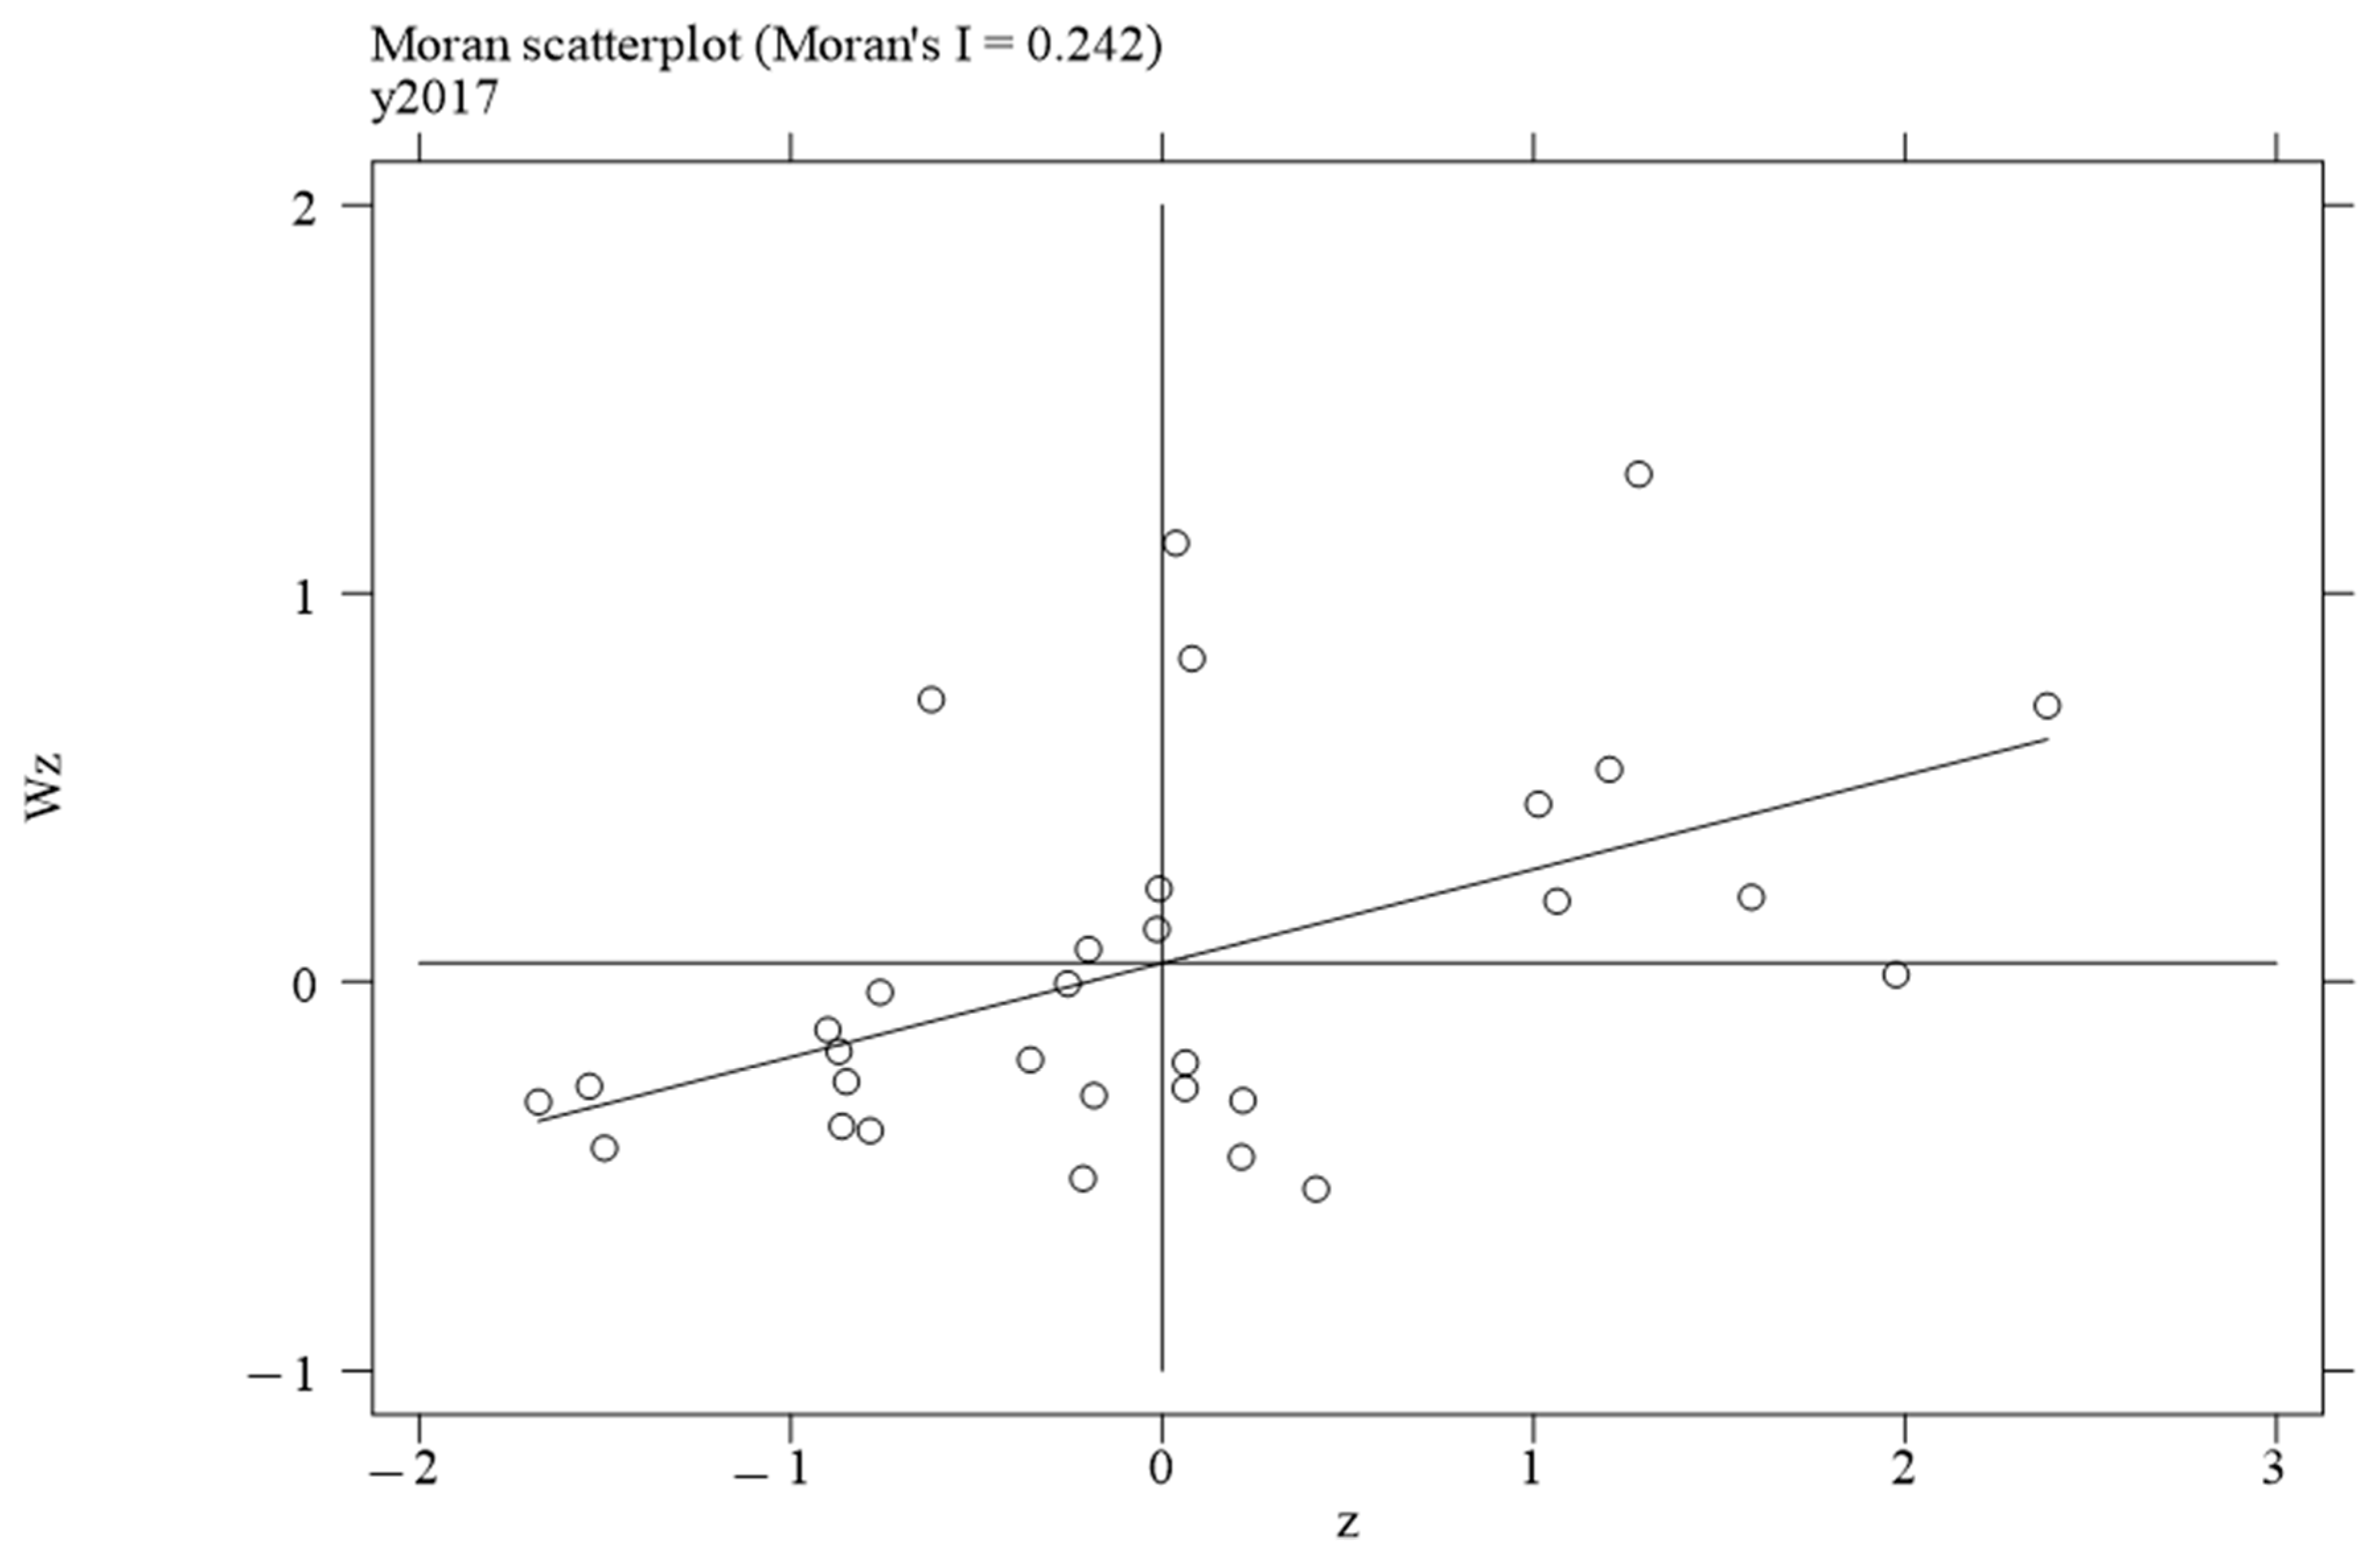
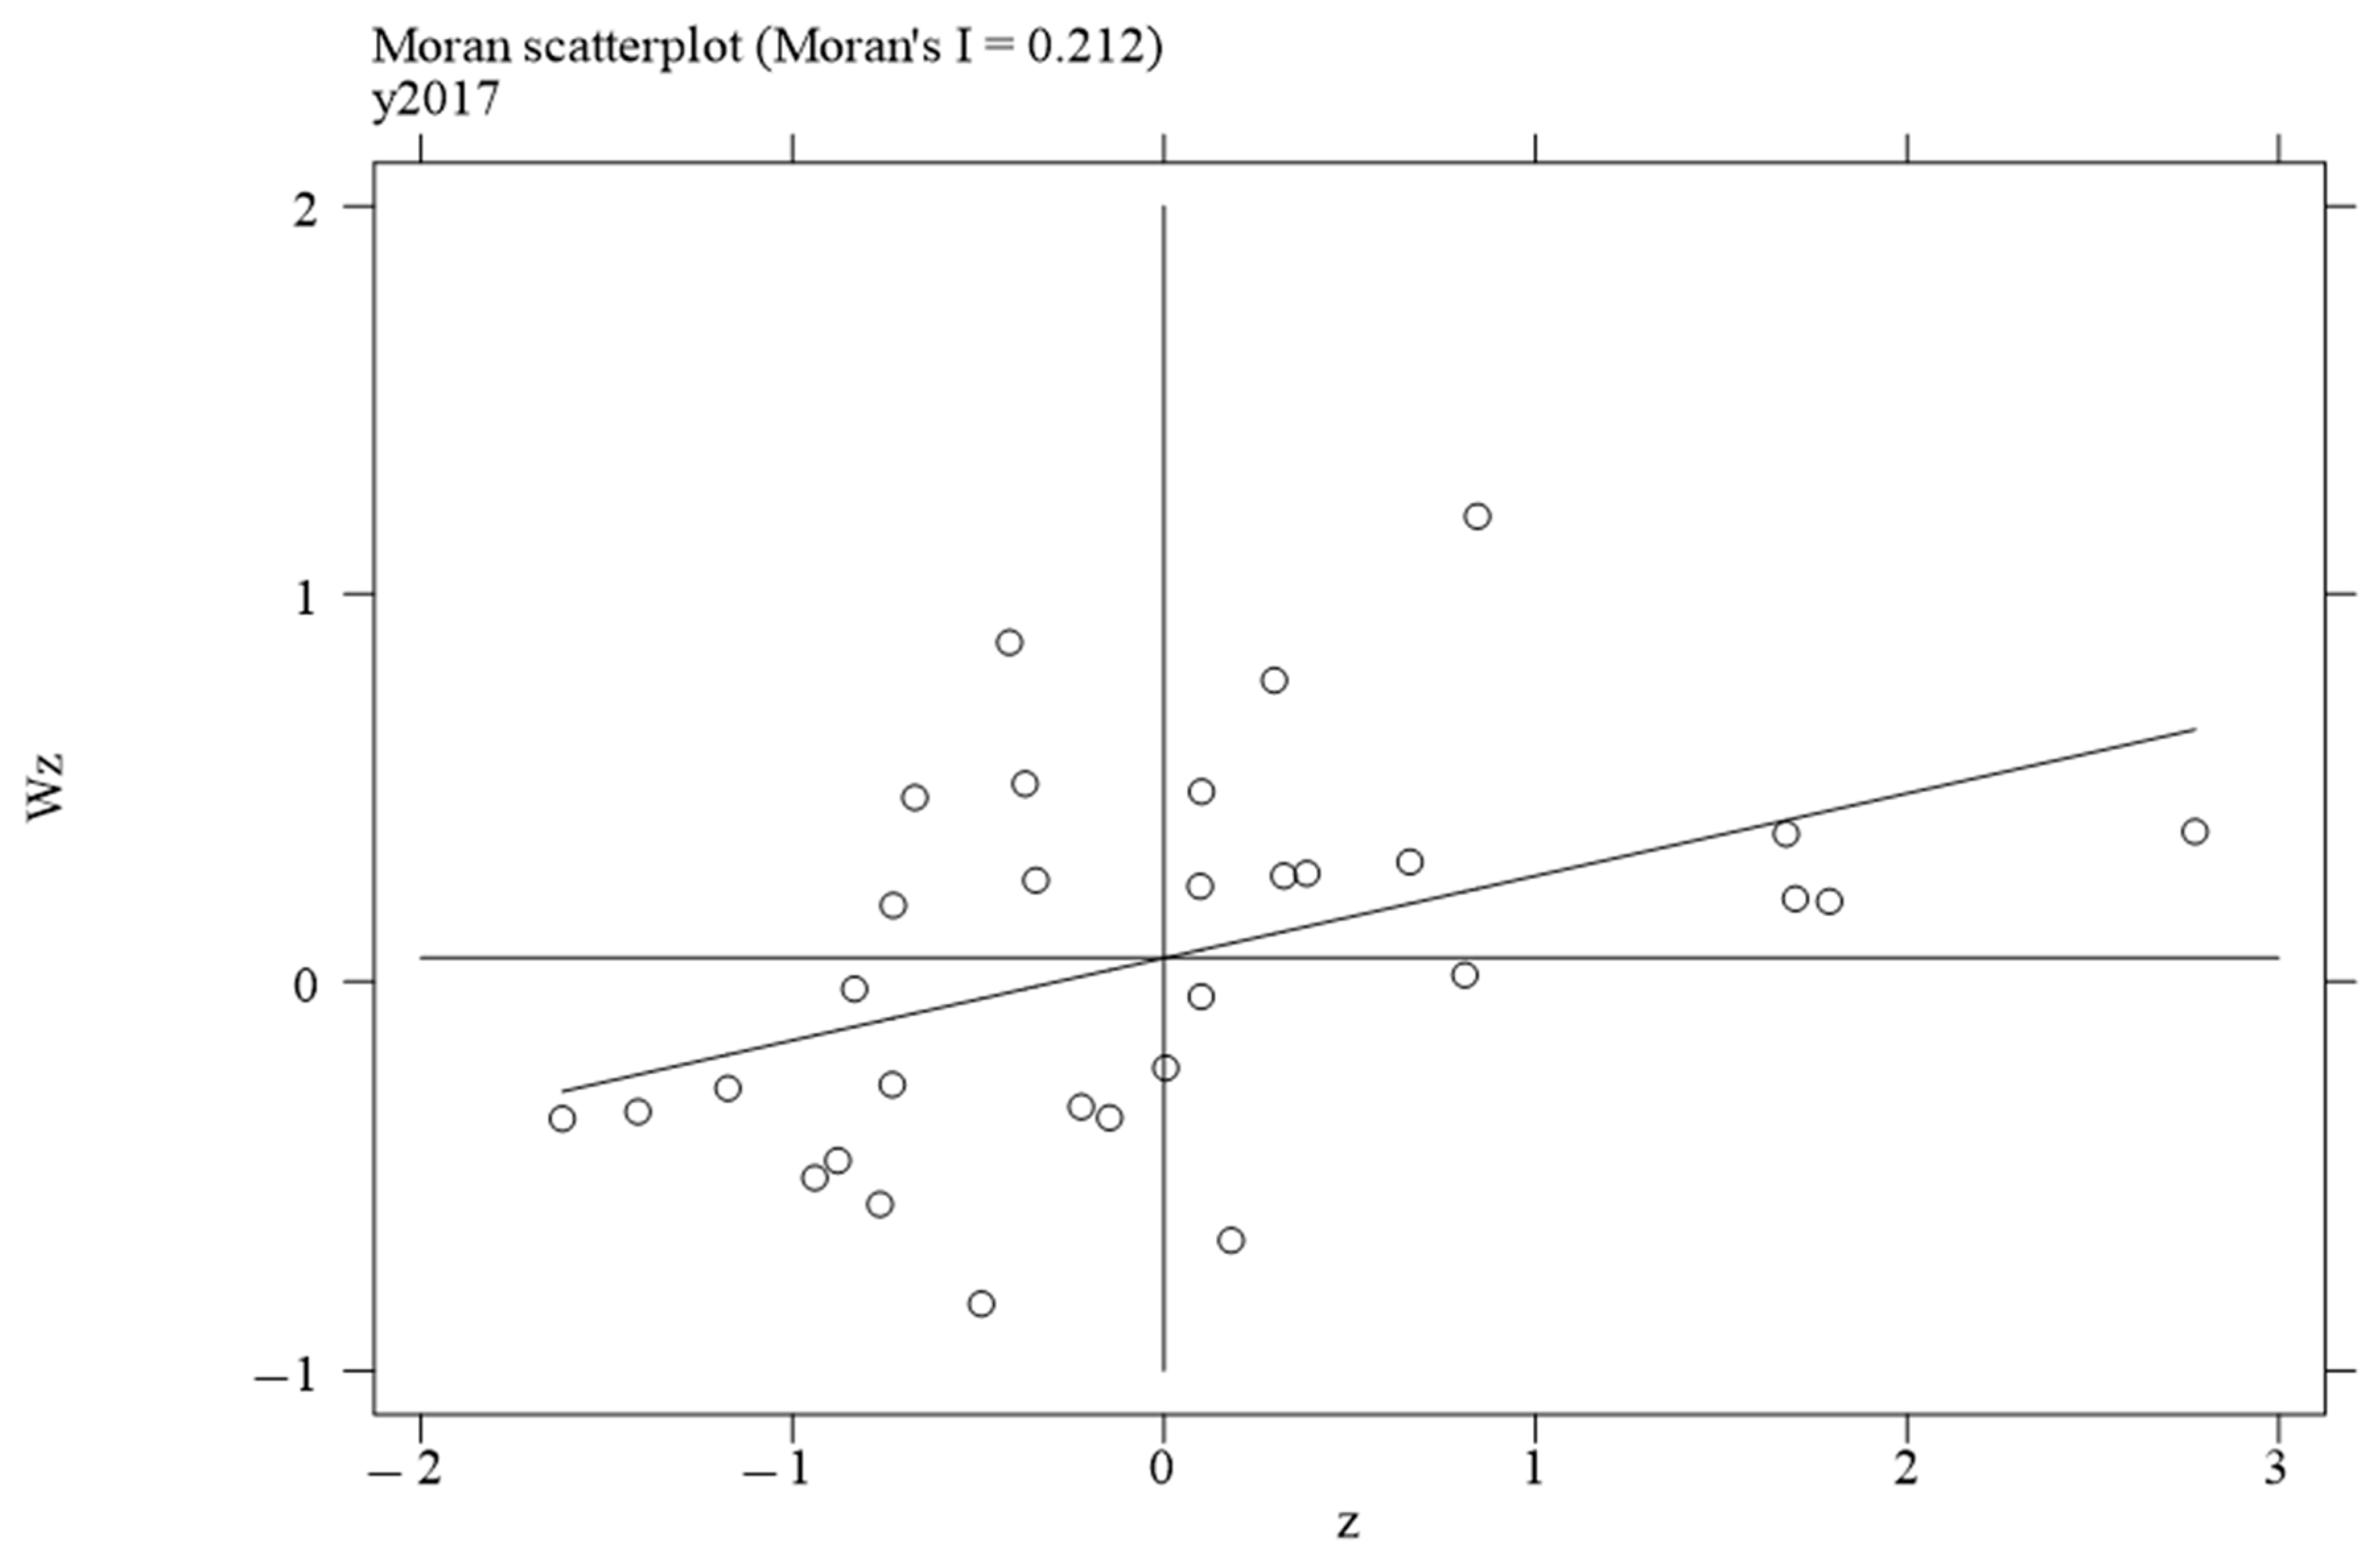
| 2017 | 0.2420 | 0.0020 | 0.2120 | 0.0050 |
| 2018 | 0.1530 | 0.0330 | 0.2080 | 0.0060 |
| 2019 | 0.2190 | 0.0040 | 0.2190 | 0.0040 |
| 2020 | 0.2320 | 0.0030 | 0.2270 | 0.0030 |
| 2021 | 0.1470 | 0.0410 | 0.2570 | 0.0010 |
| 2022 | 0.1910 | 0.0110 | 0.2470 | 0.0010 |
| Test | Statistic | p-Value | |
|---|---|---|---|
| Spatial error | Moran’s I | 4.2080 | 0.0000 |
| LM-err | 5.7600 | 0.0016 | |
| Robust LM-err | 0.8400 | 0.3590 | |
| Spatial lag | LM-lag | 66.3030 | 0.0000 |
| Robust LM-lag | 61.3830 | 0.0000 | |
| Hausman Test | 68.11 | 0.0000 | |
| Wald test | Degeneration into SAR | 58.64 | 0.0000 |
| Degeneration into SEM | 65.27 | 0.0000 | |
| LR test | Degeneration into IND | 41.61 | 0.0000 |
| Degeneration into TIME | 1032.39 | 0.0000 | |
| LR test | Degeneration into SAR | 52.99 | 0.0000 |
| Degeneration into SEM | 54.18 | 0.0000 | |
| Variable | Main | W | Direct Effect | Indirect Effect | Total Effect |
|---|---|---|---|---|---|
| Dig | 0.0310 ** | 0.1942 *** | 0.0443 *** | 0.3060 *** | 0.3503 *** |
| (0.0124) | (0.0337) | (0.0135) | (0.0592) | (0.0659) | |
| Aging | −0.1561 *** | 0.6428 *** | −0.1218 ** | 0.8711 *** | 0.7493 *** |
| (0.0512) | (0.1385) | (0.0475) | (0.1922) | (0.1914) | |
| Adev | 0.0015 *** | −0.0023 * | 0.0015 *** | −0.0025 | −0.0010 |
| (0.0005) | (0.0012) | (0.0005) | (0.0018) | (0.0020) | |
| Inve | 0.0005 *** | 0.0006 * | 0.0006 *** | 0.0013 ** | 0.0019 *** |
| (0.0002) | (0.0004) | (0.0002) | (0.0005) | (0.0006) | |
| Elec | −0.0058 *** | −0.0032 | −0.0061 *** | −0.0082 | −0.0143 * |
| (0.0021) | (0.0051) | (0.0021) | (0.0076) | (0.0084) | |
| Educ | −0.0034 | 0.0169 | −0.0023 | 0.0249 | 0.0227 |
| (0.0039) | (0.0111) | (0.0039) | (0.0175) | (0.0189) | |
| Year | Yes | ||||
| Province | Yes | ||||
| Spatial rho | 0.3579 *** | ||||
| (0.0692) | |||||
| N | 527 | ||||
| R2 | 0.4319 | ||||
| Variable | DSDM | GS2SLS | |
|---|---|---|---|
| Main | W | ||
| L. Resi | 1.0164 *** | ||
| (0.0117) | |||
| L.W. Resi | −0.1510 * | 0.3752 *** | |
| (0.0853) | (0.1243) | ||
| Dig | 0.0205 *** | 0.0818 *** | 0.0527 *** |
| (0.0056) | (0.0072) | (0.0159) | |
| Aging | −0.0449 *** | 0.0859 * | 0.4629 *** |
| (0.0171) | (0.0455) | (0.0561) | |
| Adev | 0.0001 | 0.0013 ** | 0.0004 |
| (0.0001) | (0.0005) | (0.0003) | |
| Inve | 0.0001 | 0.0011 *** | −0.0002 * |
| (0.0001) | (0.0002) | (0.0001) | |
| Elec | −0.0054 *** | −0.0006 | −0.0113 *** |
| (0.0011) | (0.0024) | (0.0027) | |
| Educ | 0.0001 | 0.0187 *** | −0.0030 |
| (0.0007) | (0.0039) | (0.0023) | |
| Spatial rho | 0.1696 ** | 0.3919 *** | |
| (0.0770) | (11.484) | ||
| N | 496 | 527 | |
| R2 | 0.8772 | 0.5341 | |
| Variable | (1) | (2) | (3) | (4) | (5) |
|---|---|---|---|---|---|
| Dig | 0.0103 ** | 0.0335 *** | 0.0314 ** | 0.0392 *** | 0.0457 *** |
| (0.0040) | (0.0125) | (0.0125) | (0.0127) | (0.0129) | |
| Aging | −0.2070 *** | −0.0768 | −0.2158 *** | −0.1005 * | −0.1467 *** |
| (0.0507) | (0.0624) | (0.0512) | (0.0518) | (0.0498) | |
| Adev | 0.0024 *** | −0.0020 ** | 0.0014 *** | 0.0013 *** | 0.0013 ** |
| (0.0005) | (0.0010) | (0.0005) | (0.0005) | (0.0005) | |
| Inve | 0.0005 *** | 0.0002 | 0.0006 *** | 0.0005 *** | 0.0006 *** |
| (0.0002) | (0.0002) | (0.0002) | (0.0002) | (0.0002) | |
| Elec | −0.0045 ** | −0.0052 *** | −0.0053 ** | −0.0016 | −0.0056 *** |
| (0.0021) | (0.0019) | (0.0025) | (0.0021) | (0.0021) | |
| Educ | −0.0079 ** | 0.0146 *** | −0.0102 ** | 0.0026 | −0.0018 |
| (0.0039) | (0.0044) | (0.0041) | (0.0041) | (0.0039) | |
| W Dig | 0.0445 *** | 0.1228 *** | 0.1901 *** | 0.3533 *** | 0.4915 *** |
| (0.0084) | (0.0292) | (0.0339) | (0.0721) | (0.0901) | |
| W Aging | 0.4193 *** | 0.6854 *** | 0.6782 *** | 0.4812 ** | 2.2886 *** |
| (0.1378) | (0.1507) | (0.1357) | (0.1974) | (0.3231) | |
| W Adev | 0.0008 | 0.0039 * | −0.0024 ** | −0.0025 | −0.0036 |
| (0.0011) | (0.0022) | (0.0012) | (0.0020) | (0.0031) | |
| W Inve | 0.0005 | 0.0000 | 0.0007 * | −0.0006 | 0.0016 |
| (0.0004) | (0.0004) | (0.0004) | (0.0008) | (0.0010) | |
| W Elec | −0.0065 | −0.0031 | −0.0062 | −0.0134 | −0.0000 |
| (0.0050) | (0.0049) | (0.0059) | (0.0083) | (0.0127) | |
| W Educ | −0.0029 | −0.0077 | 0.0103 | 0.0012 | 0.0666 ** |
| (0.0114) | (0.0121) | (0.0113) | (0.0199) | (0.0290) | |
| Direct effect Dig | 0.0117 *** | 0.0430 *** | 0.0445 *** | 0.0505 *** | 0.0535 *** |
| (0.0040) | (0.0137) | (0.0136) | (0.0145) | (0.0145) | |
| Indirect effect Dig | 0.0554 *** | 0.2086 *** | 0.3007 *** | 0.5359 *** | 0.6535 *** |
| (0.0095) | (0.0594) | (0.0600) | (0.1222) | (0.1708) | |
| Total effect Dig | 0.0672 *** | 0.2516 *** | 0.3452 *** | 0.5863 *** | 0.7070 *** |
| (0.0092) | (0.0666) | (0.0668) | (0.1312) | (0.1788) | |
| Year | Yes | Yes | Yes | Yes | Yes |
| Province | Yes | Yes | Yes | Yes | Yes |
| Spatial rho | 0.1871 ** | 0.3701 *** | 0.3580 *** | 0.3258 *** | 0.2286 * |
| (0.0798) | (0.0914) | (0.0692) | (0.0903) | (0.1369) | |
| N | 527 | 279 | 527 | 527 | 527 |
| R2 | 0.2627 | 0.2146 | 0.4135 | 0.4034 | 0.3880 |
| Variable | Southeast Region | Northwest Region | ||
|---|---|---|---|---|
| Main | W | Main | W | |
| Dig | 0.0209 * | 0.1822 *** | 0.1234 *** | 0.2361 ** |
| (0.0114) | (0.0290) | (0.0412) | (0.1032) | |
| Aging | −0.0745 | 0.4772 *** | −0.0601 | −0.1736 |
| (0.0551) | (0.1340) | (0.1191) | (0.2993) | |
| Adev | 0.0028 *** | −0.0022 ** | −0.0062 *** | −0.0089 ** |
| (0.0005) | (0.0010) | (0.0015) | (0.0038) | |
| Inve | 0.0000 | 0.0009 *** | 0.0010 | −0.0042 * |
| (0.0002) | (0.0003) | (0.0007) | (0.0025) | |
| Elec | −0.0059 *** | −0.0016 | 0.2223 * | 1.5960 *** |
| (0.0018) | (0.0043) | (0.1255) | (0.4505) | |
| Educ | −0.0045 | 0.0215 ** | 0.0183 *** | −0.0086 |
| (0.0041) | (0.0106) | (0.0060) | (0.0157) | |
| Direct effect Dig | 0.0420 *** | 0.0997 *** | ||
| (0.0132) | (0.0376) | |||
| Indirect effect Dig | 0.3433 *** | 0.1560 * | ||
| (0.0652) | (0.0865) | |||
| Total effect Dig | 0.3853 *** | 0.2557 ** | ||
| (0.0730) | (0.1062) | |||
| Year | Yes | Yes | ||
| Province | Yes | Yes | ||
| Spatial rho | 0.4733 *** | −0.4576 *** | ||
| (0.0627) | (0.1405) | |||
| N | 425 | 102 | ||
| R2 | 0.3583 | 0.7177 | ||
| Threshold Effect Test | Single Threshold | |||
|---|---|---|---|---|
| Single threshold | F-value | 71.4400 | ||
| p-value | 0.0040 | |||
| Double threshold | F-value | 32.5600 | ||
| p-value | 0.2040 | |||
| Market < 3.3100 | 0.2346 *** | 0.2242 *** | ||
| (0.0176) | (0.0177) | |||
| Market > 3.3100 | 0.1433 *** | 0.0790 *** | ||
| (0.0034) | (0.0073) | |||
| Controls | No | Yes | ||
| Con_s | 0.1053 *** | −0.1694 *** | ||
| (0.0016) | (0.0292) | |||
| N | 527 | 527 | ||
| R2 | 0.7899 | 0.8445 | ||
Disclaimer/Publisher’s Note: The statements, opinions and data contained in all publications are solely those of the individual author(s) and contributor(s) and not of MDPI and/or the editor(s). MDPI and/or the editor(s) disclaim responsibility for any injury to people or property resulting from any ideas, methods, instructions or products referred to in the content. |
© 2025 by the authors. Licensee MDPI, Basel, Switzerland. This article is an open access article distributed under the terms and conditions of the Creative Commons Attribution (CC BY) license (https://creativecommons.org/licenses/by/4.0/).
Share and Cite
Dong, Y.; Qi, C.; Gui, C.; Yang, Y. Spatial Spillover Effects of Digital Infrastructure on Food System Resilience: An Analysis Incorporating Threshold Effects and Spatial Decay Boundaries. Foods 2025, 14, 1484. https://doi.org/10.3390/foods14091484
Dong Y, Qi C, Gui C, Yang Y. Spatial Spillover Effects of Digital Infrastructure on Food System Resilience: An Analysis Incorporating Threshold Effects and Spatial Decay Boundaries. Foods. 2025; 14(9):1484. https://doi.org/10.3390/foods14091484
Chicago/Turabian StyleDong, Yani, Chunjie Qi, Cheng Gui, and Yueyuan Yang. 2025. "Spatial Spillover Effects of Digital Infrastructure on Food System Resilience: An Analysis Incorporating Threshold Effects and Spatial Decay Boundaries" Foods 14, no. 9: 1484. https://doi.org/10.3390/foods14091484
APA StyleDong, Y., Qi, C., Gui, C., & Yang, Y. (2025). Spatial Spillover Effects of Digital Infrastructure on Food System Resilience: An Analysis Incorporating Threshold Effects and Spatial Decay Boundaries. Foods, 14(9), 1484. https://doi.org/10.3390/foods14091484