
Spatiotemporal Patterns and Equity Analysis of Premature Mortality Due to Ischemic Heart Disease Attributable to PM2.5 Exposure in China: 2007–2022


Abstract
:1. Introduction
2. Materials
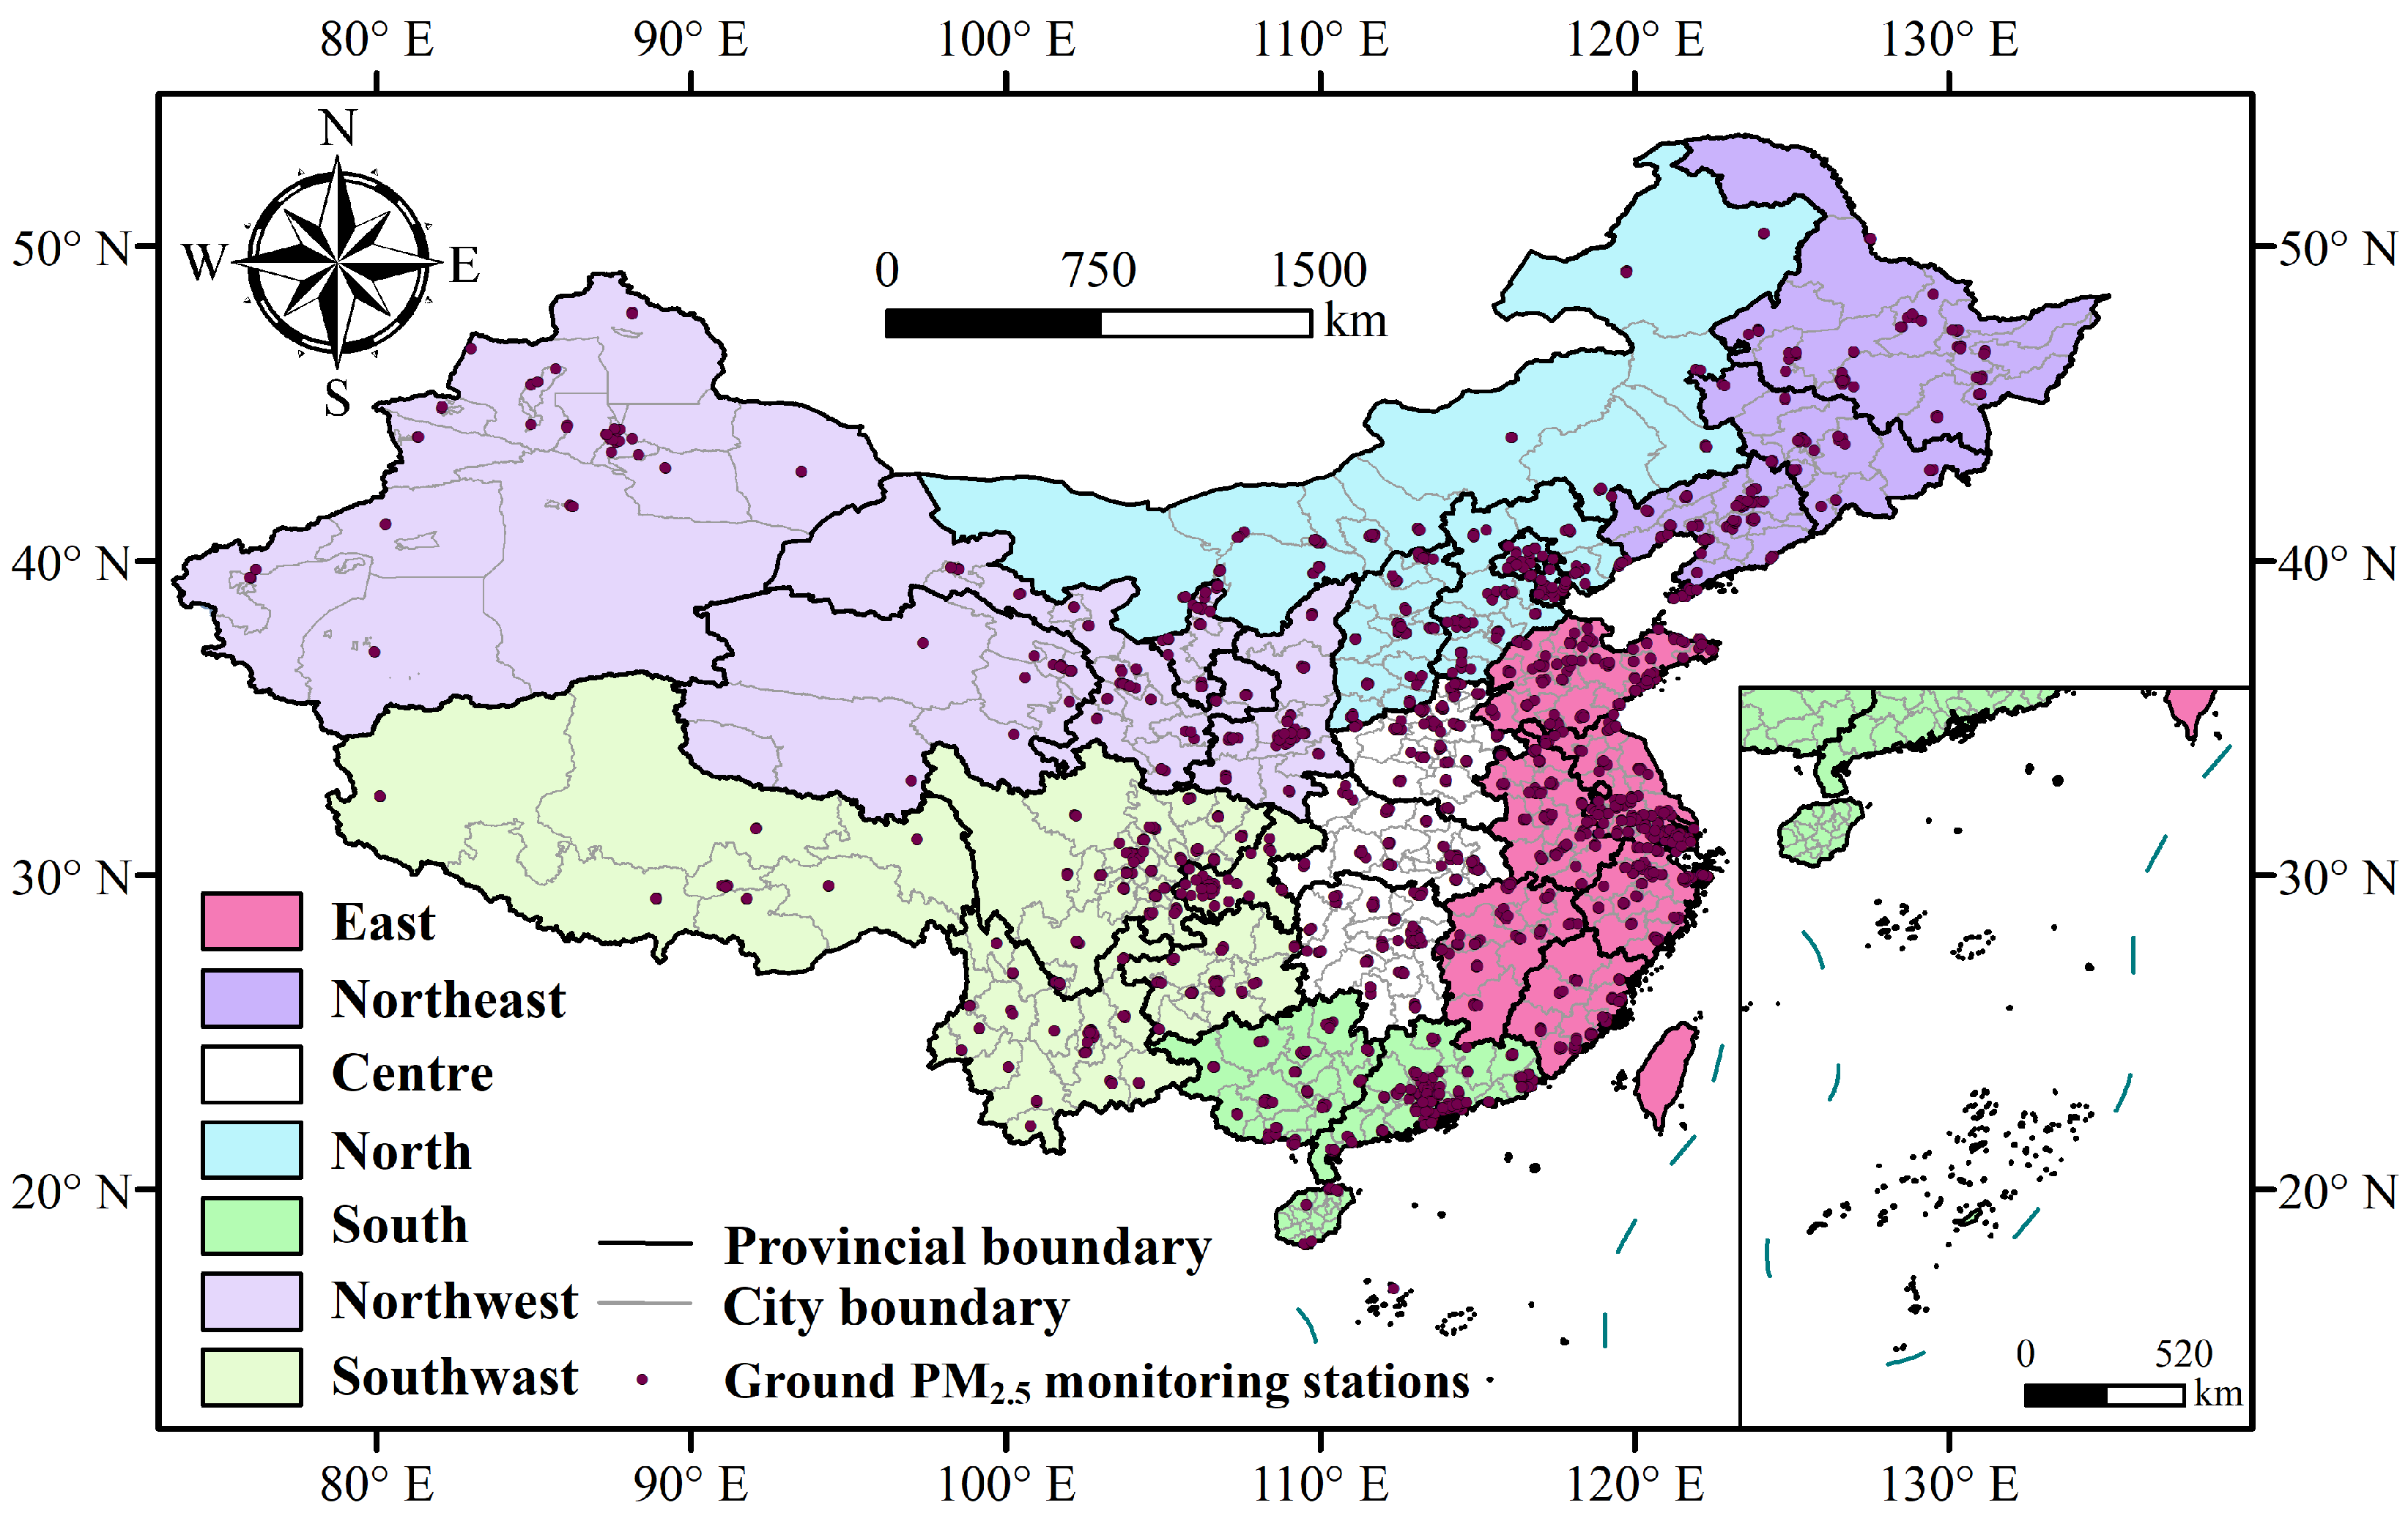
2.1. Study Area
2.2. Ground-Level PM2.5
2.3. Satellite Data
2.4. Auxiliary Data
2.5. Socioeconomic Data
2.6. Health Data
3. Methods
3.1. PM2.5 Concentration Retrieval
3.2. Estimation of Premature Mortality Due to IHD Attributable to PM2.5 Exposure
3.3. Assessment Method for Environmental Health Equity of PM2.5
4. Results and Discussion
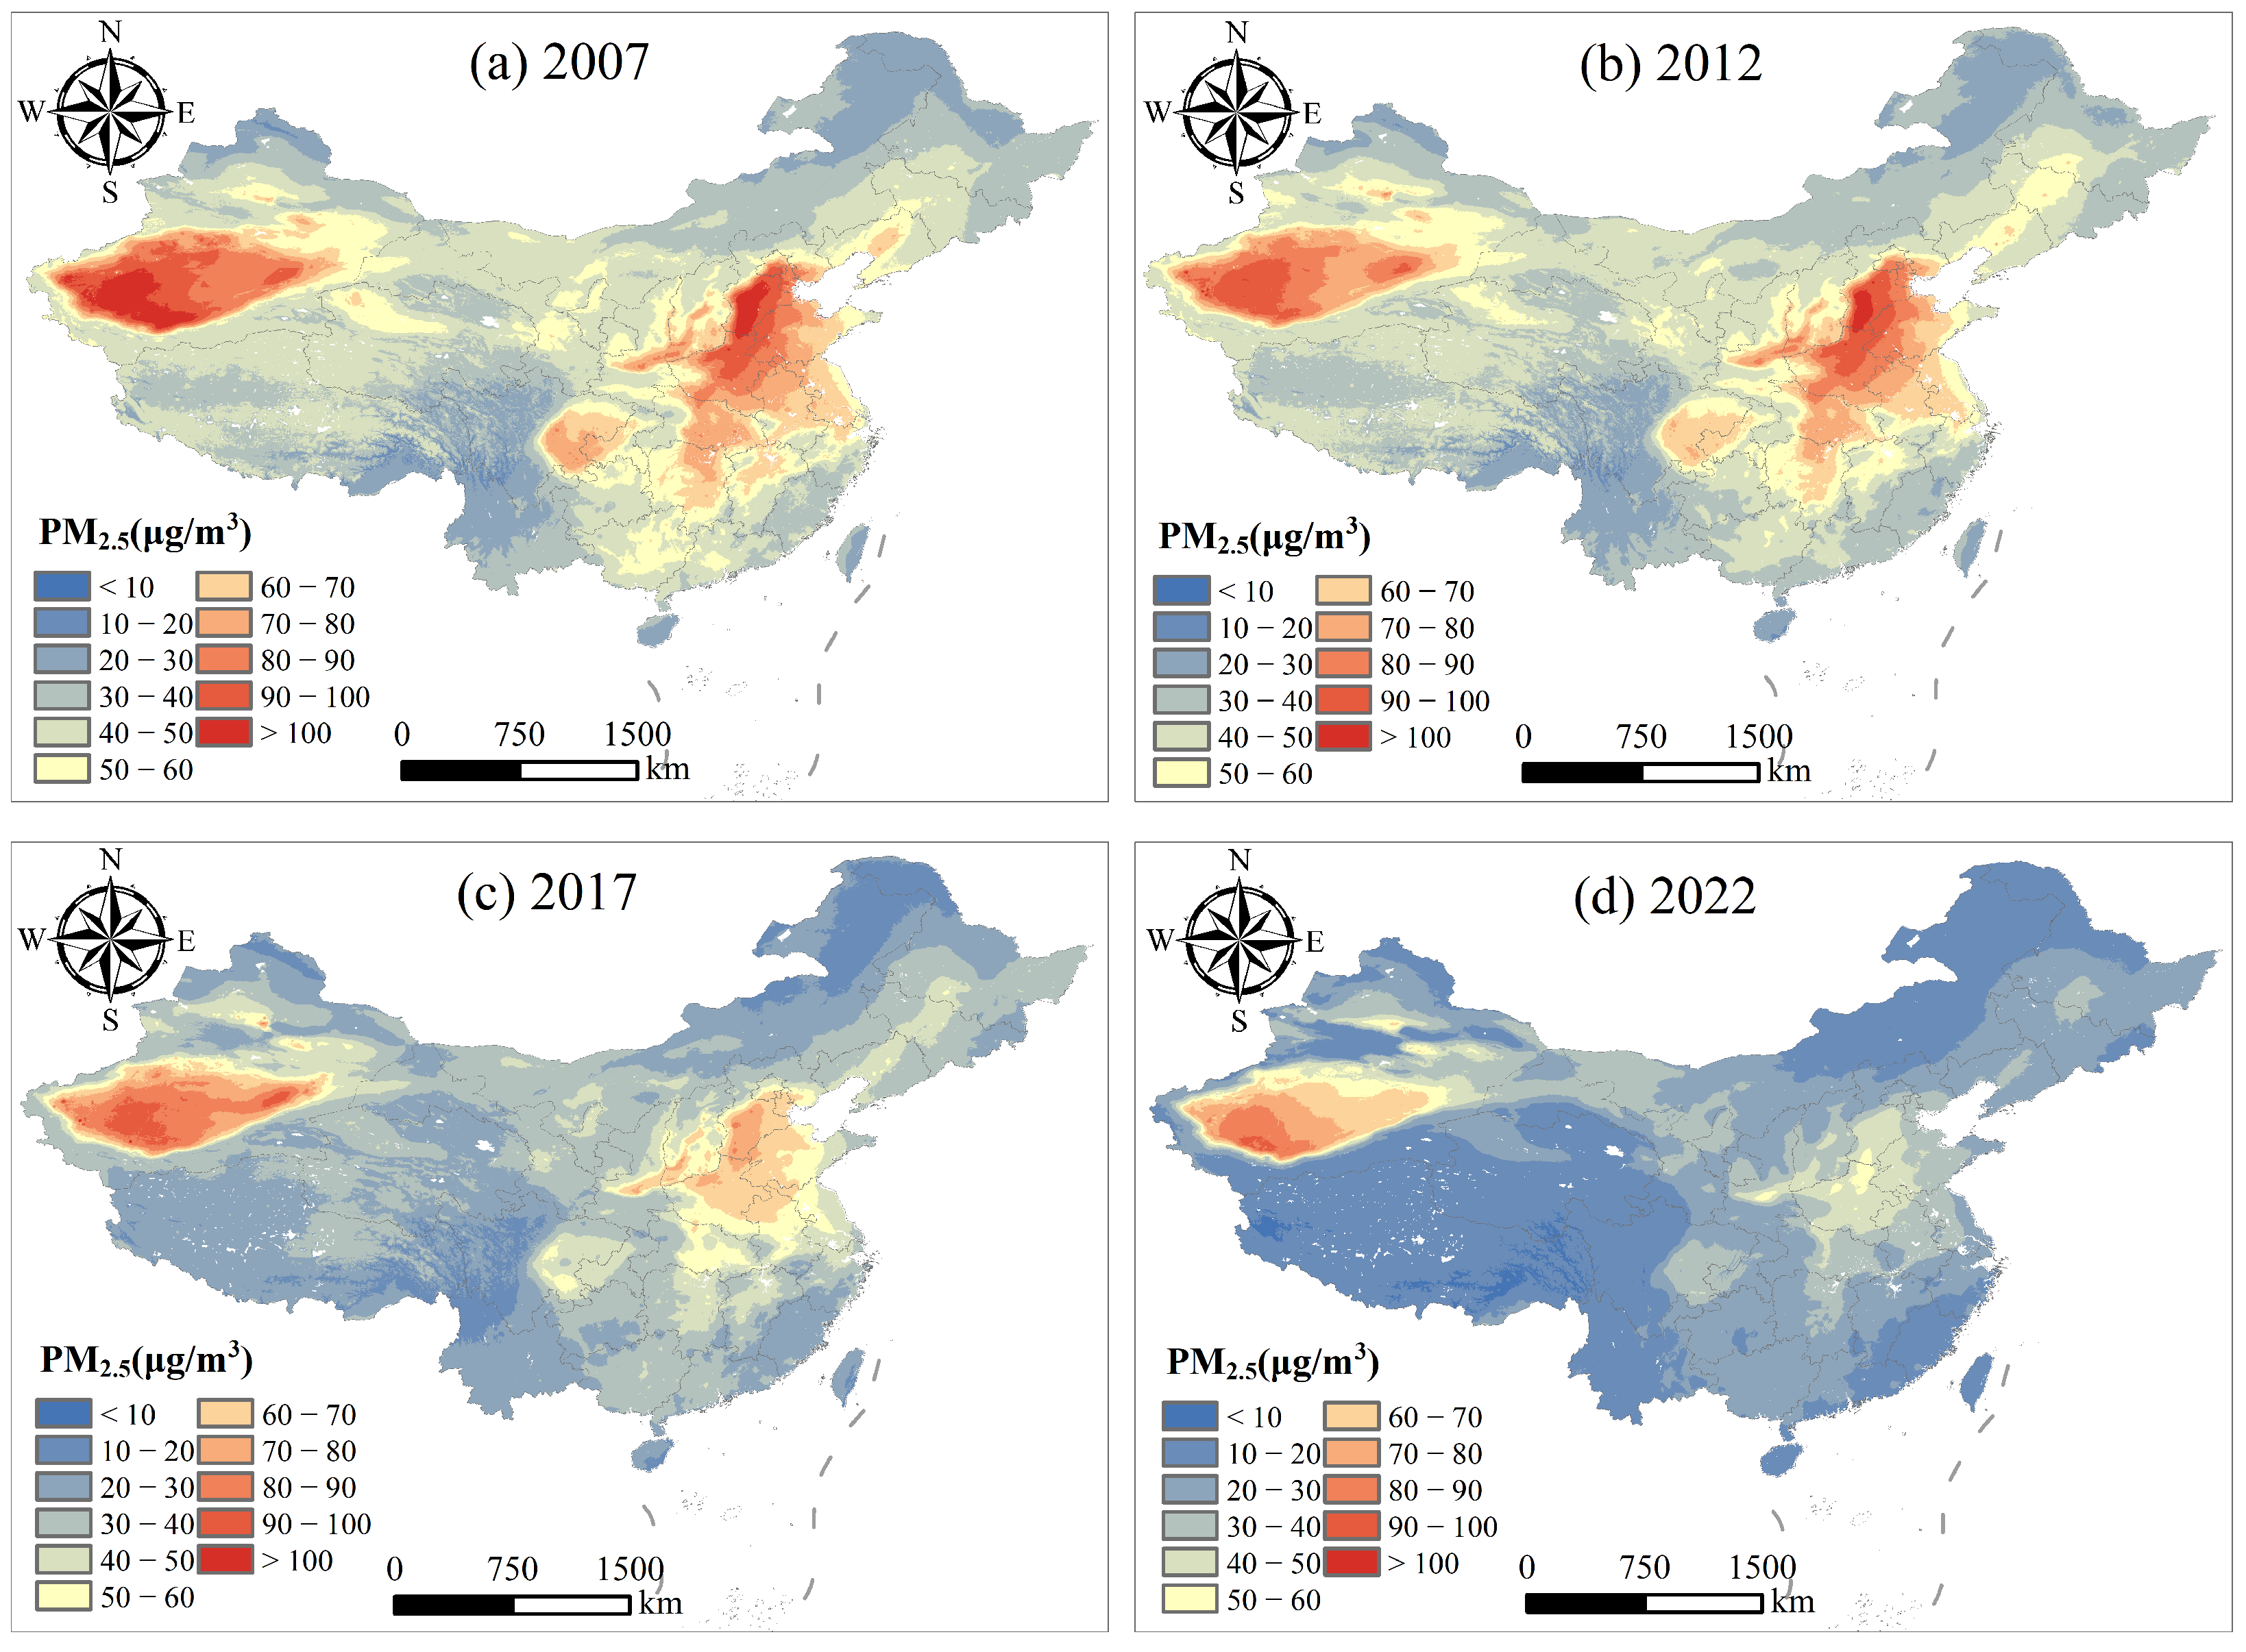
4.1. Distribution Characteristics of PM2.5 Exposure in China
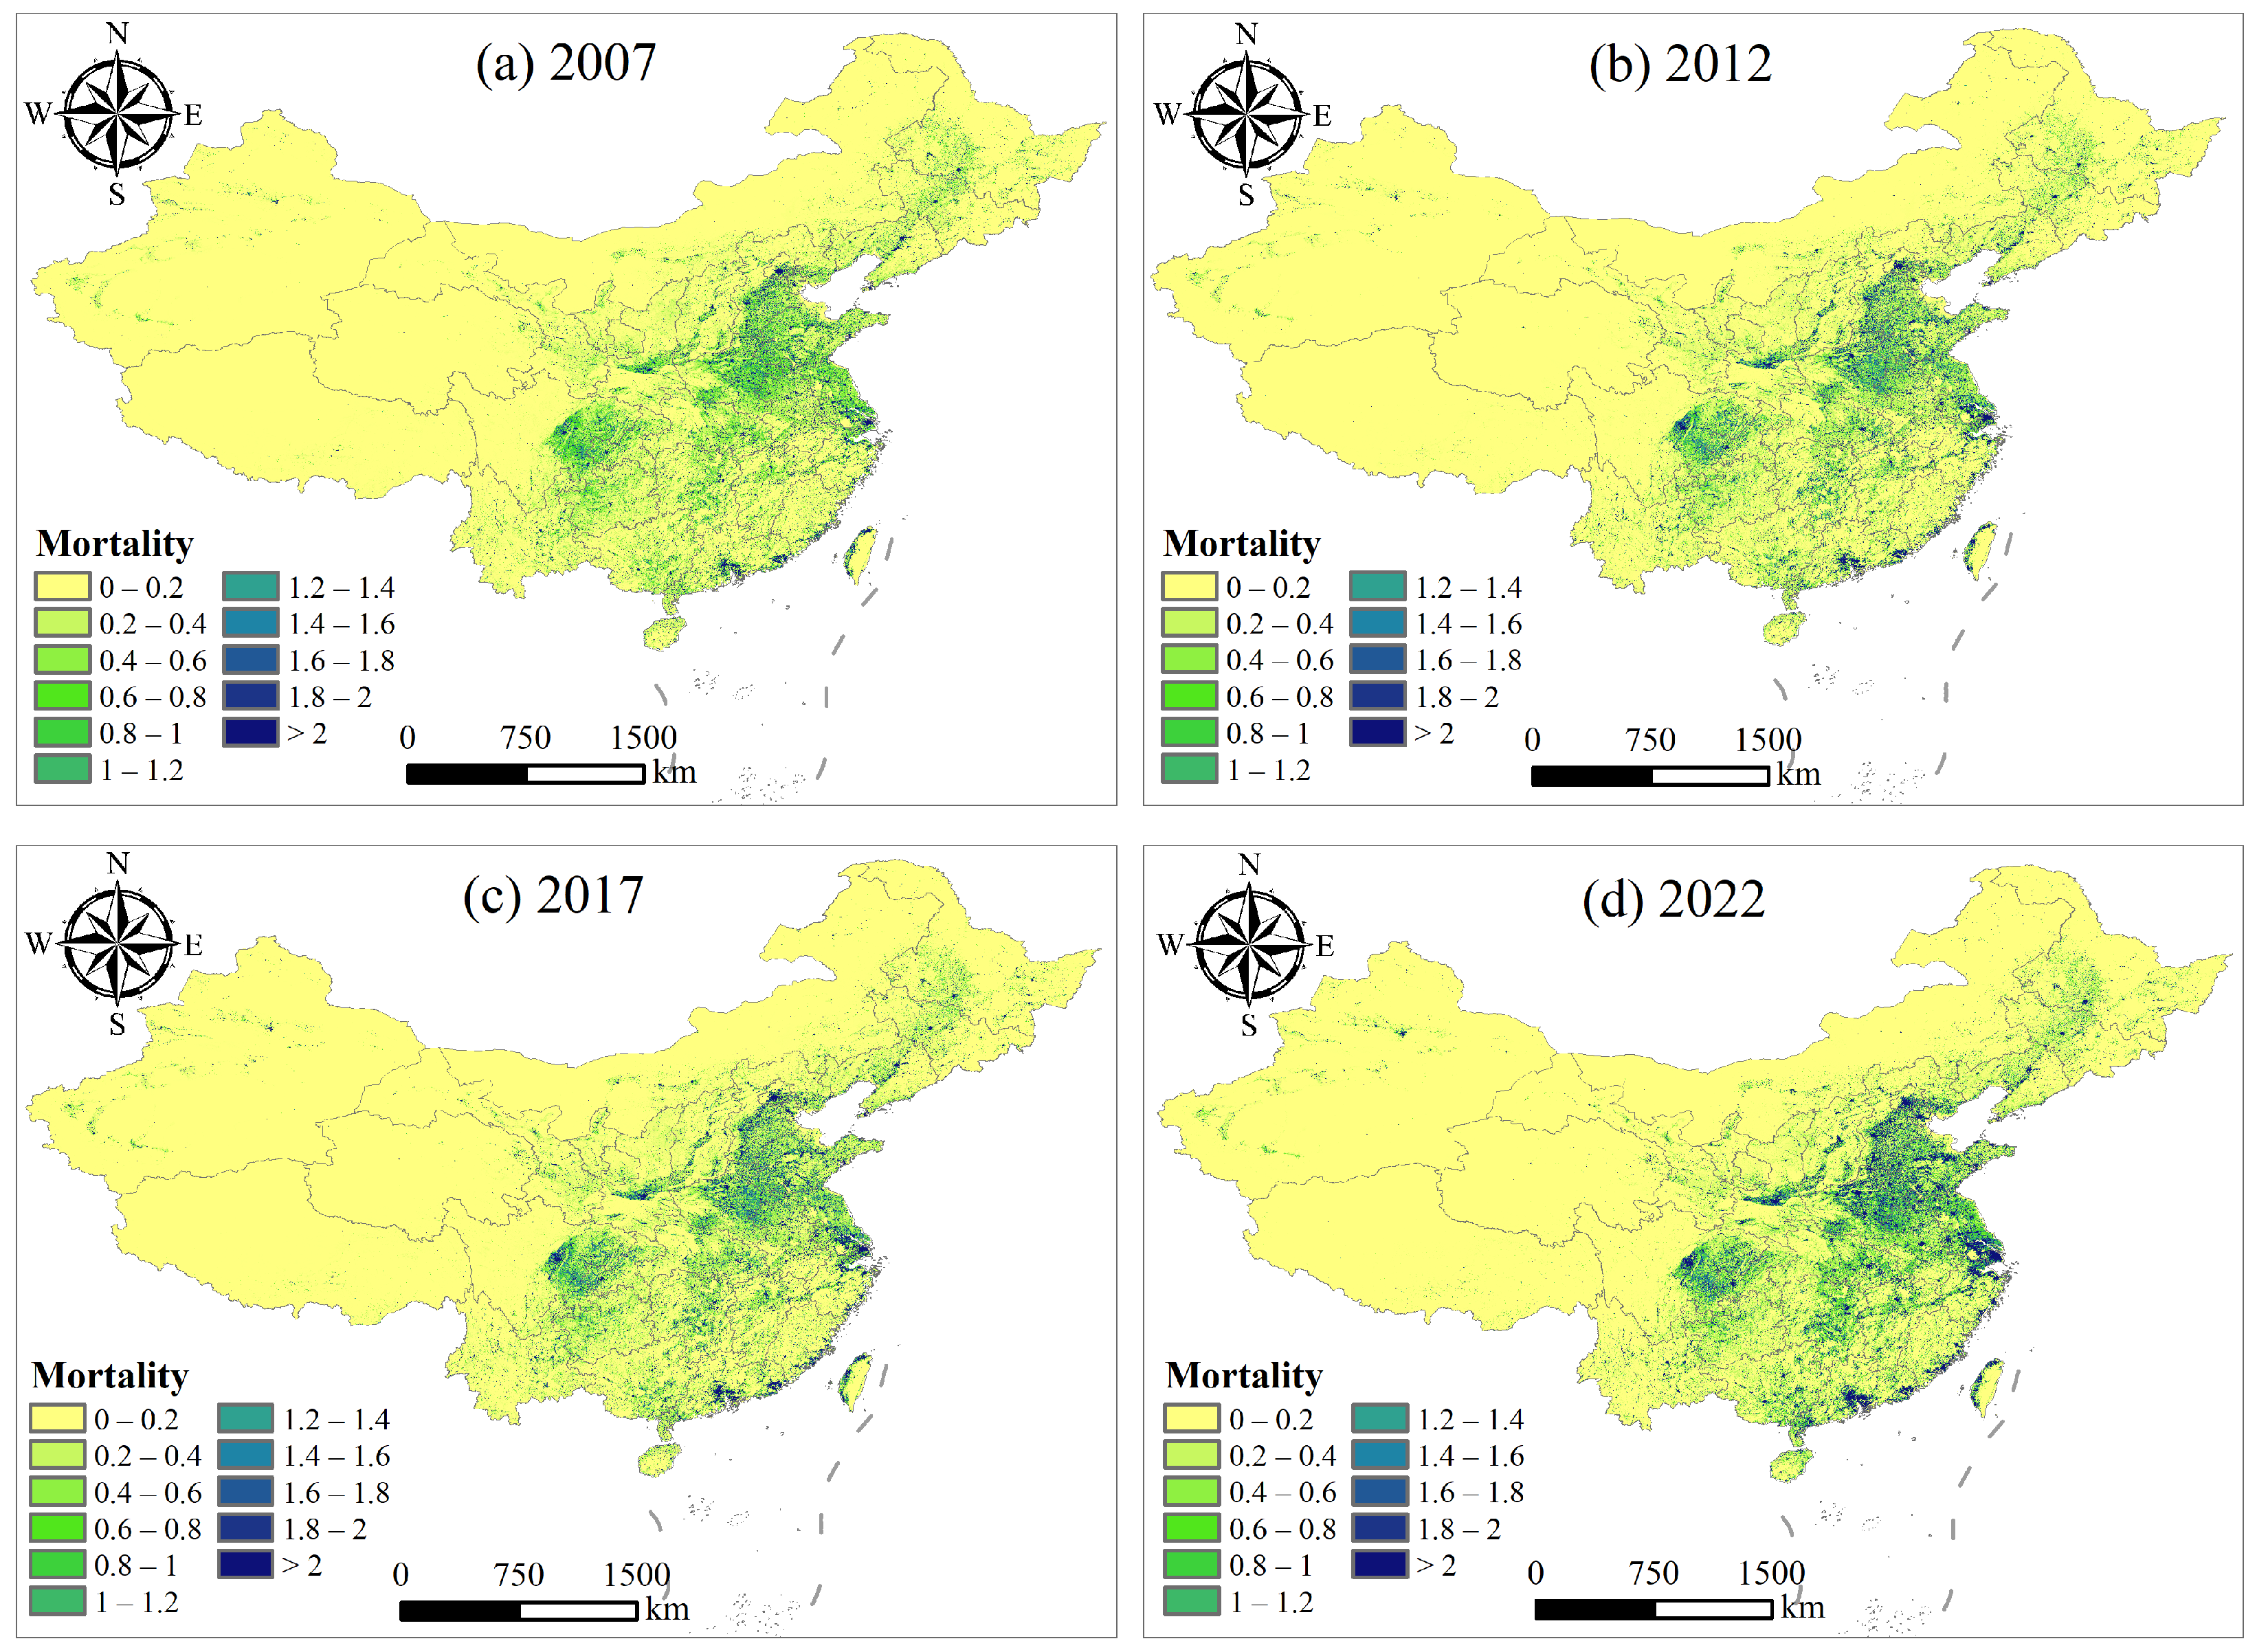
4.2. Distribution of Premature Deaths Due to IHD Attributed to PM2.5 Exposure
4.3. Analysis of Environmental Equity in Premature Mortality Due to IHD Attributed to PM2.5 Exposure
4.4. Strengths and Limitations of This Study
5. Conclusions
Author Contributions
Funding
Institutional Review Board Statement
Informed Consent Statement
Data Availability Statement
Conflicts of Interest
References
- Yu, W.; Liu, S.; Jiang, J.; Chen, G.; Luo, H.; Fu, Y.; Xie, L.; Li, B.; Li, N.; Chen, S.; et al. Burden of ischemic heart disease and stroke attributable to exposure to atmospheric PM2.5 in Hubei province, China. Atmos. Environ. 2020, 221, 117079. [Google Scholar] [CrossRef]
- Liao, P.S.; Shaw, D.; Lin, Y.M. Environmental quality and life satisfaction: Subjective versus objective measures of air quality. Soc. Indic. Res. 2015, 124, 599–616. [Google Scholar] [CrossRef]
- Alexeeff, S.E.; Liao, N.S.; Liu, X.; Van Den Eeden, S.K.; Sidney, S. Long-term PM2.5 exposure and risks of ischemic heart disease and stroke events: Review and meta-analysis. J. Am. Heart Assoc. 2021, 10, e016890. [Google Scholar] [CrossRef] [PubMed]
- Oh, J.; Choi, S.; Han, C.; Lee, D.W.; Ha, E.; Kim, S.; Bae, H.J.; Pyun, W.B.; Hong, Y.C.; Lim, Y.H. Association of long-term exposure to PM2.5 and survival following ischemic heart disease. Environ. Res. 2023, 216, 114440. [Google Scholar] [CrossRef]
- Khan, M.A.; Hashim, M.J.; Mustafa, H.; Baniyas, M.Y.; Al Suwaidi, S.K.B.M.; AlKatheeri, R.; Alblooshi, F.M.K.; Almatrooshi, M.E.A.H.; Alzaabi, M.E.H.; Al Darmaki, R.S.; et al. Global epidemiology of ischemic heart disease: Results from the global burden of disease study. Cureus 2020, 12, e9349. [Google Scholar] [CrossRef]
- Safiri, S.; Karamzad, N.; Singh, K.; Carson-Chahhoud, K.; Adams, C.; Nejadghaderi, S.A.; Almasi-Hashiani, A.; Sullman, M.J.; Mansournia, M.A.; Bragazzi, N.L.; et al. Burden of ischemic heart disease and its attributable risk factors in 204 countries and territories, 1990–2019. Eur. J. Prev. Cardiol. 2022, 29, 420–431. [Google Scholar] [CrossRef]
- Wang, Q.; Cao, J. Atmospheric PM2.5 exposure and risk of ischemic heart disease: A systematic review and meta-analysis of observational studies. Perfusion 2024, 39, 210–222. [Google Scholar] [CrossRef]
- Zhang, Y.; Li, W.; Jiang, N.; Liu, S.; Liang, J.; Wei, N.; Liu, Y.; Tian, Y.; Feng, D.; Wang, J.; et al. Associations between short-term exposure of PM2.5 constituents and hospital admissions of cardiovascular diseases among 18 major Chinese cities. Ecotoxicol. Environ. Saf. 2022, 246, 114149. [Google Scholar] [CrossRef]
- Maji, K.J. Substantial changes in PM2.5 pollution and corresponding premature deaths across China during 2015–2019: A model prospective. Sci. Total Environ. 2020, 729, 138838. [Google Scholar] [CrossRef]
- Liu, M.; Wang, Y.; Liu, R.; Ding, C.; Zhou, G.; Han, L. How magnitude of PM2.5 exposure disparities have evolved across Chinese urban-rural population during 2010–2019. J. Clean. Prod. 2023, 382, 135333. [Google Scholar] [CrossRef]
- Li, L.; Qian, J.; Ou, C.Q.; Zhou, Y.X.; Guo, C.; Guo, Y. Spatial and temporal analysis of Air Pollution Index and its timescale-dependent relationship with meteorological factors in Guangzhou, China, 2001–2011. Environ. Pollut. 2014, 190, 75–81. [Google Scholar] [CrossRef] [PubMed]
- Zhong, Y.; Kong, J.; Jiang, Y.; Zhang, Q.; Ma, H.; Wang, X. Aerosol Evolution and Influencing Factor Analysis during Haze Periods in the Guanzhong Area of China Based on Multi-Source Data. Atmosphere 2022, 13, 1975. [Google Scholar] [CrossRef]
- Van Donkelaar, A.; Martin, R.V.; Brauer, M.; Hsu, N.C.; Kahn, R.A.; Levy, R.C.; Lyapustin, A.; Sayer, A.M.; Winker, D.M. Global estimates of fine particulate matter using a combined geophysical-statistical method with information from satellites, models, and monitors. Environ. Sci. Technol. 2016, 50, 3762–3772. [Google Scholar] [CrossRef]
- Shen, G.; Ru, M.; Du, W.; Zhu, X.; Zhong, Q.; Chen, Y.; Shen, H.; Yun, X.; Meng, W.; Liu, J.; et al. Impacts of air pollutants from rural Chinese households under the rapid residential energy transition. Nat. Commun. 2019, 10, 3405. [Google Scholar] [CrossRef] [PubMed]
- Zheng, H.; Zhao, B.; Wang, S.; Wang, T.; Ding, D.; Chang, X.; Liu, K.; Xing, J.; Dong, Z.; Aunan, K.; et al. Transition in source contributions of PM2.5 exposure and associated premature mortality in China during 2005–2015. Environ. Int. 2019, 132, 105111. [Google Scholar] [CrossRef]
- Yu, M.; Zhu, Y.; Lin, C.J.; Wang, S.; Xing, J.; Jang, C.; Huang, J.; Huang, J.; Jin, J.; Yu, L. Effects of air pollution control measures on air quality improvement in Guangzhou, China. J. Environ. Manag. 2019, 244, 127–137. [Google Scholar] [CrossRef]
- Yue, H.; He, C.; Huang, Q.; Yin, D.; Bryan, B.A. Stronger policy required to substantially reduce deaths from PM2.5 pollution in China. Nat. Commun. 2020, 11, 1462. [Google Scholar] [CrossRef]
- Liu, M.; Huang, Y.; Ma, Z.; Jin, Z.; Liu, X.; Wang, H.; Liu, Y.; Wang, J.; Jantunen, M.; Bi, J.; et al. Spatial and temporal trends in the mortality burden of air pollution in China: 2004–2012. Environ. Int. 2017, 98, 75–81. [Google Scholar] [CrossRef]
- Hayes, R.B.; Lim, C.; Zhang, Y.; Cromar, K.; Shao, Y.; Reynolds, H.R.; Silverman, D.T.; Jones, R.R.; Park, Y.; Jerrett, M.; et al. PM2.5 air pollution and cause-specific cardiovascular disease mortality. Int. J. Epidemiol. 2020, 49, 25–35. [Google Scholar] [CrossRef]
- De Marco, A.; Amoatey, P.; Khaniabadi, Y.O.; Sicard, P.; Hopke, P.K. Mortality and morbidity for cardiopulmonary diseases attributed to PM2.5 exposure in the metropolis of Rome, Italy. Eur. J. Intern. Med. 2018, 57, 49–57. [Google Scholar] [CrossRef]
- Garcia, C.A.; Yap, P.S.; Park, H.Y.; Weller, B.L. Association of long-term PM2.5 exposure with mortality using different air pollution exposure models: Impacts in rural and urban California. Int. J. Environ. Health Res. 2016, 26, 145–157. [Google Scholar] [CrossRef]
- Cao, S.; Wu, D.; Liu, L.; Li, S.; Zhang, S. Decoding the effect of demographic factors on environmental health based on city-level PM2.5 pollution in China. J. Environ. Manag. 2024, 349, 119380. [Google Scholar] [CrossRef]
- Wang, X.; Dewancker, B.J.; Tian, D.; Zhuang, S. Exploring the Burden of PM2.5-Related Deaths and Economic Health Losses in Beijing. Toxics 2024, 12, 377. [Google Scholar] [CrossRef] [PubMed]
- Wang, J.; Xing, J.; Mathur, R.; Pleim, J.E.; Wang, S.; Hogrefe, C.; Gan, C.M.; Wong, D.C.; Hao, J. Historical trends in PM2.5-related premature mortality during 1990–2010 across the northern hemisphere. Environ. Health Perspect. 2017, 125, 400–408. [Google Scholar] [CrossRef]
- Burnett, R.; Chen, H.; Szyszkowicz, M.; Fann, N.; Hubbell, B.; Pope III, C.A.; Apte, J.S.; Brauer, M.; Cohen, A.; Weichenthal, S.; et al. Global estimates of mortality associated with long-term exposure to outdoor fine particulate matter. Proc. Natl. Acad. Sci. USA 2018, 115, 9592–9597. [Google Scholar] [CrossRef]
- Huang, G.; Zhou, W.; Qian, Y.; Fisher, B. Breathing the same air? Socioeconomic disparities in PM2.5 exposure and the potential benefits from air filtration. Sci. Total Environ. 2019, 657, 619–626. [Google Scholar] [CrossRef] [PubMed]
- Zhao, H.; Geng, G.; Zhang, Q.; Davis, S.J.; Li, X.; Liu, Y.; Peng, L.; Li, M.; Zheng, B.; Huo, H.; et al. Inequality of household consumption and air pollution-related deaths in China. Nat. Commun. 2019, 10, 4337. [Google Scholar] [CrossRef]
- World Health Organization (WHO). Ambient (Outdoor) Air Quality and Health. Available online: https://www.who.int/zh/newsroom/fact-sheets/detail/ambient-(outdoor)-air-quality-and-health (accessed on 1 June 2024).
- Xue, T.; Liu, J.; Zhang, Q.; Geng, G.; Zheng, Y.; Tong, D.; Liu, Z.; Guan, D.; Bo, Y.; Zhu, T.; et al. Rapid improvement of PM2.5 pollution and associated health benefits in China during 2013–2017. Sci. China Earth Sci. 2019, 62, 1847–1856. [Google Scholar] [CrossRef]
- Zhang, Z.; Shao, C.; Guan, Y.; Xue, C. Socioeconomic factors and regional differences of PM2.5 health risks in China. J. Environ. Manag. 2019, 251, 109564. [Google Scholar] [CrossRef]
- Lu, F.; Xu, D.; Cheng, Y.; Dong, S.; Guo, C.; Jiang, X.; Zheng, X. Systematic review and meta-analysis of the adverse health effects of ambient PM2.5 and PM10 pollution in the Chinese population. Environ. Res. 2015, 136, 196–204. [Google Scholar] [CrossRef]
- Ambient Air Quality Standard GB3095-2012; Chinese Research Academy of Environmental Sciences. China Standard Press: Beijing, China, 2012.
- HJ618-2011; Determination of Ambient air PM10 and PM2.5 of Gravimetric Method. China Environmental Science Press: Beijing, China, 2011.
- Wei, J.; Li, Z.; Sun, L.; Peng, Y.; Wang, L. Improved merge schemes for MODIS Collection 6.1 Dark Target and Deep Blue combined aerosol products. Atmos. Environ. 2019, 202, 315–327. [Google Scholar] [CrossRef]
- Qin, W.; Fang, H.; Wang, L.; Wei, J.; Zhang, M.; Su, X.; Bilal, M.; Liang, X. MODIS high-resolution MAIAC aerosol product: Global validation and analysis. Atmos. Environ. 2021, 264, 118684. [Google Scholar] [CrossRef]
- Yan, X.; Li, Z.; Shi, W.; Luo, N.; Wu, T.; Zhao, W. An improved algorithm for retrieving the fine-mode fraction of aerosol optical thickness, part 1: Algorithm development. Remote Sens. Environ. 2017, 192, 87–97. [Google Scholar] [CrossRef]
- Yan, X.; Li, Z.; Luo, N.; Shi, W.; Zhao, W.; Yang, X.; Liang, C.; Zhang, F.; Cribb, M. An improved algorithm for retrieving the fine-mode fraction of aerosol optical thickness. Part 2: Application and validation in Asia. Remote Sens. Environ. 2019, 222, 90–103. [Google Scholar] [CrossRef]
- Yan, X.; Zang, Z.; Jiang, Y.; Shi, W.; Guo, Y.; Li, D.; Zhao, C.; Husi, L. A Spatial-Temporal Interpretable Deep Learning Model for improving interpretability and predictive accuracy of satellite-based PM2.5. Environ. Pollut. 2021, 273, 116459. [Google Scholar] [CrossRef] [PubMed]
- Dobson, J.E.; Bright, E.A.; Coleman, P.R.; Durfee, R.C.; Worley, B.A. LandScan: A global population database for estimating populations at risk. Photogramm. Eng. Remote Sens. 2000, 66, 849–857. [Google Scholar]
- Calka, B.; Bielecka, E. Reliability analysis of LandScan gridded population data. The case study of Poland. ISPRS Int. J. Geo-Inf. 2019, 8, 222. [Google Scholar] [CrossRef]
- Meng, X.; Jiang, Z.; Wang, X.; Long, Y. Shrinking cities on the globe: Evidence from LandScan 2000–2019. Environ. Plan. A Econ. Space 2021, 53, 1244–1248. [Google Scholar] [CrossRef]
- Zhou, M.; Wang, H.; Zhu, J.; Chen, W.; Wang, L.; Liu, S.; Li, Y.; Wang, L.; Liu, Y.; Yin, P.; et al. Cause-specific mortality for 240 causes in China during 1990–2013: A systematic subnational analysis for the Global Burden of Disease Study 2013. Lancet 2016, 387, 251–272. [Google Scholar] [CrossRef]
- Lundberg, S.M.; Lee, S.I. A unified approach to interpreting model predictions. In Proceedings of the 31st International Conference on Neural Information Processing Systems, Long Beach, CA, USA, 4–9 December 2017; Volume 3. [Google Scholar]
- Gastwirth, J.L. The estimation of the Lorenz curve and Gini index. Rev. Econ. Stat. 1972, 54, 306–316. [Google Scholar] [CrossRef]
- Sitthiyot, T.; Holasut, K. A simple method for estimating the Lorenz curve. Humanit. Soc. Sci. Commun. 2021, 8, 268. [Google Scholar] [CrossRef]
- Ma, Z.; Hu, X.; Sayer, A.M.; Levy, R.; Zhang, Q.; Xue, Y.; Tong, S.; Bi, J.; Huang, L.; Liu, Y. Satellite-based spatiotemporal trends in PM2.5 concentrations: China, 2004–2013. Environ. Health Perspect. 2016, 124, 184–192. [Google Scholar] [CrossRef] [PubMed]
- He, Q.; Huang, B. Satellite-based mapping of daily high-resolution ground PM2.5 in China via space-time regression modeling. Remote Sens. Environ. 2018, 206, 72–83. [Google Scholar] [CrossRef]
- Wei, J.; Huang, W.; Li, Z.; Xue, W.; Peng, Y.; Sun, L.; Cribb, M. Estimating 1-km-resolution PM2.5 concentrations across China using the space-time random forest approach. Remote Sens. Environ. 2019, 231, 111221. [Google Scholar] [CrossRef]
- Wei, J.; Li, Z.; Cribb, M.; Huang, W.; Xue, W.; Sun, L.; Guo, J.; Peng, Y.; Li, J.; Lyapustin, A.; et al. Improved 1 km resolution PM2.5 estimates across China using enhanced space–time extremely randomized trees. Atmos. Chem. Phys. 2020, 20, 3273–3289. [Google Scholar] [CrossRef]


| Feature | Shapley | Feature | Shapley |
|---|---|---|---|
| AOD | 8.63 | Visibility | 0.54 |
| FMF | 4.11 | Wind speed | 0.50 |
| Temperature | 2.05 | Precipitation | 0.48 |
| DEM | 1.56 | GDP | 0.31 |
| Boundary layer height | 1.21 | Surface pressure | 0.18 |
| Population | 1.12 | Longitude | 0.10 |
| Slope | 0.83 | Latitude | 0.08 |
| Relative humidity | 0.59 |
| Hyperparameter | Value | Hyperparameter | Value |
|---|---|---|---|
| num_boosting_rounds | 180 | gamma | 0.02 |
| learning_rate | 0.05 | min_child_weight | 2 |
| max_depth | 10 | subsample | 1 |
| max_delta_step | 0 | scale_pos_weight | 1 |
| Name | Age Range | Standard Deviation of | ||||
|---|---|---|---|---|---|---|
| IHD | ≥25 | 0.2969 | 0.01787 | 1.9 | 12 | 40.2 |
| 25–29 | 0.5070 | 0.02458 | 1.9 | 12 | 40.2 | |
| 30–34 | 0.4762 | 0.02309 | 1.9 | 12 | 40.2 | |
| 35–39 | 0.4455 | 0.02160 | 1.9 | 12 | 40.2 | |
| 40–44 | 0.4148 | 0.02011 | 1.9 | 12 | 40.2 | |
| 45–49 | 0.3841 | 0.01862 | 1.9 | 12 | 40.2 | |
| 50–54 | 0.3533 | 0.01713 | 1.9 | 12 | 40.2 | |
| 55–59 | 0.3226 | 0.01564 | 1.9 | 12 | 40.2 | |
| 60–64 | 0.2919 | 0.01415 | 1.9 | 12 | 40.2 | |
| 65–69 | 0.2612 | 0.01266 | 1.9 | 12 | 40.2 | |
| 70–74 | 0.2304 | 0.01117 | 1.9 | 12 | 40.2 | |
| 75–79 | 0.1997 | 0.00968 | 1.9 | 12 | 40.2 | |
| ≥80 | 0.1536 | 0.00740 | 1.9 | 12 | 40.2 |
| Region | 2007 | 2012 | 2017 | 2022 |
|---|---|---|---|---|
| China | 47.41 | 45.91 | 35.95 | 25.16 |
| East | 56.84 | 53.13 | 42.01 | 27.14 |
| Northeast | 39.16 | 40.44 | 32.56 | 23.09 |
| Centre | 67.09 | 66.17 | 47.08 | 33.86 |
| North | 43.67 | 42.82 | 33.05 | 23.69 |
| South | 44.97 | 38.65 | 31.59 | 21.38 |
| Northwest | 52.99 | 50.89 | 41.42 | 31.58 |
| Southwest | 38.03 | 37.24 | 27.66 | 15.80 |
| Region | 2007 | 2012 | 2017 | 2012 |
|---|---|---|---|---|
| China | 819,287, 61.96 (720,973, 917,601) | 833,170, 61.53 (733,190, 933,150) | 858,290, 61.75 (755,295, 961,285) | 870,138, 61.66 (765,721, 974,555) |
| East | 242,901, 57.28 (213,753, 272,049) | 251,996, 56.60 (221,757, 282,236) | 259,496, 57.01 (228,356, 290,635) | 262,026, 55.15 (230,583, 293,469) |
| Northeast | 67,589, 60.90 (59,478, 75,699) | 66,902, 61.37 (58,874, 74,930) | 68,849, 64.29 (60,587, 77,111) | 69,885, 66.47 (61,499, 78,272) |
| Centre | 138,096, 57.47 (121,524, 154,667) | 132,607, 56.04 (116,694, 148,520) | 137,384, 55.17 (120,898, 153,870) | 140,963, 54.86 (124,047, 157,878) |
| North | 94,431, 79.04 (83,100, 105,763) | 101,042, 81.82 (88,917, 113,167) | 104,176, 81.47 (91,675, 116,677) | 106,734, 80.08 (93,926, 119,542) |
| South | 91,838, 54.31 (80,818, 102,859) | 101,191, 55.54 (89,048, 113,334) | 103,699, 53.67 (91,255, 116,142) | 103,260, 51.58 (90,869, 115,651) |
| Northwest | 58,169, 62.15 (51,188, 65,149) | 59,607, 61.73 (52,454, 66,760) | 61,336, 61.27 (53,976, 68,696) | 62,653, 61.22 (55,135, 70,172) |
| Southwest | 126,264, 58.04 (111,112, 141,415) | 119,826, 56.72 (105,447, 134,205) | 123,352, 56.21 (108,549, 138,154) | 124,618, 55.81 (109,664, 139,572) |
| Region | 2007 | 2012 | 2017 | 2022 |
|---|---|---|---|---|
| China | 0.026 | 0.029 | 0.028 | 0.025 |
| East | 0.028 | 0.023 | 0.019 | 0.023 |
| Northeast | 0.026 | 0.032 | 0.024 | 0.021 |
| Centre | 0.024 | 0.034 | 0.036 | 0.027 |
| North | 0.033 | 0.026 | 0.031 | 0.023 |
| South | 0.018 | 0.023 | 0.016 | 0.017 |
| Northwest | 0.034 | 0.038 | 0.040 | 0.028 |
| Southwest | 0.023 | 0.027 | 0.032 | 0.034 |
Disclaimer/Publisher’s Note: The statements, opinions and data contained in all publications are solely those of the individual author(s) and contributor(s) and not of MDPI and/or the editor(s). MDPI and/or the editor(s) disclaim responsibility for any injury to people or property resulting from any ideas, methods, instructions or products referred to in the content. |
© 2024 by the authors. Licensee MDPI, Basel, Switzerland. This article is an open access article distributed under the terms and conditions of the Creative Commons Attribution (CC BY) license (https://creativecommons.org/licenses/by/4.0/).
Share and Cite
Zhong, Y.; Guo, Y.; Liu, D.; Zhang, Q.; Wang, L. Spatiotemporal Patterns and Equity Analysis of Premature Mortality Due to Ischemic Heart Disease Attributable to PM2.5 Exposure in China: 2007–2022. Toxics 2024, 12, 641. https://doi.org/10.3390/toxics12090641
Zhong Y, Guo Y, Liu D, Zhang Q, Wang L. Spatiotemporal Patterns and Equity Analysis of Premature Mortality Due to Ischemic Heart Disease Attributable to PM2.5 Exposure in China: 2007–2022. Toxics. 2024; 12(9):641. https://doi.org/10.3390/toxics12090641
Chicago/Turabian StyleZhong, Yanling, Yong Guo, Dingming Liu, Qiutong Zhang, and Lizheng Wang. 2024. "Spatiotemporal Patterns and Equity Analysis of Premature Mortality Due to Ischemic Heart Disease Attributable to PM2.5 Exposure in China: 2007–2022" Toxics 12, no. 9: 641. https://doi.org/10.3390/toxics12090641