Article

The Impact of Ambient Air Pollution on Allergic Rhinitis Symptoms: A Prospective Follow-Up Study

1
School of Public Health, Hangzhou Medical College, 182 Tianmushan Road, Xihu District, Hangzhou 310013, China
2
The Second School of Clinical Medicine, Zhejiang Chinese Medical University, 548 Binwen Road, Binjiang District, Hangzhou 310053, China
*
Authors to whom correspondence should be addressed.
Toxics 2024, 12(9), 663; https://doi.org/10.3390/toxics12090663
Submission received: 25 July 2024 / Revised: 1 September 2024 / Accepted: 6 September 2024 / Published: 11 September 2024
(This article belongs to the Special Issue Health Effects of Exposure to Environmental Pollutants)

Abstract

:
Air pollution has become a serious public health problem and there is evidence that air pollution affects the incidence of allergic rhinitis. To further investigate the effect of ambient air pollutants on the severity of allergic rhinitis symptoms, a prospective follow-up study in patients with allergic rhinitis was conducted. A total of 167 allergic rhinitis patients with a mean age of 35.4 years, who were visiting the hospital, were enrolled. The daily symptom severity of allergic rhinitis and the concentrations of six air pollutants, including PM2.5, PM10, SO2, CO, O3 and NO2, were collected through follow-up investigations. The impact of ambient air pollutants on symptom severity was assessed via multi-pollutant models. Among several typical ambient air pollutants, we observed correlations of allergic rhinitis symptoms with PM2.5, PM10, CO, SO2 and NO2, whereas O3 showed no such correlation. Specifically, PM2.5 and PM10 were significantly associated with sneezing and nasal blockage. NO2 was significantly correlated with symptoms of rhinorrhea, itchy nose and itchy eyes. CO was significantly linked to sneezing and nasal blockage symptoms. These air pollutants not only had a direct impact on allergic rhinitis symptoms but also exhibited a lagging effect. This study indicates that short-term exposure to air pollutants is associated with exacerbation of nasal symptoms in patients with allergic rhinitis, leading to a decline in their quality of life.

1. Introduction

Since the onset of global industrialization, the pollution problem has become increasingly serious. To date, air pollution remains a major public health problem. In fact, according to a report released by the World Health Organization (WHO) in 2022, 99% of the global population lived in places that failed to meet the air quality guidelines of the WHO [1]. It was further estimated that outdoor ambient air pollution contributed to 4.2 million premature deaths globally in 2019 [2]. Research on air pollution and respiratory health has been extensive, driven by the direct impact of air pollutants on the human respiratory system. Numerous studies have demonstrated associations between air pollution and health issues such as acute lower respiratory infections, chronic obstructive pulmonary disease (COPD), asthma, lung cancer and allergic rhinitis [3]. These studies also highlight that there is no identified threshold below which exposure to air pollution can be deemed safe [4,5].
Allergic rhinitis, one of the most prevalent chronic diseases globally, is typically characterized by sneezing, nasal itching, nasal blockage and runny nose. It affects an estimated 10–40% of the global population, annually contributing to approximately USD 17.5 billion in health-related economic losses [6]. For those afflicted, allergic rhinitis can cause sleep disturbances, fatigue, mood depression, reduced sense of smell and cognitive impairment, thereby profoundly impacting their quality of life and productivity in both learning and work settings [7,8]. Furthermore, allergic rhinitis stands as a notable risk factor for asthma, otitis media and allergic conjunctivitis. Prolonged exposure to allergic rhinitis can exacerbate or precipitate lower respiratory tract disorders, particularly asthma [9]. Allergic rhinitis is a multifactorial disease determined by a combination of genetics and the environment. In recent decades, the prevalence of allergic rhinitis among populations has risen steadily, with atmospheric pollution increasingly recognized as a pivotal environmental risk factor [10]. Epidemiological investigations have revealed that exposure to airborne fine particulate matter (PM2.5) was associated with heightened rates of clinic visits for allergic rhinitis [11]. Animal studies demonstrated that PM2.5 exposure exacerbated nasal allergy symptoms in an ovalbumin (OVA) sensitized murine model of allergic rhinitis [12].
The role of PM2.5 in allergic rhinitis has been extensively studied, revealing its capacity to induce cellular oxidative stress and inflammatory responses, particularly in inflamed nasal mucosal epithelial cells [11,13]. PM2.5-induced oxidative stress is postulated as a mechanism exacerbating allergic rhinitis symptoms [14]. An allergic rhinitis mouse model study demonstrated that N-acetylcysteine, as an antioxidant agent, alleviated PM2.5-induced symptoms, underscoring involvement of PM2.5 in oxidative stress and inflammation [14]. With advancing research, the epigenetic impacts of PM2.5 have been gaining attention in the last decade. Exposure to PM2.5 in the nasal mucosa of allergic rhinitis rats induced oxidative stress, which triggered autophagy through the damage of DNA, RNA and proteins. This process potentially exacerbated the condition by intensifying autophagy activity. Furthermore, they discovered that miR-338-3p effectively suppressed the autophagy induced by PM2.5 [15]. In an allergic rhinitis mouse model, it was shown that PM2.5 exposure led to the elevated DNA methylation of the IFN-γ gene promoter in CD4+ T cells, mediated by the ERK-DNMT pathway. This resulted in a reduction in Th1 cell numbers, a perpetuation of the Th1/Th2 imbalance and the exacerbation of allergic rhinitis [16].
Unlike the case with PM2.5, epidemiological inquiries into the relationship between sulfur dioxide (SO2) and allergic rhinitis have produced a heterogenous set of results: whereas certain studies have discerned a connection between SO2 exposure and the onset of allergic rhinitis [17], others fail to corroborate this association [18], thereby highlighting an inconclusive landscape. Besides variations in research methodologies, factors such as geographical differences, distinct time frames and the diversity of study populations have also contributed to the complexity of understanding how SO2 impacts allergic rhinitis. In an experiment utilizing an HDM-induced allergic rhinitis mouse model, brief exposure to SO2 not only augmented nasal symptom severity but also elevated serum Immunoglobulin E (IgE) levels and increased the infiltration of eosinophils in allergic rhinitis mice, alongside up-regulated expression of Th1/Th2/Th17 cytokines in the nasal mucosa. Strikingly, they found that prolonged SO2 exposure had the opposing effect of reducing serum IgE levels in these mice [19]. While numerous studies attest to the influence of ozone (O3), nitrogen dioxide (NO2), carbon monoxide (CO) and SO2 on the progression of allergic rhinitis, there is still a relative dearth of dedicated research in this area.
In the realm of epidemiological explorations of allergic rhinitis in relation to air pollution, numerous researchers have employed retrospective studies [20,21,22] as well as cohort study designs [23,24] to explore the relationships between ambient pollutant concentrations and outpatient-visit frequencies. Existing epidemiological and experimental research has illuminated the link between air pollution and allergic rhinitis, but many questions remain undetermined. One such question pertains to whether a discernible time-delay exists between pollutant exposure and allergic rhinitis symptoms. More attention has been paid to the effects of air pollutants on the incidence and prevalence of allergic rhinitis [25,26], whereas less environmental epidemiological research has been conducted on the effects of ambient air pollutants on the severity of allergic rhinitis symptoms—essentially, on the progression and exacerbation of the condition. These knowledge gaps limit our comprehensive understanding of disease mechanisms and hinder the development of precise prevention and treatment strategies.
In view of the above background, this study aimed to investigate in depth the dynamic relationship between ambient air pollution levels and allergic rhinitis symptoms through a prospective study, with a special focus on the effect on symptoms of fluctuations in pollutants. By integrating data from multiple sources, including air quality monitoring records and the medical records of allergic rhinitis patients, this study could provide new evidence to elucidate the impact of air pollution on allergic rhinitis.

2. Materials and Methods

2.1. Study Design and Participants

This panel study, conducted from May 2023 to January 2024, recruited patients with allergic rhinitis who visited the same hospital and had lived continuously in Hangzhou city, China, for at least one year. Ultimately, 167 participants agreed to and completed the research study, all of whom lived within 5 km of the hospital. The age range of the participants was around 35 years. Baseline investigations were conducted to gather the demographic details, the medical histories, the family histories and the lifestyle habits of the subjects, which were considered as control variables in the analysis. All included subjects were diagnosed with allergic rhinitis by professional physicians according to the guidelines for the Diagnosis and Treatment of Allergic Rhinitis in China [9]; these guidelines encompass recurrent symptoms such as sneezing, rhinorrhea, nasal blockage and nasal itching, alongside serological confirmation of specific IgE antibodies to allergens. Individuals with severe cardiopulmonary conditions, immune system disorders, those undergoing immunosuppressive therapies, pregnant or breastfeeding individuals and those with non-allergic rhinitis, nasal polyps, or chronic sinusitis were excluded from this study. During the entire study period, the allergic rhinitis symptoms were tracked daily through questionnaires (Table S1). All patients completed the survey and had complete symptom data. Ethical clearance for this research was obtained from the Ethics Committee of Hangzhou Medical College and written informed consent was secured from all participants prior to their enrollment in this study.

2.2. Measurement of Ambient Air Pollution Data

Atmospheric quality monitoring data were collected from the China National Environmental Monitoring Center (CNEMC, http://www.cnemc.cn/ (accessed on 24 April 2024)), as announced by the local environmental protection monitoring center. The data were obtained from the average daily air monitoring report in Hangzhou City, where the daily average concentration of ambient air pollutants is calculated as the arithmetic mean of the hourly concentrations over a 24 h period (O3 concentration value is the arithmetic mean of the ozone concentration over the largest consecutive 8 h period of the day). This study focused on the main air pollutants monitored in daily life, including PM10, PM2.5, O3, SO2, NO2 and CO. This study employed the daily average concentrations of these pollutants as reported by the monitoring center.

2.3. Health Effect Measurements

Throughout the follow-up period of this study, information on the allergic rhinitis symptoms of the study subjects was collected. In accordance with the Chinese Guideline for Allergic Rhinitis [9], symptoms included sneezing (the number of episodes of paroxysmal sneezing in a day), rhinorrhea (the number of episodes of nose blowing in a day), nasal blockage and nasal itching, as well as eye itching. The symptom scoring system ranged from a minimum of 0 to a maximum of 3. Details of the specific allergic rhinitis symptom scoring system are presented in Table S1.

2.4. Statistical Analysis

All data were expressed as mean ± standard deviation (SD) for the continuous variables or as percentages for the categorical variables. Spearman correlation analysis was used to investigate the correlation between the pollutants. Based on the previous literature [27], generalized linear mixed models (GLMMs) were employed to analyze the nasal symptom changes according to air pollutants among patients, incorporating each unique identifier of the study subject (as a random intercept model) to account for the repeated measurements of symptoms. Guided by the Akaike Information Criterion (AIC), this study exhaustively examined various pollutants and ultimately constructed models encompassing the six atmospheric pollutants, with stratification based on the included pollutants. Given the interdependence among levels of air pollutants, we compared each optimal multi-pollutant model based on the number of pollutants included. The formula for the GLMM is as follows:
Yit = b0 + ui + A1X1 + … + AnXn + β Pollutants + εit
where Yit is the allergic rhinitis symptom score in the i-th subject at time t, b0 means the total intercept, ui means the random intercept for the subject i, X1–Xn mean covariates, A1–An are regression coefficients for X1–Xn, β means the regression coefficient for air pollutant and εit is the error for the i-th subject at time t.
The corresponding symptoms were represented by β-values, which can be positive or negative: positive values indicate an increase in the health effect with an increase in pollutant concentration, while negative values indicate a decrease in the health effect. When the 95% confidence intervals of the β-values include zero, there is no significant correlation between the level of exposure to the pollutant and the health outcome. All statistical analyses were conducted using R software version 4.4.1 (R Foundation for Statistical Computing) and a two-tailed p-value < 0.05 was deemed statistically significant.

3. Results

3.1. Participants

The baseline characteristics of the participants and their symptom scores at enrollment are presented in Table 1. A total of 167 participants were enrolled in this study, with a mean age of 35.4 years. In total, 60 of the participants (35.9%) were male and 107 (64.1%) were female. The mean body mass index (BMI) was 23.9 ± 3.9 kg/m2 for males and 21.1 ± 2.5 kg/m2 for females. The mean serum IgE level among participants was 376.5 IU/mL. Among the participants, 13 (7.8%) were smokers, while 154 (92.2%) were non-smokers. Additionally, 24 (14.4%) participants were alcohol consumers and 143 (85.6%) were non-drinkers. At the time of enrollment, the study participants exhibited symptom scores for allergic rhinitis as follows: sneezing scored 1.4 ± 0.8, nasal blockage scored 2.3 ± 0.8, rhinorrhea scored 1.7 ± 0.7, an itchy nose scored 1.5 ± 0.8 and itchy eyes scored 1.4 ± 0.9. These scores indicate that allergic rhinitis was indeed affecting the daily lives of the study subjects.

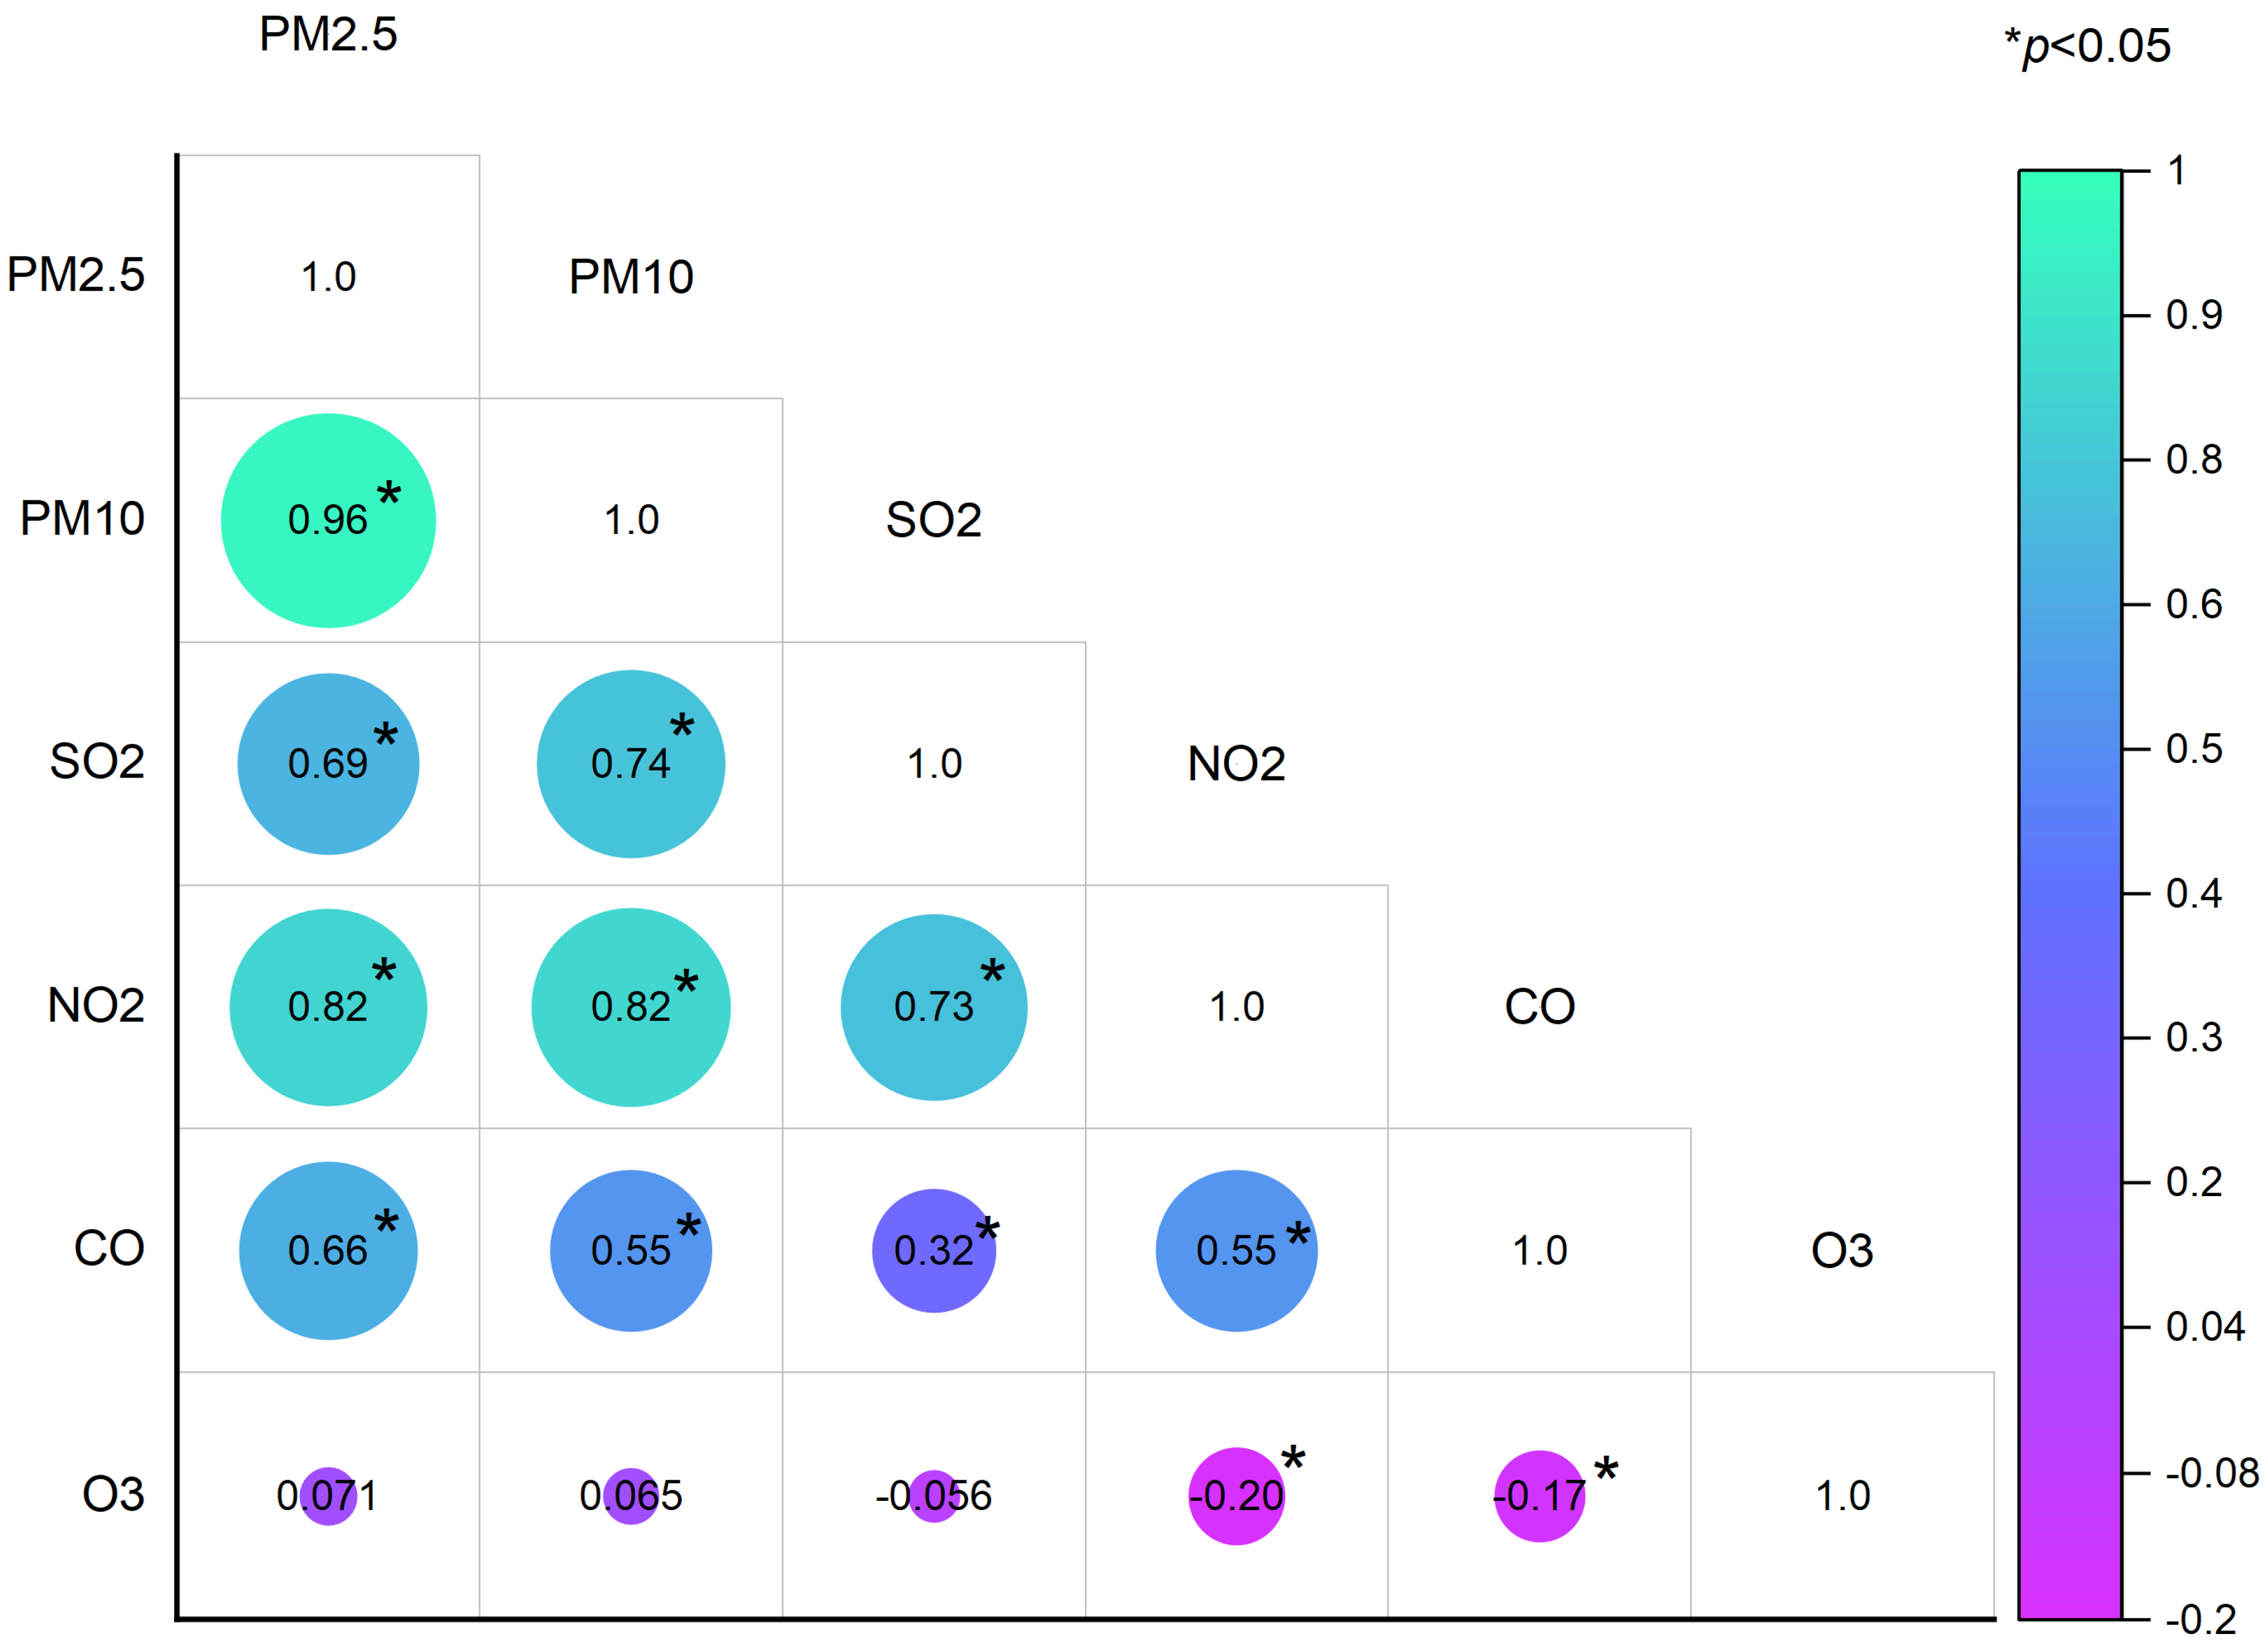
3.2. Ambient Air Pollution

Table 2 illustrates the daily average concentrations of ambient air pollutants on a monthly basis during the follow-up study period. Notably, PM2.5, PM10, SO2 and NO2 exhibited evident variations over the progression of months. Specifically, concentrations in the atmosphere demonstrated a gradual decline from May through July, followed by an upward trend from July until January of the following year. Figure 1 depicts the correlations among these air pollutants. These included significant correlations between PM2.5 and PM10 (r = 0.96), PM2.5 and SO2 (r = 0.69), PM2.5 and NO2 (r = 0.82), PM2.5 and CO (r = 0.66), PM10 and SO2 (r = 0.74), PM10 and NO2 (r = 0.82), PM10 and CO (r = 0.55), SO2 and NO2 (r = 0.73), SO2 and CO (r = 0.32), NO2 and CO (r = 0.55), NO2 and O3 (r = −0.20) and CO and O3 (r = −0.17).

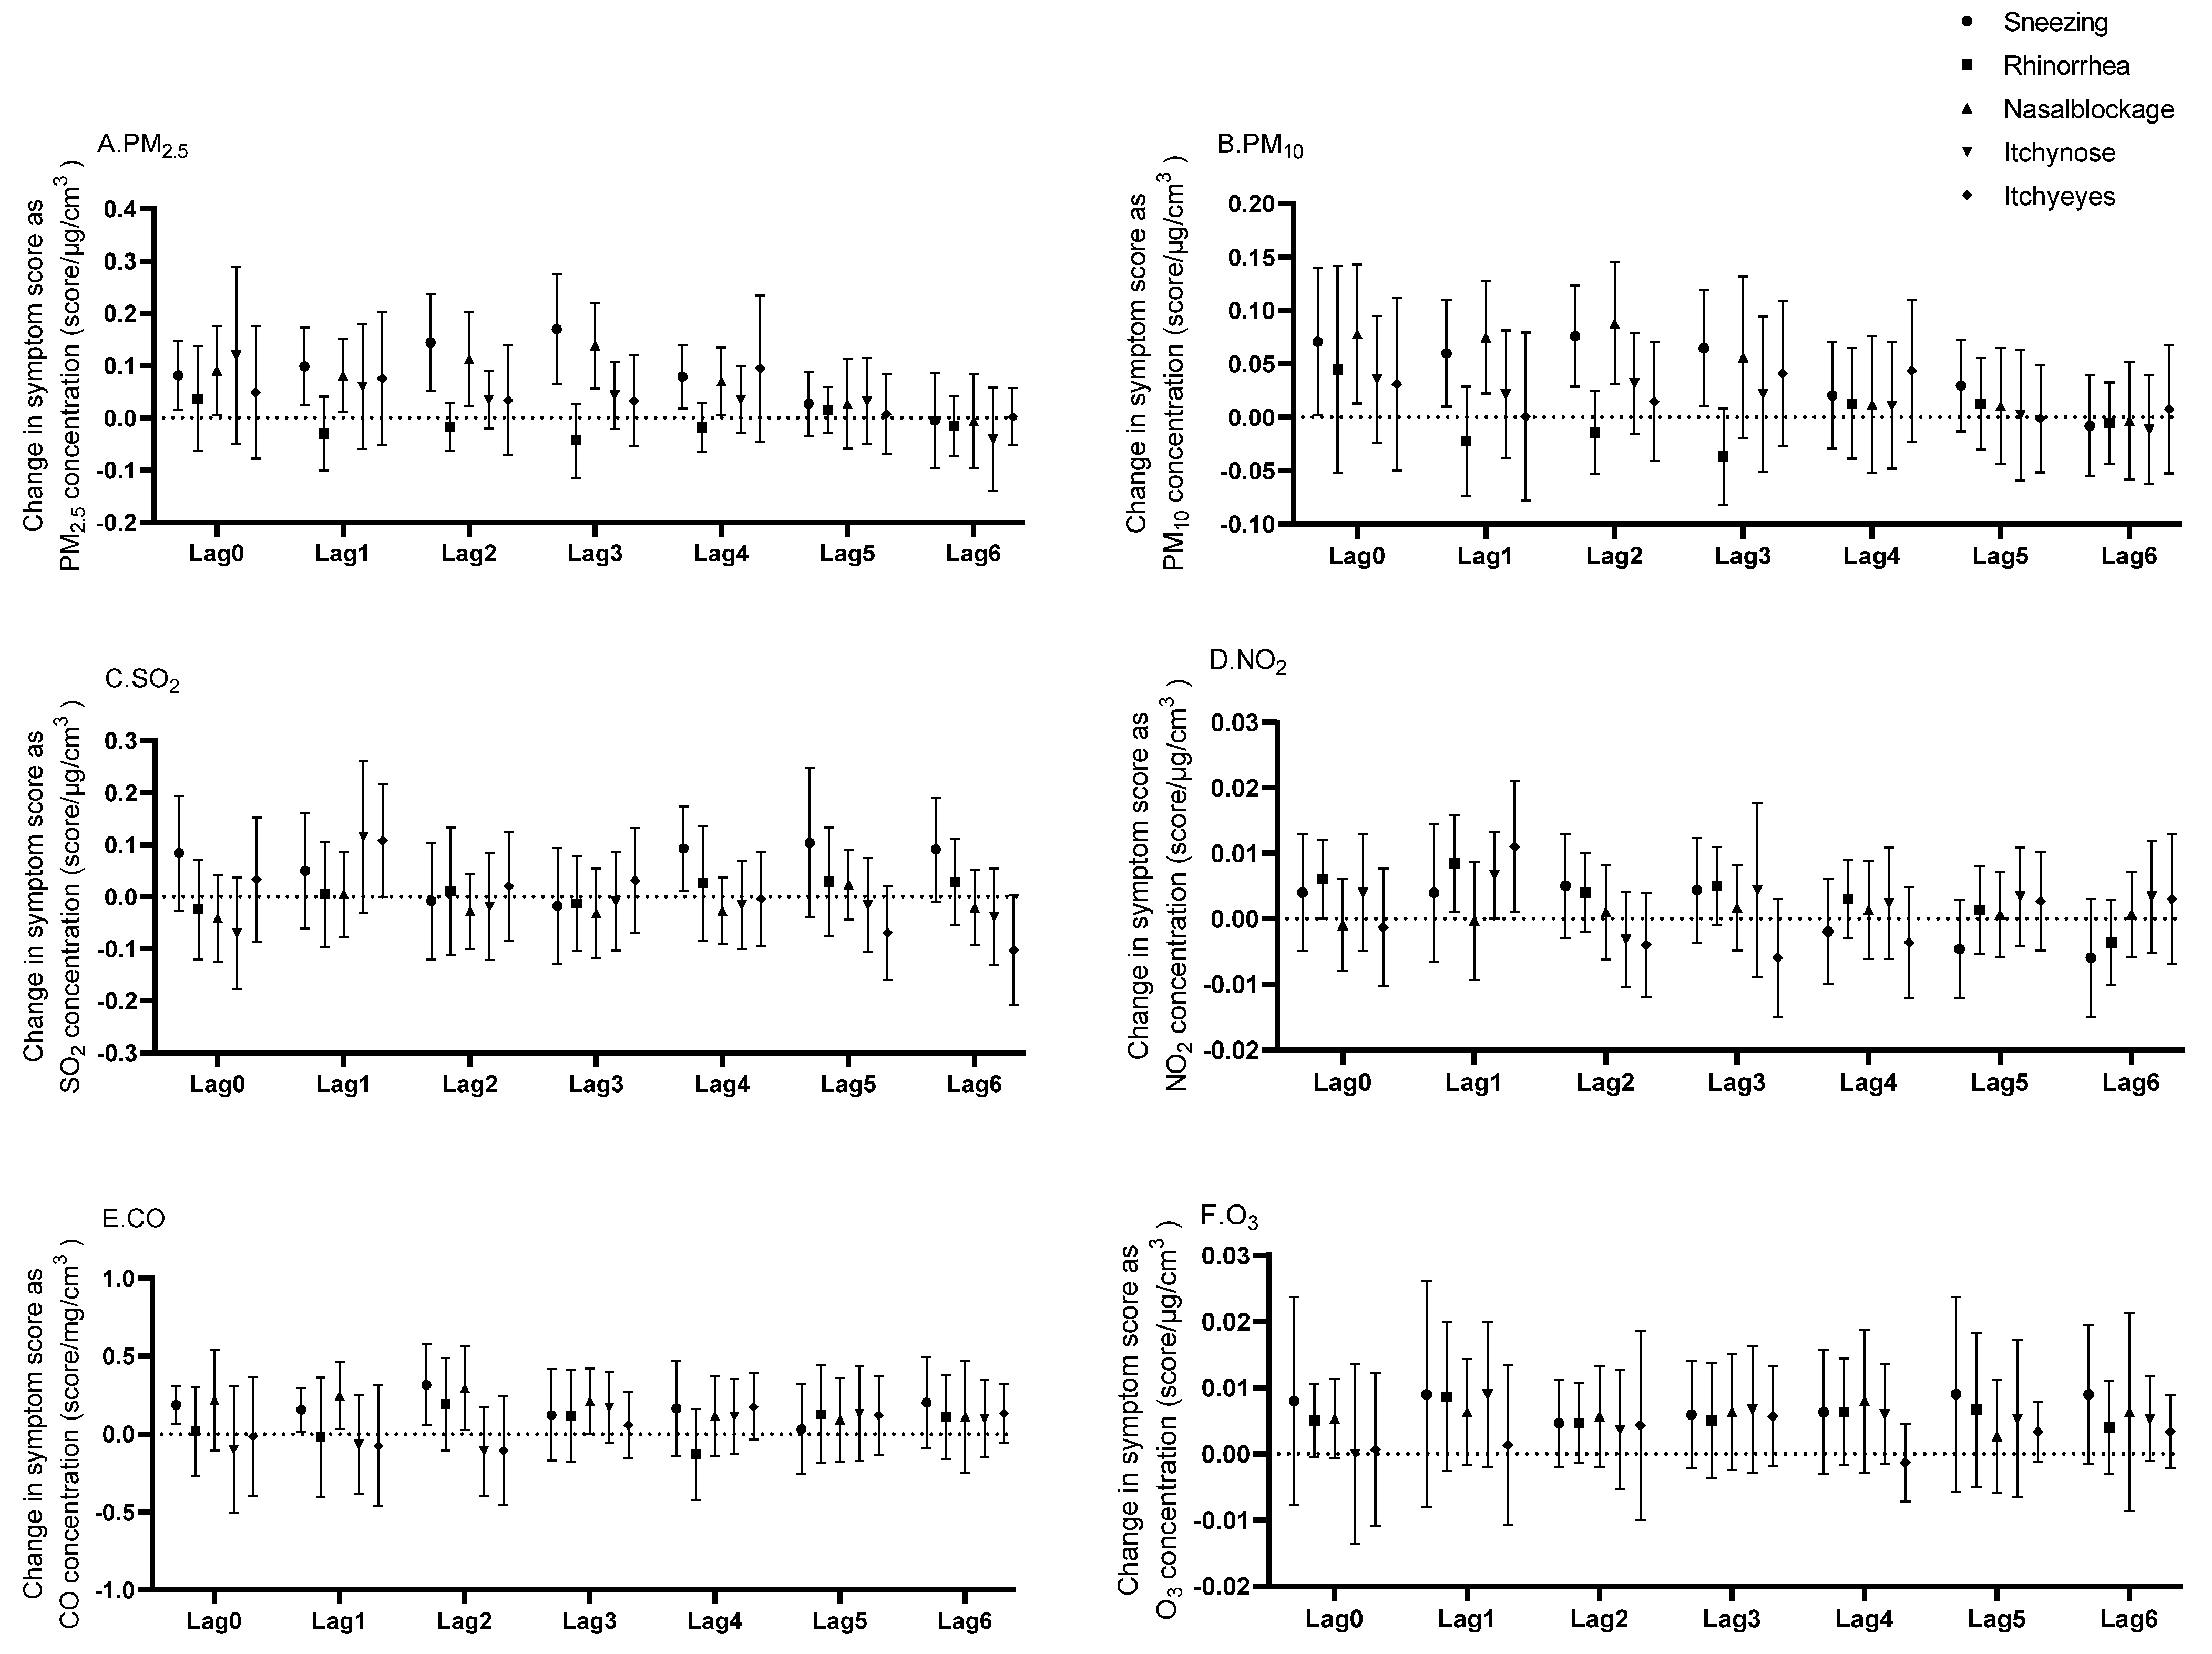
3.3. Lagged Effects of Ambient Air Pollutants on Allergic Rhinitis Symptoms

The lagged effects of the ambient air pollutants on allergic rhinitis symptoms are shown in Figure 2 and Figure S1 and in Table S2. The symptom scores indicate the severity of the symptoms, with higher scores indicating greater severity (Table S1). The β-values represent the change in symptom scores for each unit increase in pollutant concentration. PM2.5 emerged as a prominent influencer, showing statistically significant links with both sneezing (β ranging from 0.072 to 0.141, with p-values between <0.001 and 0.041) and nasal blockage (β ranging from 0.068 to 0.123, p-values from 0.006 to 0.034) across lags 0 to 4, peaking in impact at lag 3 for sneezing (β = 0.141, p = 0.019) and nasal blockage (β = 0.123, p = 0.006). PM10 also demonstrated a significant association with sneezing across lags 0 to 3 (β ranging from 0.052 to 0.082, p-values from 0.009 to 0.045) and with nasal blockage from lags 0 to 2 (β ranging from 0.071 to 0.081, p-values from 0.002 to 0.024). NO2 exhibited significant correlations with rhinorrhea over lags 0 to 1 (β ranging from 0.006 to 0.008, p-values from 0.030 to 0.048). CO showed significant correlations with sneezing from lags 0 to 2 (β ranging from 0.122 to 0.283, p-values from 0.001 to 0.021), with the highest impact observed at lag 2 (β = 0.283, p = 0.001) and it was correlated with nasal blockage from lag 1 to lag 3 (β ranging from 0.101 to 0.236, p-values from 0.008 to 0.032), reaching its maximum effect on nasal blockage at lag 2 (β = 0.236, p = 0.008). SO2 was significantly correlated with sneezing specifically at lag 4 (β = 0.093, p = 0.025).

4. Discussion

This study investigated the association between allergic rhinitis symptoms and the levels of ambient air pollutants by tracking changes in the severity of rhinitis symptoms among 167 patients based on the panel design, concurrently monitoring fluctuations in pollutant concentrations during this timeframe. Our findings suggest that certain ambient air pollutants are not only correlated with allergic rhinitis symptoms, but they also show delayed or lagged effects.
In the WHO Global Air Quality Guidelines issued in December 2021 [1], the air quality guideline levels of PM2.5, PM10, O3, NO2, SO2 and CO were 15 μg/m3, 45 μg/m3, 100 μg/m3, 25 μg/m3, 40 μg/m3 and 4 μg/m3, respectively. During the study period, the concentrations of PM2.5, PM10 and NO2 were slightly below the guideline levels on some days, generally remaining at the same level. The levels of SO2 and CO were lower than the guideline levels throughout the study period. Therefore, our study has a certain degree of generalizability. Vehicle exhaust emissions, kerosene combustion, industrial emissions and biomass combustion are common sources of ambient air pollutants. Whereas NOx and CO are the main precursors of surface O3 [28], NOx and SO2 are important precursors of PM2.5 and their oxidized product NO3 may be the main driver of PM2.5 [29,30]. The correlation of PM with CO, SO2 and NO2 was also found in our study, which makes it difficult to isolate the effect of a single pollutant on allergic rhinitis symptoms. This intricate interplay among pollutants explains why the results of related epidemiological studies frequently show inconsistencies and have yet to be fully reconciled.
Considering the complex interactions and potential synergistic effects between pollutants, we used multi-pollutant modeling and found that PM2.5, PM10, NO2 and CO were each associated with allergic rhinitis symptoms. Specifically, our findings indicate that PM2.5, PM10 and CO cumulatively affect sneezing and nasal blockage, while NO2 shows a cumulative effect on rhinorrhea, itchy nose and itchy eyes. Consistent with our results, Tang et al. reported that short-term exposures to ambient air pollutants, including PM2.5, PM10 and CO, were linked to a heightened frequency of outpatient visits for allergic rhinitis [31]. Moreover, elevated outdoor concentrations of NO2 and PM10 were correlated with a higher likelihood of airway allergies and allergic rhinitis in children [32]. Luo and colleagues utilized Cox proportional hazard models to evaluate the relationship between long-term air pollutant exposure and allergic rhinitis risk, concluding that prolonged exposure to PM2.5, PM10 and NO2 elevated the likelihood of developing allergic rhinitis [33]. In alignment with our findings, a cohort investigation revealed a dose–response relationship between chronic air pollution exposure and rhinitis severity in adults. Furthermore, heightened levels of exposure to PM2.5, PM10 and NO2 were directly linked to intensified rhinitis symptoms [34]. Regarding SO2 and O3, a population-based study found a positive correlation between ambient SO2 levels and allergic rhinitis risk in primary school children [17]. Meanwhile, a strong association between prolonged environmental O3 exposure and an augmented allergic rhinitis symptom risk was reported in children [35]. Conversely, a time-series study reported that exposure to PM10, NO2 and O3 significantly elevated the hospitalization risk due to allergic rhinitis, whereas SO2 did not emerge as a significant risk factor for allergic rhinitis-related hospital admissions [18]. Intriguingly, despite SO2 and CO concentrations being well below air quality guideline levels during the study period, we still found a weak correlation between these pollutants and allergic rhinitis symptoms. The association between O3 and increased allergic rhinitis symptoms, however, was not significant. Differences in the results of similar studies might be attributed to variations in the study population, geographic location and timing. These factors can influence the levels and proportions of ambient air pollutants, as well as the age demographics of the study populations. Additionally, regional climate differences may also contribute to these discrepancies.
Regarding the lagged effects of air pollutants on allergic rhinitis, discrepancies in results across different regions, time periods and research methodologies have been observed. In this study, we found that PM2.5 was significantly associated with sneezing and nasal blockage symptoms from lag 0 to lag 4. A previous study reported that PM2.5 concentrations were associated with an increased risk of allergic rhinitis, occurring at lags 1 and 2, partly aligning with our findings [36]. In a study conducted in Lanzhou, China, short-term exposure to air pollutants was linked to a rise in allergic rhinitis visits, specifically with O3 influencing visits at a lag of 0–6 days and CO at 0–7 days [37]. Another study identified significant associations between CO and O3 exposure and respiratory outpatient visits across lags 0 to 4, but found no significant link between SO2 exposure and such visits. In addition, NO2 was relevant to respiratory outpatient visits only at lag 1 [38]. In this study, NO2 showed a significant correlation with rhinorrhea symptoms at lags 0 to 1, indicating an escalating trend. It also correlated with itchy nose and eye symptoms at lag 1. CO was significantly correlated with nasal symptoms from lag 0 to lag 2, while SO2 was found to have a significant correlation with sneezing symptoms at lag 4. In addition to aligning with previous research findings, the significance of our study lies in its extension beyond the scope of earlier works, which primarily focused on the incidence of allergic rhinitis and hospital visits. Our research narrows the gap by delving into a less-explored realm of nasal allergy symptoms.
In this study, we innovatively employed a panel research methodology to investigate the impact of ambient air pollutants on symptoms of allergic rhinitis, thereby enhancing the credibility of our results and refining our understanding of how individual pollutants affect several typical symptoms of the disease. Nonetheless, it is important to acknowledge its limitations. Our sample solely comprised patients from a single hospital, numbering only 167 individuals, which may limit the generalizability. Additionally, unlike clinical trials, ecological studies cannot directly measure individual exposure levels to ambient air pollutants. For descriptive studies on air pollutants, we used data from atmospheric monitoring stations and applied GLMMs to assess relationships between exposure levels and symptoms. This approach might lead to less accurate study results due to the indirect estimation of exposure. Allergens may have a correlation with pollutants that can also have an effect on allergic rhinitis symptoms. There is no way for this study to assess daily, individual-specific allergen exposure levels. Although allergens may act as a confounding factor, potentially affecting the results, this is a common limitation of ecological research. Similarly, the fact that our survey did not explore the effects of temperature and humidity on the study subjects makes it impossible to determine the effects of temperature and humidity on the results, which is also a limitation of this paper. We plan to recruit more patients to further investigate the impact of air pollution on different types of allergic rhinitis.

5. Conclusions

This study employed a prospective follow-up design to investigate the association between a mixture of various ambient air pollutants and the symptoms of allergic rhinitis in patients. This study found that ambient air pollutants were correlated with the severity of allergic rhinitis symptoms, with air pollutants exhibiting delayed effects in the multi-pollutant model. This finding thereby added to the evidence regarding the associations between short-term concurrent exposure to air pollutants and allergic rhinitis symptoms.

Supplementary Materials

The following supporting information can be downloaded at https://www.mdpi.com/article/10.3390/toxics12090663/s1. Table S1: Score for allergic rhinitis symptoms; Figure S1: Symptom-by-symptom plot of association between air pollutants and allergic rhinitis symptom scores in patients with allergic rhinitis; and Table S2: Lagged effects of air pollutants on allergic rhinitis symptom scores.

Author Contributions

Conceptualization, W.S., J.J. and H.X.; methodology, W.S., J.J. and H.X.; formal analysis, W.S. and C.D.; investigation, W.S., C.D., Z.J. and X.Z.; data curation, W.S. and H.X.; writing—original draft preparation, W.S.; writing—review and editing, W.S., C.D., Z.J. and H.X.; visualization, W.S.; supervision, H.X.; project administration, H.X.; funding acquisition, H.X. All authors have read and agreed to the published version of the manuscript.

Funding

This research was funded by the Zhejiang Provincial Natural Science Foundation of China (LQ23H260007), the Scientific Research Fund of Zhejiang Provincial Education Department (Y202249200), the Basic Scientific Research Funds of Department of Education of Zhejiang Province (KYYB202202) and the Key Discipline of Zhejiang Province in Public Health and Preventive Medicine (First Class, Category A).

Institutional Review Board Statement

This study was approved by the Ethics Committee of Hangzhou Medical College (No.LL2023-04) and followed the principles of the Helsinki Declaration.

Informed Consent Statement

Written informed consent has been obtained from the patients to publish this paper.

Data Availability Statement

The data of this study are available upon reasonable request to the corresponding authors.

Acknowledgments

All authors sincerely thank all the participants from the hospitals.

Conflicts of Interest

The authors declare that they have no competing interests.

References

  1. World Health Organization. Ambient (Outdoor) Air Pollution. Available online: https://www.who.int/news-room/fact-sheets/detail/ambient-(outdoor)-air-quality-and-health (accessed on 24 April 2024).
  2. Adamkiewicz, G.; Liddie, J.; Gaffin, J.M. The Respiratory Risks of Ambient/Outdoor Air Pollution. Clin. Chest Med. 2020, 41, 809–824. [Google Scholar] [CrossRef] [PubMed]
  3. Tran, H.M.; Tsai, F.; Lee, Y.; Chang, J.; Chang, L.; Chang, T.; Chung, K.F.; Kuo, H.; Lee, K.; Chuang, K.; et al. The impact of air pollution on respiratory diseases in an era of climate change: A review of the current evidence. Sci. Total Environ. 2023, 898, 166340. [Google Scholar] [CrossRef] [PubMed]
  4. Eguiluz-Gracia, I.; Mathioudakis, A.; Bartel, S.; Vijverberg, S.; Fuertes, E.; Comberiati, P.; Cai, Y.; Tomazic, P.; Diamant, Z.; Vestbo, J.; et al. The need for clean air: The way air pollution and climate change affect allergic rhinitis and asthma. Allergy 2020, 75, 2170–2184. [Google Scholar] [CrossRef] [PubMed]
  5. Maio, S.; Sarno, G.; Tagliaferro, S.; Pirona, F.; Stanisci, I.; Baldacci, S.; Viegi, G. Outdoor air pollution and respiratory health. Int. J. Tuberc. Lung Dise. 2023, 27, 7–12. [Google Scholar] [CrossRef] [PubMed]
  6. Blaiss, M.S.; Hammerby, E.; Robinson, S.; Kennedy-Martin, T.; Buchs, S. The burden of allergic rhinitis and allergic rhinoconjunctivitis on adolescents: A literature review. Ann. Allergy Asthma Immunol. 2018, 121, 43–52.e3. [Google Scholar] [CrossRef] [PubMed]
  7. Meltzer, E.O. Allergic Rhinitis: Burden of Illness, Quality of Life, Comorbidities, and Control. Immunol. Allergy Clin. 2016, 36, 235–248. [Google Scholar]
  8. Zhang, Y.; Zhang, L. Increasing Prevalence of Allergic Rhinitis in China. Allergy Asthma Immunol. Res. 2019, 11, 156–169. [Google Scholar] [CrossRef]
  9. Cheng, L.; Chen, J.; Fu, Q.; He, S.; Li, H.; Liu, Z.; Tan, G.; Tao, Z.; Wang, D.; Wen, W.; et al. Chinese Society of Allergy Guidelines for Diagnosis and Treatment of Allergic Rhinitis. Allergy Asthma Immunol. Res. 2018, 10, 300–353. [Google Scholar] [CrossRef]
  10. Nur Husna, S.M.; Tan, H.T.; Md Shukri, N.; Mohd Ashari, N.S.; Wong, K.K. Allergic Rhinitis: A Clinical and Pathophysiological Overview. Front. Med.-Lausanne 2022, 9, 874114. [Google Scholar] [CrossRef]
  11. Lin, L.; Li, T.; Sun, M.; Liang, Q.; Ma, Y.; Wang, F.; Duan, J.; Sun, Z. Effect of particulate matter exposure on the prevalence of allergic rhinitis in children: A systematic review and meta-analysis. Chemosphere 2021, 268, 128841. [Google Scholar] [CrossRef]
  12. Piao, C.H.; Fan, Y.; Nguyen, T.V.; Shin, H.S.; Kim, H.T.; Song, C.H.; Chai, O.H. PM(2.5) Exacerbates Oxidative Stress and Inflammatory Response through the Nrf2/NF-κB Signaling Pathway in OVA-Induced Allergic Rhinitis Mouse Model. Int. J. Mol. Sci. 2021, 22, 8173. [Google Scholar] [CrossRef] [PubMed]
  13. Li, S.; Wu, W.; Wang, G.; Zhang, X.; Guo, Q.; Wang, B.; Cao, S.; Yan, M.; Pan, X.; Xue, T.; et al. Association between exposure to air pollution and risk of allergic rhinitis: A systematic review and meta-analysis. Environ. Res. 2022, 205, 112472. [Google Scholar] [CrossRef] [PubMed]
  14. Wang, J.; Guo, Z.; Zhang, R.; Han, Z.; Huang, Y.; Deng, C.; Dong, W.; Zhuang, G. Effects of N-acetylcysteine on oxidative stress and inflammation reactions in a rat model of allergic rhinitis after PM2.5 exposure. Biochem. Biophys. Res. Commun. 2020, 533, 275–281. [Google Scholar] [CrossRef] [PubMed]
  15. Wang, J.; Huang, Y.; Zhang, R.; Han, Z.; Zhou, L.; Sun, N.; Dong, W.; Zhuang, G. miR-338–3p inhibits autophagy in a rat model of allergic rhinitis after PM2.5 exposure through AKT/mTOR signaling by targeting UBE2Q1. Biochem. Biophys. Res. Commun. 2021, 554, 1–6. [Google Scholar] [CrossRef]
  16. Li, Y.; Zhou, J.; Rui, X.; Zhou, L.; Mo, X. PM2.5 exposure exacerbates allergic rhinitis in mice by increasing DNA methylation in the IFN-γ gene promoter in CD4+T cells via the ERK-DNMT pathway. Toxicol. Lett. 2019, 301, 98–107. [Google Scholar] [CrossRef]
  17. Kim, S.H.; Lee, J.; Oh, I.; Oh, Y.; Sim, C.; Bang, J.; Park, J.; Kim, Y. Allergic rhinitis is associated with atmospheric SO2: Follow-up study of children from elementary schools in Ulsan, Korea. PLoS ONE 2021, 16, e0248624. [Google Scholar] [CrossRef]
  18. Dąbrowiecki, P.; Chciałowski, A.; Dąbrowiecka, A.; Piórkowska, A.; Badyda, A. Exposure to ambient air pollutants and short-term risk for exacerbations of allergic rhinitis: A time-stratified, case-crossover study in the three largest urban agglomerations in Poland. Respir. Physiol. Neurobiol. 2023, 315, 104095. [Google Scholar] [CrossRef]
  19. Ye, M.; Liu, H.; Li, H.; Liu, Q.; Zhou, Z.; Wang, T.; Tan, G. Long-Term Exposure to Sulfur Dioxide Before Sensitization Decreased the Production of Specific IgE in HDM-Sensitized Allergic Rhinitis Mice. J. Inflamm. Res. 2022, 15, 2477–2490. [Google Scholar] [CrossRef]
  20. Wang, J.; Lu, M.; An, Z.; Jiang, J.; Li, J.; Wang, Y.; Du, S.; Zhang, X.; Zhou, H.; Cui, J.; et al. Associations between air pollution and outpatient visits for allergic rhinitis in Xinxiang, China. Environ. Sci. Pollut. Res. Int. 2020, 27, 23565–23574. [Google Scholar] [CrossRef]
  21. Wang, M.; Wang, S.; Wang, X.; Tian, Y.; Wu, Y.; Cao, Y.; Song, J.; Wu, T.; Hu, Y. The association between PM(2.5) exposure and daily outpatient visits for allergic rhinitis: Evidence from a seriously air-polluted environment. Int. J. Biometeorol. 2020, 64, 139–144. [Google Scholar] [CrossRef]
  22. Wu, R.; Guo, Q.; Fan, J.; Guo, C.; Wang, G.; Wu, W.; Xu, J. Association between air pollution and outpatient visits for allergic rhinitis: Effect modification by ambient temperature and relative humidity. Sci. Total Environ. 2022, 821, 152960. [Google Scholar] [CrossRef] [PubMed]
  23. Chen, J.; Zeng, Y.; Lau, A.K.; Guo, C.; Wei, X.; Lin, C.; Huang, B.; Lao, X.Q. Chronic exposure to ambient PM2.5/NO2 and respiratory health in school children: A prospective cohort study in Hong Kong. Ecotoxicol. Environ. Saf. 2023, 252, 114558. [Google Scholar] [CrossRef] [PubMed]
  24. Lu, C.; Wang, F.; Liu, Z.; Li, B.; Yang, W.; Liao, H. Intrauterine and early postnatal exposure to air pollution associated with childhood allergic rhinitis. Chemosphere 2023, 336, 139296. [Google Scholar] [CrossRef] [PubMed]
  25. Rosario, C.S.; Urrutia-Pereira, M.; Murrieta-Aguttes, M.; D’Amato, G.; Chong-Silva, D.C.; Godoi, R.H.M.; Rosario Filho, N.A. Air pollution and rhinitis. Front. Allergy 2024, 5, 1387525. [Google Scholar] [CrossRef]
  26. Zhang, S.; Fu, Q.; Wang, S.; Jin, X.; Tan, J.; Ding, K.; Zhang, Q.; Li, X. Association between air pollution and the prevalence of allergic rhinitis in Chinese children: A systematic review and meta-analysis. Allergy Asthma Proc. 2022, 43, e47–e57. [Google Scholar] [CrossRef] [PubMed]
  27. Lee, H.Y.; Kim, H.; Kim, H.J.; Na, G.; Jang, Y.; Kim, S.H.; Kim, N.H.; Kim, H.C.; Park, Y.; Kim, H.C.; et al. The impact of ambient air pollution on lung function and respiratory symptoms in elite athletes. Sci. Total Environ. 2023, 855, 158862. [Google Scholar] [CrossRef]
  28. Sharma, A.; Mandal, T.K.; Sharma, S.; Shukla, D.; Singh, S.N. Relationships of surface ozone with its precursors, particulate matter and meteorology over Delhi. J. Atmos. Chem. 2017, 74, 451–474. [Google Scholar] [CrossRef]
  29. Kelly, J.T.; Reff, A.; Gantt, B. A method to predict PM2.5 resulting from compliance with national ambient air quality standards. Atmos. Environ. 2017, 162, 1–10. [Google Scholar] [CrossRef]
  30. Su, T.; Li, J.; Tian, C.; Zong, Z.; Chen, D.; Zhang, G. Source and formation of fine particulate nitrate in South China: Constrained by isotopic modeling and online trace gas analysis. Atmos. Environ. 2020, 231, 117563. [Google Scholar] [CrossRef]
  31. Tang, W.; Sun, L.; Wang, J.; Li, K.; Liu, S.; Wang, M.; Cheng, Y.; Dai, L. Exploring Associations Between Short-Term Air Pollution and Daily Outpatient Visits for Allergic Rhinitis. Risk Manag. Healthc. Policy 2023, 16, 1455–1465. [Google Scholar] [CrossRef]
  32. Liu, W.; Cai, J.; Fu, Q.; Zou, Z.; Sun, C.; Zhang, J.; Huang, C. Associations of ambient air pollutants with airway and allergic symptoms in 13,335 preschoolers in Shanghai, China. Chemosphere 2020, 252, 126600. [Google Scholar] [CrossRef] [PubMed]
  33. Luo, P.; Ying, J.; Li, J.; Yang, Z.; Sun, X.; Ye, D.; Liu, C.; Wang, J.; Mao, Y. Air Pollution and Allergic Rhinitis: Findings from a Prospective Cohort Study. Environ. Sci. Technol. 2023, 57, 15835–15845. [Google Scholar] [CrossRef] [PubMed]
  34. Burte, E.; Leynaert, B.; Marcon, A.; Bousquet, J.; Benmerad, M.; Bono, R.; Carsin, A.; de Hoogh, K.; Forsberg, B.; Gormand, F.; et al. Long-term air pollution exposure is associated with increased severity of rhinitis in 2 European cohorts. J. Allergy Clin. Immunol. 2020, 145, 834–842.e6. [Google Scholar] [CrossRef] [PubMed]
  35. Zhou, P.; Qian, Z.; McMillin, S.; Vaughn, M.; Xie, Z.; Xu, Y.; Lin, L.; Hu, L.; Yang, B.; Zeng, X.; et al. Relationships between Long-Term Ozone Exposure and Allergic Rhinitis and Bronchitic Symptoms in Chinese Children. Toxics 2021, 9, 221. [Google Scholar] [CrossRef]
  36. Chai, G.; He, H.; Sha, Y.; Zhai, G.; Zong, S. Effect of PM(2.5) on daily outpatient visits for respiratory diseases in Lanzhou, China. Sci. Total Environ. 2019, 649, 1563–1572. [Google Scholar] [CrossRef] [PubMed]
  37. Ji, J.; Chen, K.; Dong, J.; Yu, H.; Zhang, Y. Associations between air pollution and outpatient visits for allergic rhinitis in Lanzhou, China. Environ. Sci. Pollut. Res. Int. 2023, 30, 91453–91465. [Google Scholar] [CrossRef]
  38. Liu, C.; Liu, Y.; Zhou, Y.; Feng, A.; Wang, C.; Shi, T. Short-term effect of relatively low level air pollution on outpatient visit in Shennongjia, China. Environ. Pollut. 2019, 245, 419–426. [Google Scholar] [CrossRef]
Figure 1. The correlation between the air pollutants on lag 0. The numbers of the figure are spearman correlation coefficients. PM2.5, particulate matter with diameter < 2.5 μm; PM10, particulate matter with diameter < 10 μm; SO2, sulfur dioxide; NO2, nitrogen dioxide; O3, ozone; CO, carbon monoxide.
Toxics 12 00663 g001
Figure 2. Lagged effects of air pollutants on allergic rhinitis symptom scores in patients with allergic rhinitis. Lagged effects of PM2.5 (A), PM10 (B), SO2 (C), NO2 (D), CO (E), and O3 (F) on allergic rhinitis symptoms are presented. PM2.5, particulate matter with diameter < 2.5 μm; PM10, particulate matter with diameter < 10 μm; SO2, sulfur dioxide; NO2, nitrogen dioxide; O3, ozone; CO, carbon monoxide.
Toxics 12 00663 g002
Table 1. Baseline characteristics of the study population (N = 167).
VariableMean ± SD or N (%)
Age (years)35.4 ± 12.1
Gender
Male60 (35.9%)
Female107 (64.1%)
High (cm)
Male175 ± 5.2
Female160.9 ± 5.6
Weight (kg)
Male73.4 ± 12.7
Female55 ± 7.3
BMI (kg/m2)
Male23.9 ± 3.9
Female21.1 ± 2.5
IgE (IU/mL)376.5 ± 398
Smoking status
Smoker13 (7.8%)
Never smoker154 (92.2%)
Drinking status
Drinker24 (14.4%)
Never drinker143 (85.6%)
Sneezing a1.4 ± 0.8
Nasal blockage a2.3 ± 0.8
Rhinorrhea a1.7 ± 0.7
Itchy nose a1.5 + 0.8
Itchy eyes a1.4 ± 0.9
a The symptom scores at enrollment.
Table 2. The means of the ambient air pollutants by month during the follow-up study period.
MayJune July AugustSeptemberOctoberNovemberDecemberJanuary
PM2.5 (μg/m3) a27.6 ± 9.823.2 ± 9.414.4 ± 5.419.1 ± 7.722.1 ± 9.329.7 ± 15.334.5 ± 13.653.4 ± 37.166.8 ± 32
PM10 (μg/m3) a 49.6 ± 18.139.2 ± 15.425.8 ± 7.931.8 ± 10.934 ± 12.947.3 ± 19.763.1 ± 22.181.1 ± 50.893 ± 42.4
SO2 (μg/m3) a6.2 ± 0.85.9 ± 0.85.6 ± 0.55.7 ± 0.45.9 ± 0.67.1 ± 0.67.3 ± 17.5 ± 1.27.6 ± 1.3
NO2 (μg/m3) a 26 ± 6.322.2 ± 4.416 ± 3.716.6 ± 3.319.5 ± 3.232.4 ± 11.241.3 ± 12.249.2 ± 21.247.3 ± 14.7
CO (mg/m3) a0.6 ± 0.10.6 ± 0.10.6 ± 0.10.6 ± 0.10.7 ± 0.10.6 ± 0.10.7 ± 0.10.8 ± 0.20.9 ± 0.2
O3 (μg/m3) b128.7 ± 37.5131.9 ± 57.696.1 ± 33.5130.5 ± 45.7123.9 ± 43.8126.5 ± 29.777.6 ± 27.951 ± 22.857.5 ± 21.4
a The arithmetic means of the daily average concentrations. b The arithmetic means of the daily maximum continuous 8 h concentrations.
Disclaimer/Publisher’s Note: The statements, opinions and data contained in all publications are solely those of the individual author(s) and contributor(s) and not of MDPI and/or the editor(s). MDPI and/or the editor(s) disclaim responsibility for any injury to people or property resulting from any ideas, methods, instructions or products referred to in the content.

