Abstract
Currently, we assist the emergence of sensors and low-cost information and communication technologies applied to food products, in order to improve food safety and quality along the food chain. Thus, it is relevant to implement predictive mathematical modeling tools in order to predict changes in the food quality and allow decision-making for expiration dates. To perform that, the Baranyi and Roberts model and the online tool Combined Database for Predictive Microbiology (Combase) were used to determine the factors that define the growth of different bacteria. These factors applied to the equation that determines the maximum specific growth rate establish a relation between the bacterial growth and the intrinsic and extrinsic factors that define the bacteria environment. These models may be programmed in low-cost wireless biochemical sensor devices applied to packaging and food supply chains to promote food safety and quality through real time traceability.
1. Introduction
The validity periods presented in the traditional labels of perishable products are described as the period during which a stored product remains safe and retains the desired properties and qualities for consumption [1,2]. Usually, one of two types of validity periods are applied: one is the expiration date that limits the period of time for which perishable food remains safe for human consumption; the other is “consumption before” that indicates the estimated time for consumption during which the food will be able to maintain its nutritional properties if it is preserved in the recommended conditions [2].
However, sometimes deviations occur that alter the desired conditions of perishable foods preservation and maintenance, compromising the quality of the products. When this happens, differences result between the actual remaining useful life and with the shelf-life described in the label. For this reason, many countries require regulations so that food has an indication of appropriate durability on the packaging in order to indicate the supposed end of its useful life. Therefore, with the determination through traditional methods of the expiration date, it is not possible to determine the useful life of a product when it has been adulterated [1].
The current world’s digitalization brings several benefits to food supply chains and to the consumer. New technologies based on biochemical sensors and low-cost information and communication technologies (ICT), mostly focusing on Internet of Things (IoT), can be applied to solve old paradigms and mitigate inefficiencies. Particularly, it can be applied to food product traceability, promoting better planning and coordination among the different stages of the supply chain, in terms of the product’s remaining shelf life, and supply and demand of fresh food [3]. These technologies have been integrated in packaging, developing the concept of intelligent or smart packaging [4]. This package is able to provide additional real time data besides the current regular information available such as origin, validity date, organization, nutritional composition, among others. It may inform and/or advise producers, retailers, or consumers about the product traceability considering routes, extrinsic parameters e.g., temperature (T), relative humidity (RH) and atmosphere and intrinsic parameters, e.g., water activity (aw), hydrogen potential (pH), oxidation-reduction potential, chemical composition and biological structure of the food as well as its anti-microbial substances, microbial development, among others [5].
Intelligent packaging can provide information concerning food quality, safety and the history of a product during transport and storage, through the six main functions of intelligent packaging: monitoring, detecting, sensing, recording, tracking and communicating [6].
In this sense, the development and implementation of predictive mathematical modeling tools is an effective way to predict changes in food quality and enable decision-making regarding shelf life [1,7]. These models can be integrated as decisive data information for a better functioning of several sensors and indicators in intelligent food packaging. In smart packaging, indicators are usually applied, which are devices that can determine the presence or absence, the extent of the reaction between two or more substances or the concentration of a particular substance. This information is transmitted to the user through an irreversible and visible color change [8,9,10]. On the other hand, sensors are electronic devices or tools that can detect, quantify and convert a signal to an electrical signal using transducers. Most sensors are composed of two parts: the first one can detect the presence, activity, composition or concentration of certain chemical or physical analytes, such as pH, humidity, color and biological compounds. Physical or chemical information is also converted by the sensor into a form of energy that can be measured by the second component, the transducer [9,10]. These two concepts are often confused and alternately applied to smart packaging, since the indicator refers to a colorimetric sensor normally consisting of a chemical sensor or a biosensor [11]. Some types of sensors used in intelligent packaging are physical sensors, chemical sensors, gas sensors and biosensors. Smart packaging with a sensor that monitors the packaged food product and its environment throughout the supply chain is really helpful and important in ensuring the food quality and safety for end consumers [12].
There is a growing diversity of strategies available in the food industry to improve product quality and reduce food waste, as it is a reality that exists worldwide. This waste is also due to the food damage along all the food chain, from the producer until the final consumer, to the point when the food security is compromised [13]. To talk about food security, it is necessary to know what causes the food deterioration and make them unhealthy, as well as the conditions it happens [7]. The answer is the bacterial growth in the food. Each bacteria grows at a different rhythm and under different conditions [7] depending on intrinsic and extrinsic factors. Despite all factors contributing to bacterial growth, temperature, pH and water activity, are considered to be the most influent [14], and can be directly used in the mathematical models.
The experimental study of bacterial growth allowed biologists to create a growth curve [15]. In 1993, Baranyi and, in 1994, Baranyi and Roberts, created a model able to represent that growth curve, which is showed in Equation (1) [16,17].
The relation between this model variables and the microbial growth curve can be visualized in Figure 1 and is explained in detail [18,19]:
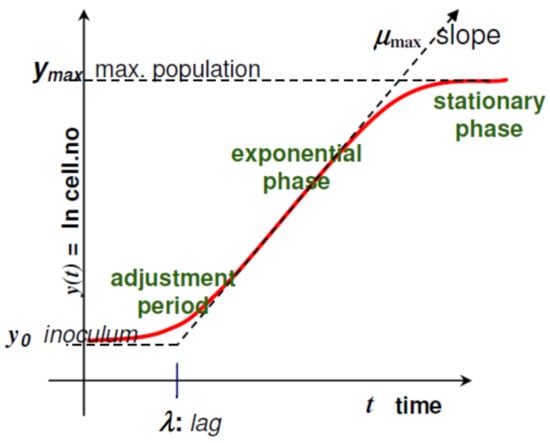
Figure 1.
Relation between the growth curve and the Baranyi and Roberts model variables (Reprinted from ref. [19]).
- is the same as where is the number of colony-forming unit (CFU)/g;
- is the initial value of CFU/g (scaled logarithmically) and its value derived from Tables 1–6 is shown as result in Table 7;
- is the maximum value of CFU/g (scaled logarithmically) and its value is also defined in Table 7;
- µmax is the maximum specific growth rate and its value is affected by intrinsic and extrinsic factors;
- is a constant defined by , where is the physiological state; It is also related with (lag phase), where ;
- is the parameter that define the curvature between the exponential and stationary phase;
- is the parameter that define the curvature between the initial and exponential phase through the equation ;
- is the time since the beginning of the bacteria growth.
As stated above, new technologies applied to the packaging and food supply chain to promote food safety and quality through real time traceability need to engage low cost, effective biochemical sensors and ICT. In this case, it is intended to apply predictive mathematical models of bacterial growth according to temperature, pH and water activity as a freshness sensor or indicator. Thus, the freshness sensor can be defined as a device that has the ability to feel the freshness of the food related to the environment inside or outside the packaging and inform about the food quality and safety. There are diverse commercially available sensors and indicators for freshness monitoring of food packaging, such as Freshtag® (COX Technologies), Sensorq® (DSM NV and Food Quality Sensor International), among others [11].
However, the computational requirements to predict bacterial growth curves that can be used to predict food safety and quality are substantial for the system requisites.
In this context, the maximum specific growth rate, µmax, represents, in the bacterial growth curve, how intrinsic and extrinsic factors affect the bacterial development, being manifested in distinct ways for each bacteria.
Of the various models that relate µmax with temperature (T), pH and water activity (aw), the Masana & Baranyi model will be used, presented in Equation (2) [20]:
where ai are the coefficients to be estimated, T and pH are respectively the values of temperature (°C) and pH, and bw is calculated through [21]:
The Equation (2) applied in Equation (1) allows to have the parameters that define intrinsic and extrinsic factors in Baranyi and Roberts model.
Online tool Combase Predictor [22] uses the link of these two equations to present the growth curve of a previous selected bacteria when subjected to environment conditions previously defined by the user. This interface, defined in Figure 2, also presents the value of , that allows to estimate the coefficients of Equation (2).

Figure 2.
Example of ComBase Predictor (available online in www.ComBase.com, accessed on 3 March 2021).
ComBase is a highly useful tool, with over 60,000 records, to understand safer ways of producing and storing foods. These data were obtained from scientific literature and produced by diverse institutions. Each data record allows users know how bacteria populations change for a particular combination of environmental factors, and, thus, gives predictions from models based on selected data as a function of environmental factors such as temperature, pH and water activity.
Thus, the paper describes a simplified approach to predict food safety through the maximum specific bacterial growth rate as a function of extrinsic and intrinsic parameters. The model coefficients developed in this paper allow for the use of bacterial growth curve models to predict food safety in low-cost computational requirements devices, contributing in this sense to the development of technologies that improve food systems.
2. Materials and Methods
To estimate ai values, will be used the online tool available in www.ComBase.com (accessed on 3 March 2021). This way will only be considered some bacteria presented on the referred tool:
- Aeromonas hydrophila;
- Bacillus cereus;
- Bacillus licheniformis;
- Bacillus subtilis;
- Clostridium botulinum;
- Clostridium perfringens;
- Escherichia coli;
- Listeria monocytogenes;
- Salmonella;
- Shigella flexneri;
- Staphylococcus aureus;
- Yersinia enterocolitica;
- Brochothrix thermosphacta;
- Pseudomonas.
Interventional studies involving animals or humans, and other studies that require ethical approval, must list the authority that provided approval and the corresponding ethical approval code.
2.1. Determination of the Maximum Specific Growth Rate
The coefficients ai varies from 0 to 9 and are used in Equation (2). These coefficients will be estimated for the calculation of the value of the maximum specific growth rate for any temperature, pH and aw for any bacteria. Thus, to determine the maximum specific growth rate to each bacteria is necessary to get the values of these coefficients of Equation (2), as will be described below. To do that, the value of maximum specific growth rate obtained in the referred online tool is used, together with the values of temperature, pH and water activity that give origin to that value of µmax.
2.2. Calculation of Coefficients
Once the experimental procedure of calculation is the same for all the bacteria, is used only as one example of demonstration. Thus, the values of ai to the Brochothrix thermosphacta bacteria will be estimated. To do that, with Combase, Table 1 with different combinations of values of temperature, pH and aw (and bw) is constructed and, after, with those conditions the maximum specific growth rate is verified.

Table 1.
Maximum specific growth rate to different values of temperature (T), pH and water activity (aw), to the bacteria Brochothrix thermosphacta.
From those values, Table 2 is constructed, where are presented the ai. factors. This table will be used as a matrix, Matrix A, with 10 rows and 10 columns. Another matrix, Matrix B, with 10 rows and 1 column, is made with the values of ln(µmax), which also included in Table 2.
Table 2.
Matrix A and Matrix B to the bacteria Brochothrix thermosphacta, using the values of Table 1.
Using a linear equations system, these matrices will be used to calculate the coefficients a0 to a9, through the Equation (4).
That represents a system with 10 equations and 10 unknowns, from which is possible to obtain the values presented in Table 3. These are the estimated values that when applied in Equation (2) permit the calculation of the value of the maximum specific growth rate for any temperature, pH and aw for any bacteria, in this case for the Brochothrix thermosphacta. Once all these values start to be calculated with an estimation, when compared with Combase Predictor there is a small error associated. Table 4 represents that error for randomly obtained environments.
Table 4.
Calculation errors of µmax using estimated values of ai.
Using the values that would generate the smaller error when estimating ai coefficients, Table 5 was formulated, which contains these coefficients to the bacteria.
Table 5.
Coefficients to determine the maximum specific growth rate to each bacteria.
Using the values obtained, Table 6 includes the relative error provided by those values, when subjected to different environments randomly chosen. These errors are divided into:
Table 6.
Relative errors in the calculation of µmax using estimated values of ai.
- Relative error below 5%, er < 5%;
- Relative error between 5% and 10%, 5% < er < 10%;
- Relative error between 10% and 15%, 10% < er < 15%;
- Relative error above 15%, er > 15%.
The values presented in Table 6 corresponds to the number (in percentage) of tests that fit between the limits referred.
2.3. Graphic Generating
Table 5 allows to determine the value of µmax in order of the intrinsic and extrinsic factors that define a specific bacterial growth environment. This way it is possible to analyze how the temperature, pH and water activity affects the maximum specific growth rate. Since there are no graphics that represent this, a code in MatLab was created that presents a tridimensional graphic with the predictive value of µmax when changing the three parameters referred. Because is only possible to build graphics until 3 variables, and in this case there is a requirement to see the changes in four parameters, the temperature and the pH were represented in the axes x and y and µmax in z. To represent how aw changing affects the maximum specific growth rate, the graphic with the lowest value of aw was constructed. Then, this value was increased and built the graphic, in the same figure, to this new value. This process was repeated until the maximum value of aw is reached. This way it is possible to visualize the changing of the four variables in the same graphic. As a complement, a graphic was also created that represents the maximum value of µmax obtained to each value of aw. In this figure is also represented the maximum specific growth rate value for the studied bacteria and the conditions that make it happen.
3. Results
Despite all bacteria following the same development model, their growth can be very different from each other. This is due to the alteration of the environment where they exist. Below, these differences will be analyzed to the 14 bacteria considered in this study, and some representative graphics that define them. It is important to emphasize that the graphs are not all with the same conformation and direction of axes (T and pH) in order to improve the visualization and perception of all three-dimensional variables.
Since each factor has a different minimum and maximum value for each bacteria, Equation (5) is used, in order to simplify the process of comparing bacteria, where X can be the temperature or the pH.
3.1. Aeromonas hydrophila
Figure 3 represents the most usual growth curve between the analyzed bacteria. This growth is characterized by a maximum point of growth with a temperature between 70% and 80% of the bacteria temperature range in which it grows, a pH between 65% and 75% of the bacteria pH range of development and a water activity of approximately 90%. For this bacteria those values are 71.4% (T = 34 °C), 72.4% (pH = 7.4) and 92.3% (aw = 0.999), respectively. The decrease of temperature causes a quit decrease in µmax value, the same that happens for pH and water activity, but, in this last case, not so abruptly. The maximum value of µmax = 0.6.
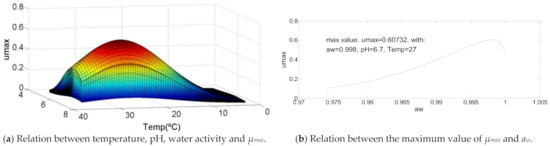
Figure 3.
Influence of intrinsic and extrinsic factors in the maximum specific growth rate of Aeromonas hydrophila.
3.2. Bacillus cereus
The way the temperature, pH and aw affect this bacteria growth is different to all the others analyzed. To Bacillus cereus as represented in Figure 4, the maximum specific growth rate is maximum to the maximum value of temperature and pH, meanwhile for water activity only decreases when its value is greater than aw = 0.999, which can be ignored in a practical situation. The maximum µmax = 1.8 log(CFU/g)/h, which is the greatest between the microorganisms analyzed. It is also relevant to mention that the values for µmax are relatively low (about 0.5 log(CFU/g)/h) while the temperature is lower than 25 °C, pH below 5.5 and aw until 0.97. A small increase of these values triggers a quit increase of the maximum specific growth rate.
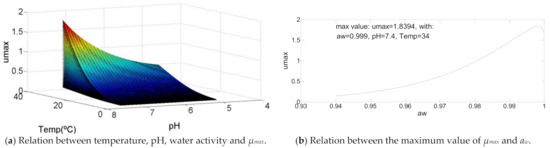
Figure 4.
Influence of intrinsic and extrinsic factors in the maximum specific growth rate of Bacillus cereus.
3.3. Bacillus licheniformis
As shown in Figure 5, this bacteria curve reveals a growth of µmax similar to the one presented for Aeromonas hydrophila. The main difference is that while in the first case the maximum specific growth rate increases until 73% of the temperature value range of growth, in this case the maximum value happens to the maximum value of temperature (T = 34 °C). The values to pH and water activity to get the maximum value of µmax are pH = 6.6 and aw = 0.995, respectively, which is between the same range defined in the first bacteria commented, with values of 72% and 94%.
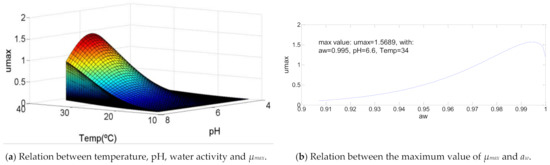
Figure 5.
Influence of intrinsic and extrinsic factors in the maximum specific growth rate of Bacillus licheniformis.
3.4. Bacillus subtilis
Of the 14 bacteria studied, Bacillus subtilis has a unique property. Despite all the others, which in high values of the water activity means an increase of µmax, in Bacillus subtilis the reaction is the opposite. The optimal growth condition is achieved with aw = 0.933, and, after that point, the maximum specific growth rate decreases with the rise of aw and increases again only between 0.993 and 1, thus not being relevant. While the rise of the temperature value creates an increase in µmax, the pH simply does this until half of the range of growth of this bacteria, which causes a decrease with the same rhythm.
3.5. Clostridium botulinum
As referred in the description of Aeromonas hydrophila, this kind of curve is assigned with diverse bacteria, and this is one of them. The percentage value of the range of growth of Clostridium botulinum that causes a maximum value of µmax are in the range defined previously: 78% (T = 24.5 °C), 70% (pH = 6.8) and 88% (aw = 0.997) respectively for the range of values of temperature, pH and water activity.
3.6. Clostridium perfringens
This bacterium has several characteristics different from the others. Regarding the temperature, it is possible to see that an increase of its value causes an increase in µmax which becomes bigger as it approaches the maximum temperature range of growth, T = 41.5 °C. When this value is achieved, the decrease of µmax, caused by the rise of the temperature, happens at a slow pace. However, pH is mainly responsible for the odd curve created. While, in the other bacteria, the increase of pH causes a greater raise of µmax until the optimal value of pH is reached, for Clostridium perfringens, the rise of pH causes the same increase of µmax along all the range of growth. Therefore, the pH value that causes the maximum value of µmax = 8. Water activity also has a distinct growth curve, since its minimum value corresponds to a specific growth rate value of 0.6, which increases with the increase of aw until aw = 0.989, that represents the maximum µmax = 1.24. These characteristics are described in Figure 6.
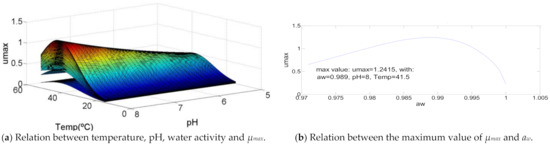
Figure 6.
Influence of intrinsic and extrinsic factors in the maximum specific growth rate of Clostridium perfringens.
3.7. Escherichia coli
The influence of the temperature and pH in this bacterium is identical to the cases of Aeromonas hydrophila and Clostridium botulinum, wherein the percentages are in the range defined for that kind of curve (Figure 7). In this case, the maximum value of µmax occurs with temperature at 76% (T = 34.5 °C) of its range of growth and 66.7% (pH = 6.5) of the same range of pH. The maximum µmax is obtained with the maximum value of water activity, this is, aw = 1, Escherichia coli being the only bacteria where this happens.
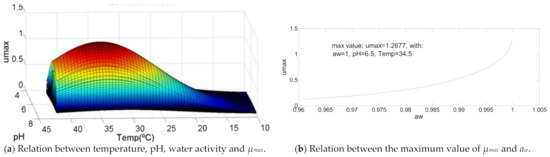
Figure 7.
Influence of intrinsic and extrinsic factors in the maximum specific growth rate of Escherichia coli.
3.8. Listeria monocytogenes
Listeria monocytogenes presents a similar curve with Aeromonas hydrophila, however the difference of the optimal temperature value has to be equal to its maximum value (T = 40 °C). As shown in Figure 8, The values of pH and water activity for which µmax is maximum, are, respectively, pH = 6.9 and aw = 0.994 that, in percentage, represents 80% and 90% of its correspondent range of growth.
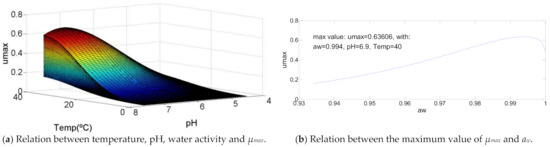
Figure 8.
Influence of intrinsic and extrinsic factors in the maximum specific growth rate of Listeria monocytogenes.
3.9. Salmonella
This bacterium is similar with the previous, except in the µmax value, where Listeria monocytogenes achieved a maximum value of µmax = 0.63 and Salmonella went beyond 0.93. This value is reached with both temperature (T = 37.5 °C) and water activity at aw = 90% of its range of growth, while the optimal pH = 6.4 happens around 70%.
3.10. Shigella flexneri
Shigella flexneri growth curve (Figure 9) represents a direct and constant relation between the increase of the temperature and the increase of the maximum specific growth rate, which achieves it maximum value with the maximum temperature, T = 37 °C. The increase of the pH value represents a tiny increase (about 25%) in µmax value that justifies the growth curve shape. Water activity almost has a symmetrical growth curve, once the minimum value of µmax is achieved to aw,min, but also to aw,max, where aw = 0.993 represents the maximum value of µmax = 0.76.
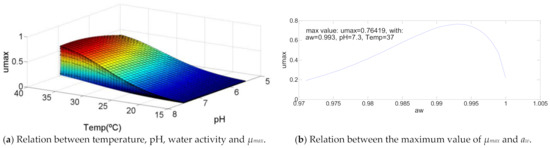
Figure 9.
Influence of intrinsic and extrinsic factors in the maximum specific growth rate of Shigella flexneri.
3.11. Staphylococcus aureus
Staphylococcus aureus has a growth curve like some graphics already defined, as shown in Figure 10. It is characterized by an optimal temperature equal to the maximum temperature, an optimal pH = 60% of its growth range and aw between 80% and 90% of water activity growth range. In this specific case, these percentages are respectively 67.7% (pH = 6.5) and 89% (aw = 0.99), that, with a temperature of 30 °C, result in µmax = 0.58.
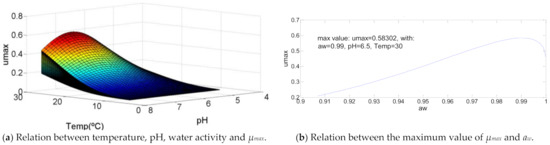
Figure 10.
Influence of intrinsic and extrinsic factors in the maximum specific growth rate of Staphylococcus aureus.
3.12. Yersinia enterocolitica
The growth of this bacteria is similar to the graphic of Staphylococcus aureus, only with differences in the percentage of temperature, pH and water activity growth range, which are 100% for temperature, T = 37 °C, 64% for pH = 6.2 and 90% for water activity, aw = 0.996. The value of µmax for these parameters is equal to 0.66.
3.13. Brochothrix thermosphacta
The microorganism Brochothrix thermosphacta is, once more, one of the bacteria related with Aeromonas hydrophila because of their similar growth curve. However, it is important to refer the value of aw for which µmax is maximum, because of its proximity to the maximum value (aw = 0.999). Both values of temperature and pH are close to 80% (T = 23.5 °C; pH = 6.7) of their growth range and contribute to a maximum µmax = 0.38.
3.14. Pseudomonas
A growth curve identical to the one of Pseudomonas is already described in Staphylococcus aureus graphic. Just like Yersinia enterocolitica, µmax is maximum when the temperature achieves its maximum value (T = 20 °C), while pH is around 60% (pH = 6.5) of its growth range and the water activity is slightly lower than the other bacteria, 82% (aw = 0.993). The largest value of µmax = 0.28 is the lowest between the bacteria analyzed.
4. Discussion
Despite many recent advances in food safety and quality, there is still an existential challenge and, therefore, a gap for novel opportunities in which the current technologies available can be improved in order to have versatile, fast, simple, portable, robust and multivariate levels of detection of food contaminants and different analytes matrices [23]. Therefore, after the individualized study of the 14 bacteria, it is possible to verify that despite the values of each factor considered—temperature, pH and water activity—having different minimum, maximum and optimal values, as well as different maximum values of µmax, between bacteria, they can be put together in groups defined by their growth curve relation of these 4 parameters.
The bacteria Aeromonas hydrophila, Brochothrix thermosphacta, Clostridium botulinum and Escherichia coli are characterized by T%opt = [70%, 80%] and pH%opt = [65%, 80%] and are put together in one group. The other group is composed of bacteria where T%opt = Tmax, this is, T%opt = 100% and pH%opt = [50%, 70%]. This occurs in bacteria like Bacillus licheniformis, Bacillus subtilis, Staphylococcus aureus, Yersinia enterocolitica and Pseudomonas.
Listeria monocytogenes and Salmonella are some of the cases where there is a join of the groups presented. On one hand, T%opt is bigger than 90%, on the other, pH%opt has bigger values than the ones considered in the second group, pH%opt = [70%, 80%]. One example of this category is the bacteria Shigella flexneri, which maintains the value of T%opt = 100% but has pH%opt > 90%. Bacillus cereus is an extreme case of the last example, once T%opt = pH%opt = 100%. Beyond this microorganism, Clostridium perfringens also presents a unique case where T%opt = 70%, like the first group, but with pH%opt = 100%.
Concerning the water activity influence seen in previous graphics, it is possible to relate the increase of water activity with the approach of maximum value of µmax. With the particular case of Escherichia coli, where the increase happens until the water activity maximum value, in all of the others the growth of aw represents an increase of µmax but only until a certain value. The increase after that value represents a decrease of the maximum specific growth rate. That value will be denoted as aw,opt. The different water activity limits are due to the diverse mechanisms of water movements between bacteria and their environment. This conditions the way different microorganisms deal with osmotic stress, that is, the impossibility of absorbing more water into the cells, and, thus, becoming unable to grow. In Table 7 all the values obtained with this study are presented, represented as minimum, maximum and optimal values of the temperature, pH and water activity for each bacteria, and also the values of initial, final and infective dose of CFU/g for each microorganism already described [22,24].
Table 7.
Minimum, maximum and optimal parameters to bacterial growth.
5. Conclusions
With growing consumer demand for food safety and security, several commercial sensors for smart packaging have been developed, however these require more research for their integration in food packaging and, still, it is necessary to overcome the obstacles for the commercial application of sensors on a large scale.
Thus, special attention is required, and extensive research efforts must be applied due to the potentially dangerous effects of chemical and biological components of sensors in food packaging. Therefore, the integration of such devices in the food industry is not an easy ordeal as the sensor components cannot be placed directly in contact with the food. In addition, it is necessary to evaluate their propensity to migrate to food content, in order to avoid interference in the texture, flavor, or taste of food.
That said, the application of mathematical predictive models to biochemical sensors represents an increasing challenge for sensor technologies applied to smart packaging. In this work a simplified approach to predict the food safety through the maximum specific bacterial growth rate as function of extrinsic and intrinsic parameters was described.
After the study of Baranyi and Roberts model, as well as the study of the variables that define it, it is possible to understand the relation between the bacterial growth curve and the intrinsic and extrinsic factors of the environment in which the bacteria develops. It is represented by the maximum specific growth rate (µmax). Through the Massana and Baranyi model, that allows the calculation of the referred growth rate, and the data provided in Combase Predictor, the coefficients that define the bacterial growth were estimated. Obtaining the value of these coefficients was possible to create tridimensional graphics that represent the relation between four parameters—temperature, pH, water activity and maximum specific growth rate—and conclude that the 14 bacteria studied can be divided in different groups characterized by the way that µmax is affected by the described factors.
The four groups were elaborated according to the similarities of the parameters that influence the bacterial growth, that is, mainly according to the optimal conditions of temperature, pH and water activity. Aeromonas hydrophila, Brochothrix thermosphacta, Clostridium botulinum and Escherichia coli composed the first one. The second group is formed by Bacillus licheniformis, Bacillus subtilis, Staphylococcus aureus, Yersinia enterocolitica and Pseudomonas. Another group is composed of Listeria monocytogenes, Salmonella and Shigella flexneri, and at last, the fourth group is constituted by unique and extreme cases such as Bacillus cereus and Clostridium perfringens.
Therefore, with these mathematical models it was possible to categorize some bacteria according to their different bacterial growth. In addition, they also allow to evaluate the conditions of temperature, pH and water activity that affect the development of these bacteria. Thus, it is possible to predict food security with regard to bacterial development, since this is one of the main promoters in food corruption. This study can then be applied as a predictive model for diverse food preservation, maintenance and packaging systems.
Author Contributions
Conceptualization, P.D.G.; methodology, P.D.G.; validation, P.D.G., P.P. and J.A.; formal analysis, P.D.G., P.P. and J.A.; investigation, P.D.G., P.P. and J.A.; resources, P.D.G., P.P.; data curation, P.D.G. and P.P.; writing—original draft preparation, P.D.G., P.P. and J.A.; writing—review and editing, P.D.G. and J.A.; supervision, P.D.G.; project administration, P.D.G.; funding acquisition, P.D.G. All authors have read and agreed to the published version of the manuscript.
Funding
UIDB/00151/2020 (C-MAST).
Institutional Review Board Statement
Not applicable.
Informed Consent Statement
Not applicable.
Acknowledgments
P.D.G. acknowledges Fundação para a Ciência e a Tecnologia (FCT—MCTES) for its financial support via the project UIDB/00151/2020 (C-MAST).
Conflicts of Interest
The authors declare no conflict of interest.
Nomenclature
| ai | Coefficients that define the maximum specific growth rate; |
| aw | Water activity; |
| bw | Constant (bw = ); |
| e | Euler’s number (e = 0.5772); |
| er | Relative error [%]; |
| h0 | Logarithmic value of a bacteria physiological state (h0 = -ln α0); |
| m | Parameter that define the curvature between the exponential and stationary phase; |
| nc | Parameter that define the curvature between the initial and exponential phase; |
| pH | Potential of hydrogen; |
| t | Time [h]; |
| T | Temperature [°C]; |
| X%opt | Percentage of the value range in which bacteria grow, for which bacterial growth is optimal (with X = Temperature or X = pH); |
| Xopt | Value for which bacterial growth is optimal (with X = Temperature or X = pH); |
| Xmin | Minimum value for which a bacteria grows (with X = Temperature or X = pH); |
| Xmax | Maximum value for which a bacteria grows (with X = Temperature or X = pH); |
| y | Logarithmic value of the number of colony forming unit by gram; |
| y0 | Initial number of colony forming unit by gram; |
| ymax | Maximum number of colony forming unit by gram; |
| α0 | Bacteria physiological state; |
| λ | Lag [h]; |
| µmax | Maximum specific growth rate [log(CFU/g)/h]. |
References
- Gao, T.; Tian, Y.; Zhu, Z.; Sun, D.W. Modelling, responses and applications of time-temperature indicators (TTIs) in monitoring fresh food quality. Trends Food Sci. Technol. 2020, 99, 311–322. [Google Scholar] [CrossRef]
- Zhang, X.; Sun, G.; Xiao, X.; Liu, Y.; Zheng, X. Application of microbial TTIs as smart label for food quality: Response mechanism, application and research trends. Trends Food Sci. Technol. 2016, 51, 12–23. [Google Scholar] [CrossRef]
- Villalobos, J.R.; Soto-Silva, W.E.; González-Araya, M.C.; González-Ramirez, R.G. Research directions in technology development to support real-time decisions of fresh produce logistics: A review and research agenda. Comput. Electron. Agric. 2019, 167, 105092. [Google Scholar] [CrossRef]
- Barska, A.; Wyrwa, J. Innovations in the food packaging market—Intelligent packaging—A review. Czech J. Food Sci. 2017, 35, 1–6. [Google Scholar] [CrossRef]
- Realini, C.E.; Marcos, B. Active and intelligent packaging systems for a modern society. Meat Sci. 2014, 98, 404–419. [Google Scholar] [CrossRef] [PubMed]
- Jang, N.Y.; Won, K. New pressure-activated compartmented oxygen indicator for intelligent food packaging. Int. J. Food Sci. Technol. 2014, 49, 650–654. [Google Scholar] [CrossRef]
- Martin, N.H.; Torres-Frenzel, P.; Wiedmann, M. Invited review: Controlling dairy product spoilage to reduce food loss and waste. J. Dairy Sci. 2021, 104, 1251–1261. [Google Scholar] [CrossRef]
- Kalpana, S.; Priyadarshini, S.R.; Maria Leena, M.; Moses, J.A.; Anandharamakrishnan, C. Intelligent packaging: Trends and applications in food systems. Trends Food Sci. Technol. 2019, 93, 145–157. [Google Scholar] [CrossRef]
- Müller, P.; Schmid, M. Intelligent packaging in the food sector: A brief overview. Foods 2019, 8, 16. [Google Scholar] [CrossRef] [PubMed]
- Gaspar, P.D.; Silva, P.D.; Andrade, L.P.; Nunes, J.; Santo, C.E. Technologies for monitoring the safety of perishable food products. In Research Anthology on Food Waste Reduction and Alternative Diets for Food and Nutrition Security; Information Resources Management Association, Ed.; IGI Global: Hershey, PA, USA, 2021; pp. 63–98. [Google Scholar] [CrossRef]
- Kuswandi, B. Freshness Sensors for Food Packaging. In Reference Module in Food Science; Elsevier: Amsterdam, The Netherlands, 2017. [Google Scholar] [CrossRef]
- Dalmoro, V.; Santos, J.H.Z.; Pires, M.; Simanke, A.; Baldino, G.B.; Oliveira, L. Encapsulation of sensors for intelligent packaging. In Food Packaging; Grumezescu, A.M., Ed.; Academic Press: Cambridge, MA, USA, 2017; pp. 111–145. [Google Scholar] [CrossRef]
- Vilela, C.; Kurek, M.; Hayouka, Z.; Röcker, B.; Yildirim, S.; Antunes, M.D.C.; Nilsen-Nygaard, J.; Pettersen, M.K.; Freire, C.S.R. A concise guide to active agents for active food packaging. Trends Food Sci. Technol. 2018, 80, 212–222. [Google Scholar] [CrossRef]
- FDA. Bad Bug Book, 2nd ed.; Center for Food Safety and Applied Nutrition (CFSAN) of the Food and Drug Administration (FDA); U.S. Department of Health and Human Services: Silver Springs, FL, USA, 2012. [Google Scholar]
- Willey, J.M.; Sherwood, L.; Woolverton, C.J.; Prescott, L.M. Prescott’s Principles of Microbiology, 1st ed.; McGraw-Hill Higher Education: Boston, MA, USA, 2009. [Google Scholar]
- Baranyi, J.; Roberts, T.A.; McClure, P.J. A non-autonomous differential equation to model bacterial growth. Food Microbiol. 1993, 10, 43–59. [Google Scholar] [CrossRef]
- Baranyi, J.; Roberts, T.A. A dynamic approach to predicting bacterial growth in food. Int. J. Food Microbiol. 1994, 23, 277–294. [Google Scholar] [CrossRef]
- Grijspeerdt, K.; Vanrolleghem, P. Estimating the parameters of the Baranyi model for bacterial growth. Food Microbiol. 1999, 16, 593–605. [Google Scholar] [CrossRef]
- Baranyi, J. Modelling and Parameter Estimation of Bacterial Growth with Distributed Lag Time. Ph.D.Thesis, Doctoral School of Informatics, University of Szeged, Szeged, Hungary, 2010. [Google Scholar]
- Masana, N.O.; Baranyi, J. Adding new factors to predictive models: The effect on the risk of extrapolation. Food Microbiol. 2000, 17, 367–374. [Google Scholar] [CrossRef]
- Gibson, A.M.; Baranyi, J.; Pitt, J.I.; Eyles, M.J.; Roberts, T.A. Predicting fungal growth: The effect of water activity on Aspergillus flavus and related species. Int. J. Food Microbiol. 1994, 23, 419–431. [Google Scholar] [CrossRef]
- ComBase Predictor: Growth Model. Available online: https://browser.combase.cc/ComBase_Predictor.aspx?model=1 (accessed on 3 May 2021).
- Dang, Y.T.H.; Gangadoo, S.; Rajapaksha, P.; Truong, V.K.; Cozzolino, D.; Chapman, J. Biosensors in Food Traceability and Quality. In Comprehensive Foodomics; Cifuentes, A., Ed.; Elsevier: Amsterdam, The Netherlands, 2020; pp. 308–321. [Google Scholar] [CrossRef]
- Gaspar, P.D.; Domingues, C.; Gonçalves, L.C.C.; Andrade, L.P. Avaliação da qualidade e segurança alimentar pela previsão do crescimento microbiano em diferentes condições de conservação. In Proceedings of the V Congreso Ibérico y III Congreso Iberoamericano de Ciencias y Técnicas del Frío (CYTEF-2009), Castelló, Spain, 23–25 September 2009. [Google Scholar]


Publisher’s Note: MDPI stays neutral with regard to jurisdictional claims in published maps and institutional affiliations. |
© 2021 by the authors. Licensee MDPI, Basel, Switzerland. This article is an open access article distributed under the terms and conditions of the Creative Commons Attribution (CC BY) license (https://creativecommons.org/licenses/by/4.0/).