Abstract
The oxidation of aqueous solutions containing Allura Red AC (AR–AC) using bicarbonate-activated peroxide (BAP) and cobalt-impregnated pillared clay (Co/Al–PILC) as the catalyst was investigated. Using the CCD-RMS approach (central composite design–response surface methodology), the effects of dye, H2O2, and NaHCO3 concentrations on AR–AC degradation were studied. The decolorization, total nitrogen (TN), and total carbon (TC) removals were the analyzed responses, and the experimental data were fitted to empirical quadratic equations for these responses, obtaining coefficients of determination R2 and adjusted-R2 higher than 0.9528. The multi-objective optimization conditions were [dye] = 21.25 mg/L, [H2O2] = 2.59 mM, [NaHCO3] = 1.25 mM, and a catalyst loading of 2 g/L. Under these conditions, a decolorization greater than 99.43% was obtained, as well as TN and TC removals of 72.82 and 18.74%, respectively, with the added advantage of showing cobalt leaching below 0.01 mg/L. Chromatographic analyses (GC–MS and HPLC) were used to identify some reaction intermediates and by-products. This research showed that wastewater containing azo dyes may be treated using the cobalt-catalyzed BAP system in heterogeneous media.
Keywords:
Allura Red AC; degradation; bicarbonate activated peroxide; cobalt; pillared clay; optimization; RSM 1. Introduction
Azo dyes have applications in diverse industries, with the textile sector being the largest consumer, as well as the cosmetics, paper, food, and pharmaceutical industries [1]. They represent 70% of the world’s commercial dyes. The structure of these compounds consists of one or more azo groups (–N=N–) as chromophores, which link to aromatic rings (benzene or naphthalene). These rings can also be substituted with –OH and –HSO3 groups [2,3,4].
The presence of azo bonds and salts or esters of sulfonic acids has been related to the non-biodegradability of azo dyes [5], which are considered xenobiotic characteristics [6,7]. Synthetic dyes affect aquatic life by decreasing light penetration and altering photosynthetic activity in the ecosystem [8].
Dye wastewater treatments are based not only on color removal (decolorization) but also on the degradation and mineralization of the pollutant. Advanced oxidation processes (AOPs) can be defined as a set of chemical treatments designed to degrade complex refractory pollutants in water and wastewater by oxidizing species, mainly hydroxyl radicals (•OH) [9]. Different AOPs have been developed for the degradation of pollutants present in water, particularly photocatalytic oxidation [10], electrochemical degradation [11], activated persulfate [12], and Fenton processes [13].
Although Fenton/Fenton-like processes have proven effective in treating recalcitrant compounds, their use is restricted to the pH range of 2–3 and the separation of metal ions once oxidation is completed [14].
Bicarbonate (NaHCO3)-activated peroxide (H2O2) oxidation, also known as BAP, is gaining much interest from scientists because it works well to treat water with neutral or mildly alkaline pH conditions [15,16]. In addition, the BAP system produces more reactive oxygen species (, ) than traditional AOPs [17]. Several studies have described how adding metal ions, for example Co(II), to the BAP system increases the degradation rate of pollutants [18,19]. The Co(II) ion exhibits greater reactivity compared to other metal salts containing Fe(II), Cu(II), or Mn(II) [17,19,20].
Bicarbonate ions () are highly water-soluble chemical species of low or no toxicity, widely distributed in nature, and efficient activators of H2O2 to generate reactive oxygen species [14,21,22]. Under neutral or slightly basic pH conditions, the cobalt(II) ion-catalyzed bicarbonate-activated peroxide system has achieved the degradation of dye methylene blue [19], brilliant red X–3B [23] and orange II acid [18]. Cobalt has been supported on diatomite [24], layered double hydroxide (Co–LDH) [17], clay with aluminum pillars (Co/Al–PILC) [15], and granular activated carbon (GAC) [25] to avoid cobalt ion contamination in the BAP system.
The heterogeneous BAP system was initially studied by Zhou et al. [24], who supported the active phase cobalt on a diatomite to degrade methylene blue and phenol. The efficiency of the heterogeneous process was better than that of control experiments, including reactions in a homogeneous medium with cobalt ions under the same conditions. Since the reaction medium is weakly basic due to the addition of sodium bicarbonate, cobalt leaching was very low. Furthermore, the catalyst’s functionality was prolonged to 180 h in a fixed-bed experiment, with no notable decline in activity [24]. Cobalt impregnated on aluminum pillared clay (Co(1.0%)/Al–PILC) was used for the sunset yellow degradation with the BAP system (batch test), obtaining total decolorization and total nitrogen (TN) and total carbon (TC) removals of 27.9 ± 2.4% and 18.5 ± 3.2%, respectively. In addition, it was observed that the alkaline conditions during the BAP process were not conducive to the leaching of Co supported on Al–PILC, with concentrations remaining below 0.01 mg/L [15].
This study optimized the Allura Red AC degradation in a heterogeneous phase (cobalt supported on an Al–PILC), eliminating the post-oxidation adsorption of cobalt ions, which was used in a BAP system catalyzed by Co2+ ions (homogeneous phase) [26]. For this, cobalt was impregnated in an aluminum pillared clay at a ratio of 1.0 wt.% cobalt and used as the catalyst in the dye oxidation, with NaHCO3-activated H2O2 as the oxidizing species. The effects of dye, H2O2, and NaHCO3 concentrations were analyzed by a central composite design (CCD) approach based on response surface methodology (RSM). Optimal concentrations of reagents that allowed maximum decolorization and mineralization of the dye (removals of TN and TC) were also obtained. In addition, chromatographic analyses (GC–MS and HPLC) facilitated the identification of some reaction intermediates and oxidation by-products.
2. Materials and Methods
2.1. Reagents
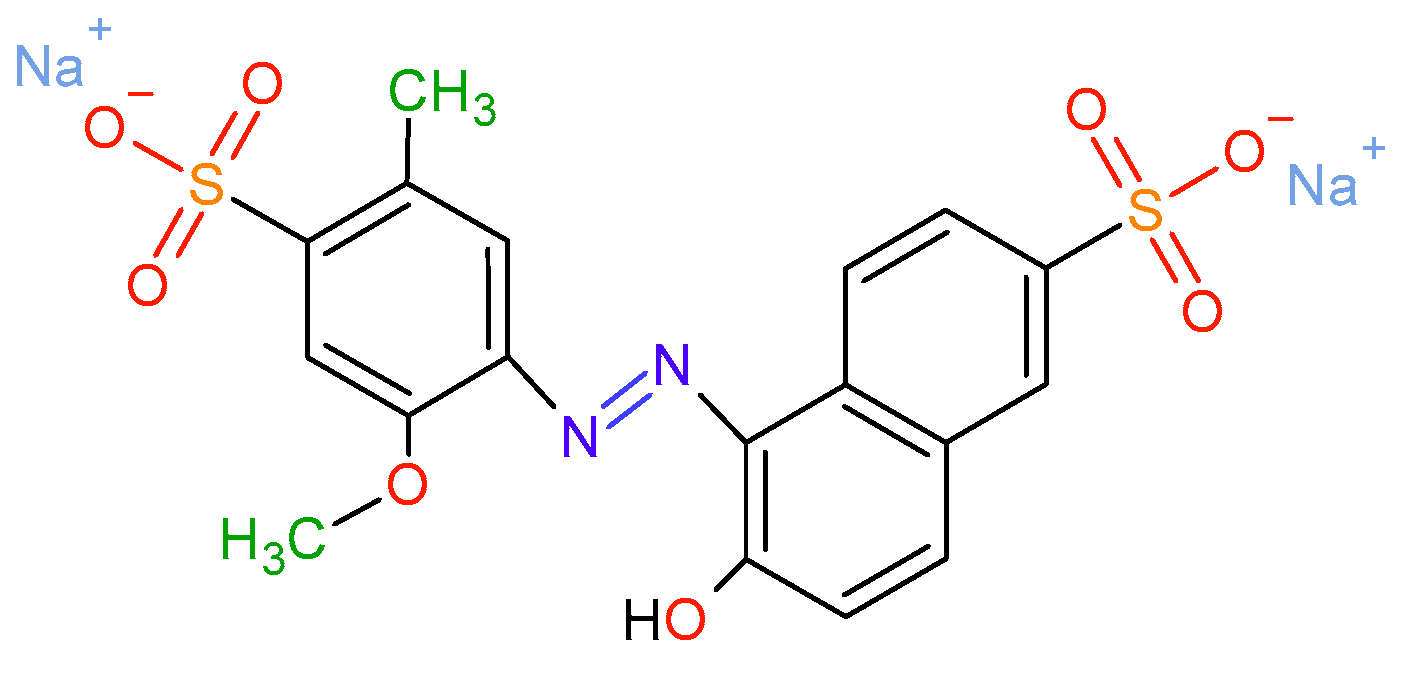
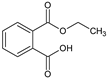
The reagents utilized for the catalyst synthesis (AlCl3·6H2O, NaOH, and Co(NO3)2·6H2O) and oxidation reaction (NaHCO3, H2O2) were of high purity, obtained from Merck KGaA (Darmstadt, Germany). Allura Red AC (C18H14N2Na2O8S2, 496.4 g/mol, CAS number: 25956-17-6) was a reagent of food quality (86%) acquired from Retema SAS (Medellín, Colombia). Figure 1 illustrates the chemical structure of the dye under study. All reagents and solvents (acetonitrile, phosphate buffer pH 2.2) used for the chromatography analysis (ammonium acetate, sulfuric acid, oxalic and maleic acids) were supplied by Merck KGaA (Darmstadt, Germany).

Figure 1.
Chemical structure of Allura Red AC.
2.2. Synthesis and Characterization
From a mine near Armero-Guayabal, Colombia, bentonite was extracted. This bentonite’s mineralogical and chemical analysis were previously reported [27]. Following a standard procedure [28,29], the catalytic support corresponding to aluminum pillared clay (also known as Al–PILC) was synthesized using a hydrolysis ratio OH–/Al3+ of 2.2. It was subsequently impregnated with Co(NO3)2·6H2O (1.0 wt.% cobalt), following the methodology used in a previous study [15].
The starting clay (Na–Bent), the support (Al–PILC), and the cobalt-impregnated catalyst (Co(1.0%)/Al–PILC) underwent characterization using X-ray fluorescence (Magix Pro-PW2440 XRF spectrometer), X-ray diffraction (Rigaku Mini-Flex II Diffractometer), and nitrogen adsorption isotherms (ASAP 2020 analyzer). The specific surface area of the samples (SSA) was estimated using the BET model [30]. The t-plot method and the Harkins–Jura thickness equation were used to find the microporous specific surface area (Smicro) and micropore volume (Vmicro) [31]. The Horvath–Kawazoe model, using slit-shaped pore geometry, determined the micropore size distribution [32].
The solid addition method was utilized to determine the zero-point charge (pHzpc) of the Co(1.0%)/Al–PILC sample [33,34].
2.3. Catalytic Tests
The Co/Al–PILC material was tested for AR–AC adsorption (25 mg/L) in an aqueous solution of NaHCO3 (0.9 and 1.6 mM) before catalytic experiments. Dye adsorption in the presence of NaHCO3 was monitored for 5 h, keeping the stirring speed at 250 rpm. The oxidation tests were performed in a doubled jacketed glass reactor controlled at 298 K. Then, 200 mL of an aqueous solution containing AR–AC at a predetermined concentration was added to the reactor. After, a predetermined amount of NaHCO3 and 400 mg of the catalyst (equivalent to a dose of 2 g/L) were added into the reactor, and the suspension was continuously stirred at 250 rpm for 1 h. Then, H2O2 was added and the reaction started.
The reaction time for each test was 5 h (excluding the dye’s adsorption–desorption equilibrium period). The AR–AC concentration was quantified from aliquots (0.75 mL of sample filtered (0.45 μm Millipore membrane)), using a previous calibration curve obtained by UV-Vis spectrophotometry (Genesys 150, Thermo Scientific, Madison, WI, USA) at a wavelength (λ) of 499 nm. Decolorization was calculated from Equation (1):
where and are dye concentrations at t = 0 and at time t, respectively.
A TOC/TN analyzer (Multi N/C 3100, Analytik Jena GmbH+Co., Jena, Germany) was used to measure the carbon and nitrogen content in the samples. Total carbon (TC) and total nitrogen (TN) content measurements were carried out both at the start and at the end of the reaction (t = 5 h). TN and TC removals were determined by Equations (2) and (3), respectively:
where , , , and are the TN and TC concentrations at the start and end of the reaction.
2.4. Experimental Design—Statistical Analysis of the Models
A central composite rotatable design (CCD) that consisted of five-level (–α, –1, 0, +1, +α, with α ± 1.414) for three independent variables (AR–AC, H2O2, and NaHCO3 concentrations) was selected to study the dye oxidation by the Co/Al–PILC–BAP system. Ranges of concentrations of reagents (H2O2 and NaHCO3) and the contaminant (AR–AC) to be studied were established from preliminary tests. Table 1 lists the range of variables and their respective levels. Response functions were decolorization, total nitrogen (TN), and total carbon (TC) removals. The Design Expert software (version 8.0, StatEase, Inc., Minneapolis, MN, USA) was used to design and analyze the oxidation experiments. The experimental design included 24 runs, wherein 4 replicates were conducted at the center points, and duplicates were carried out at the axial points.

Table 1.
Independent variables for dye degradation and corresponding levels.
2.5. Chromatographic Analysis of Reaction By-Products
The quantification of AR–AC and identification of carboxylic acids was performed by HPLC using an UltiMate 3000 HPLC (Thermo Fischer Scientific Inc., Sunnyvale, CA, USA), while data were analyzed with the Chromeleon 7.2 software. The procedure established for identifying and quantifying this dye in beverages was followed in measuring the AR-AC concentration [35], using a C18 RP column (Eurospher II 100, 4.6 mm i.d. × 150 mm, 0.5 μm; Knauer, Berlin, Germany) as the stationary phase. The mobile phase was 0.02 M ammonium acetate in acetonitrile (85:15). The flow rate was 1.0 mL/min, with the detector operating at 498 nm. The injection volume was 20 μL with an oven temperature set at 303 K.
For the identification of carboxylic acids generated as by-products of oxidation, the stationary phase consisted of a Supelcosil LC-18-DB column (4.6 mm i.d. × 250 mm, 0.5 μm; Supelco Inc., Bellefonte, PA, USA). Phosphate buffer at pH 2.2 and 4.0 mM sulfuric acid (90:10) were used as the mobile phase. The flow rate was 1.0 mL/min with the detector operating at 210 nm. The injection volume was 20 μL with an oven temperature set at 303 K. The retention times of carboxylic acid standards were compared to identify chromatogram peaks.
Aromatic by-products generated in the oxidation reaction were analyzed by GC–MS QP2010 Ultra (Shimadzu, Kyoto, Japan), using a Supelcosil DB-5 column (4.6 mm i.d. × 250 mm, 0.5 μm; Supelco Inc., Bellefonte, PA, USA) as the stationary phase. The initial furnace temperature was 308 K, augmented to 568 K with a heating ramp of 10 K/min. The gas carrier utilized was helium (99.996%) at a 1.5 mL/min flow rate. Both the interface and the ion source temperatures were 563 K.
Organic compounds were extracted using the solid phase microextraction technique (SPME), with a carbon wide range (WR)/polydimethylsiloxane (PDMS) fiber (11 mm o.d., 120 μm; Restek Corporation, Bellefonte, PA, USA).
This process was carried out by taking 5.0 mL of liquid sample from the oxidation process, which was then set in contact with the carbon fiber for 20 min at 303 K and magnetic stirring at 300 rpm. After extraction, the fiber was retracted and the extracted components were desorbed in a GC–MS.
3. Results and Discussion
3.1. Sample Characterization
The chemical analysis of starting clay (Na–Bent), pillared bentonite, and cobalt-impregnated catalyst are shown in Table 2. Based on the diagram for identifying the clay mineral [36], the classification of clay minerals is established by SiO2 and (Al2O3 + Fe2O3) composition. According to this diagram, Na–Bent was classified inside the montmorillonite zone [15]. The aluminum oxide content of Al–PILC was higher than that of Na–Bent because of the exchange of Na+ in bentonite by aluminum polyhydroxycations (Keggin Al13 ions), which were transformed into pillars by a calcination process. The SiO2/Al2O3 ratio decreased with the pillaring process and remained practically constant after cobalt impregnation. The theoretical concentration of cobalt used in the impregnation was slightly lower than the experimental content in the catalyst. The accuracy of the analytical procedure may be related to the discrepancy between theoretical and experimental concentrations [37].
Table 2.
Chemical analysis of the samples.
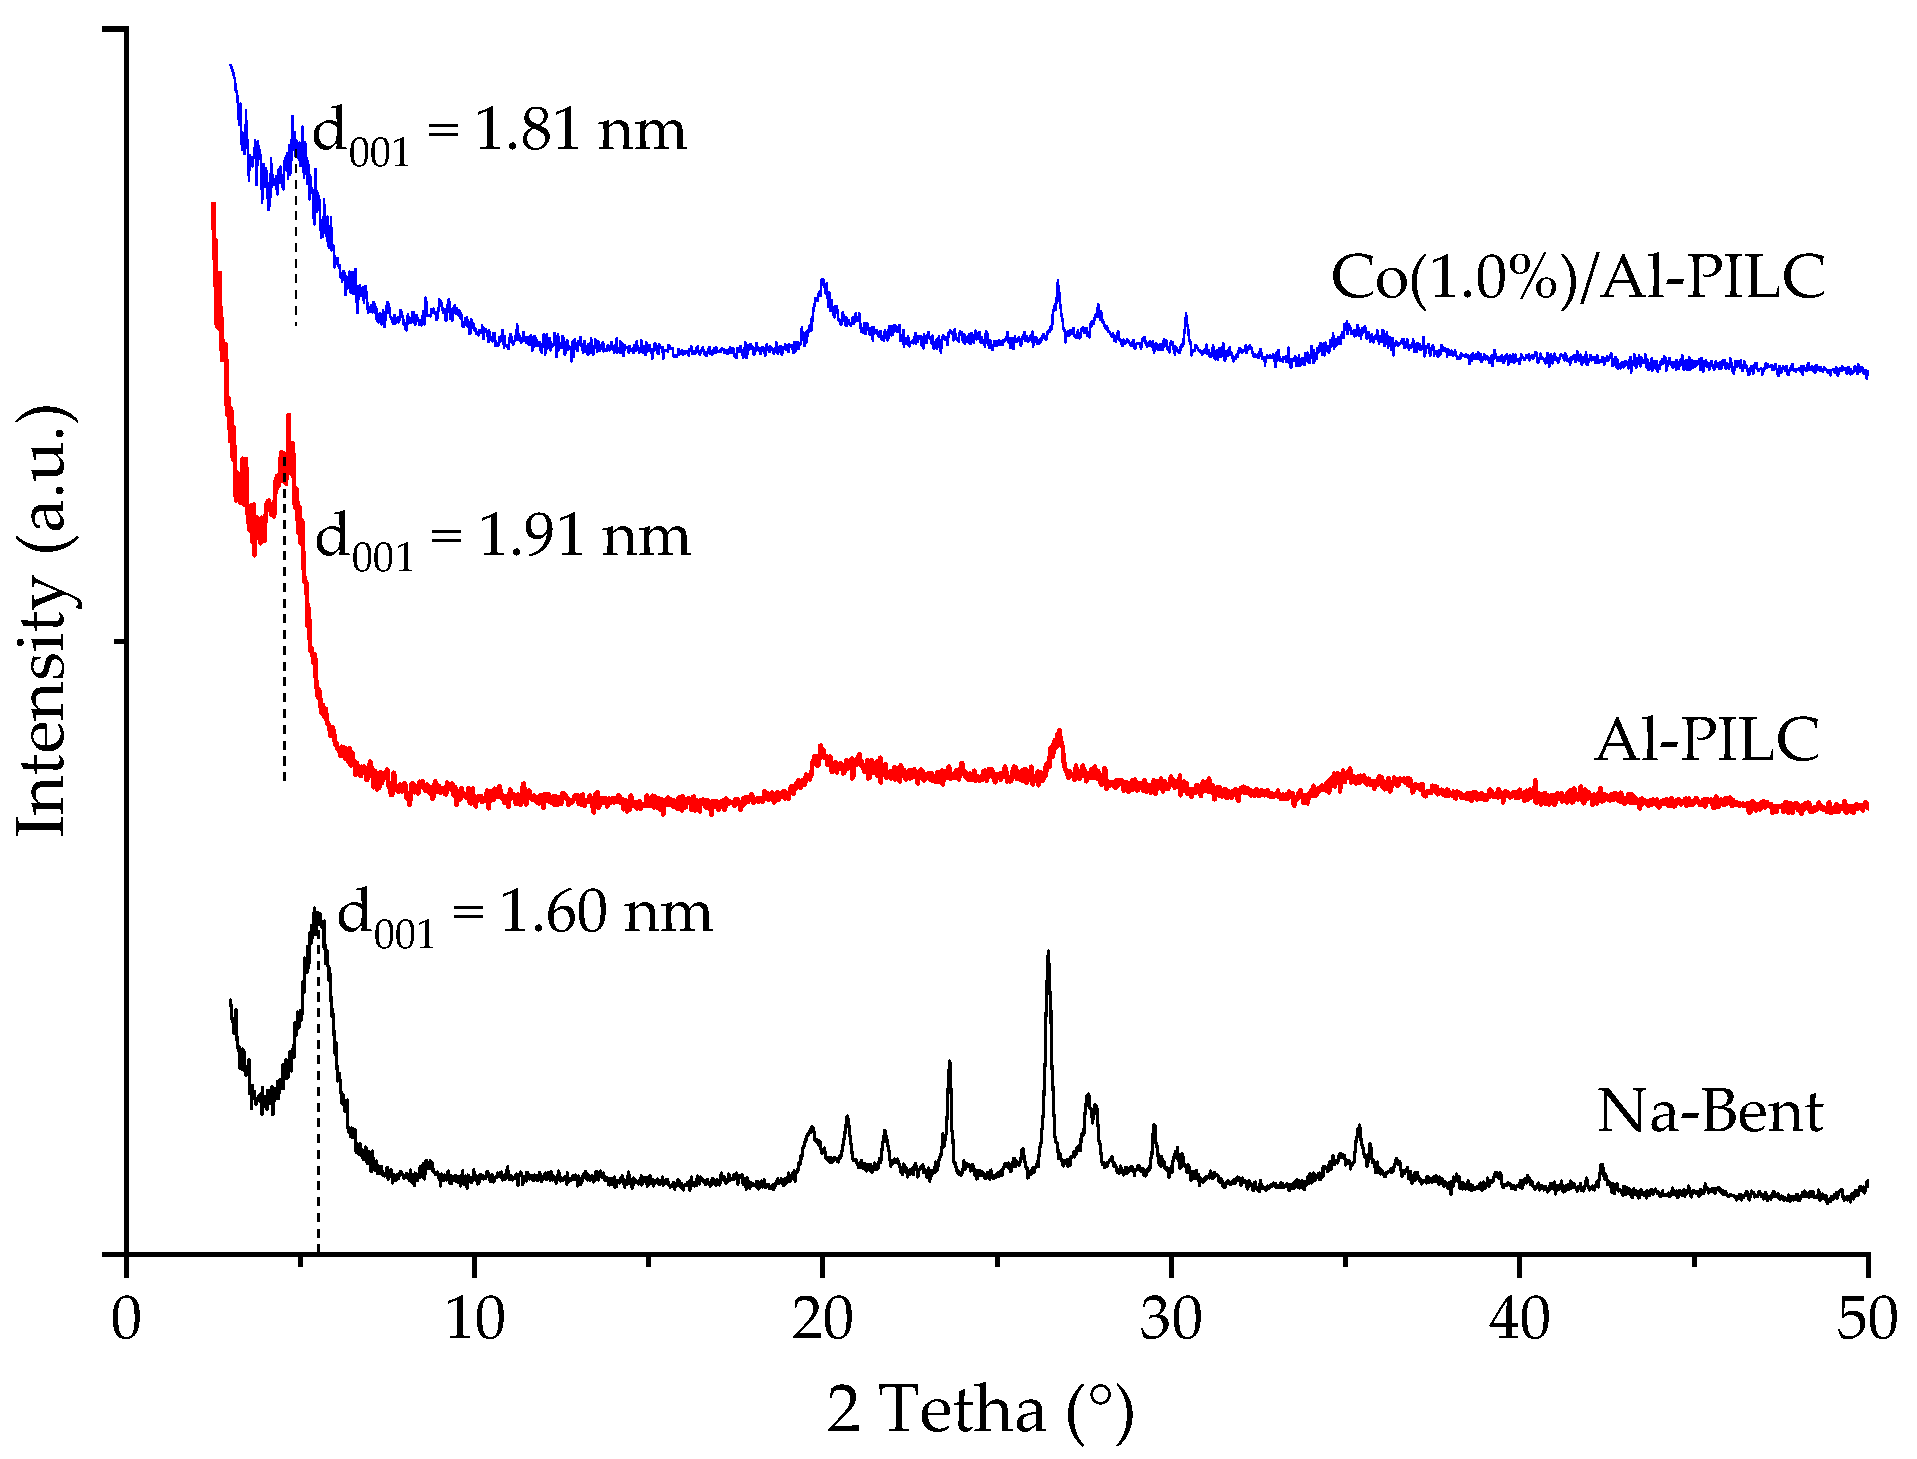
The X-ray diffraction patterns of the bentonite, the pillared clay, and the cobalt-impregnated catalyst are illustrated in Figure 2. The change of the reflection d001 from 1.60 nm (2θ = 5.52°) in Na–Bent to 1.91 nm (2θ = 4.63°) in Al–PILC provides evidence for the structural transformation of the bentonite through the process of pillaring. The Al13 Keggin ions form pillars whose dimension has been estimated to be 0.97 nm × 089 nm × 1.09 nm. After heating with air, the Keggin ions lost their water ligands, forming shorter Al13 blocks with a height between 0.96 and 0.84 nm, depending on the treatment temperature [38]. The basal spacing of 19.1 Å for Al-PILC corresponded to the thickness of a montmorillonite-type clay sheet (≈1.0 nm) plus the aluminum pillar (0.91 nm).

Figure 2.
XRD patterns of starting bentonite, pillared bentonite, and cobalt-impregnated catalyst.
The catalyst prepared by the incipient wetness impregnation (IWI) technique did not exhibit the typical peaks associated with the cobalt oxides (Co3O4, Co2O3, and CoO) in the zone of 2θ from 32 to 39° [39]. The above suggests that the CoxOy was dispersed in Al-PILC or was non-crystalline [15,39]. Other characterization techniques have confirmed the presence of cobalt oxides in impregnated pillared clays and the oxidation state of Co [39,40]. Marković et al. (2019) [39] and Milovanović et al. (2022) [40] confirmed by XPS analysis only the presence of Co2+ in aluminum-pillared clays impregnated with low cobalt loadings (in the range of 1.0–3.0 wt.%). Therefore, for the Co(1.0%)/Al-PILC material, the oxidation state of cobalt would be expected to be 2+.
The layered structure of the support is preserved in the cobalt-impregnated catalyst, with a slightly lower reflection d001 (1.81 nm, 2θ = 4.87°) due to the additional calcination of this material after impregnation.
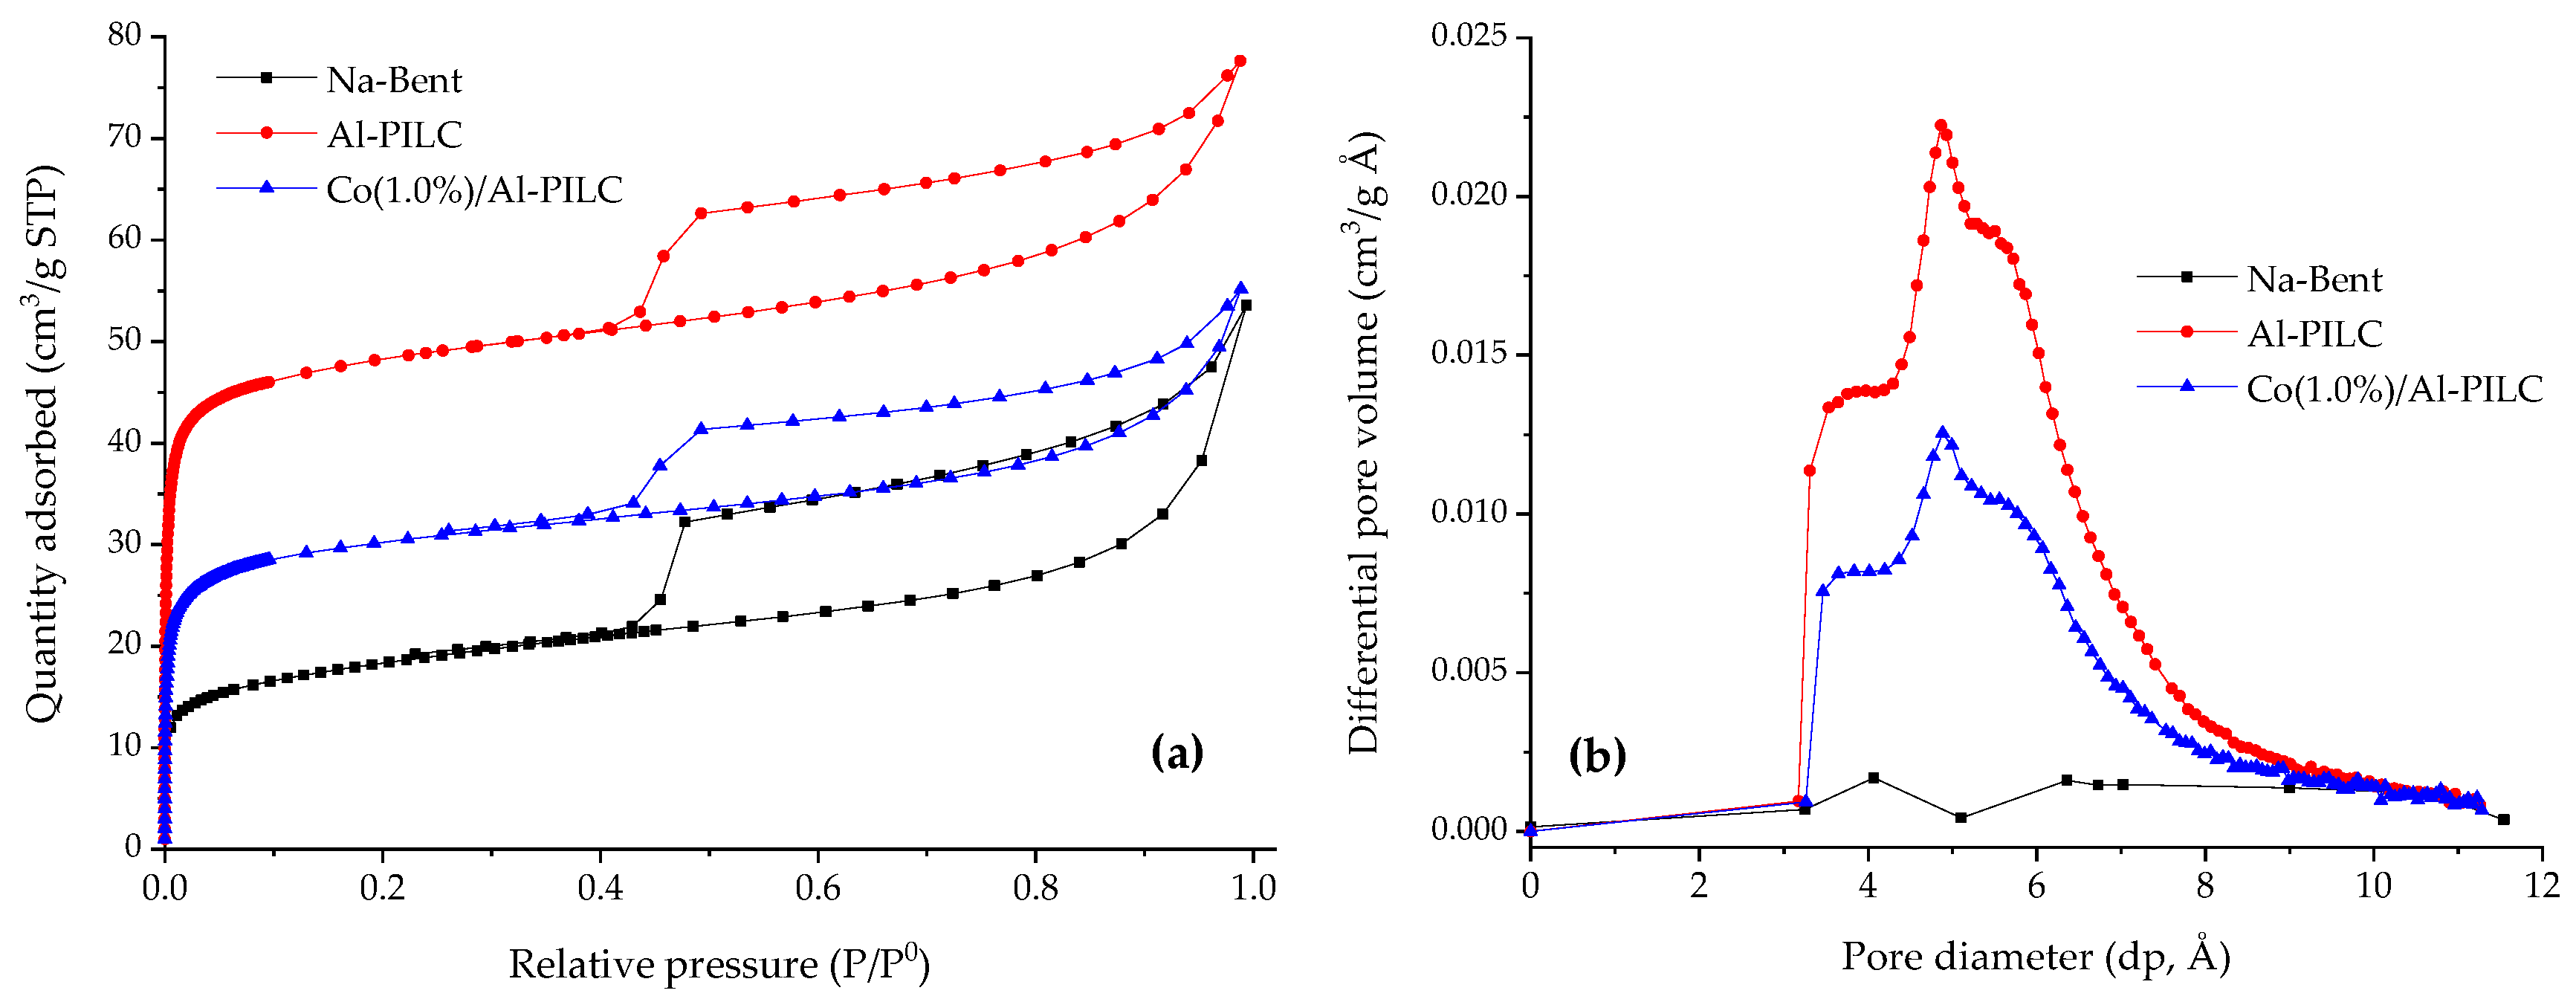
N2 adsorption–desorption isotherms at 77 K and pore size distribution curves for starting clay, support, and cobalt-impregnated catalyst are shown in Figure 3a,b, respectively. All isotherms can be classified as type IVa, with hysteresis loop type H3 (Na–Bent) and H4 (Al–PILC and Co(1.0%)/Al–PILC), associated with particle agglomerates presenting slit-like pores where capillary condensation occurs [41]. Table 3 presents a summary of the textual characterization of the materials.
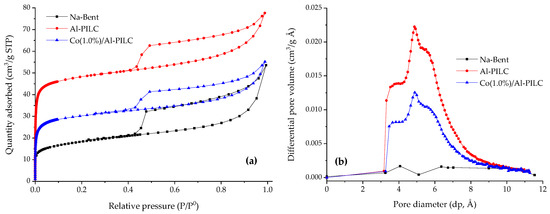
Figure 3.
(a) Adsorption isotherms and (b) pore size distribution of starting bentonite, pillared clay, and cobalt-impregnated catalyst.
Table 3.
Textural parameters for starting bentonite, pillared clay, and cobalt-impregnated catalyst.
The bentonite pillaring process increased the specific surface area and the microporous area, as well as the volume of micropores in the modified clay. The SBET increased from 49 m2/g in starting clay to 189 m2/g in pillared clay, verifying the change in the textural properties of the clay. However, after the impregnation of Al–PILC with the cobalt salt and the subsequent calcination, a decrease of 38.6% of the specific surface area and 43.3% of the microporous area was observed. The above is due to the obstruction of CoxOy in the pores of the pillared clay. Similar results have been obtained for pillared clay impregnated with cobalt [15,42], molybdenum [43], and platinum [44].
The pore size distribution provides information on the structural heterogeneity of the bentonite after pillaring and impregnation with cobalt [45]. Figure 3b shows the differential pore volume distribution calculated using the Horvath and Kawazoe model for an alumina-pillarized montmorillonite [46]. The distribution for Al–PILC and Co(1.0%)/Al–PILC exhibited a trimodal function with maxima around 3.9, 4.9, and 5.5 Å, with 4.9 Å having the highest intensity. Sodium bentonite showed a negligible pore size distribution in the microporous zone. In contrast, the aluminum pillared clay (support) and the impregnated material (Co(1.0%)/Al–PILC) showed comparatively high volumes. The median pore diameters (dp) for Al-PILC and Co(1.0%)/Al-PILC were 5.2 and 5.3 Å, respectively, values similar to those obtained in pillared clay synthesized with different Al/clay molar ratios, which were between 5.5 and 5.9 Å [46].
3.2. Catalytic Tests—Experimental Design
Before oxidation experiments, adsorption tests of the dye in NaHCO3 (0.9 and 1.6 mM) on Co/Al–PILC were performed. The dye adsorption on the catalyst was evaluated for 5 h. For the two NaHCO3 concentrations utilized, the pH of the medium varied between 8.4 and 8.6, and at basic pH conditions the adsorption of AR–AC on the catalyst was very low. Between 15 and 30 min of contact time, the maximum adsorption (1.2 ± 0.2%) was reached, and after 30 min, this remained constant. Therefore, an adsorption–desorption equilibrium time of 1 h was established. The adsorption of sunset yellow at a concentration on Co/Al–PILC has shown similar results [15]. The zero-point charge (pHzpc) of Co/Al–PILC was 6.4. As pHadsorption > pHzpc, the catalyst’s surface was negatively charged [33,47], and electrostatic adsorption of anionic dyes such as AR–AC is not promoted.
The details of the design run (coded and experimental values) and the response functions obtained are shown in Table 4, where A, B, and C represent the concentrations of AR–AC (mg/L), H2O2 (mM), and NaHCO3 (mM), respectively. Response functions (Y1 = decolorization, Y2 = TN removal, and Y3 = TC removal) were fitted to a quadratic equation, and a multiple regression analysis determined the response models’ coefficients and significance. The response surface plots for the models were generated by Design-Expert software. The coefficients of determination (R2, adjusted R2, and predicted R2), the adequate precision, and the coefficient of variation (CV) were used to evaluate the model’s fits [48].
Table 4.
Experimental design matrix and results of the runs obtained in the dye oxidation.
Analysis of variance (ANOVA) was used to estimate the significance of the model. The results for the three response functions are shown in Table 5, Table 6 and Table 7. When a model’s p-value is less than 0.05, it is significant. In this study, all three models had p-values < 0.0001, indicating that the models can be used to predict the responses.
Table 5.
ANOVA results for decolorization (%)—model and coefficients validation.
Table 6.
ANOVA results for TN removal (%)—model and coefficients validation.
Table 7.
ANOVA results for TC removal (%)—model and coefficients validation.
The analysis for color removal was performed for t = 1 h because at 5 h of reaction, decolorizations in all tests were higher than 96.93%, and the response did not fit well with the second-order polynomial. Results similar to decolorization in the present study were observed when carbamazepine (CBZ) was oxidized using the UV/Persulfate/Zero-valent iron system. The degradation efficiency of CBZ in all runs of the Box–Behnken experimental design ranged from 86% to 100%. Unfortunately, developing a model for predicting this particular molecule’s oxidation was not possible [49].
The statistical parameters for the three-model fit are shown in Table 8. The high values of R2 and adjusted R2 [50,51], which were greater than 0.9713 and 0.9524, respectively, supported the validity of the suggested models. When the difference between the adjusted R2 and predicted R2 is <0.2, the values reasonably agree [50,52]. For this study, the differences were 0.0362, 0.0509, and 0.0464 for decolorization and TC and TN removals, respectively. Adequate precision is a statistical parameter that measures the signal-to-noise ratio and S/N ˃ 4 are desirable for models. In this study, the values of adequate precision were between 20.243 and 39.970. A model whose coefficient of variance (CV) is less than 10% is considered very good [49,50]. The CV values of the three response variables were between 1.08 and 4.85%, indicating low dispersion between the fitted and actual data.
Table 8.
Summary of the fit statistics parameters.
Response functions determined for color (Y1), TN (Y2), and TC (Y3) removals are presented in Equations (4)–(6), respectively:
where A, B, and C represent the concentrations of AR–AC (mg/L), H2O2 (mM), and NaHCO3 (mM), respectively.
Based on the coefficients of Equations (4)–(6), it is concluded that the removals of color, TN, and TC were improved with increasing concentrations of H2O2 and NaHCO3 (coefficients with positive sign). Compared to H2O2, NaHCO3 showed a greater effect. In the three response function equations, the NaHCO3 concentration coefficients exhibited the highest magnitude. The increase in AR–AC concentration favored decolorization and TN removal, while TC removal showed the opposite effect (coefficient of negative sign). Since the HCO3– is a hydrogen peroxide activator in oxidation reactions [16], the BC interaction (H2O2 × NaHCO3) exhibited a positive effect on all three response variables.
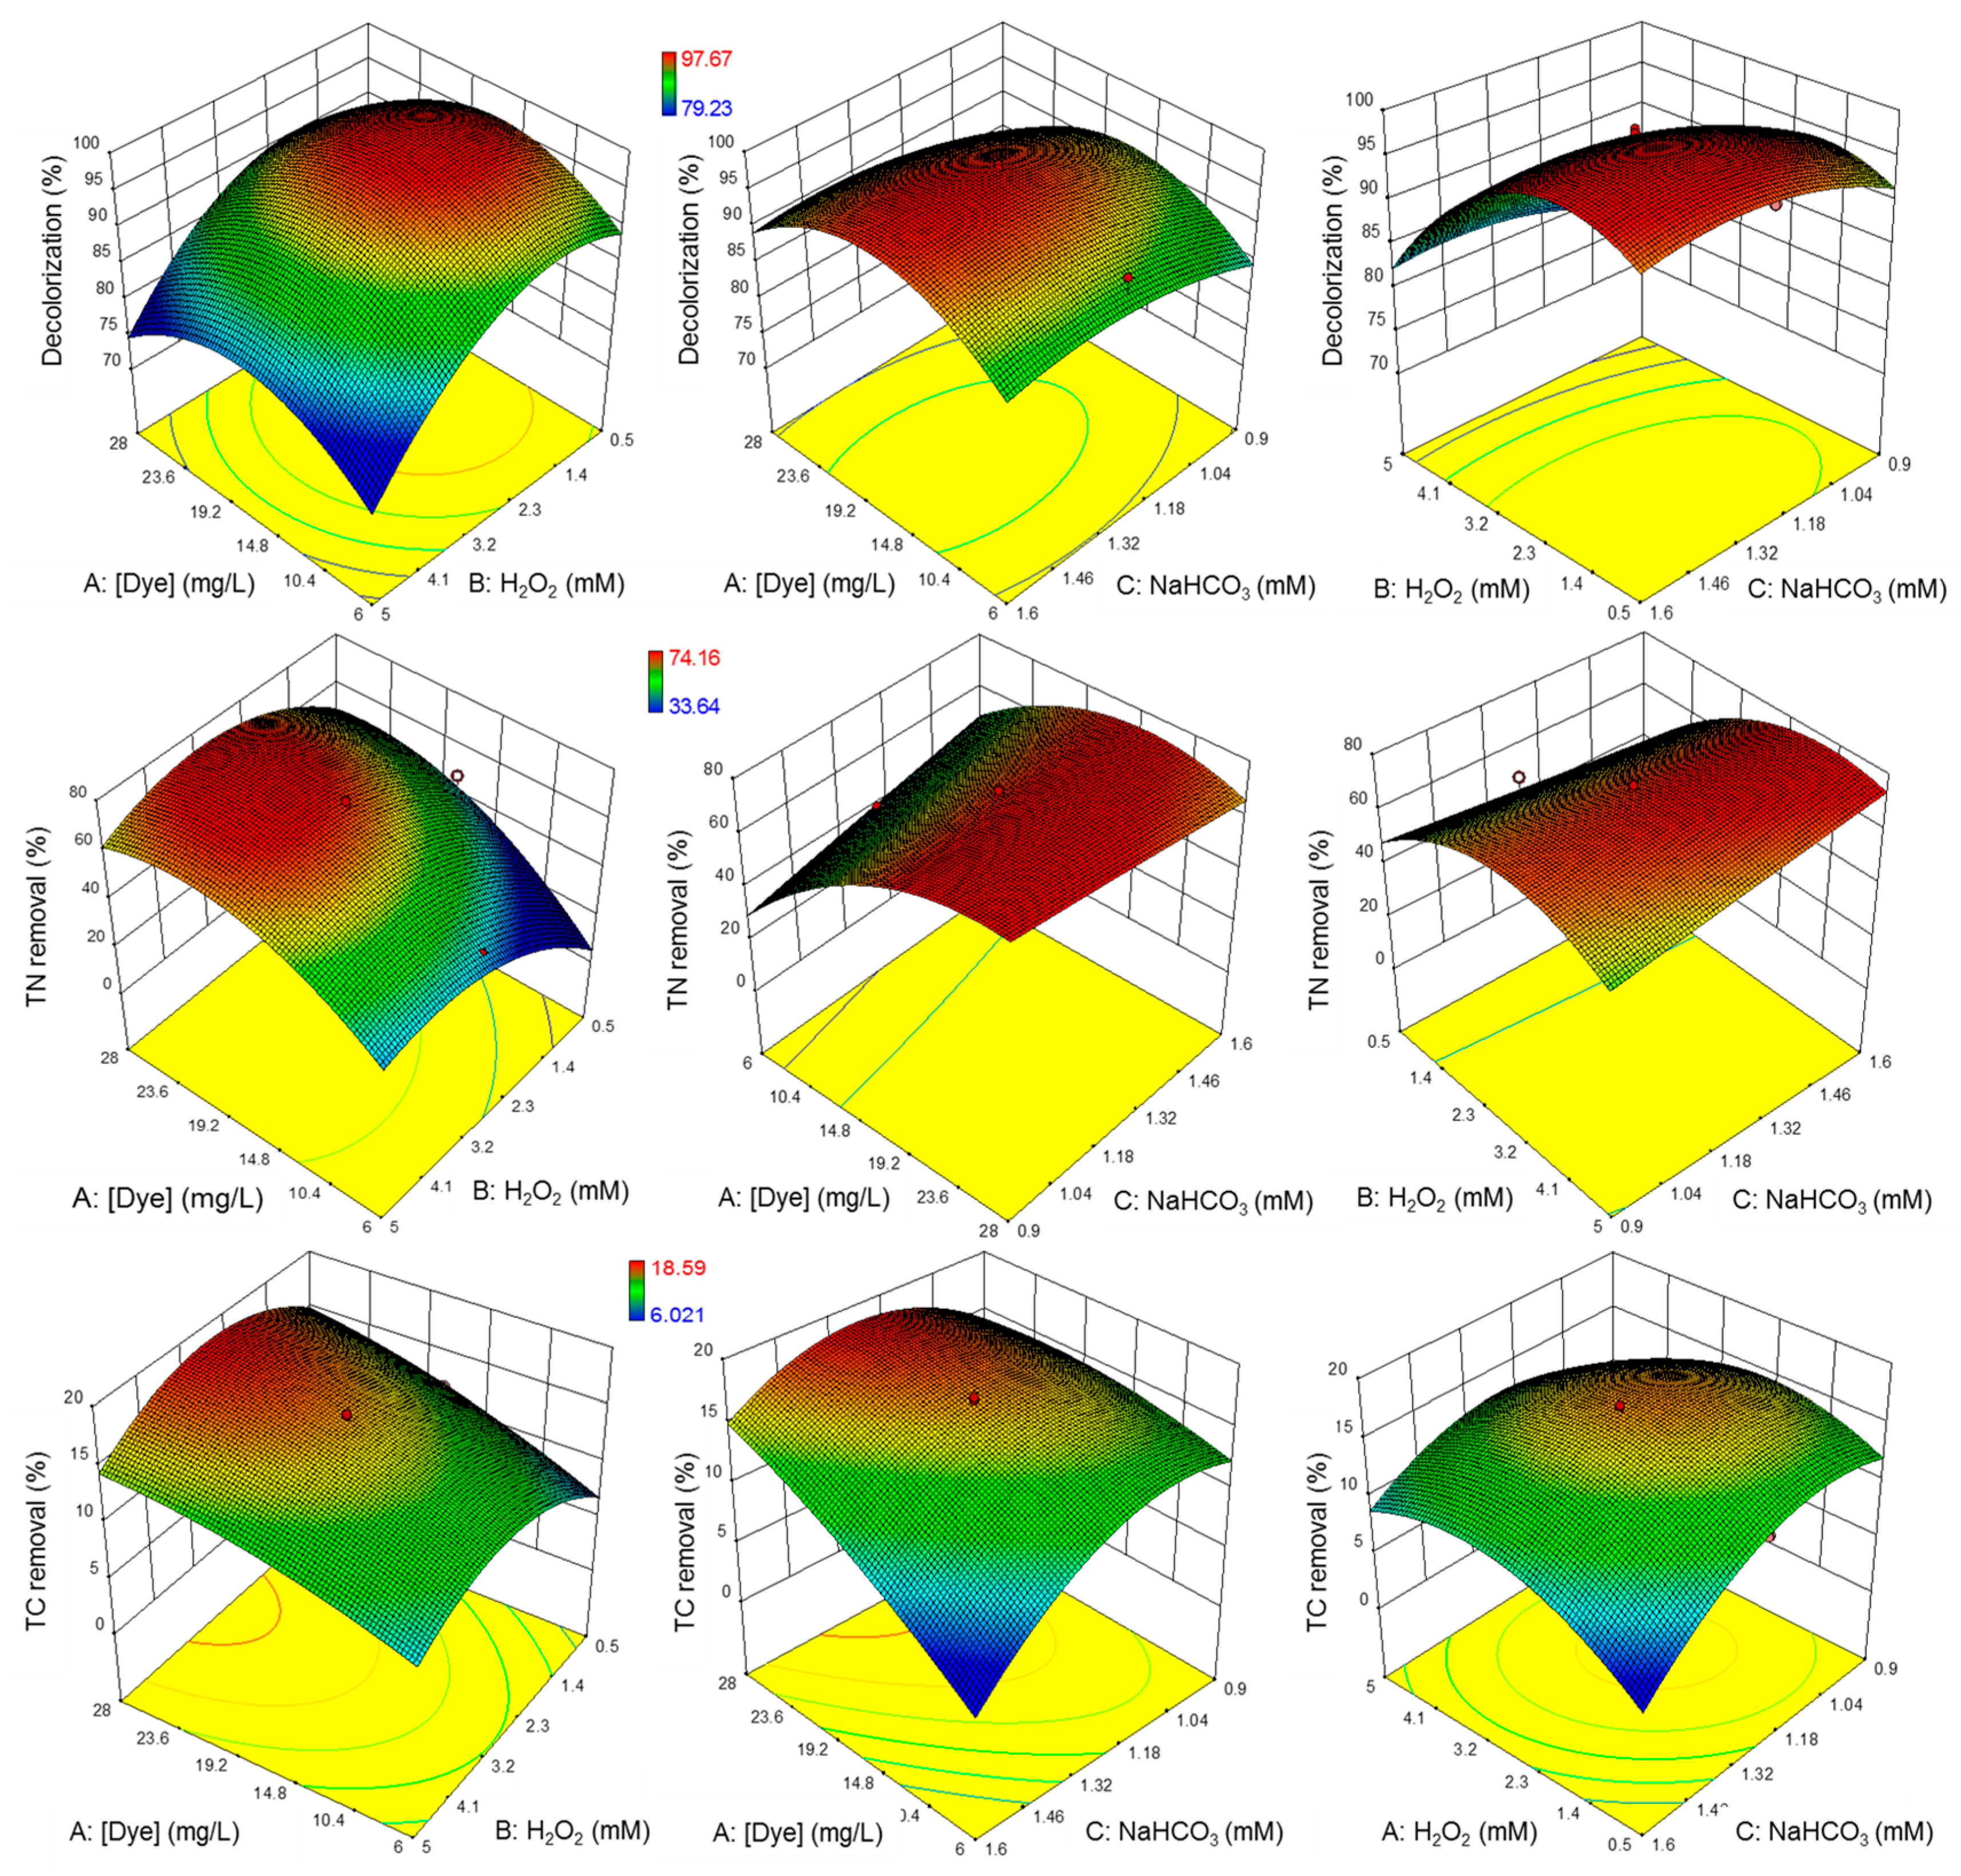
In Figure 4, 3D surface plots of the RSM models are presented. The response surface plots were constructed by maintaining one variable at a fixed value (central point) of the design (see Table 4) and changing the values of the other two variables.
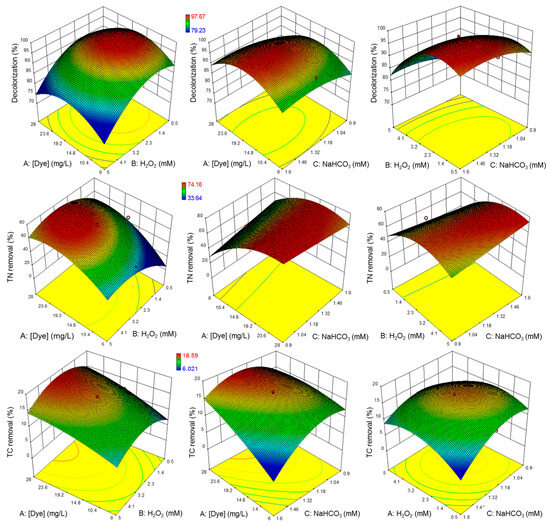
Figure 4.
Three-dimension response surface plots for color, TC, and NT removals as a function of dye, H2O2, and NaHCO3 concentrations.
According to the decolorization surface plot, it is more pronounced at [H2O2] = 0.8–2.9 mM, [NaHCO3] = 1.1–1.6 mM, and [dye] = 12.0–21.0 mg/L. At an average dye concentration (17.5 mg/L) and H2O2/NaHCO3 molar ratio of 1.28, the highest color removal (>97.67%) is achieved. Maximum TN removal was obtained for [dye] = 16.5–29.0 mg/L, with high H2O2 concentrations (2.2–4.6 mM) and [NaHCO3] in the study range, since the ANOVA showed that the latter variable was non-significant. TC removals were low in all tests, and the zone of maximum mineralization was obtained at [dye] = 23–28 mg/L, [H2O2] = 1.7–3.6 mM and [NaHCO3] = 1.2–1.5 mM. The highest TC removal (18.6%) was obtained with a H2O2/NaHCO3 molar ratio of 2.14.
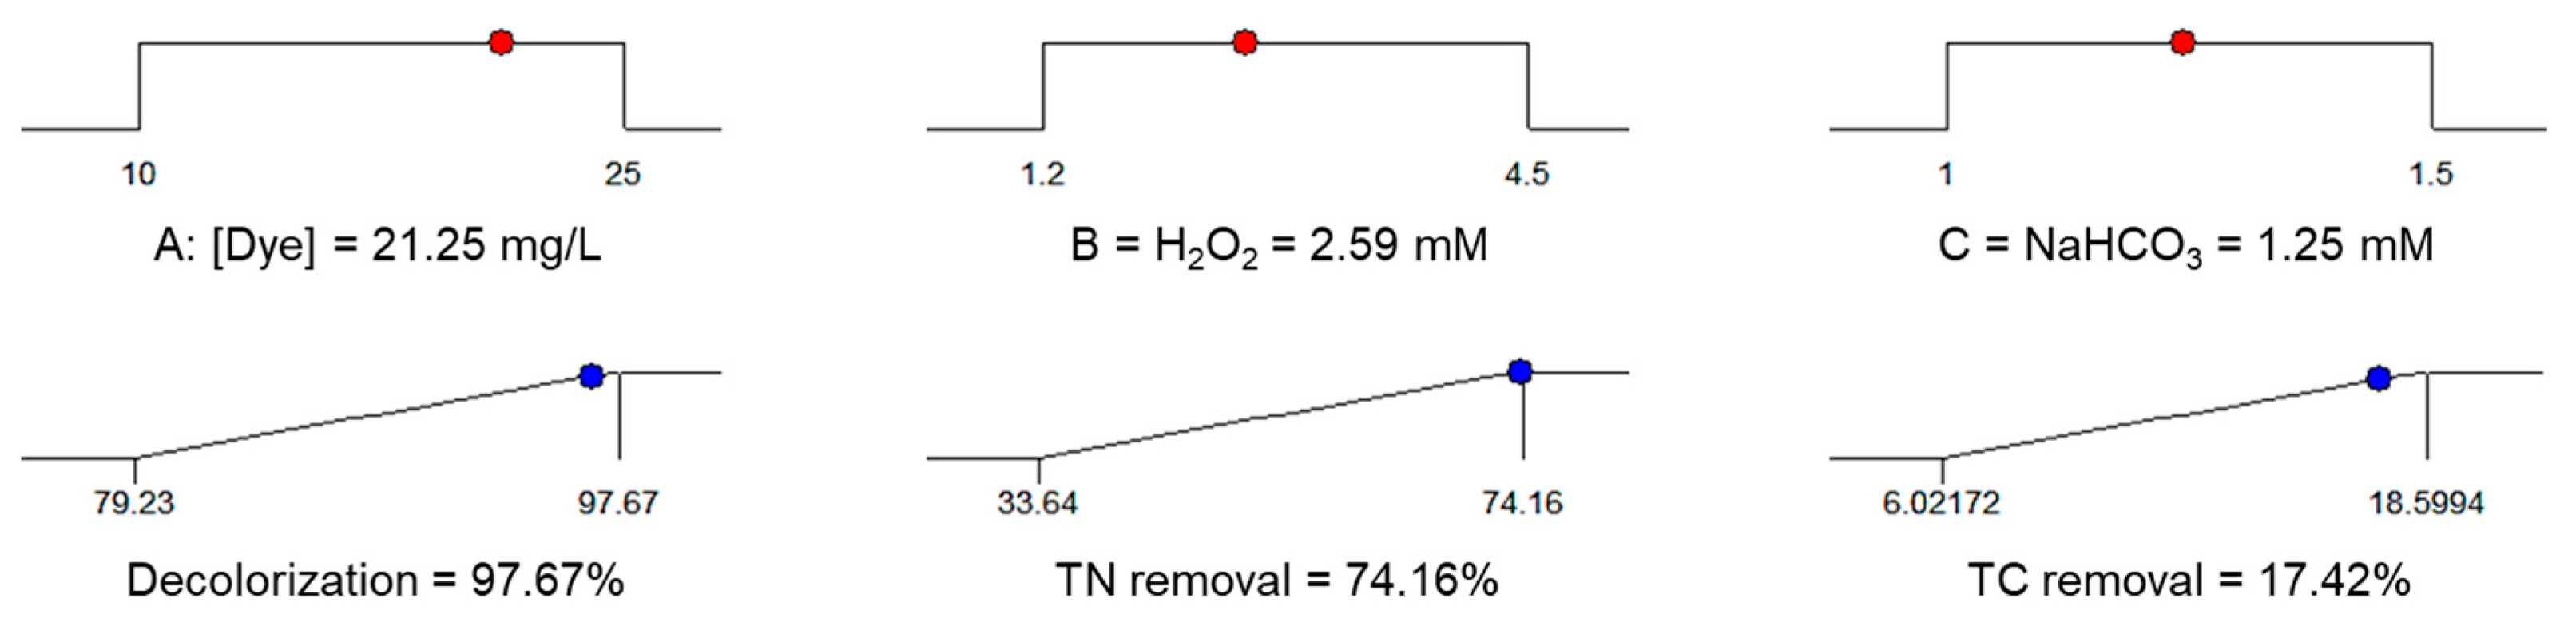
For the multi-objective optimization of the process, the criteria considered were the “maximization” of decolorization and TC and NT removals, keeping the concentrations of reagents (dye, H2O2, and NaHCO3) “in the range studied”. Figure 5 shows the graphical result of the optimization with a desirability of 0.95, as well as values of independent variables and response variables to the conditions described.
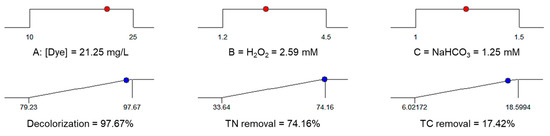
Figure 5.
Desirability ramp for numerical optimization.
The amount of H2O2 used in the mineralization of the dye can be expressed as a function of the stoichiometric dose (SD) required to completely oxidize one mole of Allura Red AC to CO2, H2O, and sulfate and nitrate as pre-eminent ions according to Equation (7) [26,53]:
For the multi-objective optimization conditions, 28.7% excess of the amount of H2O2 required according to Equation (7) for complete dye oxidation was used, and only 17.42% TC removal was obtained, suggesting a complex oxidation mechanism and the presence of reaction intermediates. Furthermore, the high TN removal suggests that most nitrogenous compounds were either converted to volatile N-products, like N2 and NxOy [53,54,55], or liberated as NH4+, given the basic pH of the BAP reaction.
To verify the results obtained with the mathematical models presented in Equations (4)–(6), additional oxidation tests were carried out under the same conditions in which the models were obtained. As can be observed from Table 9 results, the absolute errors for the response variables’ experimental and predicted values were less than 8.0% for each of the evaluated points. Therefore, the obtained models can predict the system’s response with minimum variations.
Table 9.
Comparison of predicted and experimental results. Points of validation of the experimental design.
The use of heterogeneous catalysts in the BAP system is an alternative to reduce the leaching of metal ions in water treatment [16]. Similar results have been obtained for other heterogeneous catalysts, and Table 10 shows a summary of various dye degradation conditions with the BAP system and catalysts with active cobalt phase.
Table 10.
Summary of the conditions and results in water treatment with the heterogeneous BAP system.
Although the decolorization achieved with the heterogeneous BAP system is high, the mineralization levels have been low [14,15,25]. An alternative to obtain an efficient system (total decolorization and high mineralization) is the combination of different treatment systems. Usually, AOPs are used to improve biodegradability, while a subsequent biological treatment increases the final degradation [23]; therefore, the coupling of both processes considerably enhances the degradation of the pollutants.
Cobalt leaching from the catalyst to the final reaction was quantified by atomic absorption spectrometry (Thermo Scientific iCE 3000). A cobalt concentration of less than 0.01 mg/L was obtained in all tests, indicating a high stability of the active phase in the reaction medium. Under conditions of multi-objective optimization, a high removal of total nitrogen (about 73%) associated with volatile nitrogenated products (N2 and NxOy) was obtained, which has been detected in oxidation with other azo dyes [56,57].
3.3. Chromatographic Analysis of Reaction By-Products
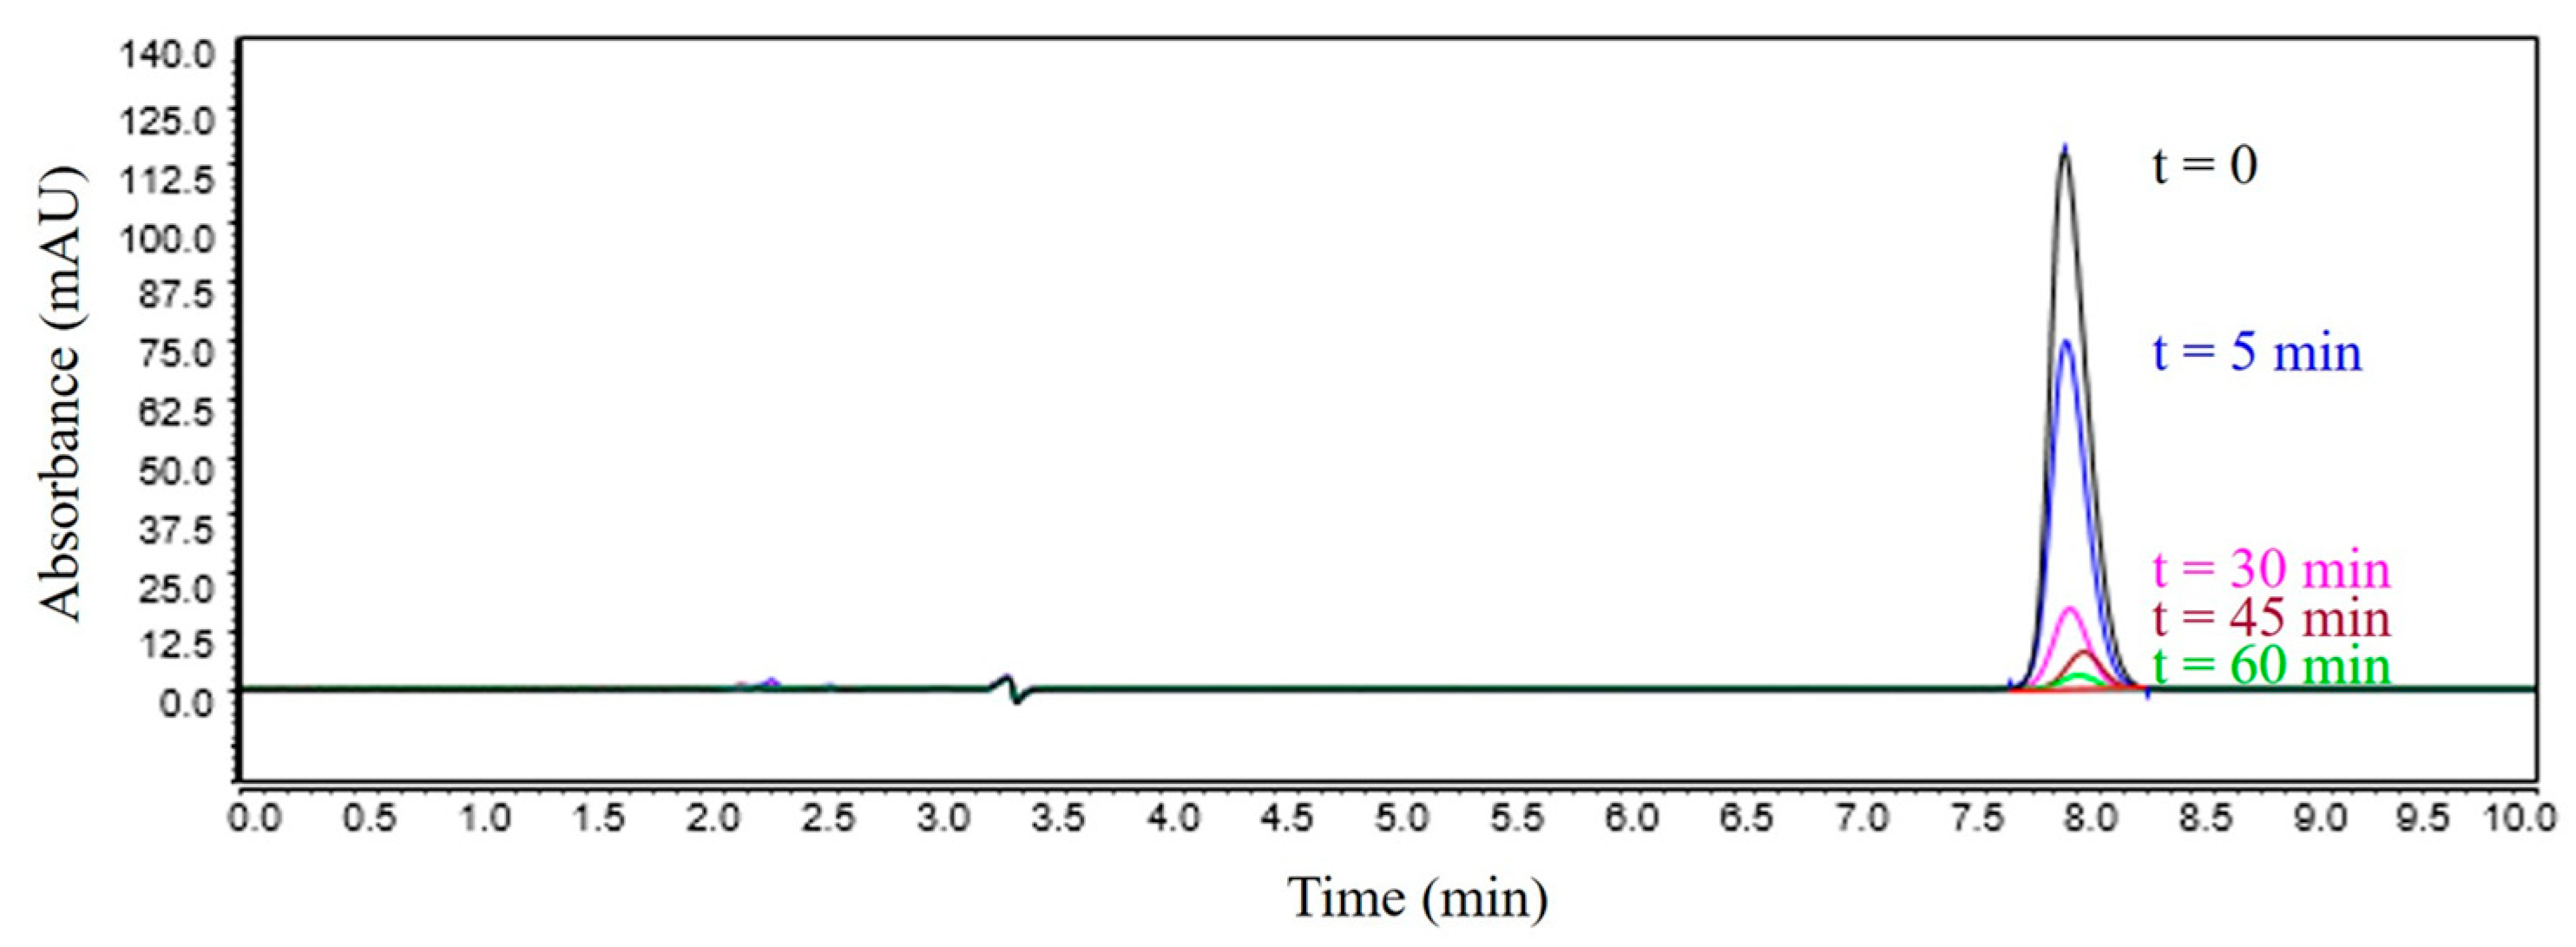
The monitoring of the AR–AC concentration during the oxidation reaction is presented in Figure 6. Chromatograms show a well-defined peak at a retention time of 7.96 min, corresponding to the dye. The reduction in the intensity of this peak arises from the degradation of the AR–AC. At 30 and 60 min of reaction, the degradation of the dye was greater than 80 and 95%, respectively. At 120 min of reaction, the AR–AC was not detected, demonstrating the effectiveness of the dye degradation with the Co(1.0%)/Al–PILC catalyzed-BAP system.
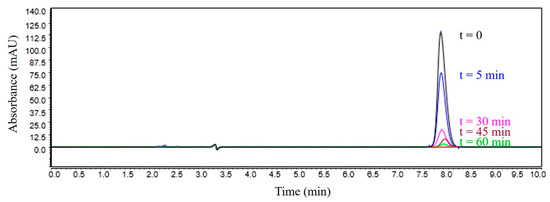
Figure 6.
Monitoring by HPLC of Allura Red AC dye during the oxidation reaction under optimal conditions. Conditions: [Dye] = 21.25 mg/L, [H2O2] = 2.59 mM, [NaHCO3] = 1.25 mM, catalyst dose = 2 g/L, T = 298 ± 0.2 K, stirring speed = 250 rpm.
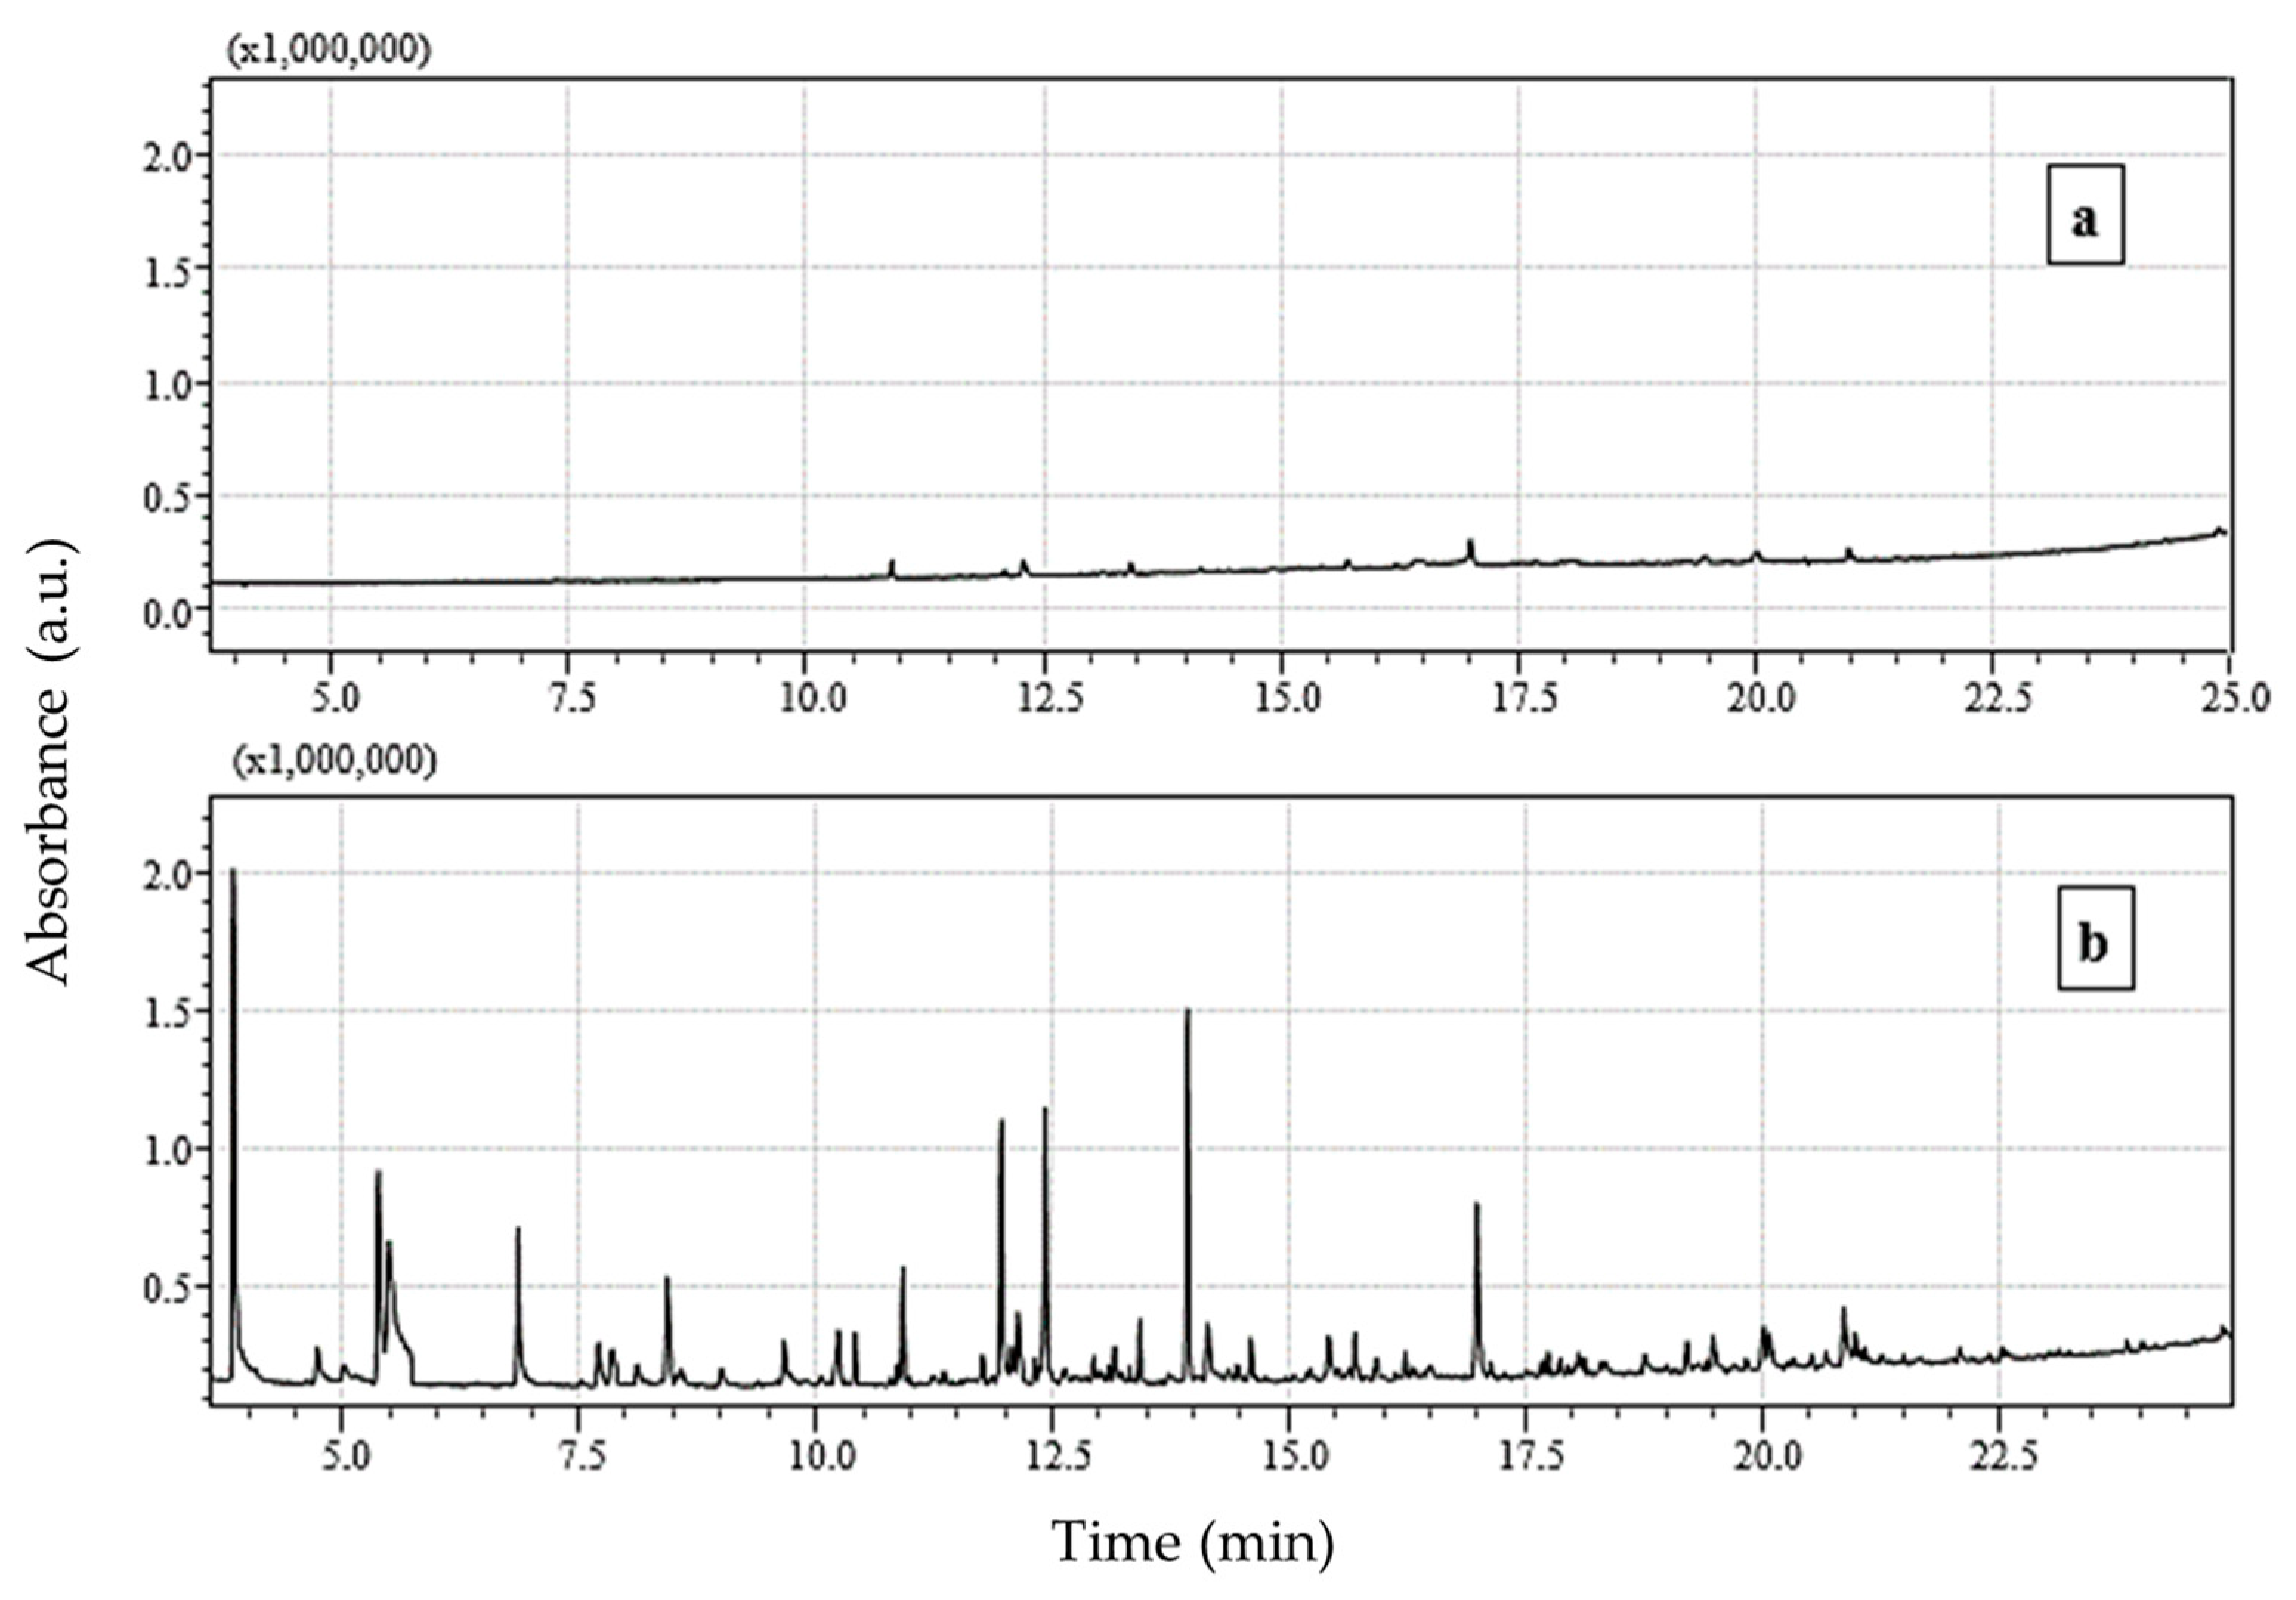
GC–MS was used to identify the aromatic intermediates of the oxidation of AR–AC under the optimal reaction conditions. Figure 7 shows the chromatograms obtained from the SPME extraction process at the beginning (t = 0, Figure 7a) and after 60 min of reaction (Figure 7b). The peaks that appear after 60 min of reaction correspond to the aromatic by-products generated during the oxidation of AR–AC. These compounds were preliminarily identified from their mass fragments (m/z) by comparison with the NIST 2010 library (Table 11). Aromatic by-products can be produced by cleavage of the –N=N– or C–N bonds in the dye molecule due to attack by reactive oxygen species. C–N cleavage between the azo group and the benzene group can generate hydroxylations at various positions of the aromatic ring, generating intermediate compounds with m/z = 148 and m/z = 150. Likewise, transformations to –COOH and –COR groups (m/z = 194, m/z = 150) can be perceived. Cleavage of the –N=N– bond can also occur, which can generate nitrogenous derivatives (m/z = 151) along with oxidation reactions and heterocycle formation (m/z = 156) [56]. The large variety of aromatic compounds suggests the complexity of the degradation process of AR–AC. A total of seven aromatic by-products were identified.
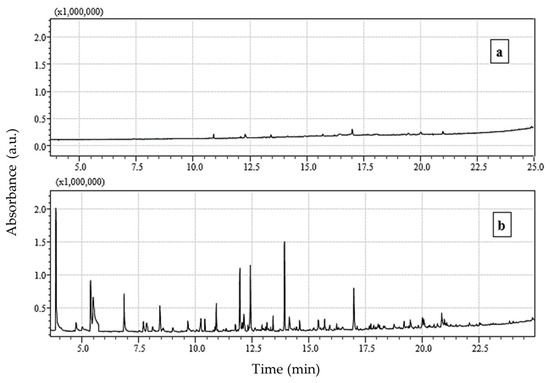
Figure 7.
GC–MS analysis of aromatic by-products of dye oxidation: (a) t = 0 and (b) t = 60 min.
Table 11.
Aromatic by-products formed during the degradation of AR–AC.
The identification of the carboxylic acids formed during the degradation of AR–AC under optimal oxidation conditions was carried out by HPLC (Figure 8). In the first 30 min of the reaction, short-chain acids such as maleic and oxalic acids were identified, and a similar result was reported by Zhou et al. [58].
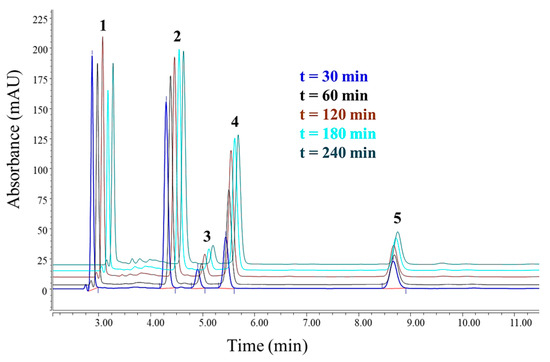
Figure 8.
HPLC analysis of carboxylic acids formed during the oxidation of AR–AC.
4. Conclusions
The results of the characterization of materials confirmed the modification of bentonite via pillaring. Cobalt impregnation in Al–PILC decreased the catalyst’s specific surface area by 38.6%. The absence in the XRD pattern of typical cobalt oxide signals indicated that the cobalt species were amorphous or dispersed throughout the support.
The effects of reagent concentrations on the dye degradation, using Co(1.0%)/Al–PILC as the catalyst, were evaluated using CCD-RSM. ANOVA evaluated the effect of each independent variable on the response functions, and the results showed that H2O2 concentration was the most significant in decolorization and dye concentration was the most significant in TN and TC removals. Since HCO3– is an activator of H2O2 in oxidation reactions, the H2O2-NaHCO3 interaction positively affected the equations representing the three response variables.
Under multi-objective optimization conditions (21.25 mg/L dye, 2.59 mM H2O2, and 1.25 mM NaHCO3), it was possible to achieve a decolorization greater than 99.43% and TN and TC removals of 72.82 and 18.74%, respectively, with the advantage of showing cobalt leaching lower than 0.01 mg/L.
Chromatographic analysis (GC–MS and HPLC) supported the oxidation of the Allura Red AC, as well as the formation of aromatic by-products and low molecular weight carboxylic acids. The oxidation of AR–AC using cobalt impregnated in an aluminum-pillared bentonite as the catalyst (Co/Al–PILC) of the BAP system proved to be an effective technology for the degradation and partial mineralization of aqueous solutions containing this dye.
Author Contributions
Conceptualization, I.F.M.-Q., J.A.C.-C. and N.R.S.-G.; methodology, N.M.-G., C.G.-L., I.F.M.-Q., J.D.R.-G., J.A.C.-C. and N.R.S.-G.; software, N.M.-G., C.G.-L., I.F.M.-Q. and J.D.R.-G.; validation, N.M.-G., C.G.-L. and I.F.M.-Q.; formal analysis, N.M.-G., C.G.-L., I.F.M.-Q., J.D.R.-G., J.A.C.-C. and N.R.S.-G.; investigation, N.M.-G., C.G.-L., I.F.M.-Q., J.D.R.-G., J.A.C.-C. and N.R.S.-G.; resources, J.A.C.-C. and N.R.S.-G.; writing—original draft preparation, N.M.-G., I.F.M.-Q., J.D.R.-G., J.A.C.-C. and N.R.S.-G.; writing—review and editing, N.R.S.-G. and J.A.C.-C. All authors have read and agreed to the published version of the manuscript.
Funding
This study was partially funded by the Universidad Nacional de Colombia Sede Manizales—Universidad de Caldas, through the Hermes projects code 49298 and 46681.
Data Availability Statement
The data used to support the conclusions of this study are included in the article.
Acknowledgments
The authors acknowledge the Universidad Nacional de Colombia Sede Manizales and Universidad de Caldas for supporting this research.
Conflicts of Interest
The authors declare no conflicts of interest.
References
- Alalewi, A.; Jiang, C. Bacterial influence on textile wastewater decolorization. J. Environ. Prot. 2012, 3, 889–903. [Google Scholar] [CrossRef]
- Thiam, A.; Sirés, I.; Brillas, E. Treatment of a mixture of food color additives (E122, E124 and E129) in different water matrices by UVA and solar photoelectro-Fenton. Water Res. 2015, 81, 178–187. [Google Scholar] [CrossRef]
- Solís, M.; Solís, A.; Pérez, H.I.; Manjarrez, N.; Flores, M. Microbial decolouration of azo dyes: A review. Process Biochem. 2012, 47, 1723–1748. [Google Scholar] [CrossRef]
- Brillas, E.; Martínez-Huitle, C.A. Decontamination of wastewaters containing synthetic organic dyes by electrochemical methods. An updated review. Appl. Catal. B Envrion. 2015, 166–167, 603–643. [Google Scholar] [CrossRef]
- Paszczynski, A.; Pasti-Grigsby, M.B.; Goszczynski, S.; Crawford, R.L.; Crawford, D.L. Mineralization of sulfonated azo dyes and sulfanilic acid by Phanerochaete chrysosporium and Streptomyces chromofuscus. Appl. Environ. Microbiol. 1992, 58, 3598–3604. [Google Scholar] [CrossRef]
- Papić, S.; Koprivanac, N.; Bozić, A.L.; Vujević, D.; Dragicević, S.K.; Kusić, H.; Peternel, I. Advanced oxidation processes in azo dye wastewater treatment. Water Environ. Res. 2006, 78, 572–579. [Google Scholar] [CrossRef]
- Kusic, H.; Juretic, D.; Koprivanac, N.; Marin, V.; Božić, A.L. Photooxidation processes for an azo dye in aqueous media: Modeling of degradation kinetic and ecological parameters evaluation. J. Hazard. Mater. 2011, 185, 1558–1568. [Google Scholar] [CrossRef]
- Lellis, B.; Fávaro-Polonio, C.Z.; Pamphile, J.A.; Polonio, J.C. Effects of textile dyes on health and the environment and bioremediation potential of living organisms. Biotechnol. Res. Innov. 2019, 3, 275–290. [Google Scholar] [CrossRef]
- Saharan, V.K.; Pinjari, D.V.; Gogate, P.R.; Pandit, A.B. Chapter 3—Advanced Oxidation Technologies for Wastewater Treatment: An Overview. In Industrial Wastewater Treatment, Recycling and Reuse; Ranade, V.V., Bhandari, V.M., Eds.; Elsevier: Oxford, UK, 2014; pp. 141–191. [Google Scholar]
- Farooque Lanjwani, M.; Tuzen, M.; Yar Khuhawar, M.; Saleh, T.A. Trends in photocatalytic degradation of organic dye pollutants using nanoparticles: A Review. Inorg. Chem. Commun. 2024, 159, 111613. [Google Scholar] [CrossRef]
- Martínez-Huitle, C.A.; Brillas, E. Decontamination of wastewaters containing synthetic organic dyes by electrochemical methods: A general review. Appl. Catal. B Envrion. 2009, 87, 105–145. [Google Scholar] [CrossRef]
- Guo, H.; Pan, S.; Hu, Z.; Wang, Y.; Jiang, W.; Yang, Y.; Wang, Y.; Han, J.; Wu, Y.; Wang, T. Persulfate activated by non-thermal plasma for organic pollutants degradation: A review. Chem. Eng. J. 2023, 470, 144094. [Google Scholar] [CrossRef]
- Ramos, M.D.N.; Santana, C.S.; Velloso, C.C.V.; da Silva, A.H.M.; Magalhães, F.; Aguiar, A. A review on the treatment of textile industry effluents through Fenton processes. Process Saf. Environ. Prot. 2021, 155, 366–386. [Google Scholar] [CrossRef]
- Guo, X.; Li, H.; Zhao, S. Fast degradation of Acid Orange II by bicarbonate-activated hydrogen peroxide with a magnetic S-modified CoFe2O4 catalyst. J. Taiwan Inst. Chem. Eng. 2015, 55, 90–100. [Google Scholar] [CrossRef]
- Macías-Quiroga, I.F.; Pérez-Flórez, A.; Arcila, J.S.; Giraldo-Goméz, G.I.; Sanabria-Gonzalez, N.R. Synthesis and characterization of Co/Al-PILCs for the oxidation of an azo dye using the bicarbonate-activated hydrogen peroxide system. Catal. Lett. 2022, 152, 1905–1916. [Google Scholar] [CrossRef]
- Pan, H.; Gao, Y.; Li, N.; Zhou, Y.; Lin, Q.; Jiang, J. Recent advances in bicarbonate-activated hydrogen peroxide system for water treatment. Chem. Eng. J. 2021, 408, 127332. [Google Scholar] [CrossRef]
- Jawad, A.; Li, Y.; Lu, X.; Chen, Z.; Liu, W.; Yin, G. Controlled leaching with prolonged activity for Co–LDH supported catalyst during treatment of organic dyes using bicarbonate activation of hydrogen peroxide. J. Hazard. Mater. 2015, 289, 165–173. [Google Scholar] [CrossRef]
- Long, X.; Yang, Z.; Wang, H.; Chen, M.; Peng, K.; Zeng, Q.; Xu, A. Selective degradation of orange II with the cobalt(II)–bicarbonate–hydrogen peroxide system. Ind. Eng. Chem. Res. 2012, 51, 11998–12003. [Google Scholar] [CrossRef]
- Xu, A.; Li, X.; Ye, S.; Yin, G.; Zeng, Q. Catalyzed oxidative degradation of methylene blue by in situ generated cobalt (II)-bicarbonate complexes with hydrogen peroxide. Appl. Catal. B Envrion. 2011, 102, 37–43. [Google Scholar] [CrossRef]
- Li, Y.; Li, L.; Chen, Z.-X.; Zhang, J.; Gong, L.; Wang, Y.-X.; Zhao, H.-Q.; Mu, Y. Carbonate-activated hydrogen peroxide oxidation process for azo dye decolorization: Process, kinetics, and mechanisms. Chemosphere 2018, 192, 372–378. [Google Scholar] [CrossRef]
- Richardson, D.E.; Yao, H.; Frank, K.M.; Bennett, D.A. Equilibria, kinetics, and mechanism in the bicarbonate activation of hydrogen peroxide: MaciOxidation of sulfides by peroxymonocarbonate. J. Am. Chem. Soc. 2000, 122, 1729–1739. [Google Scholar] [CrossRef]
- Lin, J.-M.; Liu, M. Singlet oxygen generated from the decomposition of peroxymonocarbonate and its observation with chemiluminescence method. Spectrochim. Acta A Mol. Biomol. Spectrosc. 2009, 72, 126–132. [Google Scholar] [CrossRef]
- Yang, Z.; Wang, H.; Chen, M.; Luo, M.; Xia, D.; Xu, A.; Zeng, Q. Fast degradation and biodegradability improvement of reactive brilliant red X-3B by the cobalt(II)/bicarbonate/hydrogen peroxide system. Ind. Eng. Chem. Res. 2012, 51, 11104–11111. [Google Scholar] [CrossRef]
- Zhou, L.; Song, W.; Chen, Z.; Yin, G. Degradation of organic pollutants in wastewater by bicarbonate-activated hydrogen peroxide with a supported cobalt catalyst. Environ. Sci. Technol. 2013, 47, 3833–3839. [Google Scholar] [CrossRef]
- Duan, L.; Chen, Y.; Zhang, K.; Luo, H.; Huang, J.; Xu, A. Catalytic degradation of acid orange 7 with hydrogen peroxide using CoxOy-N/GAC catalysts in a bicarbonate aqueous solution. RSC Adv. 2015, 5, 84303–84310. [Google Scholar] [CrossRef]
- Mora-Bonilla, K.Y.; Macías-Quiroga, I.F.; Sanabria-González, N.R.; Dávila-Arias, M.T. Bicarbonate-activated hydrogen peroxide for an azo dye degradation: Experimental design. ChemEngineering 2023, 7, 86. [Google Scholar] [CrossRef]
- Macías-Quiroga, I.F.; Giraldo-Gómez, G.I.; Sanabria-González, N.R. Characterization of Colombian clay and its potential use as adsorbent. Sci. World J. 2018, 2018, 5969178. [Google Scholar] [CrossRef]
- Carriazo, J.G.; Guelou, E.; Barrault, J.; Tatibouët, J.M.; Moreno, S. Catalytic wet peroxide oxidation of phenol over Al–Cu or Al–Fe modified clays. Appl. Clay Sci. 2003, 22, 303–308. [Google Scholar] [CrossRef]
- Cañizares, P.; Valverde, J.L.; Sun Kou, M.R.; Molina, C.B. Synthesis and characterization of PILCs with single and mixed oxide pillars prepared from two different bentonites. A comparative study. Microporous Mesoporous Mater. 1999, 29, 267–281. [Google Scholar] [CrossRef]
- Gregg, S.J.; Sing, K.S.W. Adsorption, Surface Area and Porosity, 2nd ed.; Academic Press: London, UK, 1982; pp. 41–61. [Google Scholar]
- Harkins, W.D.; Jura, G. Surfaces of solids. XIII. A vapor adsorption method for the determination of the area of a solid without the assumption of a molecular area, and the areas occupied by nitrogen and other molecules on the surface of a solid. J. Am. Chem. Soc. 1944, 66, 1366–1373. [Google Scholar] [CrossRef]
- Horvath, G.; Kawazoe, K. Method for the calculation of effective pore size distribution in molecular sieve carbon. J. Chem. Eng. Jpn. 1983, 16, 470–475. [Google Scholar] [CrossRef]
- Guechi, E.-K.; Hamdaoui, O. Biosorption of methylene blue from aqueous solution by potato (Solanum tuberosum) peel: Equilibrium modelling, kinetic, and thermodynamic studies. Desalin. Water Treat. 2016, 57, 10270–10285. [Google Scholar] [CrossRef]
- Leone, V.O.; Pereira, M.C.; Aquino, S.F.; Oliveira, L.C.A.; Correa, S.; Ramalho, T.C.; Gurgel, L.V.A.; Silva, A.C. Adsorption of diclofenac on a magnetic adsorbent based on maghemite: Experimental and theoretical studies. New J. Chem. 2018, 42, 437–449. [Google Scholar] [CrossRef]
- Gosetti, F.; Chiuminatto, U.; Mazzucco, E.; Calabrese, G.; Gennaro, M.C.; Marengo, E. Identification of photodegradation products of allura red AC (E129) in a beverage by ultra high performance liquid chromatography–quadrupole-time-of-flight mass spectrometry. Catal. Today 2012, 746, 84–89. [Google Scholar] [CrossRef]
- Sivrikaya, O.; Uzal, B.; Ozturk, Y.E. Practical charts to identify the predominant clay mineral based on oxide composition of clayey soils. Appl. Clay Sci. 2017, 135, 532–537. [Google Scholar] [CrossRef]
- Ramsey, M.H.; Potts, P.J.; Webb, P.C.; Watkins, P.; Watson, J.S.; Coles, B.J. An objective assessment of analytical method precision: Comparison of ICP-AES and XRF for the analysis of silicate rocks. Chem. Geol. 1995, 124, 1–19. [Google Scholar] [CrossRef]
- Occelli, M.L.; Bertrand, J.A.; Gould, S.A.C.; Dominguez, J.M. Physicochemical characterization of a Texas montmorillonite pillared with polyoxocations of aluminum: Part I: The microporous structure. Microporous Mesoporous Mater. 2000, 34, 195–206. [Google Scholar] [CrossRef]
- Marković, M.; Marinović, S.; Mudrinić, T.; Ajduković, M.; Jović-Jovičić, N.; Mojović, Z.; Orlić, J.; Milutinović-Nikolić, A.; Banković, P. Co(II) impregnated Al(III)-pillared montmorillonite—Synthesis, characterization and catalytic properties in Oxone® activation for dye degradation. Appl. Clay Sci. 2019, 182, 105276. [Google Scholar] [CrossRef]
- Milovanović, B.; Marinović, S.; Vuković, Z.; Milutinović-Nikolić, A.; Petrović, R.; Banković, P.; Mudrinić, T. The influence of cobalt loading on electrocatalytic performance toward glucose oxidation of pillared montmorillonite-supported cobalt. J. Electroanal. Chem. 2022, 915, 116332. [Google Scholar] [CrossRef]
- Thommes, M.; Kaneko, K.; Neimark, A.V.; Olivier, J.P.; Rodriguez-Reinoso, F.; Rouquerol, J.; Sing, K.S.W. Physisorption of gases, with special reference to the evaluation of surface area and pore size distribution (IUPAC Technical Report). Pure Appl. Chem. 2015, 87, 1051–1069. [Google Scholar] [CrossRef]
- Vicente, M.A.; Belver, C.; Trujillano, R.; Rives, V.; Álvarez, A.C.; Lambert, J.F.; Korili, S.A.; Gandía, L.M.; Gil, A. Preparation and characterisation of Mn- and Co-supported catalysts derived from Al-pillared clays and Mn- and Co-complexes. Appl. Catal. A Gen. 2004, 267, 47–58. [Google Scholar] [CrossRef]
- Colín L, J.A.; de los Reyes, J.A.; Vázquez, A.; Montoya, A. Pillar effects in MoS2 catalysts supported on Al and Zr pillared clays in a hydrotreatment reaction: A preliminary study. Appl. Surf. Sci. 2005, 240, 48–62. [Google Scholar] [CrossRef]
- Vicente, M.A.; Lambert, J.-F. Synthesis of Pt pillared clay nanocomposite catalysts from [PtII(NH3)4]Cl2 precursor. Phys. Chem. Chem. Phys. 2001, 3, 4843–4852. [Google Scholar] [CrossRef]
- Carriazo, J.G.; Molina, R.; Moreno, S. Fractal dimension and energetic heterogeneity of gold-modified Al–Fe–Ce pilc’s. Appl. Surf. Sci. 2008, 255, 3354–3360. [Google Scholar] [CrossRef]
- Gil, A.; Montes, M. Analysis of the microporosity in pillared clays. Langmuir 1994, 10, 291–297. [Google Scholar] [CrossRef]
- Aguiar, J.E.; Bezerra, B.T.C.; Siqueira, A.C.A.; Barrera, D.; Sapag, K.; Azevedo, D.C.S.; Lucena, S.M.P.; Silva, I.J. Improvement in the adsorption of anionic and cationic dyes from aqueous solutions: A comparative study using aluminium pillared clays and activated carbon. Sep. Sci. Technol. 2014, 49, 741–751. [Google Scholar] [CrossRef]
- Ramírez, M.J.; Giraldo, G.I.; Orrego, C.E. Modeling and stability of polyphenol in spray-dried and freeze-dried fruit encapsulates. Powder Technol. 2015, 277, 89–96. [Google Scholar] [CrossRef]
- Kanafin, Y.N.; Abdirova, P.; Kanafina, D.; Arkhangelsky, E.; Kyzas, G.Z.; Poulopoulos, S.G. UV and zero-valent iron (ZVI) activated continuous flow persulfate oxidation of municipal wastewater. Catalysts 2023, 13, 25. [Google Scholar] [CrossRef]
- Samarghandi, M.R.; Dargahi, A.; Shabanloo, A.; Nasab, H.Z.; Vaziri, Y.; Ansari, A. Electrochemical degradation of methylene blue dye using a graphite doped PbO2 anode: Optimization of operational parameters, degradation pathway and improving the biodegradability of textile wastewater. Arab. J. Chem. 2020, 13, 6847–6864. [Google Scholar] [CrossRef]
- Ravikumar, K.; Deebika, B.; Balu, K. Decolourization of aqueous dye solutions by a novel adsorbent: Application of statistical designs and surface plots for the optimization and regression analysis. J. Hazard. Mater. 2005, 122, 75–83. [Google Scholar] [CrossRef]
- Roudi, A.M.; Salem, S.; Abedini, M.; Maslahati, A.; Imran, M. Response surface methodology (RSM)-based prediction and optimization of the Fenton process in landfill leachate decolorization. Processes 2021, 9, 2284. [Google Scholar] [CrossRef]
- Thiam, A.; Sirés, I.; Centellas, F.; Cabot, P.L.; Brillas, E. Decolorization and mineralization of Allura Red AC azo dye by solar photoelectro-Fenton: Identification of intermediates. Chemosphere 2015, 136, 1–8. [Google Scholar] [CrossRef] [PubMed]
- Ruiz, E.J.; Hernández-Ramírez, A.; Peralta-Hernández, J.M.; Arias, C.; Brillas, E. Application of solar photoelectro-Fenton technology to azo dyes mineralization: Effect of current density, Fe2+ and dye concentrations. Chem. Eng. J. 2011, 171, 385–392. [Google Scholar] [CrossRef]
- Thiam, A.; Sirés, I.; Garrido, J.A.; Rodríguez, R.M.; Brillas, E. Decolorization and mineralization of Allura Red AC aqueous solutions by electrochemical advanced oxidation processes. J. Hazard. Mater. 2015, 290, 34–42. [Google Scholar] [CrossRef] [PubMed]
- Thiam, A.; Brillas, E.; Garrido, J.A.; Rodríguez, R.M.; Sirés, I. Routes for the electrochemical degradation of the artificial food azo-colour Ponceau 4R by advanced oxidation processes. Appl. Catal. B Envrion. 2016, 180, 227–236. [Google Scholar] [CrossRef]
- Thiam, A.; Sirés, I.; Garrido, J.A.; Rodríguez, R.M.; Brillas, E. Effect of anions on electrochemical degradation of azo dye carmoisine (acid red 14) using a BDD anode and air-diffusion cathode. Sep. Purif. Technol. 2015, 140, 43–52. [Google Scholar] [CrossRef]
- Zhou, Z.; Liang, Z.; Liu, Y.; Ma, Y.; Zhu, X.; Zhang, X.; Li, Q.; Ren, Z. Intensification of degradation of sunset yellow using packed bed in a pulsed high-voltage hybrid gas-liquid discharge system: Optimization of operating parameters, degradation mechanism and pathways. Chem. Eng. Process Process Intensif. 2017, 115, 23–33. [Google Scholar] [CrossRef]


Disclaimer/Publisher’s Note: The statements, opinions and data contained in all publications are solely those of the individual author(s) and contributor(s) and not of MDPI and/or the editor(s). MDPI and/or the editor(s) disclaim responsibility for any injury to people or property resulting from any ideas, methods, instructions or products referred to in the content. |
© 2024 by the authors. Licensee MDPI, Basel, Switzerland. This article is an open access article distributed under the terms and conditions of the Creative Commons Attribution (CC BY) license (https://creativecommons.org/licenses/by/4.0/).