Article

TAS2R Receptor Response Helps Design New Antimicrobial Molecules for the 21st Century

Advanced Computational Sciences Department, Bartanel Discovery, Turnhoutsebaan 139 A, 2140 Antwerp, Belgium
ChemEngineering 2024, 8(5), 96; https://doi.org/10.3390/chemengineering8050096
Submission received: 14 May 2024 / Revised: 3 September 2024 / Accepted: 20 September 2024 / Published: 26 September 2024

Abstract

:
Artificial intelligence (AI) requires the provision of learnable data to successfully deliver requisite prediction power. In this article, it is demonstrable that standard physico-chemical parameters, while useful, are insufficient for the development of powerful antimicrobial prediction algorithms. Initial models that focussed solely on the values extractable from the knowledge on electrotopological, structural and constitutional descriptors did not meet the acceptance criteria for classifying antimicrobial activity. In contrast, efforts to conceptually define the diametric opposite of an antimicrobial compound helped to advance the predicted category as a learnable trait. Remarkably, the inclusion of ligand–receptor interactions using the ability of the molecules to stimulate transmembrane TAS2Rs receptor helped to increase the ability to distinguish the antimicrobial molecules from the inactive ones, confirming the hypothesis of a predictor–predicted synergy behind bitterness psychophysics and antimicrobial activity. Therefore, in a single bio–endogenic psychophysical vector representation, this manuscript helps demonstrate the contribution to parametrization and the identification of relevant chemical manifolds for molecular design and (re-)engineering. This novel approach to the development of AI models accelerated molecular design and facilitated the selection of newer, more powerful antimicrobial agents. This is especially valuable in an age where antimicrobial resistance could be ruinous to modern health systems.

1. Introduction

Quantitative structure–activity relationship (QSAR) models are essential tools for drug development because they can be used to assess large chemical libraries in the hunt for new antimicrobials. However, for chemical antimicrobials, one of the strongest challenges to this approach is the rarity of powerful antimicrobials in the vast chemical spaces that are the presumed relevant chemical spaces. If they were more abundant, the hunt for antimicrobials would be sooner met. This rarity means that structure and activity descriptors are often insufficient to describe the variability in the antimicrobial datasets.
Aside from the insufficiency of descriptors for the chemical space, the modelling dataset is often severely imbalanced. That is, of the two initial classes for categorizing the chemistries, one will be highly populated (the inactive class) while the other will be significantly diminished (the active class). This means that the problem is compounded since the many descriptors that require parametrization will now have to be learned only after oversampling for the minority class, while undersampling the majority class. Computing efficiencies and data restrictions prevent proper statistical matching during these popular balancing procedures. This learning method will result in less-than-stellar computing efficiencies and worse model metrics [1]. Additionally, during real-world usage, the model will run the risk of encountering unfamiliar chemical spaces, especially in the assignment of “active” antimicrobials.
Given the difficulty in the learning challenges posed by severe class imbalances, it may help to use descriptors that are sensitive and mechanistically sound. Parameters that quantify factors underlying molecular movement and interaction (surrogates for membrane traversal) might be helpful in identifying molecules that easily reach systemic circulation. However, there is a need to include rules that examine the ability for putative molecules to engage in flexible (ligand–receptor) binding as might be found in TAS2R receptors [2,3], well known for their polymorphism resulting in a “real life” variable shape and variform virtualized sensor with which to test potential target molecules.
A variform test to binding ability may be a more useful descriptor for antimicrobial activity. Effectively, a ligand’s psychophysical response to a candidate molecule encodes a molecular cypher whose contents relate a molecular key to physiologic aspects including toxicity and therapeutic effects [4,5,6]. Alternatively stated, TAS2R ligands may contain significantly greater subsets of molecules with antimicrobial effects, which subsets can subsequently evaluate for safety/toxicity signals. A measurement of the TAS2R-triggering capacity of the molecule may provide a mechanistic flavour within the AI model and it may enable the algorithm to better bridge across a training versus test set, while eliminating the need for a universal molecular embedding challenge.
TAS2Rs appear to have a ligand binding pocket involving residues on the third, fifth, sixth and seventh transmembrane domains. The third and seventh transmembrane domains appear to have the residues primarily responsible for the specificity and activation/reactivity within the empirically determined ligand-binding pocket [3,7]. The thirteen identified residues include L59A, V77A, C79R, L81A, T82A, I90T, S144L, N148S, A184V, W257R, L258V, W261G and E2626D [3]. The primary intermolecular interactions casting the broadest net across the diverse ligand families appear to include hydrogen bonding, hydrophobic (non-polar) interactions, non-covalent pi bonding, weak Vander Waals forces and ionic/electrostatic interactions between charged residues [8]. This extensively structural biosensing mechanism could be useful in mapping a viable enriched embedding space for describing a new generation of antimicrobials.
Historical medical anthropological studies may also provide evidence of the TAS2R receptors as evolutionary molecular cyphers, since bitter substances would elicit a learnable aversive response unless a therapeutic effect presented a large enough benefit to overcome the aversive barrier [9]. Additionally, the ability to titrate sub-toxic levels against therapeutic thresholds of a candidate TAS2R trigger species could explain the association between bitter cyanogens and observable subclinical parasitaemia in West African communities [9]. These pieces of evidence motivate the inclusion of a TAS2R response in the drug design workflow.
Ultimately, the use of synthetic antimicrobial TAS2R ligands may provide us with more powerful dual-action antimicrobials. TAS2R ligands are known to trigger the release of mammalian antimicrobial compounds, including peptides, that aid in the resolution of microbial infections [10,11]. Adding this effect to the direct microbicidal activity of the ligand will enhance the therapeutic effect of the molecule via synergy. Given that the TAS2R immune-activating antimicrobial effect works at micron-level thresholds [6], the effect of the treatment will also demonstrate an increased overall efficacy while maintaining pre-extant safety margins to guard against potential toxicity.
Using bitter synthetic antimicrobial compounds could also be justified by appealing to biomimetic design principles. It is known that endogenous antimicrobial compounds, such as short chain peptides (SCPs), have strongly discernible bitter qualities [12]. It is reasoned that this is in itself a duality of function, that is, the SCPs will first kill harmful microorganisms and, secondly, they will modulate the immune system [13].
The immune-activating properties of bitter compounds have also been identified in bacterial quorum-sensing molecules [14,15]. These bacterial quorum sensing molecules act in two ways: first, they enable the bacteria to repress its own virulence and, secondly, they improve the host’s survival through a variety of ways, including immune modulation [16]. This implies the existence of bitterness-sensing receptors in the bacteria and in the mammalian cells, likely as part of a long-running evolutionary arms race tending from virulence towards commensalism [16]. It is logical to conclude that TAS2R psychophysical predictor variable(s) could help map immune-activating chemistries onto an antimicrobial predicted variable.
Computationally, the psychophysical TAS2R response vector may help to embed the chemistry with the right biological projection. This is in contrast to numerous attempts at the development of a universal molecular embedder. Typical approaches that attempt to generate standard fingerprints (FP) run into intractable challenges, such as variability in the FP length [17]; limitations in the representational scope of the embedder [18] and increasing computing inefficiencies with increasing molecular complexity [18]. Using TAS2R response encoders helps alleviate these challenges all in a single bio–endogenic psychophysical vector representation that may help to parametrize and to identify relevant chemical manifolds for molecular design and (re-)engineering.
The dual-mechanism (immune trigger and antimicrobial activity) approaches may lessen the risk for antimicrobial resistance, but they do not eliminate antimicrobial resistance. The requirement to regulate usage in both human and veterinary medicine is necessary to ensure the durability of any next-generation antimicrobial drug’s efficacy. Additionally, the exploration of genetically primed phages to target known microbes at a subspecies level via personalized medicine may also help to increase the breadth of the medical armory against antimicrobial resistance [19].

2. Materials and Methods

2.1. Data Collection

Data were downloaded from an antimicrobial inhibition assay. The data were deposited on PubChem [20] as part of a screening assay by the Southern Research Molecular Libraries Screening Centre (SRMLSC). The assay uses E. coli BW25113tolC: Kan as the test organism. E. coli were exposed to the test compounds at a fixed 30 µM dose grown in 384-well plates with inhibition readings obtained from optical density measurements at 615 nm on an Envision® microplate reader (PerkinElmer, Waltham, 02451 MA, USA) [20]. The samples were read at the same concentration [20]. The dataset contains 65,120 compounds, with 2.18% being active and 97.82% being inactive. Only molecules with significantly high antimicrobial activity (>65% inhibition) were considered for the active class; in like manner, only molecules showing negligible antimicrobial activity (<35% inhibition) were included in the inactive class.

Preliminary Experimental Validation

Additional experimental testing has been run to verify the antimicrobial activity data. These tests are run against multiple measures before the final assignment to active/inactive classes. They include bactericidal/static testing, tests against bacterial strains with proven enzymatic resistance mechanisms and, lastly, tests across a panel of wild/lab-strains [20].

2.2. Model Development

SMILES Generation: Molecular SMILES were generated from chemical identifiers (CID) using a PubChem Database FTP service and then checked for consistency.
Variable Transformation: Molecular SMILES were read into R from an “SMI” file. The SMI object was used to generate parameters including octanol–water coefficients using atomic methods, atom molar refractivity (AMolR), tallies for acid groups, base groups and rotational bonds, the number of Lipinski failures and molecular weight. A bitterness index was generated using a primarily structure-based bitterness model [4]. Primary data for the development of the bitterness model were drawn from receptor thresholds using the calcium-signalling responses of hTAS2R-transfected (HEK)-293T cells [6].
Model Development: Using both the CDK descriptors and the bitterness index, a number of modelling approaches were attempted alongside grid-based hyperparameter optimization for the best metrics including AUCPR, AUC, mean per-class error, log loss and RMSE. These included distributed random forests (DRF), gradient boosted models (GBM) and stacked model ensembles. The stopping metric for model development was maximizing the area under curve on the precision-recall graph (AUCPR) for the validation set. In a later development, incoming data were statistically matched using the MatchIt package [21] and the number of Lipinski’s rules that were met as a matching factor. The matched data were subsequently used in a model building exercise as already described in this section.

3. Results and Discussion

3.1. Model Outcomes Meet Standard Quality Criteria

The model performance met the intended success criteria given the high proportions of true positives and true negatives, as shown in Table 1 (main diagonal values). Off-diagonal values (false positives and false negatives) are a significant minority, bringing in an overall error rate of 9% (bottom right corner).

3.2. Descriptor Contributions to the Model Development

The molecular structure was used to generate a range of mechanistic and binding-related structural factors to build the prediction model. These factors are divisible into these main areas: mass, hydrophobicity, electro-topological, binding and combinatorial representations. A summary of the descriptor choice is provided in Table 2.

3.3. Analysis of Variable Importance Underscores the Value of the Bitterness Index

In Figure 1, the variable importance plot shows the most influential variables in the model: polarizabilities (AMolR), partitioning indices (ALogp2, ALogP, XLogP), molar mass (MW) and binding/interactivity DoF (nRotB and nBase). These are mechanistic in nature, driving the activity of each member. Polarizability refers to the impact of an electric field on the separation of charges within the molecule as might be displayed during electric separation (barrier effects) by the cell membrane to electrostatically exclude negatively charged molecules. Partitioning indices also affect diffusion across the cell membrane driven by the hydrophilic–lipophilic balance. Molar mass affects molecular diffusion directly with larger molecules moving slower than small ones across the biomembrane. Lastly, the ability for the molecule to attain preferrable solvation and motion-free energies during the compartmental transition across the biomembrane is driven by molecular degrees of freedom (DF) for the biomembrane transition. These latter measures are composable into acid–base pairing and sub-molecular rotary motion. The bitterness index (bi) stands out in this non-stacked model, it being a psychophysical measure accounting for the ability of the molecule to trigger a TAS2R event. TAS2R are a family of known transmembrane receptors expressed extra-orally; TAS2R-activating molecules are known to have bacteriostatic and immunologic trigger effects [10,22].
The whole-model contributions in a variable importance plot do not indicate the row-wise and directional contributions for each factor; for the mean marginal, combinatorial, row-wise contributions (in addition to the global structural understanding), SHAP values are required [23]. In Figure 2, Shapley additive explanations (SHAP) values in the validation set show that the bitterness index (bi) is the most significant (topmost factor) and has negative contributions delineated from positive contributions. Additionally, high scalar bi values (red) are distinguished from the mid- and low-level values of the bitterness index. Molecular weight (MW) also shows a similar separation between low and high MW species. AMolR demonstrates clear centroids with molecules with low polarizabilities having a higher contribution to antimicrobial activity. Hydrophobicity measures demonstrate a head–tail morphology in their contributions between their column-specific normalizations typical of atomistic contribution models for partitioning. Acid–base counts are linked mechanistically according to the donation/reception of hydrogen ions during molecular interaction with only very high values demonstrating robust SHAP value contributions. Lipinski failures (LF) have very little contributions, which may point to the potential confoundedness of the variable (see Section 3.4.3). LF may rightly affect the antimicrobial activity from a design/selection perspective and, similarly, are affected by independent factors, such as molecular weight and binding/interactivity parameters. Hence, a de-confounding process may help to improve the model’s determinacy.

3.3.1. The Bitterness Index as a Watershed Differentiating Variable

By plotting the bitterness index against the antimicrobial classes, as shown in Figure 3, it is demonstrable that the feature separates neatly. Active compounds have significantly lower mean bitterness indices (center line connecting the two notches) overall than inactive ones. There are exceptions to this general rule (shown in the red “cross” outliers), which may indicate that the classification challenge is a multivariate one.
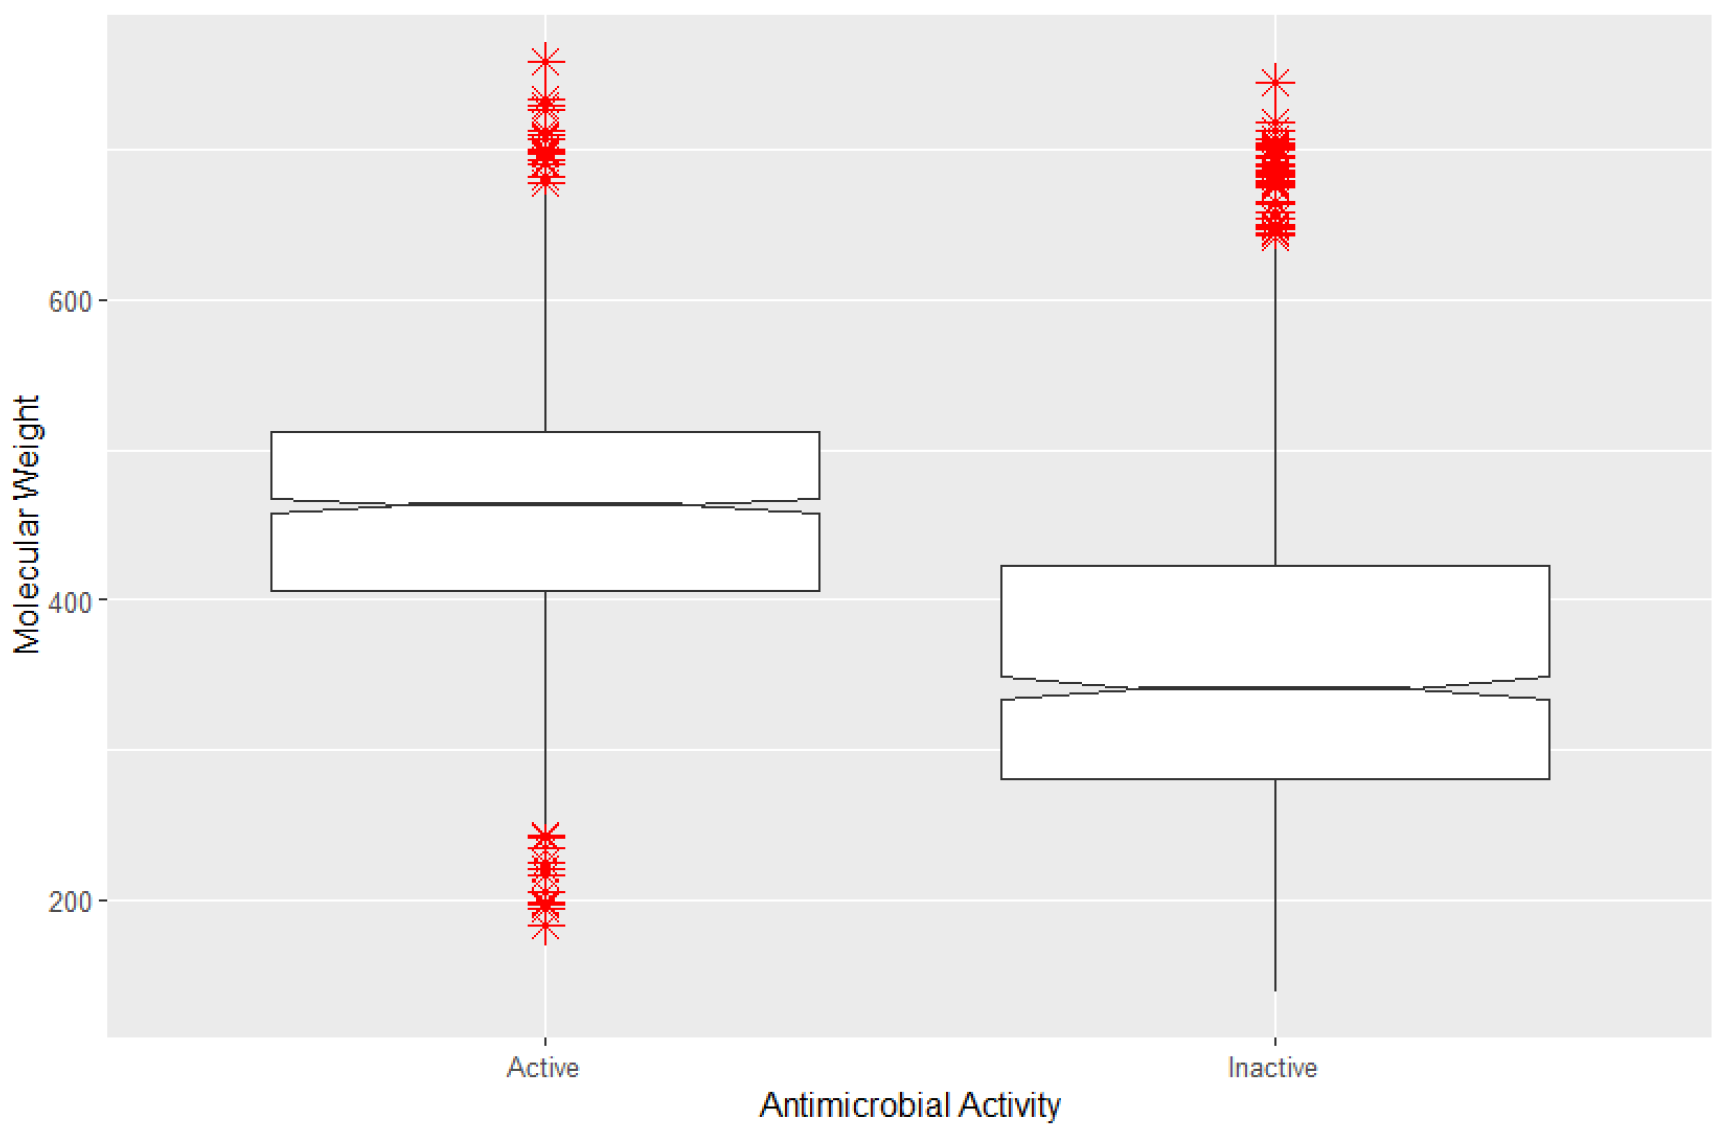
A similar examination can be rendered for the mean molecular weight (center line connecting the two notches) which also appears to separate the two classes for antimicrobial activity well, as shown in Figure 4. Although this separation is not as exacting as bitterness, it is nonetheless indicative of the value of molecular weight within a classification model for antimicrobial activity.

3.3.2. Eliminating the Bitterness Index Impoverishes Model Performance

Additional testing to examine whether the versions of models that lowered the importance of the bitterness index could be drawing out simpler models was warranted. Hence, by eliminating the bitterness index, one could test whether the resultant model quality was degraded or remained competitive with earlier versions containing the bitterness index. Overall, from Table 3, the bitterness index is rather useful since the model without the bitterness index suffered a 67% reduction (overall score) in quality, especially as measured by the maximum mean error and the maximum absolute Matthew’s correlation coefficient (MCC).

3.4. An Analysis of Model Development

3.4.1. Contrastive Evaluation of Cooperative Contributions Recapitulates Feature Selection

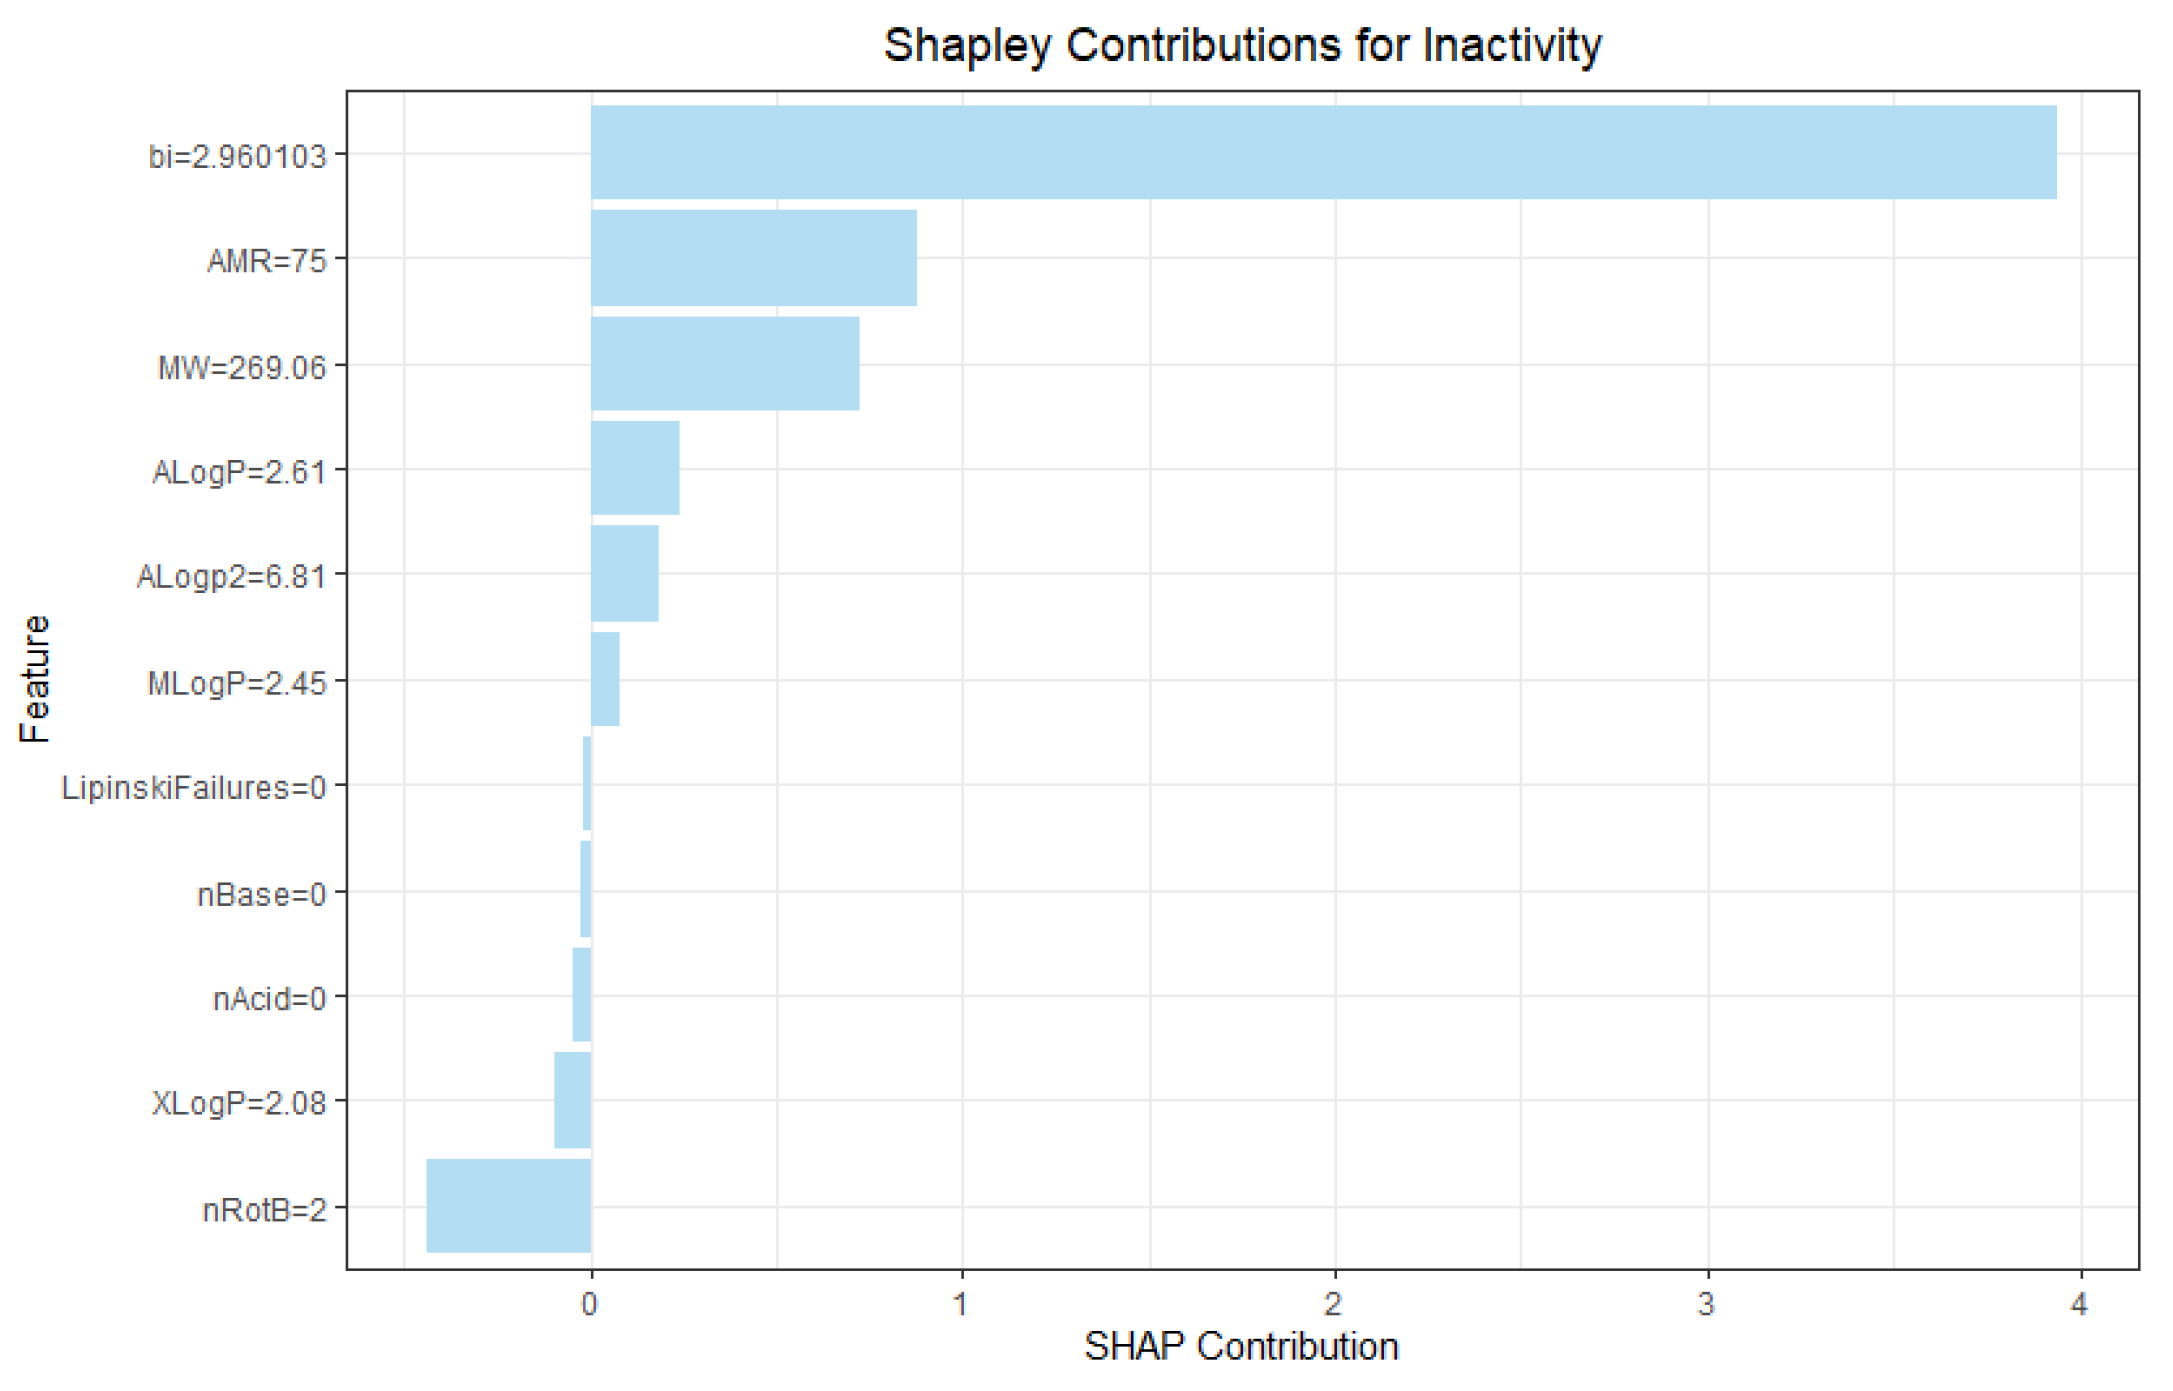
To examine the magnified row–level contribution impact, it may help to select two contrasting exemplars of the active and inactive antimicrobial activity classes, as shown in Figure 5 and Figure 6. The contribution of the bitterness index (bi) is noticeably large while the number of rotatable bonds (nRotB), molecular weight and polarizability are medium contributors. Only the (nRotB) and bitterness index change in the sign of their contribution while the rest are constant across the two comparisons. Overall, the importance of bi for class assignment is proven across the two examples.

3.4.2. Comparison of Modelling Methods Underscores High Signal in the Dataset Compilation

By adapting the model form to include key driving factors, the number of viable algorithm choices may have been broadened. That means, predictive performance will remain relatively high/acceptable even as the algorithm type is altered. From Table 4, even though GBM and DRF are top ranked in four out of the six metrics, the XRT (extreme random forest trees) are not that far behind. This proves that the model choice made, especially as to what factors are to be used as predictors, is a viable one.

3.4.3. Statistical Matching with Lipinski’s Rules for De-Confounded Model Learning

Potential confounding between the initial features and the generation of psychophysical parameters may lead to the statistical imbalance between classes and an inability to adequately parametrize each de-confounded relationship. A simple example may be that the partitioning constants are related to each other through an intermediary mid-line constant. Similarly, the psychophysical response is subject to intermediation by all constitutional parameters used as covariates in the model. Hence, it is a reasonable expectation that some confoundedness may converge upon a suboptimal model parametrization [24].
In this article, it is proposed that using bitterness as a major predictor variable, one might identify fair categories of antimicrobial activity within the dataset. To statistically match the data, an interventional indicator variable that has severe dataset imbalances would be useful such as Lipinski Failures. In Figure 7, most samples have no Lipinski Failures while less than half are distributed between a single or double number of failures. Based on these indicator categories, a matched dataset displaying the statistical balance on the covariates may better attribute the contributions to the model’s predictive power, while increasing the class-agnostic diversity of the model representations.
Having used a one-hot encoded mapping of Lipinski’s failures to statistically match the data, the model was rebuilt with the results showing that the overall result was significantly improved as shown in Table 5. The Statistically Matched model (SM) substantially improved the maximum absolute Matthew’s correlation coefficient (MCC, a metric balanced across all four confusion matrix quadrants). This demonstrates the value in improving data acquisition strategies across both the class representation and the predictor representation to enable fair comparisons.
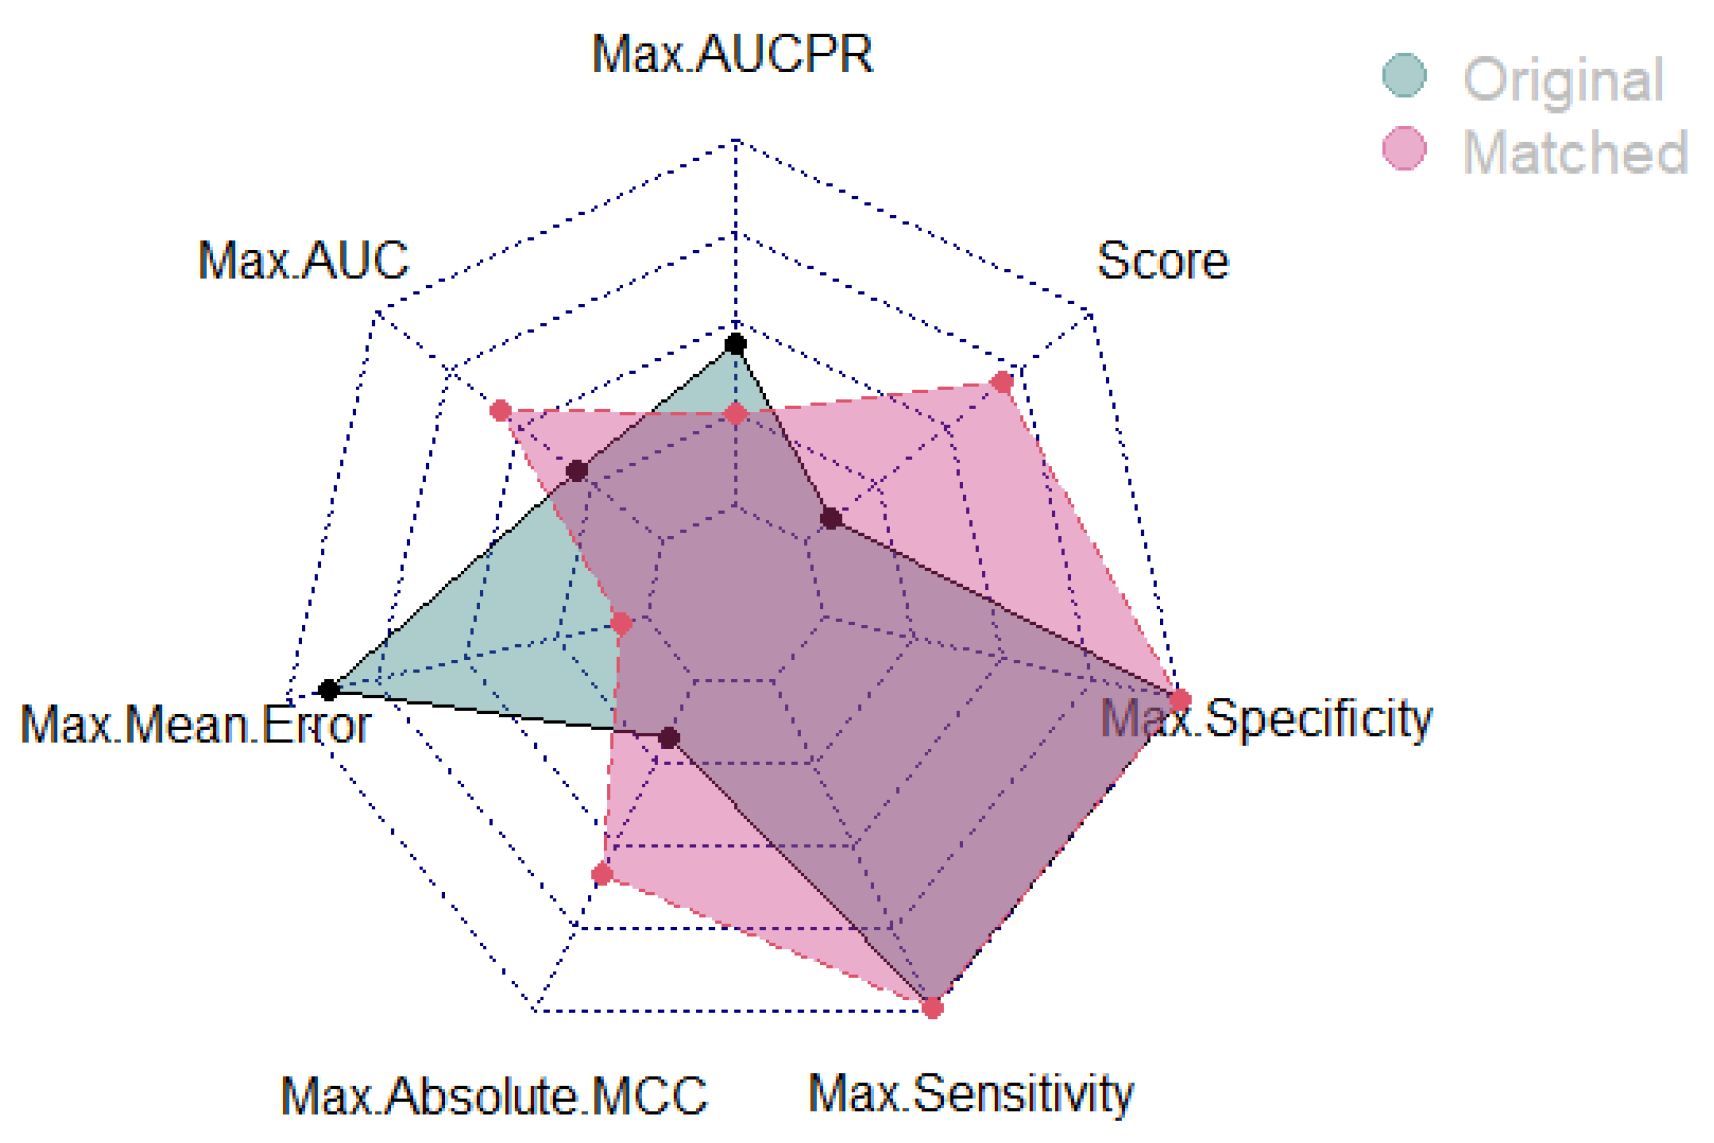
A visual for the model changes shows that the statistically matched model fares better than the original unmatched model form with the main highlights being the lower mean error and the higher MCC. The overall score (“Score”) remains high as shown in Figure 8.
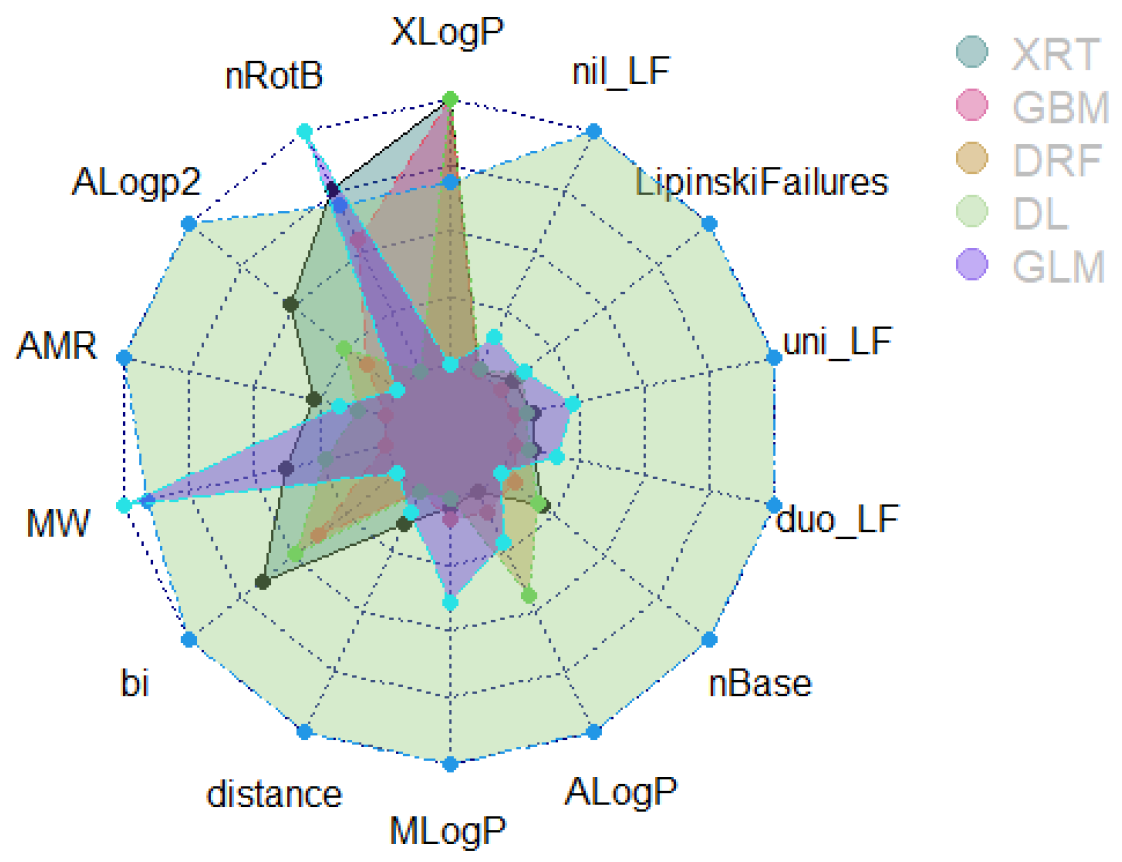
Using the matched model, we can re-examine the variable importance, which still has the bitterness index playing a major role across the different model forms as shown in Figure 9; however, there is a resurgence in the partitioning coefficients. This resurgence matches the general rules of thumb for drug discovery [25].

4. Compound Synthesizability and Commercial Availability

These compounds are all part of the catalogue at the National Institute of Health’s (NIH) Small Molecule Repository. The Small Molecule Repository catalogue at the NIH requires that all tested molecules are synthesizable (and commercially available) for testing purposes. Separately, in a limited number of cases, there is additional development of their analogues for optimized bioavailability [26].

5. Conclusions

In conclusion, using a psychophysical index of bitterness (rendered by the TAS2R response to candidate molecules) alongside mainline physico-chemical descriptors to predict antimicrobial activity is methodologically sound. As a priority, this work demonstrates that psychophysical indices may help to score and to identify relevant chemical spaces for molecular designs and (re-)engineering. This prioritization will help address an already bleak situation whereby existing antimicrobials are proving inefficient in fighting nosocomial infections. Further developments may examine safety and toxicity property predictions to accompany antimicrobial predictions to broaden the beneficiary patient segments and minimize iatrogenesis. Lastly, adjacencies may exist to expand chemical adjuvation to reverse antimicrobial resistance as a means of extending the durability of legacy antimicrobials.

Funding

This research received no external funding.

Data Availability Statement

The data presented in this study are openly available in PubChem at https://pubchem.ncbi.nlm.nih.gov/bioassay/573, ref. no. AID 573.

Conflicts of Interest

The authors declare no conflict of interest.

References

  1. Ganganwar, V. An overview of classification algorithms for imbalanced datasets. Int. J. Emerg. Technol. Adv. Eng. 2012, 2, 42–47. [Google Scholar]
  2. Clark, A.A.; Liggett, S.B.; Munger, S.D. Extraoral bitter taste receptors as mediators of off-target drug effects. FASEB J. 2012, 26, 4827–4831. [Google Scholar] [CrossRef] [PubMed]
  3. Thomas, A.; Sulli, C.; Davidson, E.; Berdougo, E.; Phillips, M.; Puffer, B.A.; Paes, C.; Doranz, B.J.; Rucker, J.B. The Bitter Taste Receptor TAS2R16 Achieves High Specificity and Accommodates Diverse Glycoside Ligands by using a Two-faced Binding Pocket. Sci. Rep. 2017, 7, 7753. [Google Scholar] [CrossRef] [PubMed]
  4. Sambu, S. The determinants of chemoreception as evidenced by gradient boosting machines in broad molecular fingerprint spaces. PeerJ Org. Chem. 2019, 1, e2. [Google Scholar] [CrossRef]
  5. Woolf, L.I. The heterozygote advantage in phenylketonuria. Am. J. Hum. Genet. 1986, 38, 773. [Google Scholar]
  6. Meyerhof, W.; Batram, C.; Kuhn, C.; Brockhoff, A.; Chudoba, E.; Bufe, B.; Appendino, G.; Behrens, M. The molecular receptive ranges of human TAS2R bitter taste receptors. Chem. Senses 2010, 35, 157–170. [Google Scholar] [CrossRef]
  7. Behrens, M.; Meyerhof, W. Bitter taste receptor research comes of age: From characterization to modulation of TAS2Rs. Semin. Cell Dev. Biol. 2013, 24, 215–221. [Google Scholar] [CrossRef]
  8. Yang, M.Y.; Kim, S.-K.; Kim, D.; Liggett, S.B.; Goddard, W.A.I. Structures and Agonist Binding Sites of Bitter Taste Receptor TAS2R5 Complexed with Gi Protein and Validated against Experiment. J. Phys. Chem. Lett. 2021, 12, 9293–9300. [Google Scholar] [CrossRef]
  9. Jackson, F.L.C. Two evolutionary models for the interactions of dietary organic cyanogens, hemoglobins, and falciparum malaria. Am. J. Hum. Biol. 1990, 2, 521–532. [Google Scholar] [CrossRef]
  10. Lee, R.J.; Cohen, N.A. Bitter and sweet taste receptors in the respiratory epithelium in health and disease. J. Mol. Med. 2014, 92, 1235–1244. [Google Scholar] [CrossRef]
  11. Lee, R.J.; Hariri, B.M.; McMahon, D.B.; Chen, B.; Doghramji, L.; Adappa, N.D.; Palmer, J.N.; Kennedy, D.W.; Jiang, P.; Margolskee, R.F.; et al. Bacterial d-amino acids suppress sinonasal innate immunity through sweet taste receptors in solitary chemosensory cells. Sci. Signal. 2017, 10, eaam7703. [Google Scholar] [CrossRef] [PubMed]
  12. Agüero-Chapin, G.; Galpert-Cañizares, D.; Domínguez-Pérez, D.; Marrero-Ponce, Y.; Pérez-Machado, G.; Teijeira, M.; Antunes, A. Emerging Computational Approaches for Antimicrobial Peptide Discovery. Antibiotics 2022, 11, 936. [Google Scholar] [CrossRef] [PubMed]
  13. Duarte-Mata, D.I.; Salinas-Carmona, M.C. Antimicrobial peptides’ immune modulation role in intracellular bacterial infection. Front. Immunol. 2023, 14, 1119574. [Google Scholar] [CrossRef] [PubMed]
  14. Barham, H.; Cooper, S.; Anderson, C.; Tizzano, M.; Kingdom, T.; Finger, T.; Kinnamon, S.; Ramakrishnan, V. Solitary chemosensory cells and bitter taste receptor signaling in human sinonasal mucosa. Int. Forum Allergy Rhinol. 2013, 3, 450–457. [Google Scholar] [CrossRef]
  15. Tizzano, M.; Gulbransen, B.D.; Vandenbeuch, A.; Clapp, T.R.; Herman, J.P.; Sibhatu, H.M.; Churchill, M.E.A.; Silver, W.L.; Kinnamon, S.C.; Finger, T.E. Nasal chemosensory cells use bitter taste signaling to detect irritants and bacterial signals. Proc. Natl. Acad. Sci. USA 2010, 107, 3210–3215. [Google Scholar] [CrossRef]
  16. Jugder, B.-E.; Batista, J.H.; Gibson, J.A.; Cunningham, P.M.; Asara, J.M.; Watnick, P.I. Vibrio cholerae high cell density quorum sensing activates the host intestinal innate immune response. Cell Rep. 2022, 40, 111368. [Google Scholar] [CrossRef]
  17. Zagidullin, B.; Wang, Z.; Guan, Y.; Pitkänen, E.; Tang, J. Comparative analysis of molecular fingerprints in prediction of drug combination effects. Brief. Bioinform. 2021, 22, bbab291. [Google Scholar] [CrossRef]
  18. Chakravarti, S.K.; Alla, S.R.M. Descriptor Free QSAR Modeling Using Deep Learning With Long Short-Term Memory Neural Networks. Front. Artif. Intell. 2019, 2, 17. [Google Scholar] [CrossRef]
  19. Torres-Barceló, C. Phage Therapy Faces Evolutionary Challenges. Viruses 2018, 10, 323. [Google Scholar] [CrossRef]
  20. AID 573—Primary Antimicrobial Assay for E. coli BW25113 ∆tolC::kan Protocol for 384-Well HTS—PubChem. Available online: https://pubchem.ncbi.nlm.nih.gov/bioassay/573 (accessed on 17 October 2022).
  21. Ho, D.; Imai, K.; King, G.; Stuart, E.; Whitworth, A.; Greifer, N. MatchIt: Nonparametric Preprocessing for Parametric Causal Inference. J. Stat. Softw. 2022, 42, 8. [Google Scholar]
  22. Liszt, K.I.; Wang, Q.; Farhadipour, M.; Segers, A.; Thijs, T.; Nys, L.; Deleus, E.; Van der Schueren, B.; Gerner, C.; Neuditschko, B. Human intestinal bitter taste receptors regulate innate immune responses and metabolic regulators in obesity. J. Clin. Investig. 2022, 132, e144828. [Google Scholar] [CrossRef] [PubMed]
  23. Murugesan, I.; Murugesan, K.; Balasubramanian, L.; Arumugam, M. Interpretation of Artificial Intelligence Algorithms in the Prediction of Sepsis; 2019 Computing in Cardiology (CinC); IEEE: Singapore, 2019; p. 1. [Google Scholar]
  24. Dinga, R.; Schmaal, L.; Penninx, B.W.J.H.; Veltman, D.; Marquand, A. Controlling for effects of confounding variables on machine learning prediction. Biorxiv 2020, 1, 2020-08. [Google Scholar] [CrossRef]
  25. Lipinski, C.A. Lead-and drug-like compounds: The rule-of-five revolution. Drug Discov. Today Technol. 2004, 1, 337–341. [Google Scholar] [CrossRef]
  26. Soares, K.M.; Blackmon, N.; Shun, T.Y.; Shinde, S.N.; Takyi, H.K.; Wipf, P.; Lazo, J.S.; Johnston, P.A. Profiling the NIH Small Molecule Repository for Compounds That Generate H2O2 by Redox Cycling in Reducing Environments. Assay Drug Dev. Technol. 2010, 8, 152–174. [Google Scholar] [CrossRef] [PubMed]
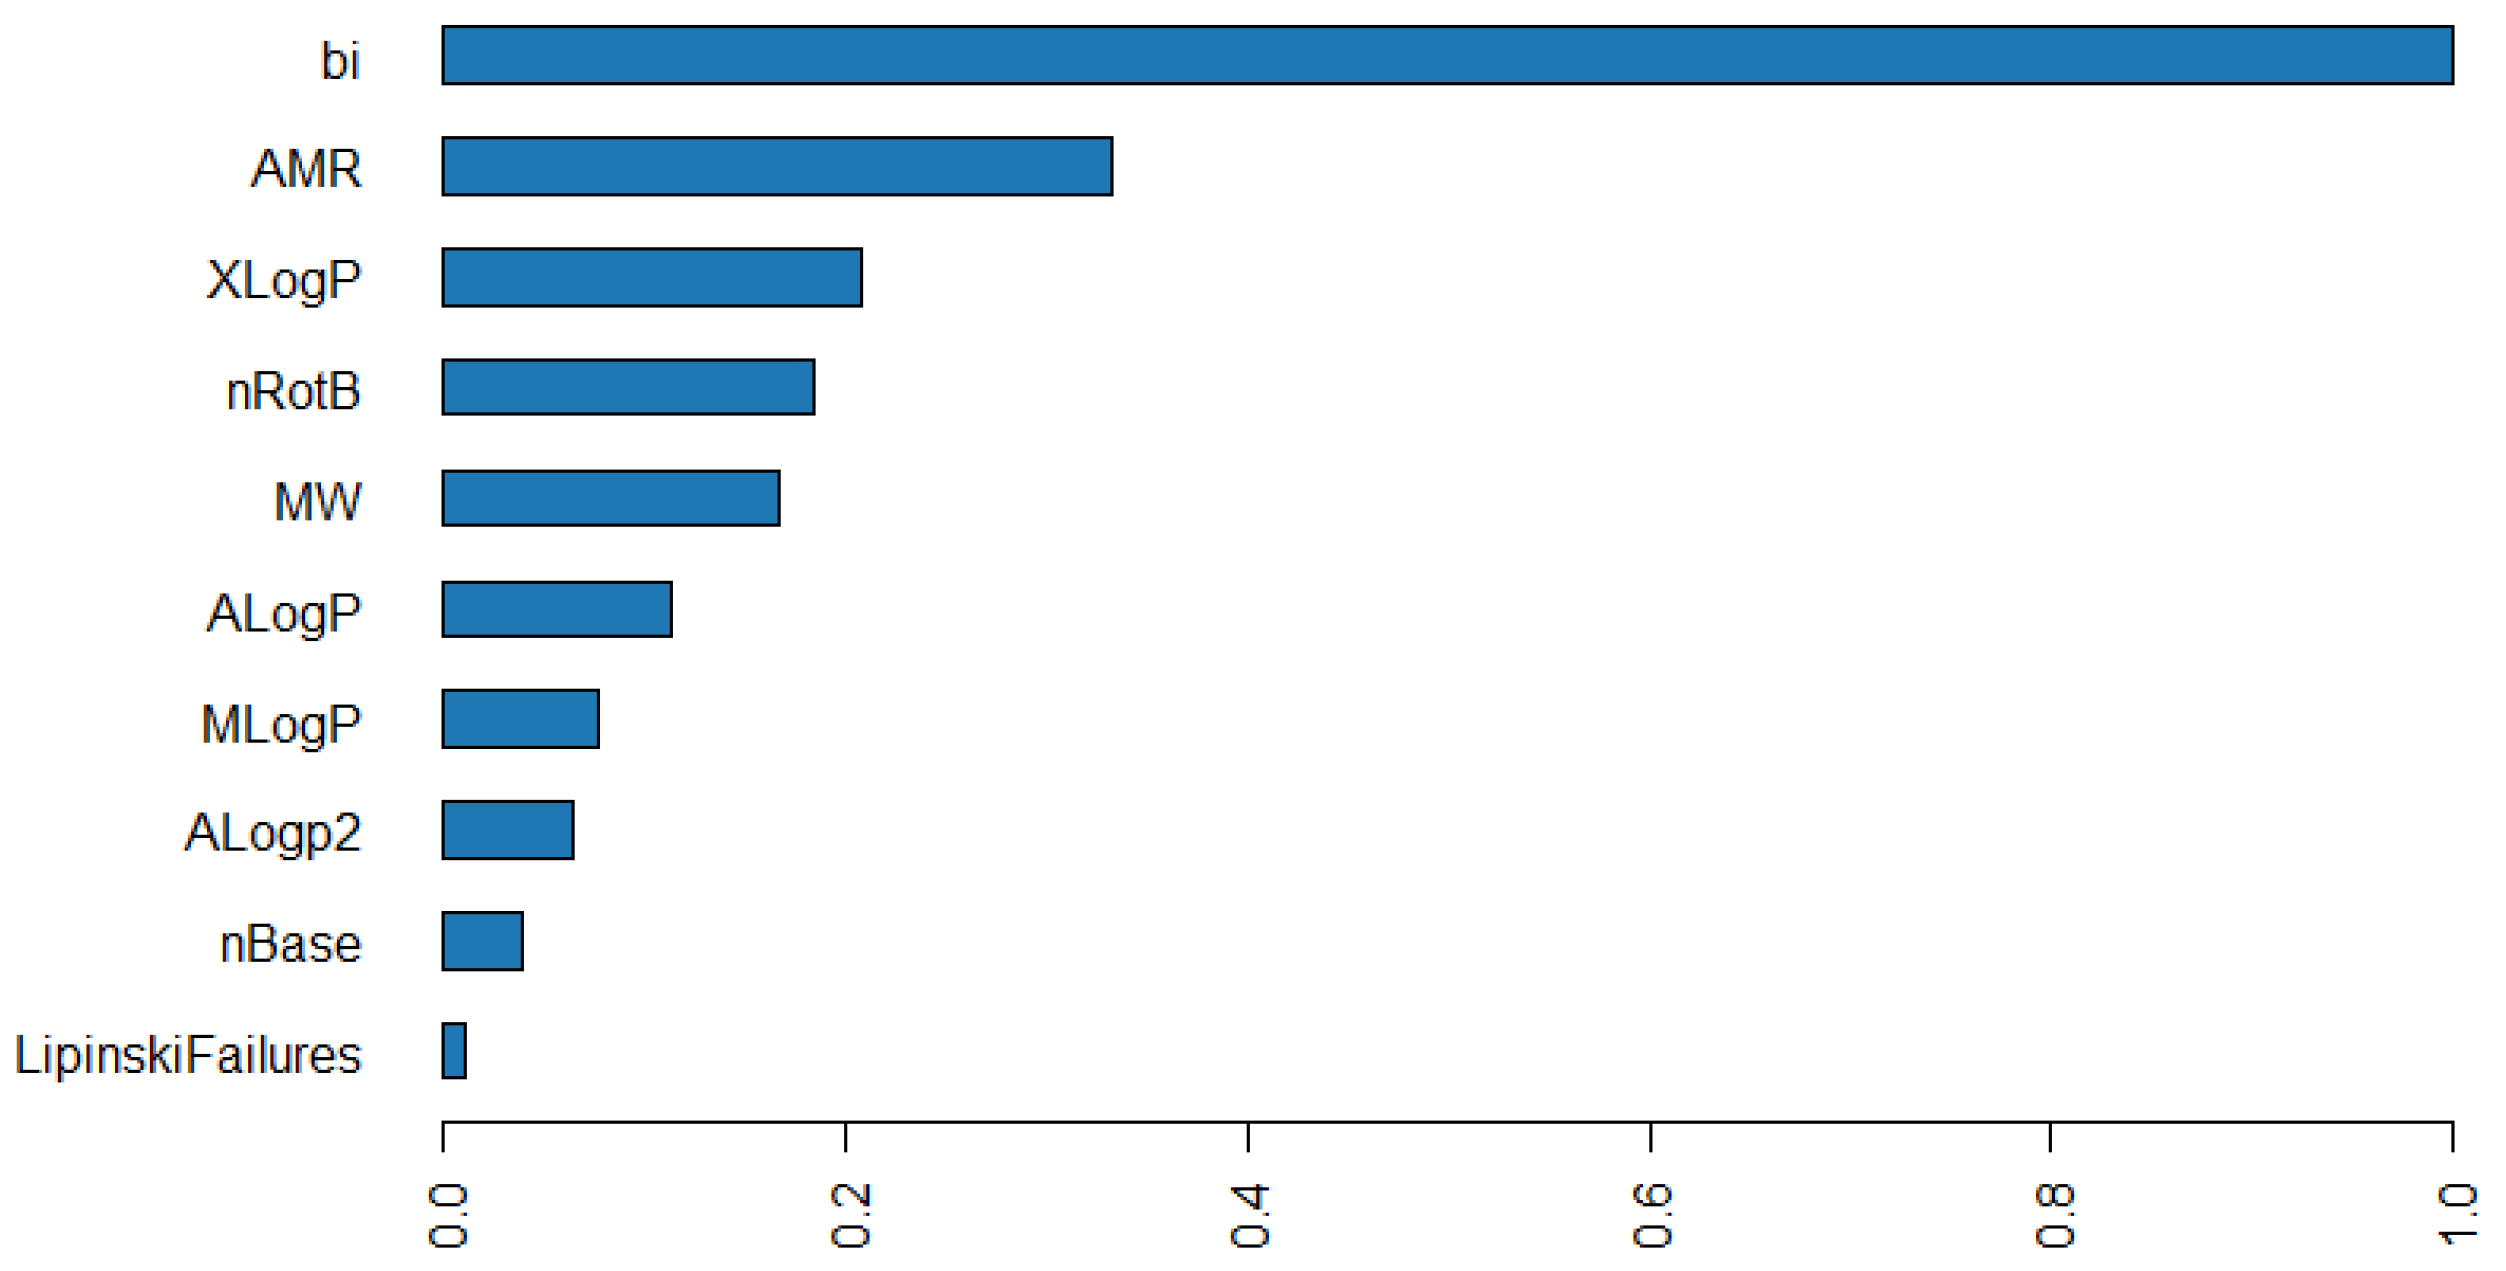
Figure 1. A variable importance plot showing the most influential variables in the DRF; validation metrics: AUCPR/AUC (≥0.95); mean error/class (0.1).
Chemengineering 08 00096 g001
Figure 2. SHAP values applied against the validation set show that the bitterness index (bi) has clear statistical centroids with non-zero Shapley value contributions (values left of the origin in the horizontal axis are negative i.e., “−2.” Validation metrics: AUCPR/AUC (≥0.99); mean error/class (0.04).
Chemengineering 08 00096 g002
Figure 3. A notched box plot showing the ability of the bitterness index to distinguish between the two categories for antimicrobial activity (p < 0.05; signified by the notch while the red cross marks signify outliers). Antimicrobial activity can have a broad continuous range, which requires a feature like bitterness to separate the two classes to their right statistical centers.
Chemengineering 08 00096 g003
Figure 4. A notched box plot showing the ability of the molecular weight to distinguish between the two categories for antimicrobial activity. The notches indicate there is a significant difference in the means of the two groups while the red cross marks indicate outliers (p < 0.05).
Chemengineering 08 00096 g004
Figure 5. SHAP values applied to an inactive row showing the robust contribution of the bi, relative to other features. The bi contribution is directionally positive for this inactive exemplar. It is expected to contrast directionally from an active row.
Chemengineering 08 00096 g005
Figure 6. SHAP values applied to a highly active row, showing the contribution of the bi, relative to other features. Directionality switch for bi between the active and inactive rows demonstrates that bi is a distinguishing feature for antimicrobial activity.
Chemengineering 08 00096 g006
Figure 7. A histogram of the number of Lipinski’s failures shows that most have no failures, but a significant number have either one or a couple of failures. This metric may be a basis for statistically matching the class members during training.
Chemengineering 08 00096 g007
Figure 8. A radar plot showing that the matched model outperforms the traditional model, especially in the MCC and mean error metrics. This is borne out by the overall score. Statistical matching enables fair comparisons and builds on the orthogonality in the predictor–predicted (category differentiation) set.
Chemengineering 08 00096 g008
Figure 9. A radar plot showing the variable importance across the top performing model forms. In all cases, the value of the bitterness index is more muted, but still a critical part of modeling strength. Conversely, the partition coefficients have grown in relative importance. Lipinski failures and associated encodings (nil_LF, uni_LF, duo_LF) are already known to be of relatively high-scaled importance given their usefulness as de-confounding variables. Note that the distance measures are extracted from the statistical matching process as a propensity score.
Chemengineering 08 00096 g009
Table 1. The confusion matrix summarizing the validation outcomes for the GBM model.
ACTUAL
PREDICTED ACTIVEINACTIVEERROR
ACTIVE94%6%6%
INACTIVE12%88%12%
TOTALS58%42%9%
Table 2. A representative summary of high variance features that contribute significant information to the model.
DescriptorFunctionContributionRationale
MassMolecular weight10%Diffusion rate across biomembranes and cytosol
HydrophobicityMultiple40%Partitioning across biomembranes
Electro-topologicalPolarizability10%Charge separation in response to an external electric field: may influence coulombic interactions with cellular environment
Binding degrees of freedom (D.F.)Multiple features20%Solvation and motion free energies determined by acid/base pairs and rotatable bonds
CombinatorialMultiple features20%Drug design rules and psychophysical response indices
Table 3. Performance comparison (maximum performance conditioned on respective thresholds) of top performing models with and without the bitterness index (bi) shows that the bi vector is critical for attaining quality model parameters. Noticeably, given the dataset is imbalanced, the MCC (Matthew’s correlation coefficient), which accounts for all true–false/positive–negative rates shows that the bitterness index is essential to achieving a reasonable model. The maximum mean error (MME) also shows that without the bitterness index, the model suffers from an approximate 10× increase in the observed MME. The overall score shows that only 33% (2/6) of the model quality parameters are comparable to the model with the bitterness index.
Model without biModel with bi
Max. AUCPR0.89100.9931
Max. AUC0. 90060.9940
Max. Mean Error0.18660.022
Max. Absolute MCC0.64130.9966
Max. Sensitivity (TPR/Precision)0.99990.9999
Max. Specificity (TNR) 0.99990.9999
Overall Score2/66/6
Table 4. Performance comparison of the different algorithms demonstrates the data signal is robust and that the measurement choices regarding the response variable were sound in generating learnable contrasts between the active and inactive antimicrobial activity classes. Absolute values are presented in each cell with the trends in adjacent brackets—an upward arrow denotes an increase against the row-wise baseline metric while a downward arrow refers to a decrement.
GBMDRFXRT
Max. AUCPR0.96660.9597 (↓ 0.71%)0.9605 (↓ 0.63%)
Max. AUC0.96500.9534 (↓ 1.2%)0.9590 (↓ 0.62%)
Max. Mean Error0.093 (↑ 4.5%)0.0890.09 (↑ 1.2%)
Max. Absolute MCC0.8324 (↓ 1.2%)0.84280.8324 (↓ 1.2%)
Max. Sensitivity (TPR/Precision)0.99990.99990.9999
Max. Specificity (TNR) 0.99990.99990.9966 (↓ 0.33%)
Overall Score4/64/61/6 (↓ 75%)
Table 5. Comparison of the statistically matched (SM) and traditional model with raw data (TM). The greatest change is observed with the improvement of the mean error and MCC. In contrast, the AUCPR dips negligibly (downwards-pointing arrow denotes decrements relative to the baseline metric) relative to the traditional (unmatched) model; other values are either the same or trending upwards (upwards-pointing arrow demotes increment relative the baseline metric).
Traditional ModelStatistically Matched
Max. AUCPR0.96660.9553 (↓ 1.17%)
Max. AUC0.96500.9786 (↑ 1.41%)
Max. Mean Error0.0930.0440 (↓ 52.69 %)
Max. Absolute MCC0.83240.9111 (↑9.45%)
Max. Sensitivity (TPR/Precision)0.99990.9999
Max. Specificity (TNR) 0.99990.9999
Overall Score3/6 (↓ 40%)5/6
Disclaimer/Publisher’s Note: The statements, opinions and data contained in all publications are solely those of the individual author(s) and contributor(s) and not of MDPI and/or the editor(s). MDPI and/or the editor(s) disclaim responsibility for any injury to people or property resulting from any ideas, methods, instructions or products referred to in the content.