Abstract
This work aims to evaluate the quality of drinking water in the Disi aquifer in Jordan. Several water quality parameters are included in the mathematical equation to evaluate the average water quality and establish the suitability of water for drinking purposes. Water sampling zones from three wells were used to calculate the water quality indices (WQI). The water samples were analyzed for several physicochemical parameters, including pH, turbidity, total dissolved solids, Na+, Ca2+, Mg2+, Na+, K+, HCO3−, SO42−, Cl−, NO3−, total hardness, electrical conductivity (EC) and other elements (Fe2+, Zn2+, Mn2+, Cd2+, As2−, Pb4+ and Cu2+), in the groundwater wells. Biological parameters, such as faecal coliform, were also tested. The Weighted Arithmetic WQI indicated that most of the wells were of good to excellent quality. These determined indices support decision making and are beneficial to monitoring the groundwater quality in the Disi aquifer. The relative weight is specific to each parameter and ranges from 1 to 5; it establishes the importance of the water quality parameters for domestic purposes. The WQI analysis rates the water quality between 75 to 65 from good to medium. The water quality of the Disi aquifer for potable drinking water was compared with the guidelines of the World Health Organization (2011) and the Jordan Drinking Standard (JS286); the results indicated that water in the Disi aquifer was of high quality and was fit for drinking.
1. Introduction
The decline in the quality of water from springs, boreholes, sealed wells, hand-dug wells, streams, rivers and lakes is caused by the presence of microbes, nutrients, heavy metals, organic chemicals and sediments. Boreholes, which are wells drilled using a drilling rig, draw water from isolated groundwater sources that are filtered through layers of soil and rock before reaching the surface. These sources may contain minerals and have an unpleasant colour or odour, but they are mostly free of contamination and do not require disinfection. Sealed wells are shallow wells that have been sealed, with cement around a pump, to prevent contamination. However, contamination is a possibility, and therefore, chlorine is frequently used to treat sealed wells.
This research paper discusses the methods used to disinfect the public water supply system, which includes submersible pump and related water distribution systems. Disinfection kills or reduces harmful microorganisms like viruses, bacteria and other microorganisms present in drinking water. Controlling microorganisms in a well and the distribution system is achieved via disinfection. From the earliest records to the twentieth century, the history of water purification can be broken down as follows: the pursuit of clean water [1]. From 1902 to 1921, a mixture of iron chloride and lime chloride was used to chlorinate a highly-coloured water supply [2]. Four WQIs and FL, based on in situ measurements at nine different wells along the study area in Jouamaa Hakama Region (North of Morocco), were used and compared, alongside twelve bacteriological and physical–chemical parameters [3]. The use of chlorine gas largely replaced the use of lime chloride in disinfecting drinking water [4].
The process of flushing the well and water system with a chlorine solution, to kill bacteria and other microorganisms, is known as chlorination or ‘shock chlorination’ [5].
Free chlorine residual comprises two main compounds: hypochlorous acid (HOCl) and hypochlorite ion (OCl−). Hypochlorous acid is more effective in killing pathogens than the hypochlorite ion [6].
Calcium hypochlorite Ca (ClO)2, chloride (Cl), hypochlorous acid (HOCL) and water (H2O) are involved.
When chlorine is added to water, the following chemical reaction occurs:
Chlorine, when added to water, reacts with hypochlorous acid and hydrochloride acid to form a pH-dependent equilibrium mixture.
Hypochlorous acid partially dissociates into hydrogen and hypochlorite ions based on the pH:
Chlorinated water recirculation helps to distribute the chlorine, thoroughly mix the water column and wash down the well casing’s sidewalls [7].
Groundwater is water that is found below the surface. It is the source of water for wells and springs and helps to sustain water flow in surface water bodies such as lakes and streams. It is a valuable resource because it supplies many residents and businesses with water and contributes to the health and integrity of our aquatic ecosystems [8]. Many groundwater sources and water from lakes, rivers, or streams contain ‘germs’ that can spread diseases. Pathogens are germs that cause water-borne infections, which can result in serious reactions and complications, including death. They include parasites, viruses, and bacteria. These pathogens, which are present in human or animal faeces, increase in number when they enter drinking water sources [9].
Well disinfection helps to get rid of or reduce harmful bacteria and viruses, as well as harmless bacteria that cause a bad taste and smell [10].
Although shock chlorination is necessary for the maintenance of wells and disease prevention, it does not guarantee safe drinking water. Safe drinking water can be ensured by incorporating shock chlorination into a well management strategy that includes the responsible decommissioning of abandoned wells, adequate well protection and the maintenance of a water monitoring program. Groundwater from private wells supports 5 million people across Canada [11].
The aims of this study are as follows:
- To investigate the physicochemical parameters and bacterial microbes in groundwater.
- To study the effect of the disinfection and sterilization of water wells, by calcium hypochlorite, on groundwater geochemical variables and microbes.
- To calculate the volume of disinfection and sterilization using a pumping test.
- To compare the quality of Jordanian water wells, using Jordanian Drinking Water Standards, before and after the disinfection.
The microbial population, in a well, is divided into “nuisance” and “pathogenic” bacteria. The most prevalent pathogens are iron bacteria and sulphate-reducing bacteria (SRB) [12]. Although these bacteria are not harmful, they pose a health risk as they form biofilms that protect against pathogens and hinder faecal coliform testing [13]. There are pathogenic microbes, protozoa, and infections that make up unsafe microorganisms. The majority of microorganisms reside in various aggregates called ‘biofilms’. Biofilms are commonplace and symbolize the most prosperous way of life. They carry the potential for self-cleaning in soils, sediments, and water, and are the active ingredient in biofiltration [14]. About half of all drinking water wells in the US, tested in recent studies, have evidence of faecal contamination. Groundwater is significantly associated with outbreaks of waterborne diseases; many pathogens have been found in groundwater [15,16].
This study aims to compare the quality of Jordanian water wells before and after the chlorination treatment. The quality parameters were compared to the Jordanian Drinking Water Standards and WHO (2011) to ensure that they adhere to the guidelines of the Drinking Water Standard. The proper regulation of the water supply includes the completion of a water well, the cleaning of existing wells, the proper development of new wells by flushing the water supply, remediation with a properly prepared chlorine solution and the collection and analysis of water samples. The limitations of the study are due to constraints on research design, methodology and materials.
2. Materials and Methods
2.1. The Study Area
The area of study is the Disi region in South Jordan. The Disi aquifer is a groundwater resource in South Jordan that serves as the primary source of water for the Mudawara Region (Figure 1). It is one of Jordan’s most permeable and productive sandstone aquifers. It is an important source of water in the region for agricultural domestic and industrial use. The aquifer is made up of rock units, which overlay the basement complex of the Precambrian era. They are divided into two groups: the upper Khreim group and the lower Rum group. These are formations called Saleb, Burj, Umm Ishrin, Disi and Umm Sahm. The rock formations of the Rum group comprise the Rum aquifer system, which dominates the freshwater aquifer system in South Jordan, and the rock formations of the Khreim group represent the confining layer, in which the Sahl Suwaan formation occurs. The Khreim group consists of more silty sandstone and mudstone, and includes the Dubaydib and Hiswa formations. They have a depth of 0–158 m.
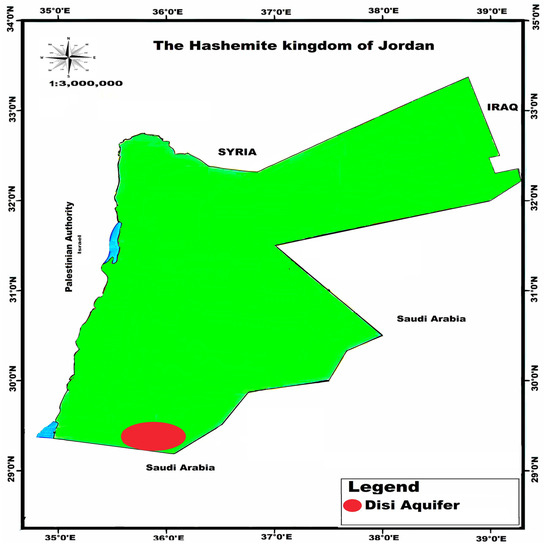
Figure 1.
Disi Aquifer, the study area.
The other group is the Rum group, which includes the Umm Sahm formation; it is comparable to clean sandstone and is found at depths ranging from 158 m to the borehole’s total depth of 550 m.
2.2. Hydrogeology of Disi Aquifer
The Rum aquifer is situated in the northeastern section of the Disi region in the lower part of the Hiswa Formation (Khreim Group). The aquifer is unconfined to the west and southwest, where there are outcrops of the Umm Sahm Formation; from its western limit, the aquifer extends more than 1000 m eastwards. Water was pumped from both the unconfined aquifer, in the Disi–Sahl Suwaan area, and the confined aquifer, in the Mudawarra area, in the Disi–Mudawarra area. Figure 1 depicts the typical flow direction of groundwater to the northeast. The project area’s piezometric surface is between 720–740 m above mean sea level (AMSL) and corresponds to water levels of 100 to 200 m below ground level. The hydraulic conductivity ranges between 1 and 4 m/day. The groundwater quality is generally acceptable, with total dissolved solids (TDSs) levels ranging from 200 to 300 mg/L, electrical conductivity (EC) values ranging from 350 to 400 S/cm and pH values ranging from 7 to 8.
2.3. Water Sampling and Physicochemical Analyses
Several water wells in the study area were used to collect water samples for this study. Water investigations were realized considering the nature of water, as per standard techniques, to decide the physicochemical examinations and bacteriological boundaries to be used in sanitization. Figure 2 depicts the methodology layout used to define and estimate the study area’s water quality using a flowchart. The process of gathering data is an essential part of any research. Major, minor, and trace element analyses were carried out in the laboratories. These examinations were meant to decide the convergence of cations (Ca2+, Mg2+, Na+, K+), anions (HCO3−, SO42−, Cl−), nitrate (NO3−), pH, TDSs and turbidity, with standing complete hardness and minor components (Fe 2+, Zn2+, fn2+, Cd2+, As2− and Cu2+) in the wells.
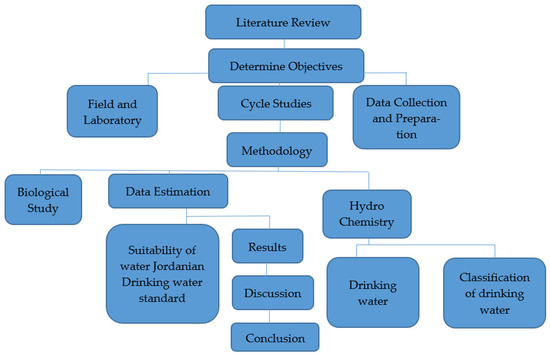
Figure 2.
Flowchart illustrating the research steps.
2.4. Analytical Methods
Water chemical analyses were conducted to identify the quality of water, according to standard methods, to determine the physicochemical analyses and bacteriological parameters before and after sterilization. The pH was measured using a pH meter and turbidity was measured using a turbidity meter. The total dissolved solids (TDSs) and EC were measured, in the field, after collecting samples.
The cations and anions were measured in all groundwater samples from the Disi aquifer in the laboratory. The cations (Ca2+, Na +, Mg2+, K+) and anions (Cl−, HCO3−, SO42−, NO3−) were analysed via ion chromatography and the water quality sector. The bacteria species/aerobic bacteria were analysed using ‘Vitek2 compact 15’, by the bioMérieux, Inc. Durham, USA. The alkalinity titration method used was SM 2320B. The total hardness was analysed using EDTA Titrimetric and the EC was analysed using the laboratory method (Ref. CHI-EC -R007).
2.5. Pursuit of Hygienic Drilling
Perfect general sanitation can reduce the introduction of microbial contaminants into newly constructed or restored wells during the storage, transportation, handling and assembly of well components. Adequate sanitation, during the construction or repair of a water supply system, refers to cleaning and taking precautions to prevent disease by preventing the introduction of bacteria and other contaminants. The drilling contractor should take precautions to keep contaminants from entering the well. This can be achieved using continuous sterilization methods, which are required to ensure the safety of the water supply.
2.6. Chlorine Procedure
In practice, according to Schnieders, chlorine concentrations should be kept between 50 and 200 parts per million (ppm), and the standard recommended concentration should be no less than 50 mg/L and no more than 200 mg/L whenever disinfection is desired [17]. Calcium hypochlorite is a white granular compound containing about 60 to 70 per cent of available chlorine.
The volume of water in the well and the quantity of chlorine required were calculated before well construction or pump installation. The actual pump rate, expressed in gallons per minute, was used to determine the rate at which the solution was introduced into the system, rather than the typical 24 h consumption.
2.7. Well Disinfection
After building or repairing a well or pump, the complete well and pumping system must be disinfected to kill harmful microorganisms (germs and bacteria) on the well casing, gravel, soil, rising main, and pumping rod, or in the water.
The pumping rod and riser pipe were installed in a live, recently drilled water well of a depth of 550 m. Before the well was sealed, it was disinfected. The water level in the well was 99.81 m below the surface.
Table 1 shows the properties of the well for disinfection: the total depth was 550 m, the water level was 99.81 m, the casing was 18⅝′′ (0.473 m) and the screen was 10¾′′ (0.273 m).

Table 1.
Features of the well that was to be disinfected.
Table 2 shows the procedures for disinfecting this well, as well as the volume of the added hypochlorite, were calculated as follows:
Table 2.
Calculation of volumes for disinfection.
Table 3 shows that the concentration of the free chlorine residual, after 30 min of pumping water out of the well, was 10 mg/L. After one hour of pumping, it became 4 mg/L and the pumping was continued by airlifting the well water out until the chlorine concentration in the water reached 0 mg/L after a reaction time of approximately 12 h.
Table 3.
Analysis of the concentration of control chlorine (mg/L CL2).
The chlorine concentration, for disinfection, was no less than 50 mg/L and no more than 200 mg/L. The total volume and the quantity of calcium hypochlorite required for a 100 ppm free chlorine dosage in the screen and casing sections are shown in Table 4. Here, (57.580 m3) is divided by 0.080 kg/m3 or 4.606 kg, with an excess of 10%, equalling 5.3 kg. The pumping steps were conducted using 8.57 m3 of solution, mixed water (66.2 m3) and hypochlorite (5.3 kg).
Table 4.
Test of sterilization using pumping.
Table 4 shows that 100 ppm of Ca–hypochlorite solution was injected through the drill pipes to sterilize the well. Then, 5.30 kg of Ca–hypochlorite and 66.20 m3 of water were mixed for this purpose and pumped through the drill pipes and the washing tool, at seven different depths, from 219 m below the reference point (bRP), which is the top of the screen, to 525 m bRP, which is the end of the screen. Then, 8.57 m3 of the solution was injected at each level. Figure 3 shows the stages of well disinfection. It was found that the pH of the chlorine solution in the well should be between 6 and 7 in order to keep the chlorine in the anon oxidative state (hypochlorous acid) after a reaction time of approximately 4 to 12 h, for effective increased contact time.
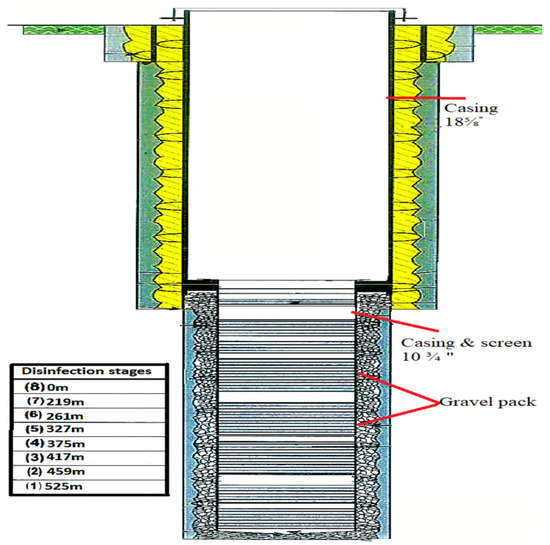
Figure 3.
Well profile with disinfection stages.
The well was cleaned of the sterilization solution via airlifting until the chlorine concentration in the water reached 0 mg/L; at this point, the raised contact time became effective. This controlled organic growth produced a minimal taste and smell of chlorine. The force domain of calcium hypochlorite ranges from 30% to 75% for available chlorine, with 70% combined chlorine.
Chlorine is an extremely reactive substance. When it is added to a well, it first combines with inorganic components like hydrogen, ferrous iron, and manganese. No disinfection occurs at this stage. The chlorine residue reacts with organic matter (algae, phenols and slime growth) after these components are reduced.
Chlorine will combine with nitrogen compounds (primarily ammonia) to form chloramines once the demand request, extended by inorganic and organic compounds, has been met. This combined chlorine form disinfects for a longer period. Chlorine concentrations of 50 ppm or less should be used if pH control is not used during times of prolonged contact [18].
3. Water Quality
3.1. Hydrochemistry in the Field and Water Sampling
A Steady-Rate Pumping Test (SRPT) was used to collect water samples from the sampling tap for chemical analyses. The samples were taken after the disinfection of the wells. Master and secondary ions, as well as physical parameters, were examined in both samples. The bacteriological parameters of the second sample were also investigated. The Water Quality Sector and the laboratories received three samples, respectively. The physical parameters, measured on-site, are shown in Table 5.
Table 5.
The measurements of physical and chemical parameters on the spot during SRPT.
Table 6 shows the three water samples that were taken for physical, chemical, and bacteriological analyses. Table 6 shows the parameters measured using the analytical methods and Jordanian standards during the analyses, and the interpretation of the results. Water chemical analyses were conducted to identify the quality of water, according to standard methods, and the laboratory results were compared with the respective threshold values of the aforementioned standards.
Table 6.
The outcomes of the lab analyses of water samples.
3.2. Water Quality Index
Groundwater synthetic examinations were used to ascertain the values of the water quality record. The Jordanian drinking water guidelines, for 2008, were consulted while calculating WQI, as displayed in Table 7. In the first step, the weight (wi) of each chemical parameter was determined based on its relative importance to the quality of drinking water, as shown in Table 8. A maximum weight of five is given to chemical parameters of great importance in the evaluation of water quality, while a minimum weight of one is given to chemical parameters that have no impact on the overall quality of water [19].
where Wi is the relative weight, wi is the weight of each parameter and n is the number of parameters. In the third step, the quality rating scale (qi) was calculated, according to equation number (5), by dividing each chemical parameter concentration (Ci), in each water sample, by its respective Jordanian Standards for Drinking Water (Si), as shown in Table 8; the result is multiplied by 100.
Table 7.
Drinking Water Quality Jordanian Standards (2008).
Table 8.
Weights are assigned to parameters [19].
In the fourth step, the sub-index of the parameter (SLi) was calculated for each chemical parameter, using the following relationship:
Finally, the WQI was computed using the following relationship:
The method employed to calculate the water quality index, using the Jordanian Standards of Drinking Water Quality (2008), is explained in detail in Table 7 [20].
Table 8 shows the weights assigned to parameters. The overall suitability of drinking water was estimated using a combined measure of WQI. The water quality index (WQI) was calculated to estimate the influence of natural and anthropogenic activities based on several key parameters of drinking water chemistry. To calculate the WQI, the weight was assigned specifically regarding the physicochemical parameters’ conformity to their relative importance in the overall quality of water for drinking water purposes. The determined weight ranges from one to five. The maximum weight of five was assigned for NO3; a weight of four was given to pH, TDS and SO4; a weight of three was assigned to HCO3 and Cl; a weight of two was given to Ca, Mg, Na and K, and a weight of one was assigned to PO43−.
Here, Wi is the relative weight and Qi is the scale rating of the parameter. pH, T, TDS, Ca2+, Mg2+, Na+, K+, Cl−, HCO3−, SO42−, NO3−, PO43− are the variables included in the calculations. Each variable received a rating that was calculated using the arithmetic mean, and the ratings were then changed to temporary weights. The final weight was then calculated by dividing each temporary weight by the total number of temporary weights [21,22,23,24,25].
Table 9 shows a colour spectrum was used to show the range in the water quality of each area [26], with dark red signifying very poor water quality (WQI = 0–10), a narrow strip of yellow showing average quality (50 WQI), and dark blue signifying excellent water quality (WQI = 90–100).
Table 9.
Classification of water quality [25,27,28].
Table 5, Table 6 and Table 10 show the permissible limits of physical–chemical and bacterio-logical parameters confirmed using the Jordanian standards for drinking water [20].
Table 10.
Calculating the water quality index (WQI) of wells.
If T is ‘medium’, pH is ‘medium’, EC is ‘high’, TDSs is ‘very low’, DO is ‘high’, NO3 is ‘very low’, NH4 is ‘very low’, PO4 is ‘very low’, TURB is ‘low’ and FC is ‘very low’, then the quality is ‘excellent’.
If (T is ‘very high’ or T is ‘low’ or T is ‘medium’ or T is ‘high’), (pH is ‘low’ or pH is ‘medium’ or pH is ‘high’ or pH is ‘very high’), (EC is ‘very low’ or EC is ‘low’ or EC is ‘medium’ or EC is ‘high’), (TDSs is ‘very low’ or TDSs is ‘low’ or TDSs is ‘medium’ or TDSs is ‘high’), (DO is ‘low’ or DO is ‘medium’ or DO is ‘high’), (NO3 is ‘very low’ or NO3 is ‘low’ or NO3 is ‘medium’ and NH4 is ‘very low’ or NH4 is ‘low’ or NH4 is ‘medium’), (PO4 is ‘very low’ or PO4 is ‘low’ or PO4 is ‘medium, and TURB is ‘very low’ or TURB is ‘low’ or TURB is ‘medium’ or TURB is ‘high’) and (FC is ‘very low’ or FC is ‘low’), then the quality is ‘acceptable’.
If T is ‘very high’ or pH is ‘very low’, EC is ‘very high’ or TDSs is ‘very high’, DO is ‘very low’ or NO3 is ‘high’ or NO3 is ‘very high’ or NH4 is ‘high’ or NH4 is ‘very high’ or PO4 is ‘high’ or PO4 is ‘very high’ or TURB is ‘very high’ or FC is ‘very high’, then the quality is ‘poor’.
Table 11 shows that the WQI in the Disi aquifer groundwater varies from 75 to 65. According to Jordan’s water standards 2008, the EU drinking water standards 1998 and the WHO standards 2011, the results of the water sample analysis show that the water quality is good and suitable for consumption. This study could serve as a foundation on which the authorities could develop a groundwater management plan in the study area in the future.
Table 11.
Well test values for the Disi aquifer well with WQI values.
4. Results
4.1. A Physical-Chemical Metric
Table 5 and Table 6 display the physicochemical properties of water quality. The pH values of the three samples were 7.96, 8.02 and 7.66, respectively. The temperatures of the groundwater were 30 °C, 32.01 °C and 29.5 °C, respectively, and the highest value in the mean was 32.01 °C. Sample 1 had a mean temperature of 32.01 °C, sample 2 had a mean temperature of 30 °C and the minimum value had a mean temperature of 29.5 °C. The turbidity of the water ranged between 0.76 NTU, 1.72 NTU and 2.37 NTU, with samples 3 showing the highest value and sample 1 showing the lowest value. The total dissolved solids were between 207, 208 and 212 mg/L. The electrical conductivity of samples 1 and 2 ranged between 372, 376 and 383 μS/cm, respectively. Water samples contained a free residual chlorine value of 0.00 mg/L.
4.2. Bacteriological Investigations
Bacteriological investigations, after 23 h of steady pumping, revealed the presence of the aerobic bacteria called Acinetobacter haemoliticus. Sulphate-reducing bacteria, Sphingomonas pauciummobitis (an aerobic bacteria), and coliforms were found in the water after the final disinfection. After the well was sterilized, the total number of coliform bacteria was 1.8 MPN/100 mL, which was higher than the threshold (0/100 mL). Sulphate-oxidizing bacteria were present at a rate of less than 1.8 MPN/100 mL, and the total coliform count was 1.8 MPN/100 mL. Iron bacteria were not observed, as shown in Table 6.
5. Discussion
The World Health Organization’s standards serve as the foundation for laboratory analyses of the Jordanian drinking water standards [29]. The EU guidelines from 1998 [30], which serve as a reference for the Jordanian standards, could not recode the threshold values for some parameters [29,30].
The impact of pH: pH is a proportion of the acidic or basic states of water. As the human body is made up of 50–60 percent water, the pH of drinking water can significantly impact body chemistry and health. The study found that the pH of the water samples ranged from 7.96 to 8.02, which indicates that the water from the aquifer was alkaline in nature, as shown in Table 5 and Table 6. The pH of the water was in the range of 6.5–8.5, which was in tune with the guidelines established by WHO [31] for the quality of drinking water. According to WHO recommendations, the pH may range from 6.5 to 9.5.
As defined by Adegboyega et al., the temperature that defines the value of the chemical reaction in water ranges from 30 to 32.01 °C [32].
The turbidity, which ranged from 0.5 to 1.51 NTU, was also within WHO’s [31] permissible limits of 5 NTU, i.e., the drinking water supply was of high quality, according to Jordanian standards, as shown in Table 6.
Dissolved oxygen (DO), the maximum oxygen concentration that can dissolve in water, is determined by the temperature of the water, and it can vary from location to location and from time to time. The DO, in the range of 2.26 to 2.31, thus falls within permissible limits given by WHO (2017) [33].
This study’s findings demonstrate that low bacterial counts were correlated with low turbidity values. The reports by Oparaocha et al. [34], as well as the findings of Agbabiaka et al. [35], also support these findings.
The total concentration of dissolved substances in groundwater is measured by TDSs, which is an important parameter for evaluating the quality of groundwater and drinking water. According to Anbazhagan and Nair [36], TDSs refers to fully dissolved minerals in groundwater, such as calcium, chlorides, carbonates, bicarbonates, magnesium, silica, and sodium. According to Adesoji and Ogunjobi [37], who conducted a similar experiment in which the water also exceeded the [38] permissible limits of 500 mg/L recommended by the WHO (2010), the TDS values were 207, 208 and 212 mg/L, respectively, thus within the Jordanian standards [20,31].
The samples had total hardness values of 123, 125 and 130 mg/L, respectively. The reports regarding the recommended permissible limits of 500 mg/L also support these findings. The electrical conductivity of the water samples ranged from 700 to 900 μS/cm, and the average rates were recorded. Water had a higher electrical conductivity due to the dissolved salts.
The EC can be measured indirectly to the determine TDSs. The treated water samples, which were taken after treatment, were found to have the lowest EC values of 372, 376 and 383 μS /cm, respectively, which is a sign of a decrease in the dissolved salts. The electrical conductivity fell within the WHO’s acceptable range of 0–1000 μS /cm [38].
On the one hand, the measurement of pollution indicator parameters, like ammonia and nitrate, demonstrated that all readings were within acceptable ranges (Table 2, Table 3 and Table 4). Additionally, Figure 7 shows that there was a strong correlation between ammonia and the iron concentration in various sampling methods.
The effect of nitrate nitrogen can over stimulate the growth of aquatic plants and algae and result in the eutrophication of surface waters. It can even ‘kill’ a lake by depriving it of oxygen, which can lead to anaerobic conditions in the water bodies and fish deaths. Extremely high levels of nitrate nitrogen can make it harder for fish and other aquatic invertebrates to breathe, which can reduce the diversity of animals and plants in the environment.
The water’s nitrate (NO3−) contents, which were 7.83, 7.88 and 8.23 mg/L, respectively, were low enough to not pose any health hazard to the consumers. In the presence of microbial contamination, a high nitrate content can result in thaemoglobinaemia, or blue baby syndrome, in bottle-fed infants [32]. Therefore, water with a nitrate standard greater than 100 mg/L is not suitable for use in infants. Nitrate is a significant plant nutrient and is a naturally occurring component in the environment. The nitrate standard, given in this study, indicates that the water is less exposed to inorganic components in the auriferous materials. As the nitrate level is within the standard for drinking water, there is no health risk to consumers.
The magnesium ion (Mg2+) was monitored with values of 6.27, 6.34 and 6.12 mg/L for the minimum and maximum levels. These levels did not go above the recommended limit of 30 mg/L for use in drinking water. The overall goal is to use the water quality index (WQI), for drinking water, to evaluate the quality of the groundwater in the Al-Zaatari camp, in Jordan, using the major cations and anions that could be harmful to humans [39]. The WHO-permitted limit for fluoride concentrations is 1.5 mg/L. Therefore, the groundwater can be used for drinking, as it has fluoride concentrations of 0.2 mg/L. The water samples also contain iron, a vital mineral, in its naturally occurring form.
The quartzite rocks of Sheikhpura are an geogenic source of iron in groundwater in India. The literature mentions a similar geogenic source of iron in groundwater [40,41]. According to WHO and BIS drinking-related standards [42], the ideal level of iron is less than 0.1 mg/L and 0.3 mg/L [43]. A comparison of the laboratory results, with the respective threshold values of the aforementioned standard, is shown in Table 6. It also contains the results of the laboratory analyses of the samples. The concentration of manganese ranges from <0.01 to 0.01 mg/L, which is under the permissible limit of 0.1–0.05 mg/L, as recommended by [29,30,32]. Table 6 demonstrates that all other elements are present at concentrations below the permissible limit. The iron concentration ranges from 0.11 to 0.18 mg/L, which is under the permissible limit of 1.0 mg/L, as recommended by WHO. Table 6 shows a comparison of the laboratory results, with the respective threshold values of the aforementioned standards. Table 6 shows that all other elements are present at concentrations below their particular threshold values. The turbidity, sand content, pH, temperature and electrical conductivity were all measured during airlifting and backwashing. The sand content, turbidity, pH, temperature and electrical conductivity were all measured in the well water, which has very low turbidity. Figure 4 depicts the sand content in conjunction with the electrical conductivity. Each screen section met the acceptance criteria, with a sand content of fewer than 50 parts per million and an electrical conductivity of 900 μS/cm. Water with a high salt content and a high sand content, as shown in Figure 4, will have a high electrical conductivity; it will show a high level of impurity in this phase.
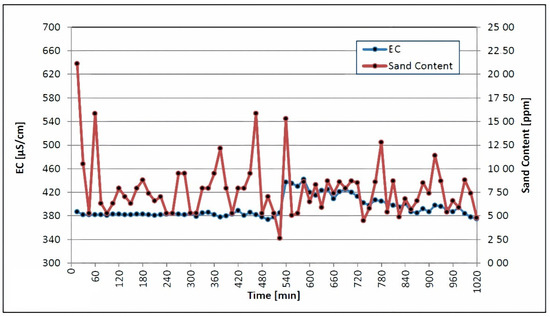
Figure 4.
Electrical conductivity and sand content were measured during backwashing and airlifting.
The swabbing, airlifting and water jetting of the isolated screen sections were simultaneously carried out after the airlift pumping and backwashing procedures. The swabbing tool was moved up and down, in each screen section, until the EC of 700 μS/cm and the sand content of 10 ppm met the EU standards [30]. Figure 5 depicts plots of the sand content and electrical conductivity, which were decreased during the disinfection treatment and the other operation, following the jetting of each screen section; these values were 372 μS/cm, 376 μS/cm, and 383 μS/cm, respectively. The swabbing tool was used in three consecutive steps, with the pressure of the injected water increasing from 7 bar to 14 bar to 20 bar during each step.
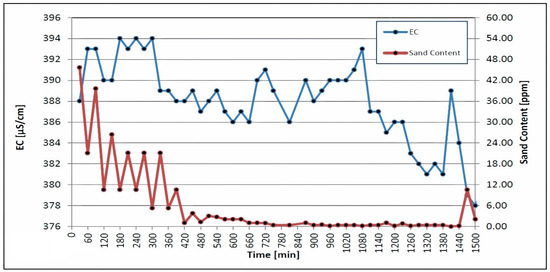
Figure 5.
Electrical conductivity and sand content were measured during airlifting and swabbing.
The second run of swabbing and airlifting followed in the same manner as the first. A high rate of pumping and backwashing occurred at discharge rates of 60.27, 80.22 and 99.83 L/s, respectively. Each step was carried out until the turbidity and sand content was below 5 NTU and 2 ppm, respectively. As depicted in Figure 6, the turbidity and sand content of the discharged water continuously decreased throughout the third step. Proper well development makes it easier to remove turbidity and sand content, which increases the success rate of the disinfection. According to Lechevallier et al., the suspended particles in cloudy water hinder the chlorine’s efforts to kill microorganisms [44].
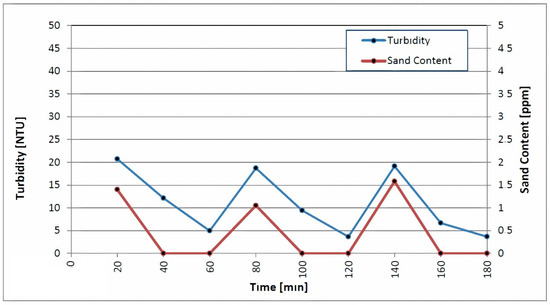
Figure 6.
Measurements of turbidity and sand content during backwashing and high-rate pumping.
The authors concluded that the low removal of turbidity was due to the presence of fine clay particles in raw water, which penetrated the filter [45]. In a full-scale study, turbidity removal was between 0% and 63%, due to the fine particles present in the raw water and the large fraction (4% by weight) of fines in the new sand media used in the study [46]. Turbidity may not be a suitable surrogate for evaluating the removal of pathogens via slow sand filtration because it can achieve the effective removal of microbial pathogens without necessarily reducing turbidity. Table 6 shows that the effect of chlorine on the minerals in the water can cause water from a chlorine-treated water supply system to be turbid. After steady-rate pumping, bacteriological analyses revealed the presence of the aerobic bacteria Acinetobacter haemoliticus and a matching total bacterial count [47].
This higher bacterial count is a clear sign of bacterial regrowth and post-treatment failure or contamination. The total coliform counts did not meet the WHO’s requirement of zero coliform counts in a 100 mL sample. This was a clear indication of contamination and inadequate water infrastructure. Sulphate-reducing bacteria, aerobic bacteria like Sphingomonas pauciummobitis, and coliforms could be found in the treated water. After well sterilization, the total coliform bacteria content was 1.8 MPN/100 mL, which was higher than the threshold (0/100 mL).
The growth of bacteria and the occurrence of coliforms depend on a complex interaction of many factors including temperature, disinfectant type and residual, pipe material, corrosion and other engineering and operational parameters [48,49,50,51]. Recent research has indicated that various disinfectants differ in their ability to interact with biofilm bacteria.
Monochloramine, although a much less reactive disinfectant than free chlorine, is more specific in the type of compounds that it will react with [52]. Therefore, monochloramine can be more effective than free chlorine at penetrating and inactivating certain types of biofilms, particularly those containing corrosion products [53,54].
A study of 30 distribution systems, using free chlorine and chloramines, showed a difference in the density and occurrence of coliform bacteria between systems [51]. Modelling indicates that the penetration of free chlorine into a biofilm is limited by its fast reaction rate [52]. Free chlorine is essentially consumed before it can react with the bacterial components of the film [55]. Chloramines, on the other hand, are slow reacting; they diffuse into the biofilm and eventually inactivate attached bacteria. This is a mechanism that has been demonstrated using an alginate bead model [55,56]. The study showed that free chlorine did not effectively penetrate alginate beads containing bacterial cells, but chloramines penetrated the alginate material and reduced bacterial levels by nearly one million-fold over a 60 min interval (2.5 mg/L chloramines, pH 8.9) [57]. It also reported that hospitals supplied with water containing a chloramine residual were 10 times less likely to experience water-associated legionella infections. Similarly [58], in a study of 166 hospitals, it was found that nosocomial legionellosis was five times less likely to occur in hospitals served with chloraminated water. The authors attributed the effectiveness of chloramines, for legionella control, to the ability of the disinfectant to penetrate biofilms.
In addition to the type of disinfectant used, the residual maintained at the end of the distribution system was also related to coliform occurrences [51]. Systems that maintained dead-end free chlorine levels of less than 0.2 mg/L or monochloramine levels of less than 0.5 mg/L had substantially more coliform occurrences than systems maintaining higher disinfectant residual systems with highly assimilable organic carbon (AOC) levels. Therefore, the maintenance of a disinfectant residual alone does not ensure that treated waters will be free of coliform bacteria.
After well sterilization, the total coliform bacteria content was 1.8, which is also above the threshold (0/100 mL). The authors attributed this effect to the rapid reaction rate of free chlorine and its limited ability to penetrate a biofilm [55]. Free chlorine is consumed before reacting with the film’s bacterial components [55]. On the other hand, chloramines react more slowly; they can diffuse into the biofilm and ultimately inactivate connected microorganisms; this is a system that has been shown utilizing an alginate dot model [55,56]. Free chlorine, according to the study, was unable to penetrate bacterial-filled alginate beads. The concentrations of all the other elements were below their respective thresholds.
The status of the borehole was checked through a closed-circuit television logging unit (CCTV) survey before the assembly of the lasting pump. After well A was completed, from a depth of 284 m to a depth of 545 m, wells B and C were completed, respectively. The first CCTV survey was used for the final check. Some areas, including the dislocate pattern shown in Figure 7, had small biofouling. It was confirmed, via the final CCTV survey and bacteriological laboratory results of the collected water samples, that the ongoing processes of biofouling and corrosion in wells may not affect their productivity or safety. The test results for the water samples taken from sterilized and disinfected wells revealed that neither iron bacteria nor bacteria species/anaerobic bacteria were present in the wells [59].
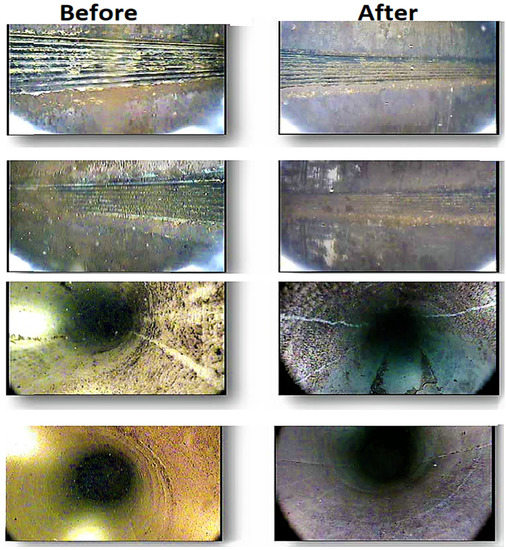
Figure 7.
CCTV images showing the comparison of well cleaning before and after disinfection [59].
The content of total coliform bacteria after well sterilization was <1.8, which is also above the threshold value (0/100 mL). The authors attributed this effect to the fact that the penetration of free chlorine into a biofilm is limited by its fast reaction rate [52]. Free chlorine is essentially consumed before it can react with the bacterial components of the film [55]. Chloramines, on the other hand, react slowly; they can diffuse into the biofilm and eventually inactivate attached bacteria; this is a mechanism that has been demonstrated using an alginate bead model [55,56]. The study showed that free chlorine did not effectively penetrate alginate beads containing bacterial cells. The concentrations of all other elements were below their respective threshold values. According to Table 5, Table 6 and Table 10, the permissible limits of physical–chemical and bacterio-logical parameters are confirmed by the Jordanian standards for drinking water and WHO [20,31].
6. Conclusions
Groundwater quality analysis, drilling, monitoring, the completion of wells and their management benefit from effective decision making that incorporates fulfilment techniques, geostatistical systems and retreating analysis. The solution to this problem was found using a methodology that was defined according to the following objectives:
- Identification of the analytical methods for the determined physicochemical and bacteriological analysis.
- The water tests were investigated and different arrangements of physicochemical parameters, such as the pH, turbidity, total dissolved solids, sodium, potassium, calcium, magnesium, chloride, sulphate, bicarbonate, complete hardness, and nitrate, and different components were shown as medium fixation and as not surpassing the Jordanian Principles of Drinking, which was viewed as being under the permissible limits.
- The acceptable quality of groundwater wells was demonstrated in this case study, conducted to support decision makers in the south of Jordan (Water Authority), by testing the performance of groundwater quality determinations using WQIs. Based on Jordanian standards, the findings suggest that the groundwater is within the permissible limits for human consumption.
- The sterilization solution was pumped via airlifting until the chlorine concentration in the water reached 0 mg/L after a reaction time of approximately 12 h.
- After steady-rate pumping, bacteriological analyses revealed the presence of the aerobic bacteria Acinetobacter haemoliticus. After the final disinfection, sulfate-reducing bacteria, Sphingomonas pauciummobitis (aerobic bacteria), and coliforms could not be found in the water.
Author Contributions
Conceptualization, N.A.-A.; Data curation, H.E.A.-K. and R.T.; Formal analysis, N.A.-A., H.E.A.-K. and M.A.-M. (Marwan Al-Mahasneh); Investigation, M.A.-M. (Mehaysen Al-Mahasneh) and A.A.B.; Methodology, M.A.-M. (Mehaysen Al-Mahasneh), A.A.B. and H.E.A.-K.; Project administration, M.A.-M. (Mehaysen Al-Mahasneh) and H.E.A.-K.; Resources, M.A.-M. (Mehaysen Al-Mahasneh); Software, M.A.-M. (Marwan Al-Mahasneh) and R.T.; Validation, N.A.-A.; Writing—original draft, M.A.-M. (Mehaysen Al-Mahasneh); Writing—review & editing, A.A.B., M.A.-M. (Marwan Al-Mahasneh) and R.T. All authors have read and agreed to the published version of the manuscript.
Funding
This research received no external funding.
Data Availability Statement
Not applicable.
Conflicts of Interest
The authors declare no conflict of interest.
Abbreviations
| CFU | Colony-Forming Unit. |
| NTU | Nephelometric Turbidity Unit. |
| MPN | Most Probable Number technique. |
| LRV | Lowest Reported Value. |
| μS/cm | Electrical conductivity of water |
References
- Baker, M.N. The Quest for Pure Water, the History of Water Purification from the Earliest Records to the Twentieth Century, 2nd ed.; American Water Works Association: Denver, CO, USA, 1981; pp. 258–276. [Google Scholar]
- Whipple, G.C. Disinfection as a Means of Water Purification. In Proceedings of the American Water Works Association, Boston, MA, USA, 26–30 June 1906; pp. 266–280. [Google Scholar]
- Azzirgue, E.M.; Cherif, E.K.; Tchakoucht, T.A.; El Azhari, H.; Salmoun, F. Testing Groundwater Quality in Jouamaa Hakama Region (North of Morocco) Using Water Quality Indices (WQIs) and Fuzzy Logic Method: An Exploratory Study. Water 2022, 14, 3028. [Google Scholar] [CrossRef]
- Hodges, L. Environmental Pollution, 2nd ed.; Rinehart and Winston: New York, NY, USA, 1977; p. 189. [Google Scholar]
- Nova Scotia Canada, Environment and Labour. Disinfection of Water Wells by Chlorination. Available online: www.gov.ns.ca/nse/water (accessed on 8 September 2005).
- Fair, G.M.; Corris, J.; Chang, S.L.; Weil, I.; Burden, R.P. The Behavior of Chlorine as a Water Disinfectant. J. Am. Water Works Assoc. 1948, 40, 1051–1061. [Google Scholar] [CrossRef]
- Kyra, M. Well and Water System Disinfection for Public Drinking Water Systems. PUB2476. 7 January 2013. [Google Scholar]
- Nova Scotia Canada, Environment and Climate Change. The Nova Scotia Groundwater Levels Timeline Map. Available online: www.gov.ns.ca/nse/water (accessed on 16 October 2018).
- British Columbia, Health Link BC, Disinfecting Drinking Water, 2021 Water Quality Annual Report; July 2021; No 49b. Available online: https://www.healthlinkbc.ca/sites/default/files/documents/healthfiles/hfile49b.pdf (accessed on 8 September 2005).
- British Columbia, Health Link BC, Well Water Testing Last Updated: 1 June 2021; No 05b. Available online: https://www.healthlinkbc.ca/sites/default/files/documents/hfile05b.pdf (accessed on 31 March 2013).
- Indiana Department of Environmental Management. Annual Compliance Report for Indiana Public Water Supply Systems. Available online: https://www.in.gov/idem/cleanwater/files/dw_compliance_report_2019.pdf (accessed on 8 July 2020).
- Environment Canada. Groundwater. Ottawa ON: Environment Canada. Available online: https://www.ec.gc.ca/Content/B/3/F/B3F88B37-1223-4B6E-9673-68C356740E90/131101_English_DOE_DPR.pdf (accessed on 31 March 2013).
- Eykelbosh, A.J. Review of Guidelines for Shock Chlorination in Private Wells; the National Collaborating Centre for Environmental Health at the British Columbia Centre for Disease Control; November 2013. Available online: https://www.ncceh.ca/sites/default/files/Shock_Chlorination_Wells_Nov_2013.pdf (accessed on 31 March 2013).
- Cullimore, D.R.; McCann, A.E. The Identification, Cultivation and Control of Iron Bacteria in Groundwater; Academic Press, Inc.: London, UK; Skinner, F.A., Shewan, J.M., Eds.; 1977; pp. 219–261. Available online: https://www.dbi.ca/Books/PDFs/Water-Paper.PDF (accessed on 31 March 2013).
- Wingender, J.; Flemming, H.C. Biofilms in drinking water and their role as reservoirs for pathogens. Int. J. Hyg. Environ. Health 2011, 214, 417–423. [Google Scholar] [CrossRef] [PubMed]
- Macler, B.A.; Merkle, J.C. Current knowledge of groundwater microbial pathogens and their control. Hydrogeol. J. 2000, 8, 29–40. Available online: https://link.springer.com/content/pdf/10.1007/PL00010972.pdf?pdf=inline%20link (accessed on 31 March 2013).
- Schnieders, J.H. Coliforms and Disinfection of Water Well. Water Well J. 2001, 55, 14–15. [Google Scholar]
- Schnieders, J.H. Well Chlorination. Water Well J. 1998, 52, 25–26. [Google Scholar]
- Kachroud, M.; Trolard, F.; Kefi, M.; Jebari, S.; Bourrié, G. Water Quality Indices: Challenges and Application Limits in the Literature. Water 2019, 11, 361. [Google Scholar] [CrossRef]
- Jordanian Institute for Standards and Metrology (JISM). Jordan Water Quality Standards (JWQS); JISM: Amman, Jodan, 2015.
- Tyagi, S.; Sharma, B.; Singh, P.; Dobhal, R. Water Quality Assessment in Terms of Water Quality Index. Am. J. Water ResourcesWater Resour. 2013, 1, 34–38. [Google Scholar] [CrossRef]
- Effendi, H.; Romanto; Wardiatno, Y. Water Quality Status of Ciambulawung River, Banten Province, Based on Pollution Index and NSF-WQI. Proc. Environ. Sci. 2015, 24, 228–237. [Google Scholar] [CrossRef]
- Zeinalzadeh, K.; Rezaei, E. Determining Spatial and Temporal Changes of Surface Water Quality Using Principal Component Analysis. J. Hydrol. Reg. Stud. 2017, 13, 1–10. [Google Scholar] [CrossRef]
- Matta, G.; Nayak, A.; Kumar, A.; Kumar, P. Water Quality Assessment Using NSFWQI, OIP and Multivariate Techniques of Ganga River System, Uttarakhand, India. Appl. Water Sci. 2020, 10, 206. [Google Scholar] [CrossRef]
- Abbasnia, A.; Alimohammadi, M.; Mahvi, A.H.; Nabizadeh, R.; Yousefi, M.; Mohammadi, A.A.; Pasalari, H.; Mirzabeigi, M. Assessment of Groundwater Quality and Evaluation of Scaling and Corrosiveness Potential of Drinking Water Samples in Villages of Chabahr City, Sistan and Baluchistan Province in Iran. Data Brief 2018, 16, 182–192. [Google Scholar] [CrossRef] [PubMed]
- Brown, R.M.; McClelland, N.I.; Deininger, R.A.; Landwehr, J.M. Validating the WQI. In Proceedings of the National Meeting of American Society of Civil Engineers on Water Resources Engineering, Washington, DC, USA, 29 January–2 February 1973; Volume 29. [Google Scholar]
- Nabizadeh, R.; Valadi, A.M.; Alimohammadi, M.; Naddafi, K.; Mahvi, A.H.; Yousef, Z.S. Development of Innovative Computer Software to Facilitate the Setup and Computation of Water Quality Index. J. Environ. Health Sci. Eng. 2013, 11, 1. [Google Scholar] [CrossRef] [PubMed]
- Paun, I.; Cruceru, L.V.; Chiriac, F.L.; Niculescu, M.; Vasile, G.G.; Marin, N.M. Water Quality Indices—Methods for Evaluating the Quality Of Drinking Water, Incd Ecoind—International Symposium—“The Environment And The Industry”; INCD Ecoind: Bucuresti, Romania, 2016; pp. 395–402. [Google Scholar]
- European Council. Council Directive 98/83/EC on the Quality of Water Intended for Human Consumption as Amended by Regulations 1882/2003/EC and 596/2009/EC—OJ L330 of 05/12/1998—23 p. 1998. Available online: https://eur-lex.europa.eu/legal-content/EN/TXT/PDF/?uri=CELEX:01998L0083-20151027&from=EN (accessed on 31 March 2013).
- World Health Organization (WHO). International Standards for Drinking Water, 3rd ed.; WHO: Geneva, Switzerland, 2006; pp. 10–15. [Google Scholar]
- WHO. Guidelines for Drinking-Water Quality, 4th ed.; Incorporating the 1st Addendum; WHO: Geneva, Switzerland, 2017. [Google Scholar]
- Adegboyega, A.M.; Olalude, C.B.; Odunola, O.A. Physicochemical and bacteriological analysis of water samples used for domestic purposes in Idi Ayunre, Oyo State, Southwestern Nigeria. IOSR J. Appl. Chem. 2010, 8, 46–50. [Google Scholar]
- Hyarat, T.; Al Kuisi, M. Comparison between Weighted Arithmetic and Canadian Council of Ministers of the Environment Water Quality Indices performance in Amman-Zarqa Area, Jordan. Jordan J. Earth Environ. Sci. 2021, 12, 295–305. [Google Scholar]
- Oparaocha, E.T.; Iroegbu, O.C.; Obi, R.K. Assessment of quality of drinking water sources in the Federal University of Technology, Owerri, Imo state, Nigeria. J. Appl. Biosci. 2010, 32, 1964–1976. [Google Scholar]
- Agbabiaka, T.O.; Sule, I.O.; Oyeyiola, G.P. Spatial assessment of public water supplies in densely populated areas of Ilorin Metropolis, Kwara State, Nigeria. Fountain J. Natural Appl. Sci. 2014, 3, 20–28. [Google Scholar]
- Anbazhagan, S.; Nair, A.M. Geographic information system and groundwater quality mapping in Panvel Basin, Maharashtra, India. Environ. Geol. 2004, 45, 753–761. [Google Scholar] [CrossRef]
- Adesoji, A.T.; Ogunjobi, A.A. Occurrence of multidrug-resistant bacteria in selected water distribution systems in Oyo State, Nigeria. Glob. Vet. 2013, 11, 214–224. [Google Scholar]
- WHO. Guidelines for Drinking Water Quality, 3rd ed.; World Health Organization: Geneva, Switzerland, 2010. [Google Scholar]
- Obeidat, M.; Awawdeh, M. Assessment of groundwater quality in the area surrounding Al-Zaatari Camp, Jordan, using cluster analysis and water quality index (WQI). Jordan J. Earth Environ. Sci. 2021, 12, 187–197. [Google Scholar]
- Rao, N.S. Iron content in groundwaters of Visakhapatnam environs, Andhra Pradesh, India. Environ. Monit. Assess. 2008, 136, 437–447. [Google Scholar] [CrossRef]
- Amanambu, A.C. Geogenic contamination: Hydrogeochemical processes and relationships in Shallow Aquifers of Ibadan, South-West Nigeria. Bull. Geogr. Phys. Geogr. Ser. 2015, 9, 5–20. [Google Scholar] [CrossRef]
- World Health Organization. Guidelines for Drinking-Water Quality, 4th ed.; World Health Organization: Geneva, Switzerland, 2011; 564p. [Google Scholar]
- Specification IS 10500; Indian Standard Drinking Water. Bureau of Indian Standards: New Delhi, India, 2012.
- LeChevallier, W.M.; Au, K.-K. Water Treatment and Pathogen Control: Process Efficiency in Achieving Safe Drinking Water; Iwa Publishing: London, UK, 2004. [Google Scholar]
- World Health Organization (WHO). Health Criteria and Other Supporting Information. In Guidelines for Drinking-Water Quality, 2nd ed.; WHO: Geneva, Switzerland, 1996; Volume 2. [Google Scholar]
- Ongerth, J.E. Evaluation of Treatment for Removing Giardia Cysts. J. AWWA 1990, 82, 85–96. [Google Scholar] [CrossRef]
- Eniola, K.I.; Odaibo, A.D.; Olayemi, A.B.; Ajiboye, T.O. Bacteriological assessment of treated piped water in parts of Ilorin Metropolis. Niger. J. Microbiol. 2015, 28, 2797–2803. [Google Scholar]
- Berger, P.S.; LeChevallier, M.W.; Reasoner, D.J. Control of Biofilm Growth in Drinking Water Distribution Systems; Office of Research and Development: Washington, DC, USA, 1992.
- LeChevallier, M.W. Biocides and the Current Status of Biofouling Control in Water Systems; Springer: Berlin, Germany, 1991; pp. 113–132. [Google Scholar]
- LeChevallier, M.W.; Schulz, W.; Lee, R.G. Bacterial nutrients in drinking water. Appl. Environ. Microbiol. 1991, 57, 857–862. [Google Scholar] [CrossRef] [PubMed]
- LeChevallier, M.W.; Welch, N.J.; Smith, D.B. Full-scale studies of factors related to coliform regrowth in drinking water. Appl. Environ. Microbiol. 1996, 62, 2201–2211. [Google Scholar] [CrossRef]
- De Beer, D.; Srinivasan, R.; Stewart, P.S. Direct measurement of chlorine penetration into biofilms during disinfection. Appl. Environ. Microbiol. 1994, 60, 4339–4344. [Google Scholar] [CrossRef]
- LeChevallier, M.W.; Lowry, C.D.; Lee, R.G. Disinfection of biofilms in a model distribution system. J. Am. Water Works Assoc. 1990, 82, 87–99. [Google Scholar] [CrossRef]
- Norton, C.D.; LeChevallier, M.W. Chloramination: Its effect on distribution system water quality. J. Am. Water Works Assoc. 1997, 89, 66–77. [Google Scholar] [CrossRef]
- Chen, X.; Stewart, P.S. Chlorine penetration into artificial biofilm is limited by a reaction-diffusion interaction. Environ. Sci. Technol. 1996, 30, 2078–2083. [Google Scholar] [CrossRef]
- Stewart, P.S.; McFeters, G.A.; Huang, C.T. Biofilm Control by Antimicrobial Agents; Bryers, J.D., Ed.; John Wiley & Sons: New York, NY, USA, 2000. [Google Scholar]
- Kool, J.C.; Carpenter, J.C.; Fields, B.S. Effect of monochloramine disinfection of municipal drinking water on risk of nosocomial Legionnaires’ disease. Lancet 1999, 353, 272–277. [Google Scholar] [CrossRef]
- Heffelfinger, J.D.; Kool, J.L.; Fridkin, S.; Fraser, V.J.; Hageman, J.; Carpenter, J.; Whitney, C.G.; Society for Healthcare Epidemiology of America. Risk of hospital-acquired Legionnaires’ disease in cities using monochloramine versus other water disinfectants. Infect. Control Hosp. Epidemiol. 2003, 24, 569–574. [Google Scholar] [CrossRef] [PubMed]
- Manasneh, M.A. Disinfection Water Wells and Sterilization. Comput. Water Energy Environ. Eng. 2016, 5, 38–46. [Google Scholar] [CrossRef]


Disclaimer/Publisher’s Note: The statements, opinions and data contained in all publications are solely those of the individual author(s) and contributor(s) and not of MDPI and/or the editor(s). MDPI and/or the editor(s) disclaim responsibility for any injury to people or property resulting from any ideas, methods, instructions or products referred to in the content. |
© 2023 by the authors. Licensee MDPI, Basel, Switzerland. This article is an open access article distributed under the terms and conditions of the Creative Commons Attribution (CC BY) license (https://creativecommons.org/licenses/by/4.0/).