Article

Determination of Environmental Flow Using a Holistic Methodology in Three River Paths in the Tempisque River Basin, Costa Rica

by
Laura Chavarría-Pizarro
1,*,
Fernando Watson-Hernández
2,
Francisco Quesada-Alvarado
3,
Valeria Serrano-Núñez
2,
Ana Lucía Bustos-Vásquez
4,
Karina Fernández-Chévez
4,
Jendry Chacón-Gutierrez
4 and
Isabel Guzmán-Arias
2
1
School of Biology, Instituto Tecnológico de Costa Rica, Cartago 30109, Costa Rica
2
School of Agricultural Engineering, Instituto Tecnológico de Costa Rica, Cartago 30109, Costa Rica
3
Instituto Regional de Estudios en Sustancias Tóxicas (IRET), Universidad Nacional de Costa Rica, Heredia 40101, Costa Rica
4
Instituto Costarricense de Acueductos y Alcantarillados (AyA), San José 10109, Costa Rica
*
Author to whom correspondence should be addressed.
Hydrology 2024, 11(10), 159; https://doi.org/10.3390/hydrology11100159
Submission received: 30 July 2024 / Revised: 17 September 2024 / Accepted: 23 September 2024 / Published: 27 September 2024
(This article belongs to the Special Issue The 10th Anniversary of Hydrology: Inaugurating a New Research Decade)

Abstract

:
The study of environmental flow has garnered significant scientific interest due to the considerable degradation caused by human activities on aquatic ecosystem dynamics. Environmental flow is defined as the quantity, timing, and quality of water flow required to sustain freshwater and estuarine ecosystems while meeting human demands. Research in riverine ecosystems can generate the critical scientific knowledge needed to determine an adequate environmental flow that balances the requirements of both aquatic organisms and human populations. This study is part of a series of investigations aimed at field-testing different methodologies to determine appropriate environmental flow levels for rivers with specific characteristics. In particular, we adapted and validated a holistic methodology for calculating the environmental flow regime in the Tempisque River basin in Costa Rica. This research involved analyzing hydrological parameters, hydraulic conditions, the presence of flow bioindicators, and various anthropogenic uses of the river (such as human consumption, productive, recreational, and cultural activities) to estimate environmental flow requirements throughout the year. The findings indicate that the lower and upper limits of the environmental flow for the studied section of the Tempisque River correspond to the monthly excesses of 95.00% and 64.00%, respectively. These results provide a reliable annual flow regime that can inform decision-making by authorities in water resource management, particularly in regions where there is a high demand for water across different human activities.

1. Introduction

Water is a fundamental resource essential for sustaining life; however, aquatic ecosystems are increasingly facing severe degradation and over-exploitation, often due to a reduction in the flow necessary to preserve biodiversity and maintain the ecosystem services that benefit human populations [1,2]. In many basins, numerous natural processes and human activities require the use of both surface and groundwater in sufficient quantities and qualities [3,4]. As demand for water intensifies, effective water management strategies become increasingly essential, with measurement serving as a critical tool for informed decision-making [5]. To address the challenges posed by altered river flows, the concept of environmental flow has evolved, encapsulated by the following definition: “the quantity, timing, and quality of water flows needed to sustain freshwater and estuarine ecosystems and the human livelihoods and well-being that depend on these ecosystems” [6]. Various methodologies have been developed to evaluate environmental flows, each employing different criteria and thresholds. These methodologies include hydrological, hydraulic, hydrobiological (habitat simulation), holistic, and hybrid approaches [7].
The health of river ecosystems is inherently tied to water availability, and achieving sustainable water management requires a delicate balance between socioeconomic and ecological values [8]. This balance involves considering various factors such as the magnitude, duration, timing, frequency, and rate of change in flows to maintain natural flow patterns on an annual basis [9]. The holistic methodology enables the identification and prediction of both incremental and cumulative impacts on river health, natural resources, biodiversity, and the livelihoods of dependent communities [10]. These approaches demand a thorough analysis that amalgamates multidisciplinary expertise [11,12]. Holistic approaches can be categorized into “bottom-up” methodologies, which construct a modified flow regime by adding flow components to a baseline of zero flows, and “top-down” methodologies, which determine the extent to which a river’s flow regime can be modified before aquatic ecosystems undergo significant changes or face severe degradation [13].
From this perspective, environmental flows aim to establish specific objectives and standards for water use in each river that balance ecosystem preservation with human needs [3,14]. Biological indicators, which assess environmental quality based on the presence, absence, or condition of species, are crucial for this evaluation [15] and are recommended for ecohydraulic studies in regions with high biological diversity, such as the tropics [16,17]. Additionally, hydraulic-habitat models can be used to simulate habitat conditions or develop habitat preference models that correlate with different flow scenarios [18]. These models allow for the quantification of the percentage of habitat available to a species under specific flow conditions [19,20].
Given the unique characteristics of the Tempisque River basin in Guanacaste, Costa Rica—such as its seasonal climate, rich biological diversity, diverse productive and social uses, and high demand for water—there is a pressing need for a holistic basin-scale assessment of the environmental flow regime. Such an assessment would integrate the hydrological conditions with the ecosystems (biological factors) and socioeconomic elements of the area, including the various water uses by local communities. This study aims to integrate all relevant components to ensure the sustainable use of water resources and to support more effective management by the country’s regulatory authorities.

2. Materials and Methods

The Tempisque River basin in Costa Rica is situated on the Pacific side, encompassing an area of 5404.6 km2 and covering 53.00% of the Guanacaste province [21]. The basin experiences an average annual cumulative rainfall of 1873 mm. The rainfall regime is typified by a dry season spanning from January to March, with April serving as a transitional month. The period of precipitation extends from May to November, with December marking the transition to the dry season. The average monthly temperature reaches its maximum of 26.50 °C in April and its minimum of 24.50 °C in January and December [22].
This study focuses on the upper part of the Tempisque River basin that extends to a stream gauge situated within the community of Guardia (Figure 1). This section encompasses an area of 859.74 km2, with elevations ranging from 30 to 1892 m above sea level (MASL). Furthermore, two additional sub-basins were investigated: the Tempisquito River (area: 179.76 km2 and elevation range: 95-1635 MASL) and the Ahogados River (area: 185.46 km2 and elevation range: 91-1808 MASL).

2.1. Hydrological Analysis

In order to ascertain the hydrological regime, the flow data from the Guardia station, spanning the period from 1992 to 2010, were subjected to analysis. A monthly examination of the data was conducted to identify interannual patterns, trends, and variability in the data series.
For each river within the basin, the range of observed flows was established and ordered from lowest to highest. Subsequently, these flows were aggregated to serve as input for the hydraulic modeling and habitat simulation process. This approach was adopted in order to consider the entire spectrum of observed flows, including both minimum and maximum extreme events, enabling an accurate simulation of the impact of variations in depth and flow velocity parameters resulting from changes in flow on fish and aquatic macroinvertebrate habitats.
Concurrently, flow duration curves were generated for each river section and month. This was conducted to identify the exceedance probability value corresponding to the most critical month once the environmental flow range was defined. The objective was to maintain the same probability value for the other months of the year, thereby establishing an interannual environmental flow regime.
It is important to note that while the hydrological year in Costa Rica runs from May to April (of the following year), the monthly results are presented in chronological order to maintain consistency throughout this paper.

2.2. Selection and Analysis of Biological Indicators

The selection of flow indicator species began with a pilot sampling to identify species present at the sampling sites. This approach ensured the representation of species associated with both turbulent rapids and pooled areas. The pilot sampling also served to determine water quality, allowing the avoidance of rivers with low diversity and lacking flow indicator organisms. Furthermore, the database generated by the Costa Rican Ministry of Environment was utilized, which provides information on the physicochemical and biological water quality for the Tempisque River basin, with a specific focus on the Tempisquito and Ahogados rivers [23].
For aquatic macroinvertebrates, the selection process focused on rheophilic species or genera, as it is well-established that waterfalls and turbulent rapids are the first habitats to be affected by flow reductions [24]. It is important to note that these selected species function as “umbrella species”; consequently, by safeguarding their ecological requirements, species with lesser ecological needs are also expected to be protected.
Certain fish and aquatic macroinvertebrate species can serve as reliable indicators of environmental flow. This reliability stems from their adaptation to natural fluctuations in the magnitude, frequency, and duration of flow currents [16].
Samples were collected across various seasons along each river path: the first during the dry season (April 2021), the second during the transition from dry to rainy season (June 2021), the third during the rainy season (September 2021), and the fourth during the transition from rainy to dry season (November 2021). Additionally, to obtain samples under typical dry season conditions, an extra sampling was conducted in March 2022. This additional sampling was necessary due to an unusual rainfall event prior to the April 2021 sampling.
At each sample site (Figure 1), ten aquatic macroinvertebrate samples were obtained. Sampling was conducted randomly along a 50 m transect, positioned transversely to the river during the dry season and longitudinally during the rainy season. The transects were selected based on the following criteria: minimal human disturbance, proximity to hydrometric stations, accessibility, and suitable geomorphology. Along each transect, samples were collected from various microhabitats corresponding to distinct water velocities, including rapids, backwaters, slow-flowing zones, pools, banks, and submerged roots.
Velocimeters were employed in each microhabitat to measure velocity and depth, while substrate type and forest cover (presence or absence) were also recorded. A D-frame net with a 500-micron pore size was utilized, and the substrate was manually agitated to dislodge macroinvertebrates, capturing them within the net. During each sampling session, aquatic insect larvae and nymphs from various families (e.g., Plecoptera, Trichoptera, Ephemeroptera, and Odonata) were collected. These specimens were preserved in 86.00% ethanol for subsequent laboratory identification [21,25]. Aquatic macroinvertebrates were identified to the lowest possible taxonomic level to determine genera recognized as bioindicators of environmental flow.
During the assessment of the collected organisms, two genera were selected for further analysis: Baetodes (Ephemeroptera: Baetidae) and Traverella (Ephemeroptera: Leptophlebiidae). These genera were chosen due to their consistent presence across all three sampling sites and their notably high abundance compared to other organisms. Additionally, their habitat preference for river rapids, which are the macrohabitats most significantly affected by flow reductions, made them ideal candidates for this study [25].
For fish collection, the electrofishing method was employed. This technique involves generating electrical discharges in the water to temporarily immobilize fish, which are then captured using a net. Sampling was conducted along a transect no longer than 100 m, encompassing various microhabitats. The transect was sampled in parallel, and depending on the river flow, also in perpendicular directions. Captured fish were placed in water-filled buckets for identification (to order, family, and genus level) and subsequently released back into the river at the end of the sampling to avoid pseudoreplication.
For determining flow rate preferences, two species were selected: Astyanax aeneus and Amatitlania nigrofasciata. Astyanax aeneus has been documented in various microhabitats influenced by water velocity but is predominantly found in still waters and pools [26]. Amatitlania nigrofasciata has been previously employed as a flow indicator species [17].
Habitat preference curves for flow bioindicators were developed based on their preferences for velocity and depth. These preferences were incorporated into habitat generation or loss models to assess responses to flow changes. To generate the preference curves, we applied the fuzzy point theory proposed by Noack et al. [27]. To determine if there were differences in the types of velocity preferred by aquatic insect larvae, a Kruskal–Wallis test was conducted (due to the non-normal distribution of the data), while for fish, a Wilcoxon test was employed (also due to the non-normality of the data). Velocity categories were classified as fast (>1 m/s), moderate (1 m/s to 0.2 m/s), and slow (<0.2 m/s), according to Quesada-Alvarado et al. [25]. The preference categories for the variables velocity and depth were classified as optimal (values where the highest number of individuals were recorded), regular (individuals were present but in smaller proportions), and inadequate (no presence of organisms, as they avoided this type of habitat).

2.3. Assessment of Regional Socioeconomic Factors

The study aimed to examine water usage patterns and assess the associated social, cultural, economic, and environmental impacts within the Tempisque River basin. Assessments were conducted using a house-to-house survey to gather opinions and perceptions from local communities, and semi-structured interviews were carried out with representatives from major socio-productive entities with interests in the river.
A case study approach was employed, utilizing both quantitative and qualitative triangulation methods for data collection. The use of a survey method and questionnaire as instruments allowed for a contextual analysis of the gathered information.
The population sampling frame was situated in Guardia (Liberia) and Comunidad, Carrillo, Guanacaste. The survey sample size was adjusted to achieve a maximum sampling error of 5.00% with a 95.00% confidence level. While the initial plan was to interview 345 individuals, approximately 302 questionnaires were administered, primarily due to population work schedules.
The survey comprised 45 questions with 64 variables, of which 95.00% were closed-ended questions and pre-coded. The remaining open-ended questions were designed to elicit respondents’ opinions.
Five sections were included in the surveys, covering demographics, family structure, economic aspects and productive activities, infrastructure and basic services, and recreation and environment related to the varying uses of water.

2.4. Establishment of the Environmental Flow Regime

The Building Blocks Method (BBM) was employed based on a comprehensive analysis that considered the water regime behavior of the three river paths during the most critical month (April), the water requirements of the biological indicators, and the flow demands associated with socioeconomic activities.
Two-dimensional hydraulic models were constructed and calibrated for the Tempisquito and Ahogados riverbeds by Serrano-Núñez et al. [28], while the riverbed at Guardia (Tempisque River) was modeled using the Bray equation (1979). Habitat simulations were performed to establish the correlation between the Potential Habitat Unit (PHU) and the circulating flow, utilizing the Instream Flow Incremental Methodology [29]. Iber software served as the computational tool to execute this procedure, facilitating the implementation of the hydraulic model and generating parameters including flow velocity and depth. These parameters were incorporated into the software’s ecological model, which included habitat preferences of the selected species [30], to obtain the Weighted Usable Areas (WUAs). Additionally, preference conditions for socioeconomic activities were modeled, resulting in the generation of Potentially Usable Areas (PUAs) for these activities.
To establish the range of environmental flows for this critical month, lower and upper limits were defined from both blocks. Subsequently, the percentage of excess was extrapolated to the remaining months of the year. This approach provided a framework for maintaining environmental flow in the upper Tempisque River basin throughout the year.
Figure 2 illustrates the workflow executed throughout the course of this study.

3. Results

3.1. Hydrological Regime

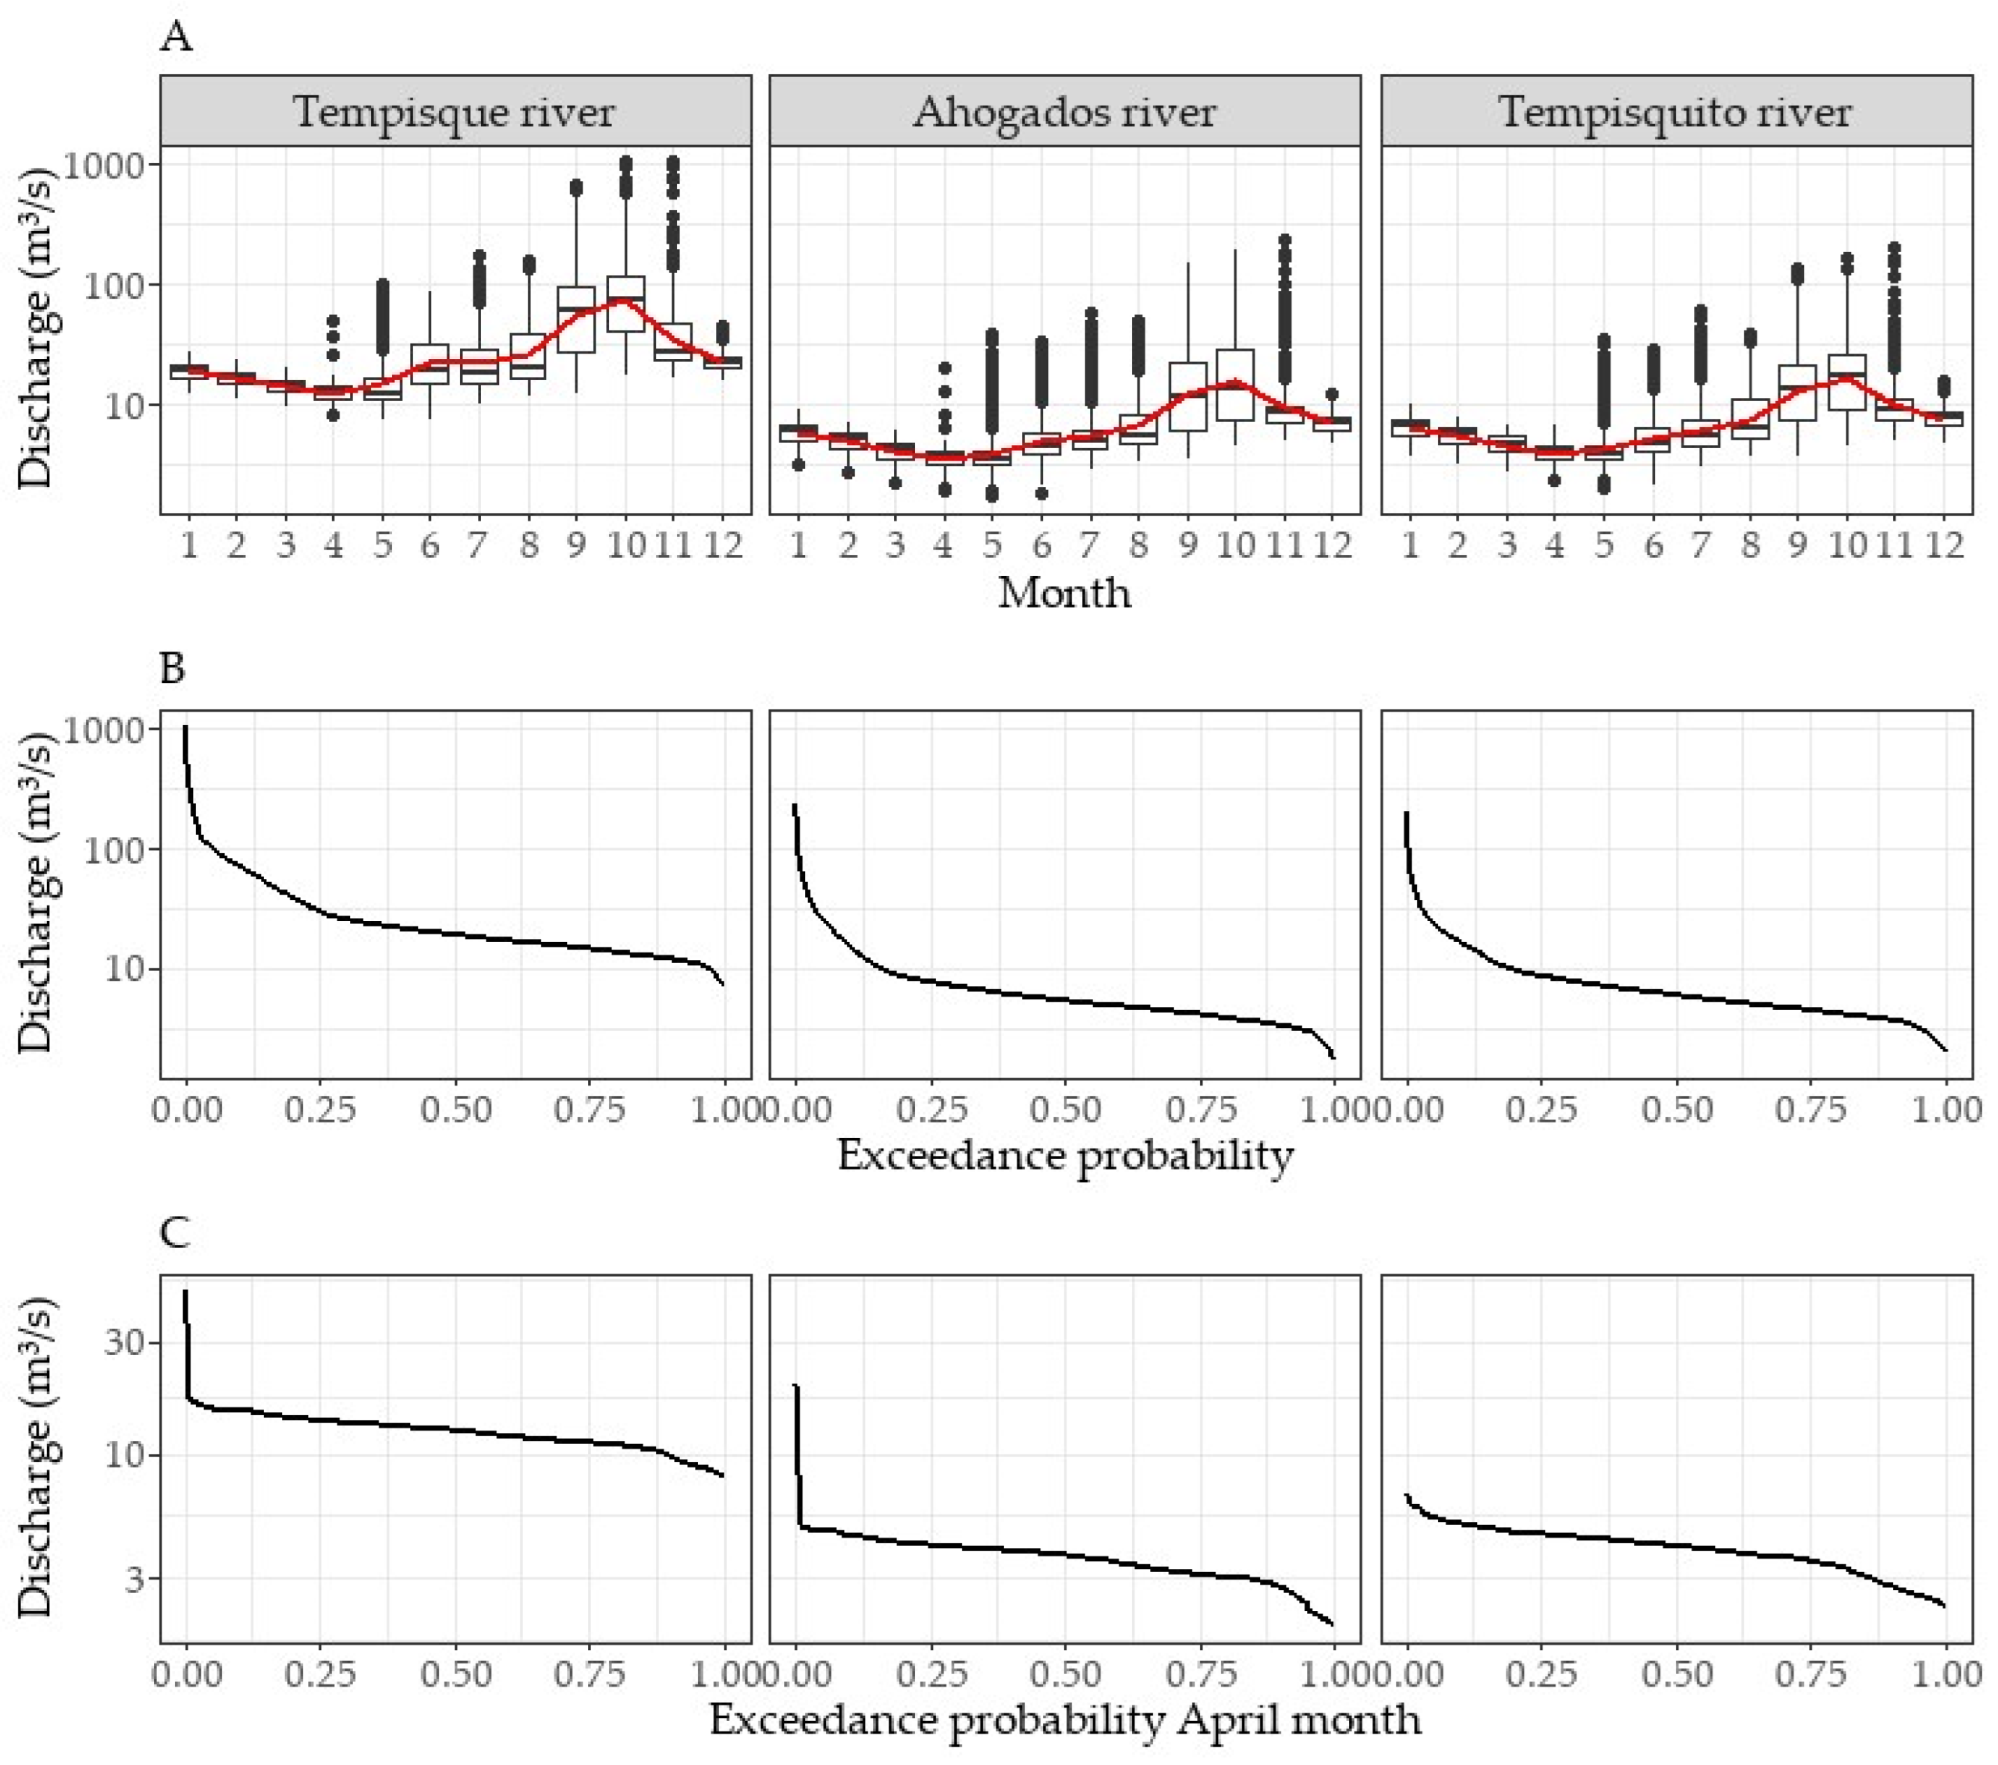
Time series analysis revealed that the Tempisque River basin exhibited excess flows of 10.00%, 50.00%, and 90.00% above the average flows of 71.19 m3/s, 19.11 m3/s, and 11.98 m3/s, respectively (Figure 3A). The maximum observed flow rate was 1038.32 m3/s, while the minimum was 7.30 m3/s. The maximum value occurred on October 1 1999 during a year classified as having a strong intensity “La Niña” event within the El Niño–Southern Oscillation (ENSO) cycle. The minimum value was observed on 19 May 1992, which coincided with a strong intensity “El Niño” year.
The water regime displays a period of low flow from December to April, with May serving as a transitional month. October exhibits the highest average flow, followed by a decrease in November. The lowest flow averages of the year were recorded in April at all three rivers, with measurements of 7.82 m3/s in Tempisque River, 3.01 m3/s in Ahogados River, and 3.34 m3/s in Tempisquito River (Figure 3C).
The exceedance curves of the Tempisquito River and Ahogados River basins exhibit similar patterns, with Ahogados River displaying the most extreme events in both minimum and maximum flows. Tempisquito River has a minimum flow of 2.05 m3/s and a maximum of 203.86 m3/s, while Ahogados River records a minimum of 1.70 m3/s and a maximum of 233.83 m3/s.
The flow exceedance percentages of 10.00%, 50.00%, and 90.00% for both basins range from 18.00–19.00 m3/s, 4.50–5.20 m3/s, and 2.88–3.10 m3/s, respectively (Figure 3B).

3.2. Biological Indicators for Environmental Flow Requirements

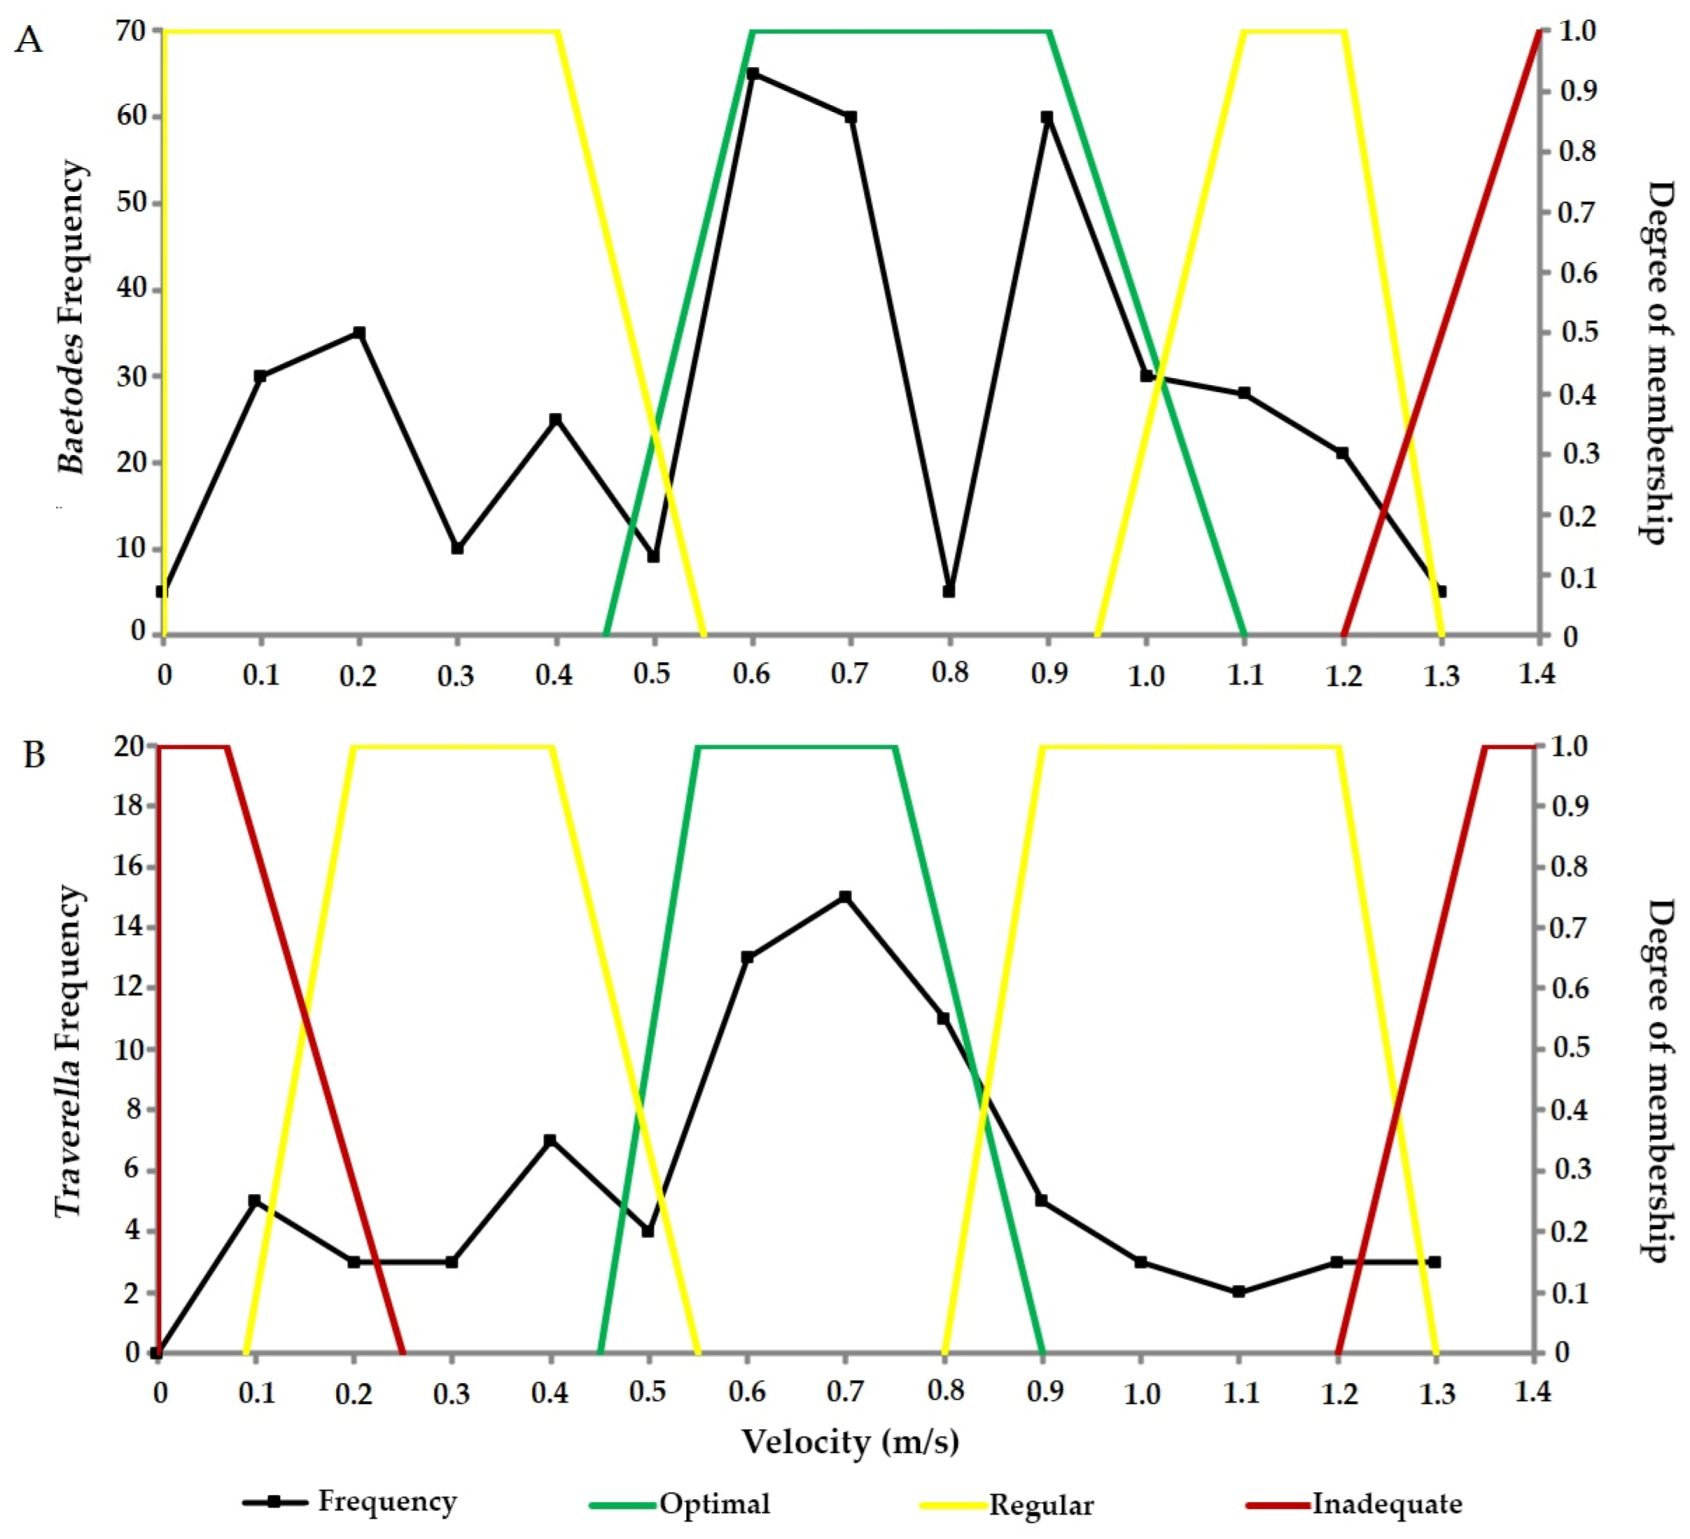
Regarding habitat preference for Baetodes (Figure 4A), velocities between 0.45 and 1.10 m/s are optimal, while those less than 0.45 m/s are considered regular. For Baetodes, slower velocities were not deemed unsuitable, as organisms were recorded at 0.00 m/s. Additionally, velocities classified as moderate and strong fall within a regular range of 0.95 m/s to 1.30 m/s. Velocities higher than 1.20 m/s are inadequate.
In the case of Traverella (Figure 4B), a larger number of individuals were observed at velocities ranging from 0.35 to 0.85 m/s, making this range optimal. Velocities below 0.45 m/s were categorized as normal, whereas those lower than 0.25 m/s were inadequate. Meanwhile, the range between 0.80 to 1.30 m/s was also considered regular at higher velocities. Finally, velocities above 1.10 m/s were considered inadequate.
In both cases, no significant differences were recorded in the number of larvae present across velocity categories (Baetodes, H = 0.3717; p > 0.05; Traverella, H = 0.8439; p > 0.05); however, a higher relative abundance was observed in the moderate category.
Regarding depth, Baetodes demonstrated greater abundance at 11 to 20 cm, followed by a significant decrease. At depths exceeding 41 cm, the frequency of nymphs was less than 20 individuals. The same trend was observed in shallow waters. Consequently, the optimal range for this species can be considered 11 cm to 30 cm, while depths less than 5 cm and greater than 70 cm were deemed unsuitable habitats. For Traverella, the optimum depth range was between 11 cm and 40 cm, where the highest number of nymphs was observed. Depths ranging from 5 cm to 10 cm and from 41 cm to 60 cm were considered typical. Depths less than 5 cm and greater than 61 cm were deemed inadequate, as no individuals were recorded at any sampling site for these depths.
The species A. aeneus (Figure 5A) was recorded most frequently at slower velocities (<0.50 m/s), with a peak of individuals at 0.10 m/s. Consequently, the optimal velocity range is between 0.00 and 0.60 m/s. An increase in water velocity led to a reduction in the number of individuals recorded. At velocities exceeding 1.30 m/s, no individuals were observed, implying that moderate and strong velocities are inappropriate for the presence of this species.
For A. nigrofasciata (Figure 5B), the optimal velocity range is 0.00–0.55 m/s, where the highest number of individuals were recorded. Like Astyanax, this species prefers slow to moderate velocities. While the species was not recorded under conditions of strong and turbulent velocities, it is considered to be present at regular and insufficient velocities.
Both species show a significant difference in the number of individuals recorded per category type (A. aeneus, W = 1596; p < 0.05; A. nigrofasciata, W = 1711; p < 0.05), with slow water being the most preferred.
Regarding depth variation, A. aeneus exhibited the greatest abundance between 11 and 40 cm, identifying this range as the optimal habitat. However, at shallow depths (<10 cm), no individuals were recorded, rendering this depth range inadequate. Depths between 41 cm and 70 cm are deemed regular, whereas depths greater than 71 cm are considered inadequate due to the absence of recorded individuals.
A. nigrofasciata showed higher abundance in the range of 21–50 cm, indicating that this range is the optimum depth. At shallower depths between 0–20 cm, it exhibited low abundance, qualifying this range as a regular habitat. This classification also applies to depths between 51 and 70 cm. However, beyond 71 cm, the habitat is considered unsuitable.
Table 1 provides a summary of the habitat classification for both the velocity and depth variables for the four selected biological indicators.

3.3. Socioeconomic Factors for Environmental Flow Requirements

The water depth references required for the activities listed in Table 2 were directly related to the height of the respondents (mean: 164 cm [31]). The depth categories were defined as follows: “high” (water depth of 132 cm, above the shoulder), “medium” (78 cm, up to the waist) “low” (45 cm, equal or comparable to the height of half a leg), and “none” (0 cm, associated with the height of the calf).
Respondents indicated that the river should be very deep for the following activities: agricultural activities related to irrigation (78.00%), tourism activities (44.00%), and mechanized sand mining (37.00%). For activities such as subsistence fishing (46.00%) and recreational activities (56.00%), respondents indicated that the river should be of medium depth. Artisanal sand mining (50.00%) and daily activities (48.00%) can be carried out at shallow depths.

3.4. Environmental Flow

3.4.1. Weighted Usable Areas (WUAs)

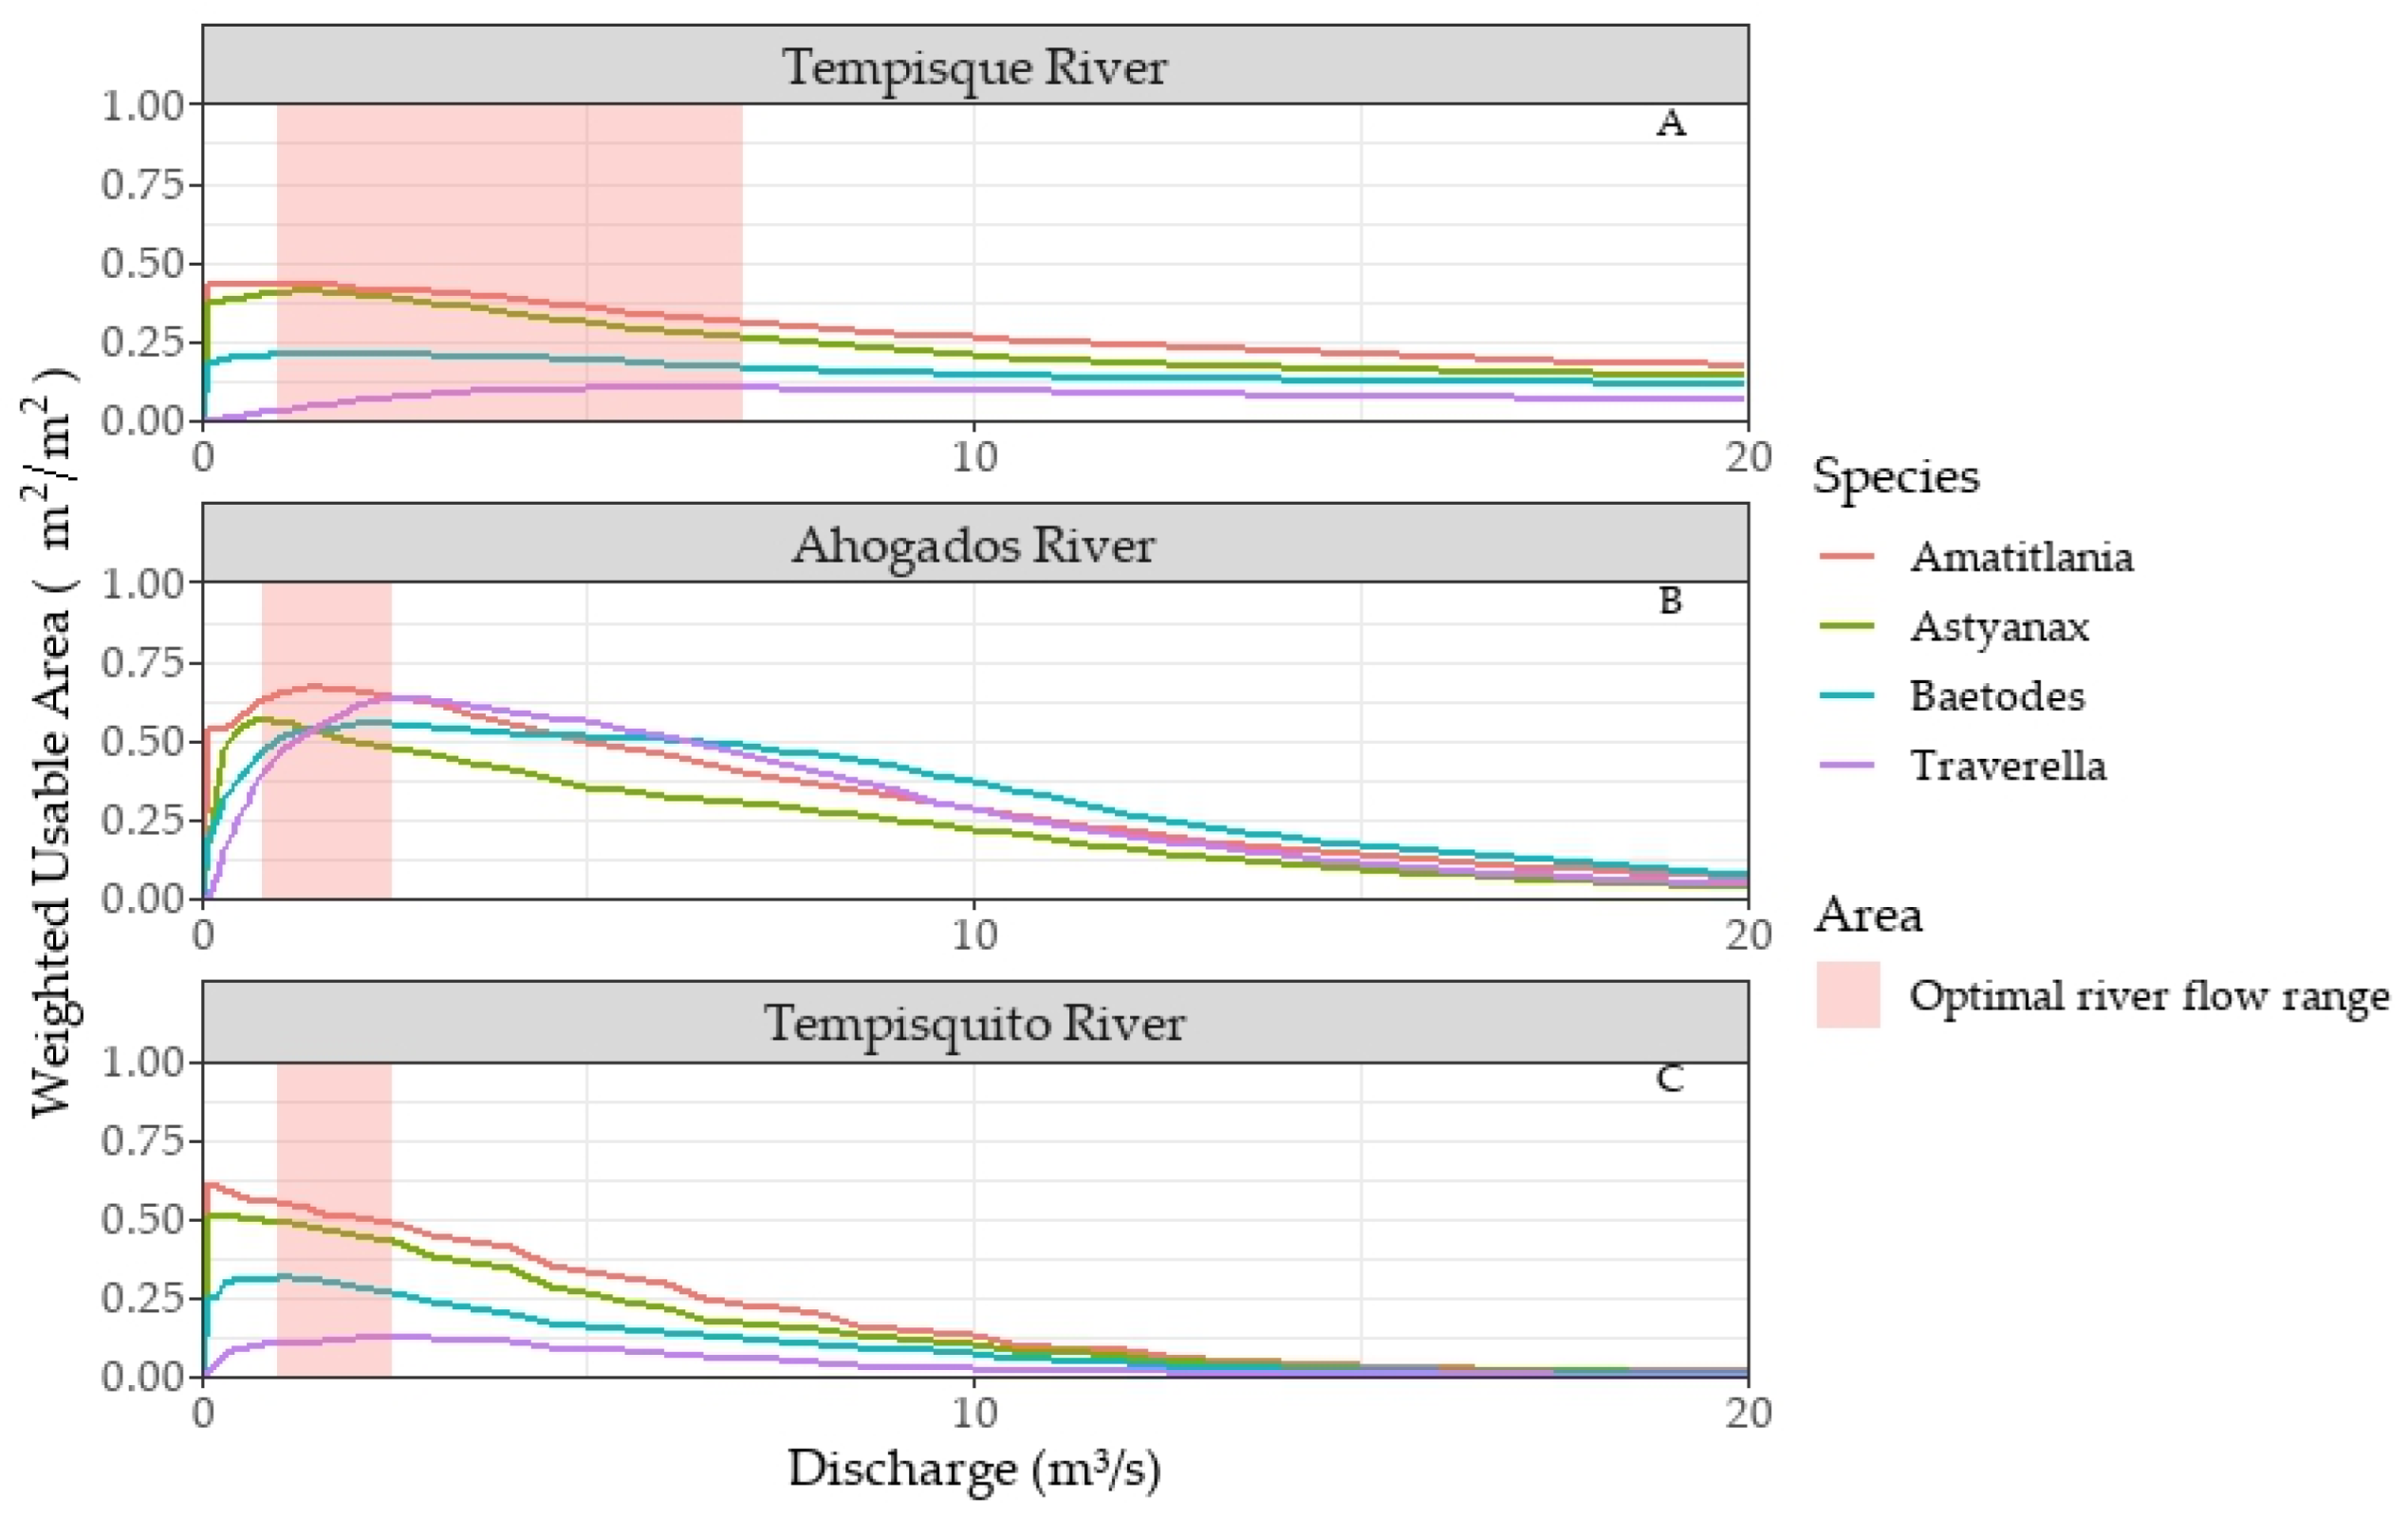
Habitat modeling of the Tempisque River in Guardia (Figure 6A) produced the following maximum WUA values: 0.44 m2/m2 at 1.00 m3/s for A. nigrofasciata, 0.41 m2/m2 at 1.40 m3/s for A. aeneus, 0.21 m2/m2 at 1.79 m3/s for Baetodes, and 0.10 m2/m2 at 7.00 m3/s for Traverella. The optimal flow range is 1.00 to 7.00 m3/s, with 3.99 m3/s generating the highest possible WUA for all species combined.
For the Ahogados River path (Figure 6B), the WUA reached maximum values of 0.67 m2/m2 at a flow of 1.60 m3/s for A. nigrofasciata, 0.57 m2/m2 at 0.80 m3/s for A. aeneus, 0.56 m2/m2 at 2.00 m3/s for Baetodes, and 0.64 m2/m2 at 2.50 m3/s for Traverella. The flow range yielding the highest WUA values is 0.80 to 2.50 m3/s (optimal flow range), with 1.60 m3/s producing the highest possible WUA for all species combined.
In the Tempisquito River (Figure 6C), maximum WUA values were 0.61 m2/m2 at 0.10 m3/s for A. nigrofasciata, 0.51 m2/m2 at 0.20 m3/s for A. aeneus, 0.32 m2/m2 at 1.00 m3/s for Baetodes, and 0.13 m2/m2 at 2.50 m3/s for Traverella. The optimal flow range, where the highest WUA values occur, is 1.00 to 2.50 m3/s, with 1.75 m3/s yielding the highest possible WUA for all species collectively.
The rise in water flow leads to a loss of suitable habitat due to increased water speed and depth. In Ahogados River, reduced flows result in a significant decrease in the available area. For instance, a flow of 0.20 m3/s results in the WUA of A. nigrofasciata dropping to 0.54 m2/m2. However, for Traverella, the reduction is much more drastic. The preferred conditions of velocity and depth drop to just 7.00% of the total area. Flows beyond the optimal range also cause WUA reductions, albeit less drastically. A flow of 5 m3/s produces an available area range of 0.43 m2/ m2, while 15 m3/s generates an average WUA of 0.13 m2/m2. At 25.00 m3/s, the available area drops to a value of 0.02 m2/ m2 (Figure 6B).
Increasing water flow leads to a loss of suitable habitat due to elevated water speed and depth. In the Ahogados River, reduced flows significantly decrease the available area. For example, at 0.20 m3/s, the WUA for A. nigrofasciata drops to 0.54 m2/m2. The reduction is more drastic for Traverella, with preferred velocity and depth conditions falling to just 7.00% of the total area. Flows beyond the optimal range also cause WUA reductions, albeit less severely. A flow of 5.00 m3/s produces an available area range of 0.43 m2/m2, while 15 m3/s generates an average WUA of 0.13 m2/m2. At 25.00 m3/s, the available area further decreases to 0.02 m2/m2 (Figure 6B).
In the Tempisquito River, the optimal habitat for fish species decreased with increasing flow. Flows below 1 m3/s provided more usable habitat for the two fish species, while aquatic insects required flow rates between 1 and 3 m3/s (Figure 6C). In Guardia, flow rates below 1 m3/s resulted in suboptimal habitats for flow bioindicator organisms, as reduced velocity and depth had adverse impacts (Figure 6A).

3.4.2. Potentially Usable Areas (PUAs)

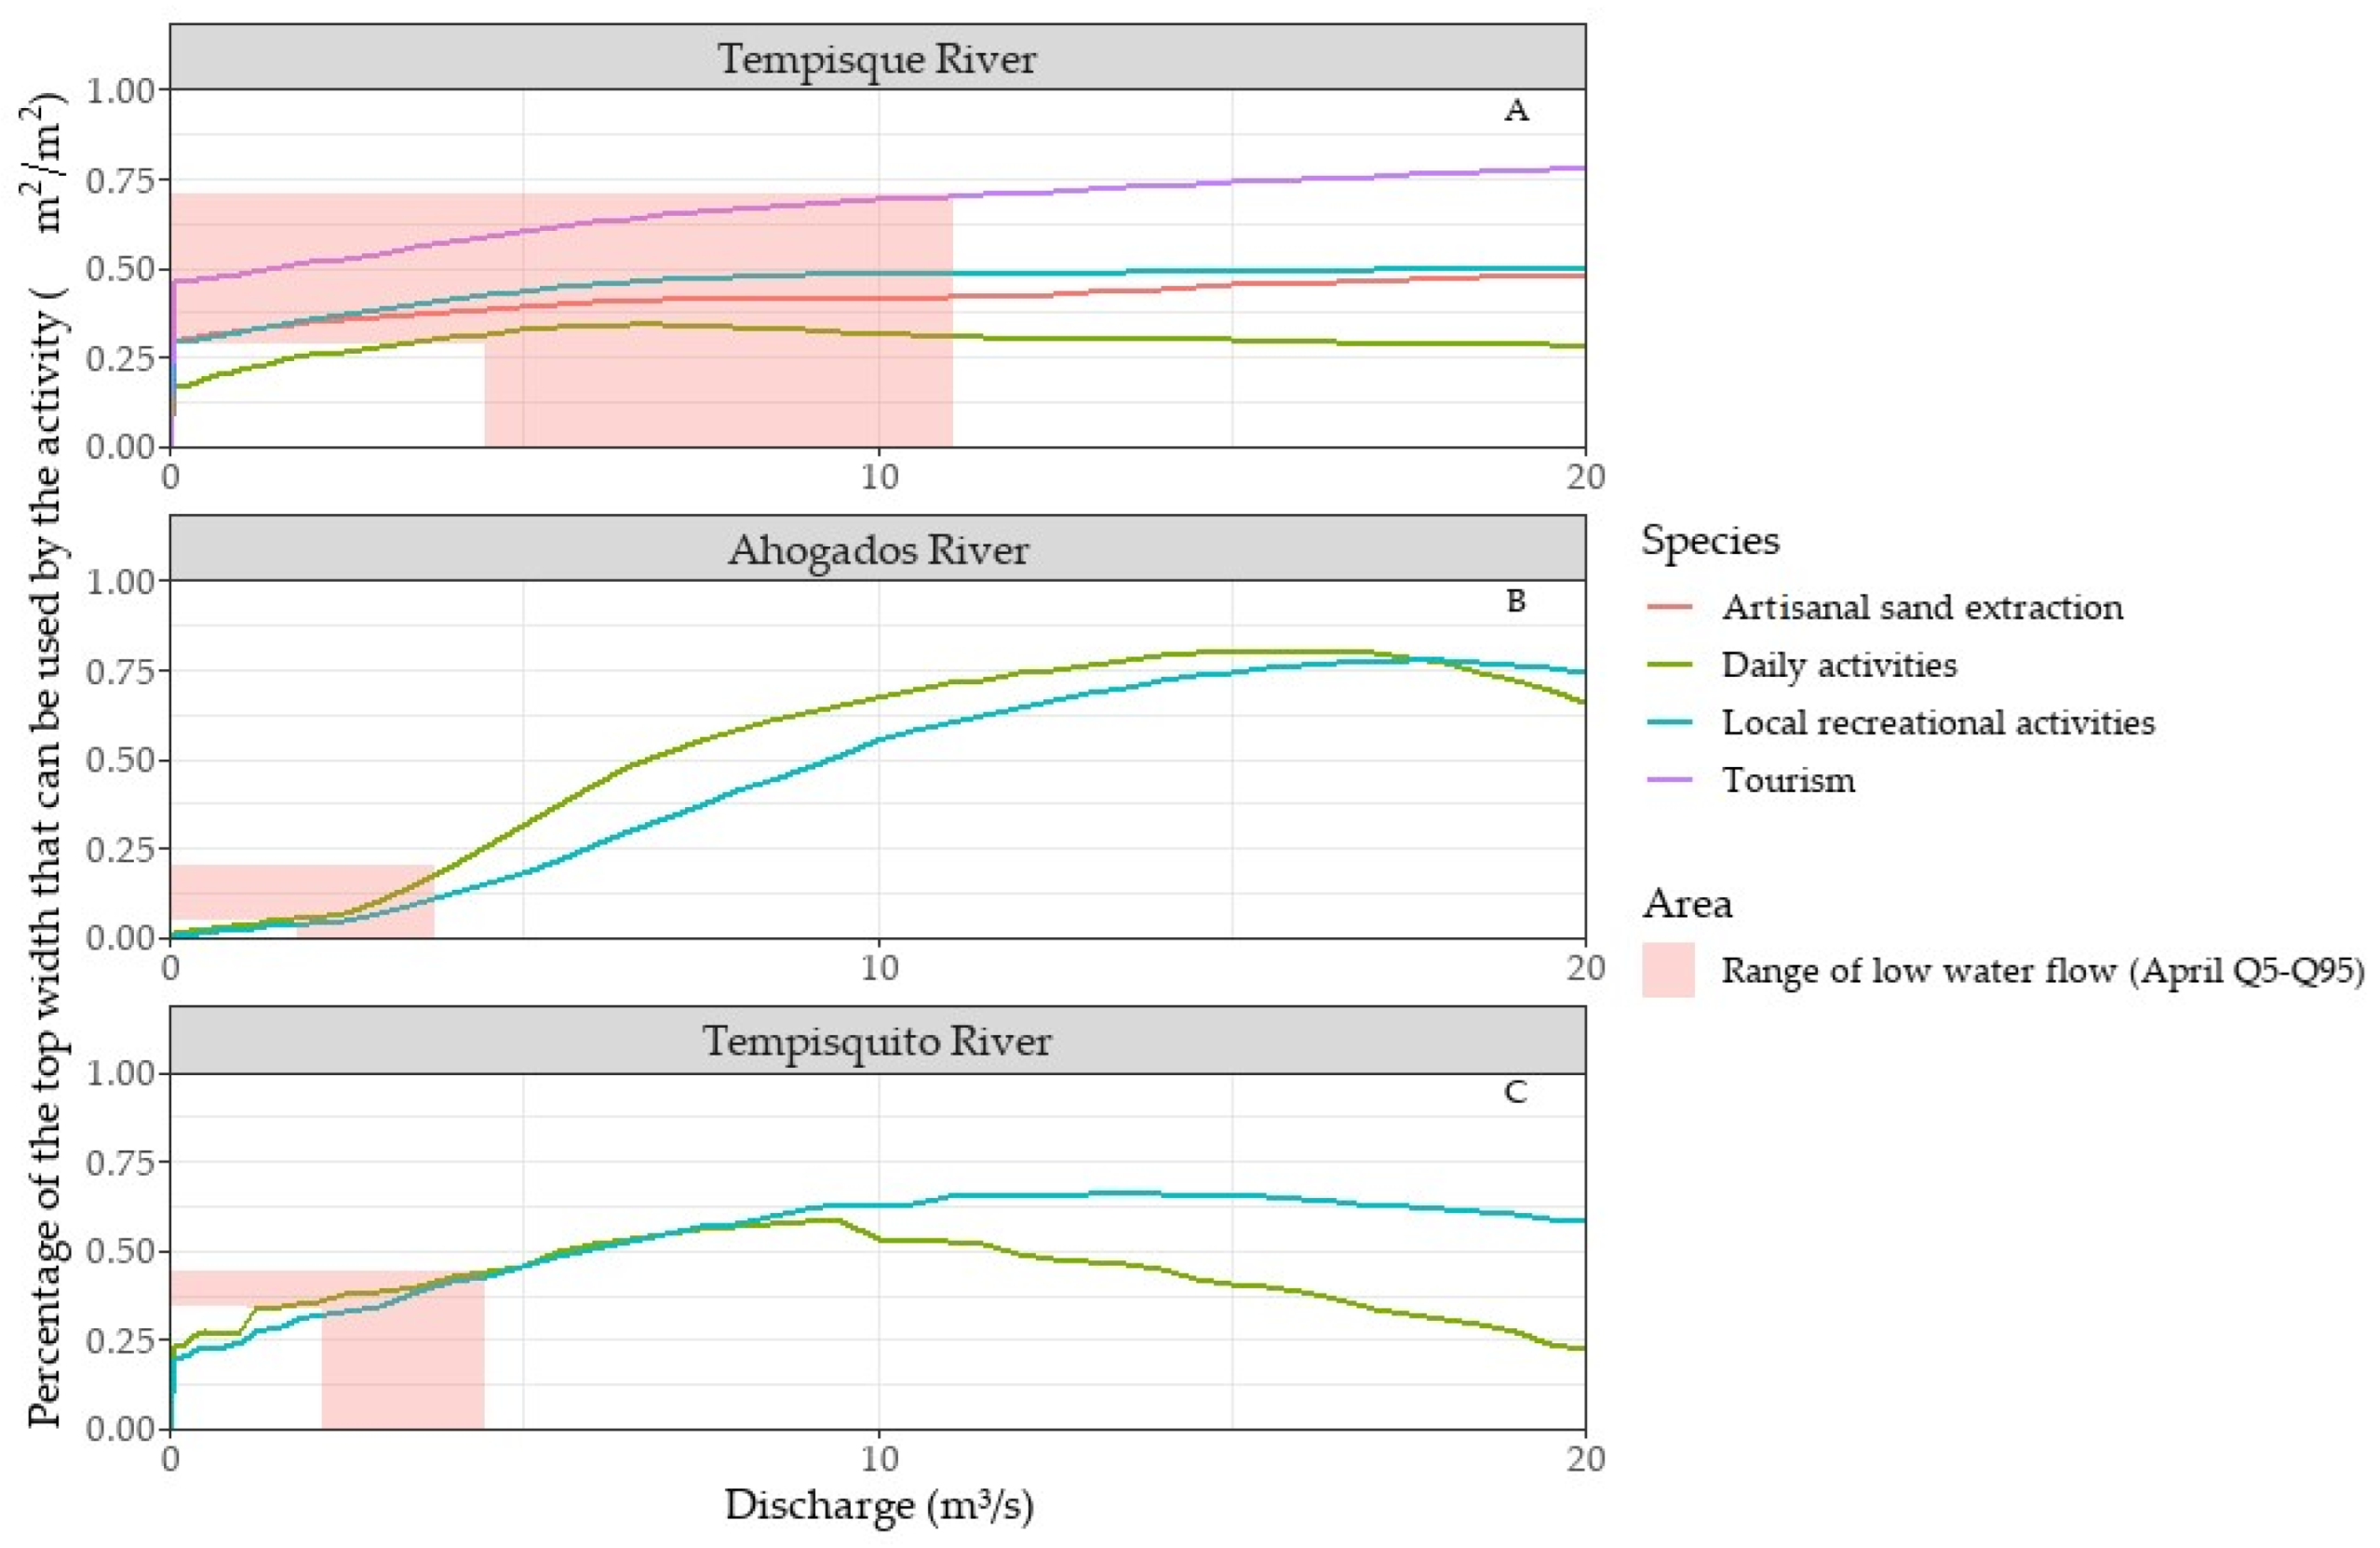
The study examined the daily and recreational activities of the population alongside the needs of non-extractive economic activities such as tourism and artisanal sand mining (Figure 7).
In April, when the monthly average flow is lowest at 7.82 m3/s, the PUA is 0.33 m2/m2 for daily activities, 0.48 m2/m2 for recreation, 0.67 m2/m2 for tourism, and 0.41 m2/m2 for sand mining, covering the flow range between the 5th (4.46 m3/s) and 95th (11.08 m3/s) percentiles, demonstrating usable area variations for the four activities along the Tempisque River path in Guardia.
The PUA ranges in the Tempisque River are as follows: 0.32–0.39 m2/m2 for daily activities, 0.42–0.48 m2/m2 for recreational activities, 0.59–0.70 m2/m2 for tourism, and 0.39–0.42 m2/m2 for sand mining (Figure 7A).
In the Ahogados and Tempisquito rivers’ study paths, the simulation of the PUA considered the depth preferences for daily and recreational activities, as these are the primary activities.
The average flow for the Ahogados River (Figure 7B) in April is 3.01 m3/s, yielding a PUA of 0.10 m2/m2 for daily activities and 0.07 m2/m2 for recreational activities. Analysis of the flow range between the 5th (1.82 m3/s) and 95th (3.75 m3/s) percentiles for April reveals notable variations in the PUA, 0.053–0.18 m2/m2 for daily activities, and 0.04–0.11 m2/m2 for recreational activities. In contrast, maximum flows occur in October, ranging from 5.29 m3/s (Q5) to 84.78 m3/s (Q95), resulting in PUA of 0.02–0.37 m2/m2 for daily activities and 0.26–0.51 m2/m2 for recreational activities.
For the Tempisquito River (Figure 7C), the mean flow rate in April is 3.34 m3/s, yielding PUAs of 0.40 m2/m2 and 0.39 m2/m2 for daily and recreational activities, respectively. The flow range between the 5th (2.17 m3/s) and 95th (4.47 m3/s) percentiles show PUAs of 0.35–0.44 m2/m2 for daily activities and 0.31–0.42 m2/m2 for recreational activities. In contrast, the maximum flows occurring in October range from 5.54 m3/s (Q5) to 76.99 m3/s (Q95), resulting in PUAs of 0.02–0.50 m2/m2 for daily activities and 0.49–0.50 m2/m2 for recreational activities.

3.4.3. Environmental Flow Regime

To ensure the water needs of A. nigrofasciata, A. aeneus, Baetodes, and Traverella during the most critical month of April, an analysis was conducted considering both the water requirements of these species and the flow demands associated with socioeconomic activities.
This study has established a lower and upper limit that defines the environmental flow, required for the critical month. These lower and upper limits are defined by the interception between the optimal flow range of the indicator species (range where the habitat peaks are found) and the observed flow range for the month of April, ensuring the protection of PUA for socioeconomic activities. The environmental flow ranges for the studied rivers are 1.82 m3/s to 2.50 m3/s for Ahogados River, 2.17 m3/s to 2.50 m3/s for Tempisquito River, and 4.46 m3/s to 7.00 m3/s for Tempisque River (Table 3).
The flow range between the upper and lower limits was associated with the flow duration curve of each studied river to maintain these same percentages in the environmental flow recommendations in the other months of the year. This association aims to maintain consistent percentages in the environmental flow recommendations across all months of the year. Consequently, the environmental flow regime will have upper and lower limits defined by the following exceedance percentages: 88.42% to 94.90% for Ahogados River, 89.12% to 94.74% for Tempisquito Rive, and 63.86% to 95.00% for Tempisque River (Table 4).

4. Discussion

The Tempisque River basin is significant in Costa Rica due to its diverse ecosystem and thriving activities such as tourism, fish farming, and agriculture. The river exhibits behavior typical of other rivers in the Central American dry corridor, characterized by low water volumes during dry seasons and transition periods, and high levels during the rainy season [22]. Climate change has exacerbated this situation, leading to an increase in the occurrence of “El Niño” and “La Niña” phenomena.
Unregulated exploitation of the river’s water resources has adversely impacted both natural systems and production activities. Droughts and floods have affected access to this vital resource. Jiménez et al. [32] noted that infrastructure projects aimed at flood control and uncontrolled extraction of surface and groundwater for irrigation threaten the ecological integrity of the area. Effective management of the basin’s water resources is crucial to ensure their availability for both productive use and the organisms and populations that depend on them. The findings of this research will provide an invaluable tool for authorities to make informed decisions regarding the necessary environmental flow to safeguard the river’s integrity and preserve this critical natural resource.

4.1. Biological Indicators

4.1.1. Aquatic Macroinvertebrates

Both Baetodes and Traverella individuals prefer medium–deep habitats between 11 and 40 cm (Figure 4A). Regarding velocity, Baetodes individuals did not display a preference for a specific range at slow and moderate velocities, as they were found at 0.00 m/s. However, velocities greater than 1.20 m/s were unsuitable for this species. These findings support the classification of Baetodes as organisms that thrive in moderate to fast water flows (0.20–1.00 m/s), as noted by Quesada-Alvarado et al. [25].
Similarly, Traverella showed no significant preference for velocities exceeding 1.10 m/s. However, they were absent from water flows with velocities below 0.25 m/s (Figure 4B), contrary to Baetodes, which was found in a wider range of velocities. Nevertheless, both species inhabit shallow habitats with moderate currents. According to Brittain and Saltveit [33], mayflies prefer habitats with very specific limits in relation to hydraulic variables such as velocity and depth; therefore, they are commonly found in shallow waters and near riverbanks.
Additionally, both species exhibit adaptations to thrive in areas with moderate currents by possessing elongated and flattened bodies as well as claws for substrate attachment [25,34]. Moreover, both species prefer areas with high dissolved oxygen concentration and require constant current flow [25,35].
The presence of aquatic macroinvertebrates is dependent on the type of substrate. Research on habitat preference has revealed that this factor is fundamental in determining the establishment of these organisms [34,36,37]. Substrates like leaf litter, gravel, and stones provide shelter and nourishment for Baetodes, characterized as scrapers, and Traverella, which are detritivores, foragers, or filter feeders [36]. Habitats with higher flow values could experience sediment drag, which has detrimental effects on invertebrate communities [38] and causes the disturbance of substrates, potentially explaining the reduced abundance of both species.
Seasonal variation in Baetodes reveals that nymph abundance correlates with pluviometric changes [35,39]. Furthermore, low flow, whether natural or artificial, reduces macroinvertebrate density in aquatic ecosystems [40,41,42], as previously explained. The decline in population density is due to increased competition and predation, possibly caused by a reduction in wetted width that decreases the available habitat and reduces both the quantity and quality of food [42].
Vásquez et al. [43] found that the abundance of Baetodes was greater during the rainy season and decreased during the dry season, as the reproductive season of these organisms occurs during the rainy season and transition months. This could lead to a higher number of individuals during these months. There may not have been a noticeable difference in population density for Traverella between seasons due to insufficient sampling size to comprehend the population dynamics in the rivers sampled.
Based on the obtained results, it can be inferred that Baetodes and Traverella exhibit a preference for habitats with distinct depth and velocity characteristics. Their preference for certain areas makes them susceptible to population decline in response to abrupt variations in river features [33], such as a decrease in flow that may result in stranding, or an increase that could cause individuals to drift. The findings suggest that both species may serve as effective indicators for determining the flow regime in the Tempisque River.

4.1.2. Ichthyofauna

The study revealed that most individuals of the two evaluated fish species prefer slow and medium–deep water velocities, rendering deep river habitats with high velocities unsuitable for them. Although these fish have adaptations for various microhabitats, their populations decline under extreme conditions [44]. For both species, the highest abundance was observed at slow velocities ranging from 0.00 m/s to 0.60 m/s. These findings align with those reported by Leal et al. [45] for the Astyanax genus. In their study, the authors observed that Astyanax sp. had the highest abundance between 0.50 and 1.00 m/s with a depth range of 40 to 60 cm. Similar findings were observed in the present study for A. aeneus.
Likewise, Im et al. [19] obtained habitat preference curves for five fish species with torpedo-shaped bodies and small sizes. They observed the same trend as in the Tempisque River, where species were able to utilize null and moderate to strong current velocities, but were less than 1.00 m/s.
The absence of individuals in greater abundance at extreme velocities may be attributed to the body shape and feeding habits of each species [45,46]. Additionally, the prevalence and distribution of their most frequently consumed prey could also play a role [47]. For instance, A. aeneus uses its mouth to hunt insects and fruits on the bottom and surface of the water; however, its ovoid body shape hinders its ability to remain in areas with greater drag [48]. Conversely, A. nigrofasciata tends to inhabit areas without much drag, such as those with vegetation, submerged branches or trunks, and loose rock [17].
According to González Leiva et al. [17], A. nigrofasciata requires different water velocities based on ontogenetic growth. Juveniles need lower velocities than adults, leading the authors to conclude that the species’ optimal flow rate is 1.00 m3/s, similar to the rate found in this study. However, to maintain microhabitats for both adults and juveniles, the authors recommend preserving flow rates above 2.00 to 3.00 m3/s.
Based on the obtained results for the ichthyofauna, both species are proposed as indicators of environmental flow. These species possess lower ranges of velocity and depth that are considered optimal; therefore, any variations tending to decrease may represent a decline in their respective habitats. Cortes et al. [49] suggested that rapids and waterfalls are the most affected habitats when flow decreases, putting rheophilic species at risk. During the dry season, as water flow decreases and currents weaken, individuals of both species seek shelter to avoid the drag of the rainy season. Once the season ends, they return to their river habitats. It is crucial to maintain sufficient flow to enable them to recolonize these areas and carry out their daily activities to preserve their populations.
The two species studied are small and inhabit shallow areas, seeking refuge in spaces created by boulders. Therefore, the environmental flows suggested for A. aeneus and A. nigrofasciata must be approached carefully, as they benefit small-sized species. However, the proposed flow rates should be analyzed with caution due to the limited representation of larger fish during sampling. Larger fish require greater depths or pools with contact with submerged roots or grasses that serve as shelter. Thus, proposed flow rates should always ensure water contact with the bank edge, ideally on both banks.

4.2. Socioeconomic Indicators

From a social perspective, local recreational activities (56.00%) and daily activities in the region (48.30%) require medium to low river water levels. The flow level significantly impacts the accessibility and comfort of these activities, directly affecting the safety of activities conducted in or near the river, as well as the enjoyment of the local community. These activities play a crucial role in strengthening social ties and fostering a sense of community.
Conversely, productive farming activities associated with intensive crop irrigation (78.00%), tourism (44.00%), and mechanized sand mining (37.00%) necessitate substantial riverbed depth for proper execution. Since crop irrigation is an economic activity that utilizes (extracts) water resources, altering the natural river flow, especially during the dry season when water levels decrease [50], resulting in a reduction in flow. Consequently, it cannot be considered a socioeconomic indicator in this study.
Therefore, achieving a balance among the other four socioeconomic indicators is crucial to prevent the degradation of the watershed’s social, economic, and environmental conditions [32].

4.3. Environmental Flow

According to Harris et al. [51], the WUA and PUA curves, associated with flow exceedance probability, ensure that in April (when the average flow is lowest in the three rivers), the optimal flow range is maintained even under the most critical conditions. By establishing the optimal range of environmental flows for April and associating it with a probability of exceedance, an environmental flow regime was generated for the entire year. This regime aligns with the natural water regime patterns of the three study reaches, corroborating the findings of [52,53]. It meets the ecological needs and life cycles of indicator species, as well as flow needs associated with socioeconomic activities, through flow variations throughout the year rather than a fixed unchanging flow.
Previous environmental flow determination studies have been conducted on the Tempisque River, including Calvo et al. [54]. Their study found an overlap in the monthly flow data when compared to the presented range of the annual regime. For example, in April, the flow value ranges from 3.20 to 4.90 m3/s [54], while this study’s range is 4.46–7.00 m3/s. However, the first approach is solely based on biological indicators, such as crocodiles and guapotes. In contrast, this study encompasses both biological and socioeconomic indicators, which may result in a wider environmental flow range.
Considering that the biological indicators were macroinvertebrates and ichthyofauna, a reduction in flow, especially during the drought season, could restrain species’ recolonization after the rainy season. This process is vital for maintaining population density and survival. Maintaining flows above the minimum acceptable levels can create new habitats. It is also important to ensure that there are flow pulses in the river to facilitate material transport and the renewal of insect and fish communities, which is essential for their population dynamics [55,56,57]. The study also addressed the importance of ensuring the transverse connectivity of the river and its interaction with the riparian forest throughout various times of the year (different flows), through habitat simulations.
In the socioeconomic context, tourist activity, as depicted in Figure 7, indicates a need for higher flow requirements, which necessitates an increase in the upper limit during low-flow periods, thereby enhancing the environmental flow regime of the basin. Additionally, water extraction activities must ensure that the volume extracted does not lead to flows lower than those specified to prevent ecological damage.
The Tempisque River basin, with its diverse ecosystems, socioeconomic and cultural activities, and expansive surface area, presents excellent conditions for a holistic analysis. When integrating actual usage conditions, the environmental flow regime obtained by applying a holistic methodology allows for evaluating the diverse requirements of both the ecosystem and the various socioeconomic actors interacting within the watershed. This provides tools for decision-making in water resources management. However, it must be noted that in the context of Costa Rican legislation, there is a delay in updating the Water Law toward more current trends such as the comprehensive management of water resources, where watershed councils become important decision-makers.

5. Conclusions

The holistic approach used to determine the environmental flow regime was based on the integration of a hydraulic model, field data on habitat requirements, and socioeconomic preferences to generate relationships between flow and usable river area by species or activity.
The monthly environmental flow regime, determined through the application of this holistic methodology, is established as a range between the maximum and minimum recommended percentages. For the most critical month (April), the environmental flow is 1.82 m3/s to 2.5 m3/s (95.00% and 88.00%) for the Ahogados River, 2.17 m3/s to 2.50 m3/s (95.00% and 89.00%) for the Tempisquito River, and 4.46 m3/s to 7.00 m3/s (95.00% and 64.00%) for the Tempisque River.
It is crucial to recognize the limitations and complexities involved in determining an environmental flow regime along the Tempisque River. This process is highly intricate due to the extensive data collection required at the study site level, as well as the subsequent analysis and interpretation of that data. The challenges are further compounded by the diverse ecological, economic, and social interactions that affect the river along its entire main channel.
The objective of calculating the environmental flow regime using a holistic methodology at three different points along the main channel and tributaries is to establish control parameters for water resource management with a conservation-oriented perspective. However, the recommendation to reserve and maintain environmental flows must balance the need to avoid social conflicts and accommodate the water demands of various stakeholders, including investors in tourism, real estate, agriculture, and livestock production. This necessitates strict adherence to water resource planning and management within an inherently complex legal and institutional framework, especially given the dynamic nature of economic development in the region.

Author Contributions

Conceptualization, I.G.-A., F.W.-H., L.C.-P. and F.Q.-A.; methodology, I.G.-A., F.W.-H., L.C.-P. and F.Q.-A.; validation, I.G.-A. and L.C.-P.; formal analysis, I.G.-A., F.W.-H., L.C.-P., F.Q.-A., V.S.-N., A.L.B.-V., K.F.-C. and J.C.-G.; investigation, I.G.-A., F.W.-H., L.C.-P., F.Q.-A. and V.S.-N.; resources, F.Q.-A.; data curation, F.W.-H. and V.S.-N.; writing—original draft preparation, I.G.-A., F.W.-H., L.C.-P. and F.Q.-A.; writing—review and editing, I.G.-A., F.W.-H., L.C.-P., F.Q.-A. and V.S.-N.; visualization, V.S.-N.; supervision, I.G.-A.; project administration, I.G.-A. All authors have read and agreed to the published version of the manuscript.

Funding

This research received no external funding.

Institutional Review Board Statement

Not applicable.

Informed Consent Statement

Not applicable.

Data Availability Statement

Dataset available on request from the authors.

Acknowledgments

We thank SINAC-ACG for the collection permits (R-SINAC-ACG-PI-010-2021) and Instituto Costarricense de Acueductos y Alcantarillados (AyA) for the assistance provided during the realization of the project.

Conflicts of Interest

The authors declare no conflicts of interest.

References

  1. Sinnatamby, R.N.; Mayer, B.; Kruk, M.K.; Rood, S.B.; Farineau, A.; Post, J.R. Considering Multiple Anthropogenic Threats in the Context of Natural Variability: Ecological Processes in a Regulated Riverine Ecosystem. Ecohydrology 2020, 13, e2217. [Google Scholar] [CrossRef]
  2. Dudgeon, D. Multiple Threats Imperil Freshwater Biodiversity in the Anthropocene. Curr. Biol. 2019, 29, R960–R967. [Google Scholar] [CrossRef] [PubMed]
  3. Graham, P.M.; Pattinson, N.B.; Stassen, R.; Pike, T.; Hamidan, N.A.F. Using Environmental Flows to Inform Integrated Water Resource Management in Critically Water Scarce Regions. Ecohydrology 2024, e2705. [Google Scholar] [CrossRef]
  4. de Graaf, I.E.M.; Gleeson, T.; van Beek, L.P.H.; Sutanudjaja, E.H.; Bierkens, M.F.P. Environmental Flow Limits to Global Groundwater Pumping. Nature 2019, 574, 90–94. [Google Scholar] [CrossRef]
  5. Mott Lacroix, K.E.; Tapia, E.; Springer, A. Environmental Flows in the Desert Rivers of the United States and Mexico: Synthesis of Available Data and Gap Analysis. J. Arid. Environ. 2017, 140, 67–78. [Google Scholar] [CrossRef]
  6. Arthington, A.H.; Bhaduri, A.; Bunn, S.E.; Jackson, S.E.; Tharme, R.E.; Tickner, D.; Young, B.; Acreman, M.; Baker, N.; Capon, S.; et al. The Brisbane Declaration and Global Action Agenda on Environmental Flows (2018). Front. Environ. Sci. 2018, 6, 45. [Google Scholar] [CrossRef]
  7. Tharme, R.E. A Global Perspective on Environmental Flow Assessment: Emerging Trends in the Development and Application of Environmental Flow Methodologies for Rivers. River Res. Appl. 2003, 19, 397–441. [Google Scholar] [CrossRef]
  8. Atazadeh, E.; Barton, A.; Shirinpour, M.; Zarghami, M.; Rajabifard, A. River Management and Environmental Water Allocation in Regulated Ecosystems of Arid and Semi-Arid Regions—A Review. Fundam. Appl. Limnol. 2020, 193, 327–345. [Google Scholar] [CrossRef]
  9. Dourado, G.F.; Rallings, A.M.; Viers, J.H. Overcoming Persistent Challenges in Putting Environmental Flow Policy into Practice: A Systematic Review and Bibliometric Analysis. Environ. Res. Lett. 2023, 18, 043002. [Google Scholar] [CrossRef]
  10. Bhuiyan, C. Environmental Flows: Issues and Gaps—A Critical Analysis. Sustain. Sci. 2022, 17, 1109–1128. [Google Scholar] [CrossRef]
  11. Schmutz, S.; Sendzimir, J. Riverine Ecosystem Management, 1st ed.; Schmutz, S., Sendzimir, J., Eds.; Springer Cham: New York, NY, USA, 2018. [Google Scholar] [CrossRef]
  12. Ibáñez, C.; Caiola, N.; Belmar, O. Environmental Flows in the Lower Ebro River and Delta: Current Status and Guidelines for a Holistic Approach. Water 2020, 12, 2670. [Google Scholar] [CrossRef]
  13. Poff, N.L.; Tharme, R.E.; Arthington, A.H. Evolution of Environmental Flows Assessment Science, Principles, and Methodologies. In Water for the Environment; Elsevier Inc.: London, UK, 2017; pp. 203–236. [Google Scholar] [CrossRef]
  14. Mussehl, M.L.; Horne, A.C.; Webb, J.A.; Poff, N.L. Purposeful Stakeholder Engagement for Improved Environmental Flow Outcomes. Front. Environ. Sci. 2022, 9, 749864. [Google Scholar] [CrossRef]
  15. Laporte, S.A.D.Ĺ.; Pacheco, A.; Rodriguez, C.R. Estimation of Minimum Acceptable (Compensatory) Flow for the Rivers of Costa Rica. In Fifth FRIEND World Conference: Climate Variability and Change—Hydrological Impacts; IAHS Publications 308: Havana, Cuba, 2006; pp. 558–562. [Google Scholar]
  16. Chaves, A.; Krasovskaia, I.; Gottschalk, L. Environmental Demands for Sustainable Regulation Schemes in the Humid Tropics. In Fifth FRIEND World Conference: Climate Variability and Change—Hydrological Impacts; IAHS Publications 308: Havana, Cuba, 2006; pp. 569–572. [Google Scholar]
  17. González Leiva, J.A.; Segovia de González, J.V.; Cornejo Hernández, G.A.; Revelo Vidaurre, J.C.; Morán Villatoro, J.M. Idoneidad Del Hábitat de Amatitlania Nigrofasciata y Caudales Ecológicos Del Río Cara Sucia, El Salvador. Real. y Reflexión 2021, 54, 95–111. [Google Scholar] [CrossRef]
  18. Dunbar, M.J.; Alfredsen, K.; Harby, A. Hydraulic-habitat Modelling for Setting Environmental River Flow Needs for Salmonids. Fish. Manag. Ecol. 2012, 19, 500–517. [Google Scholar] [CrossRef]
  19. Im, D.; Choi, S.-U.; Choi, B. Physical Habitat Simulation for a Fish Community Using the ANFIS Method. Ecol. Inform. 2018, 43, 73–83. [Google Scholar] [CrossRef]
  20. Gebreegziabher, G.A.; Degefa, S.; Furi, W.; Legesse, G. Evolution and Concept of Environmental Flows (e-Flows): Meta-Analysis. Water Supply 2023, 23, 2466–2490. [Google Scholar] [CrossRef]
  21. Mateo-Vega, J. Características Generales de La Cuenca Del Río Tempisque. In La Cuenca del río Tempisque: Perspectivas para un Manejo Integrado; Jiménez, R.J.A., González, J.E., Eds.; Organización para Estudios Tropicales: San José, Costa Rica, 2001; pp. 32–72. [Google Scholar]
  22. Comité Regional de Recursos Hidráulicos (CRRH). Pacífico Norte. In El Clima, su Variabilidad y Cambio Climático en Costa Rica; Instituto Meteorológico Nacional (IMN): San José, Costa Rica, 2008. [Google Scholar]
  23. Dirección de Agua. Plan Nacional de Monitoreo de La Calidad de Los Cuerpos de Agua Superficiales; 2013. Available online: https://da.go.cr/monitoreo-de-calidad-del-recurso-hidrico/ (accessed on 17 September 2024).
  24. Renöfält, B.M.; Jansson, R.; Nilsson, C. Effects of Hydropower Generation and Opportunities for Environmental Flow Management in Swedish Riverine Ecosystems. Freshw. Biol. 2010, 55, 49–67. [Google Scholar] [CrossRef]
  25. Quesada-Alvarado, F.; Umaña-Villalobos, G.; Springer, M.; Picado-Barboza, J. Classification of Aquatic Macroinvertebrates in Flow Categories for the Adjustment of the LIFE Index to Costa Rican Rivers. Ecohydrol. Hydrobiol. 2021, 21, 368–376. [Google Scholar] [CrossRef]
  26. Bussing, W.A. Peces de Las Aguas Continentales de Costa Rica/Freshwater Fishes of Costa Rica, 2nd ed.; Editorial UCR: San José, Costa Rica, 2002. [Google Scholar]
  27. Noack, M.; Schneider, M.; Wieprecht, S. The Habitat Modelling System CASiMiR: A Multivariate Fuzzy Approach and Its Applications. In Ecohydraulics: An Integrated Approach; John Wiley & Sons, Ltd.: West Sussex, UK, 2013; pp. 75–91. [Google Scholar] [CrossRef]
  28. Serrano-Núñez, V.; Watson-Hernández, F.; Guzmán-Arias, I.; Chavarría-Pizarro, L.; Quesada-Alvarado, F. Correction of Empirical Equations Known as “Strickler-Type” for the Calculation of the Manning’s Roughness Coefficient for Costa Rica’s Northern Pacific Conditions. Hydrology 2022, 9, 71. [Google Scholar] [CrossRef]
  29. Bovee, K.D. A Guide to Stream Habitat Analysis Using the Instream Flow Incremental Methodology. IFIP No. 12; U.S. Fish and Wildlife Service: Washington, DC, USA, 1982. [Google Scholar]
  30. Sanz-Ramos, M.; Bladé, E.; Niñerola, D.; Palau-Ibars, A. Evaluación Numérico-Experimental Del Comportamiento Histérico Del Coeficiente de Rugosidad de Los Macrófitos. Ing. del Agua 2018, 22, 109–124. [Google Scholar] [CrossRef]
  31. Bustos-Vázquez, A.L.; Fernández Chévez, K.; Chacón Gutiérrez, K. Informe Caudal Ambiental, Metodología Holística En Cuenca Del Río Tempisque; Instituto Meteorológico Nacional: San José, Costa Rica, 2023. [Google Scholar]
  32. Jiménez, J.; Calvo, J.; Pizarro, F.; González, E. Conceptualización de Caudal Ambiental En Costa Rica: Determinación Inicial Para El Río Tempisque; UICN-Unión Mundial para la Naturaleza, Oficina Regional para Mesoamérica (UICN/ORMA): San José, Costa Rica, 2005; Volume 53. [Google Scholar]
  33. Brittain, J.E.; Saltveit, S.J. A Review of the Effect of River Regulation on Mayflies (Ephemeroptera). Regul. Rivers Res. Manag. 1989, 3, 191–204. [Google Scholar] [CrossRef]
  34. Da-Silva, E.R.; Nessimian, J.L.; Coelho, L.B.N. Leptophlebiidae Ocorrentes No Estado Do Rio de Janeiro, Brasil: Hábitats, Meso-Hábitats e Hábitos Das Ninfas (Insecta: Ephemeroptera). Biota Neotrop. 2010, 10, 87–93. [Google Scholar] [CrossRef]
  35. Sierra-Labastidas, T.K.; Tamaris-Turizo, C.E.; Reyes Picón, S.A.; Rueda-Delgado, G. Densidad, Biomasa y Hábitos Alimentarios de Anacroneuria Klapálek 1909 (Plecoptera: Perlidae) En Un Río Tropical. Actual. Biológicas 2018, 39, 66–74. [Google Scholar] [CrossRef]
  36. Domínguez, E.; Encalada, A.; Fernández, H.R.; Giorgi, A.; Marchese, M.; Miserendino, M.L.; Munné, A.; Prat, N.; Ríos-Touma, B.; Rodrigues Capítulo, A. Biomonitoreo En Ríos de La Argentina: Un Camino Por Recorrer. Ecol. Austral 2021, 32, 229–244. [Google Scholar] [CrossRef]
  37. Silveira, M.P.; Buss, D.F.; Nessimian, J.L.; Baptista, D.F. Spatial and Temporal Distribution of Benthic Macroinvertebrates in a Southeastern Brazilian River. Braz. J. Biol. 2006, 66, 623–632. [Google Scholar] [CrossRef]
  38. Mackie, J.K.; Chester, E.T.; Matthews, T.G.; Robson, B.J. Macroinvertebrate Response to Environmental Flows in Headwater Streams in Western Victoria, Australia. Ecol. Eng. 2013, 53, 100–105. [Google Scholar] [CrossRef]
  39. Castillo Sánchez, K.; Aguirre, Y.; Ríos González, T.; BERNAL VEGA, J.A. Anacroneuria (Plecoptera: Perlidae) Del Río Caldera, Chiriquí, Panamá, Con Nuevos Registros de Distribución, y Comentarios Sobre Distribución Altitudinal y Variación Estacional. Rev. Biol. Trop. 2017, 66, 164–177. [Google Scholar] [CrossRef]
  40. Dewson, Z.S.; James, A.B.W.; Death, R.G. A Review of the Consequences of Decreased Flow for Instream Habitat and Macroinvertebrates. J. N. Am. Benthol. Soc. 2007, 26, 401–415. [Google Scholar] [CrossRef]
  41. McIntosh, M.D.; Benbow, M.E.; Burky, A.J. Effects of Stream Diversion on Riffle Macroinvertebrate Communities in a Maui, Hawaii, Stream. River Res. Appl. 2002, 18, 569–581. [Google Scholar] [CrossRef]
  42. Kinzie, R.A.; Chong, C.; Devrell, J.; Lindstrom, D.; Wolff, R.H. Effects of Water Removal on a Hawaiian Stream Ecosystem. Pac. Sci. 2006, 60, 1–47. [Google Scholar] [CrossRef]
  43. Vásquez, D.; Flowers, R.W.; Springer, M. Life History of Five Small Minnow Mayflies (Ephemeroptera: Baetidae) in a Small Tropical Stream on the Caribbean Slope of Costa Rica. Aquat. Insects 2009, 31 (Suppl. S1), 319–332. [Google Scholar] [CrossRef]
  44. Parasiewicz, P.; Dunbar, M.J. Physical Habitat Modelling for Fish—A Developing Approach. River Syst. 2001, 12, 239–268. [Google Scholar] [CrossRef]
  45. Leal, C.G.; Junqueira, N.T.; Pompeu, P.S. Morphology and Habitat Use by Fishes of the Rio Das Velhas Basin in Southeastern Brazil. Environ. Biol. Fishes 2011, 90, 143–157. [Google Scholar] [CrossRef]
  46. Quesada-Alvarado, F.; Campos-Calderón, F. Morphometry and Burst Swimming in Six Continental Fish Species from Costa Rica. UNED Res. J. 2019, 11, 395–402. [Google Scholar] [CrossRef]
  47. Kim, S.K.; Choi, S.-U. Prediction of Suitable Feeding Habitat for Fishes in a Stream Using Physical Habitat Simulations. Ecol. Model. 2018, 385, 65–77. [Google Scholar] [CrossRef]
  48. Bussing, W.A. Peces de Las Aguas Continentales de Costa Rica, 1st ed.; Editorial UCR: San José, Costa Rica, 1998. [Google Scholar]
  49. Cortes, R.M.V.; Ferreira, M.T.; Oliveira, S.V.; Oliveira, D. Macroinvertebrate Community Structure in a Regulated River Segment with Different Flow Conditions. River Res. Appl. 2002, 18, 367–382. [Google Scholar] [CrossRef]
  50. Carvajal Vanegas, D. Dinámica Hídrica Bajo Condiciones Climáticas Cambiantes En La Subcuenca Del Río Tempisquito, Cuenca Del Tempisque, Guanacaste, Costa Rica; Centro Agronómico Tropical de Investigación y Enseñanza (CATIE): Turrialba, Costa Rica, 2017. [Google Scholar]
  51. Harris, A.; Porter, M.; McKay, S.K.; Mulchandani, A.; Stone, M. Hydraulic Analysis for Assessing Environmental Flow Selection and Ecological Model Formulation. Ecohydrology 2024, 17, e2681. [Google Scholar] [CrossRef]
  52. Karimi, S.; Salarijazi, M.; Ghorbani, K.; Heydari, M. Comparative Assessment of Environmental Flow Using Hydrological Methods of Low Flow Indexes, Smakhtin, Tennant and Flow Duration Curve. Acta Geophys. 2021, 69, 285–293. [Google Scholar] [CrossRef]
  53. Suwal, N.; Kuriqi, A.; Huang, X.; Delgado, J.; Młyński, D.; Walega, A. Environmental Flows Assessment in Nepal: The Case of Kaligandaki River. Sustainability 2020, 12, 8766. [Google Scholar] [CrossRef]
  54. Calvo Alvarado, J.; Jiménez, A.J.A.; González, E.; Pizarro, F.; Jiménez, A. Determinación Preliminar Del Caudal Ambiental En El Río Tempisque, Costa Rica: El Enfoque Hidrológico Con Limitación de Datos. Rev. For. Mesoam. Kurú 2008, 5, 1–18. [Google Scholar]
  55. Extence, C.A.; Balbi, D.M.; Chadd, R.P. River Flow Indexing Using British Benthic Macroinvertebrates: A Framework for Setting Hydroecological Objectives. Regul. Rivers Res. Manag. 1999, 15, 545–574. [Google Scholar] [CrossRef]
  56. Dunbar, M.J.; Pedersen, M.L.; Cadman, D.; Extence, C.; Waddingham, J.; Chadd, R.; Larsen, S.E. River Discharge and Local-scale Physical Habitat Influence Macroinvertebrate LIFE Scores. Freshw. Biol. 2010, 55, 226–242. [Google Scholar] [CrossRef]
  57. Worrall, T.P.; Dunbar, M.J.; Extence, C.A.; Laizé, C.L.R.; Monk, W.A.; Wood, P.J. The Identification of Hydrological Indices for the Characterization of Macroinvertebrate Community Response to Flow Regime Variability. Hydrol. Sci. J. 2014, 59, 645–658. [Google Scholar] [CrossRef]
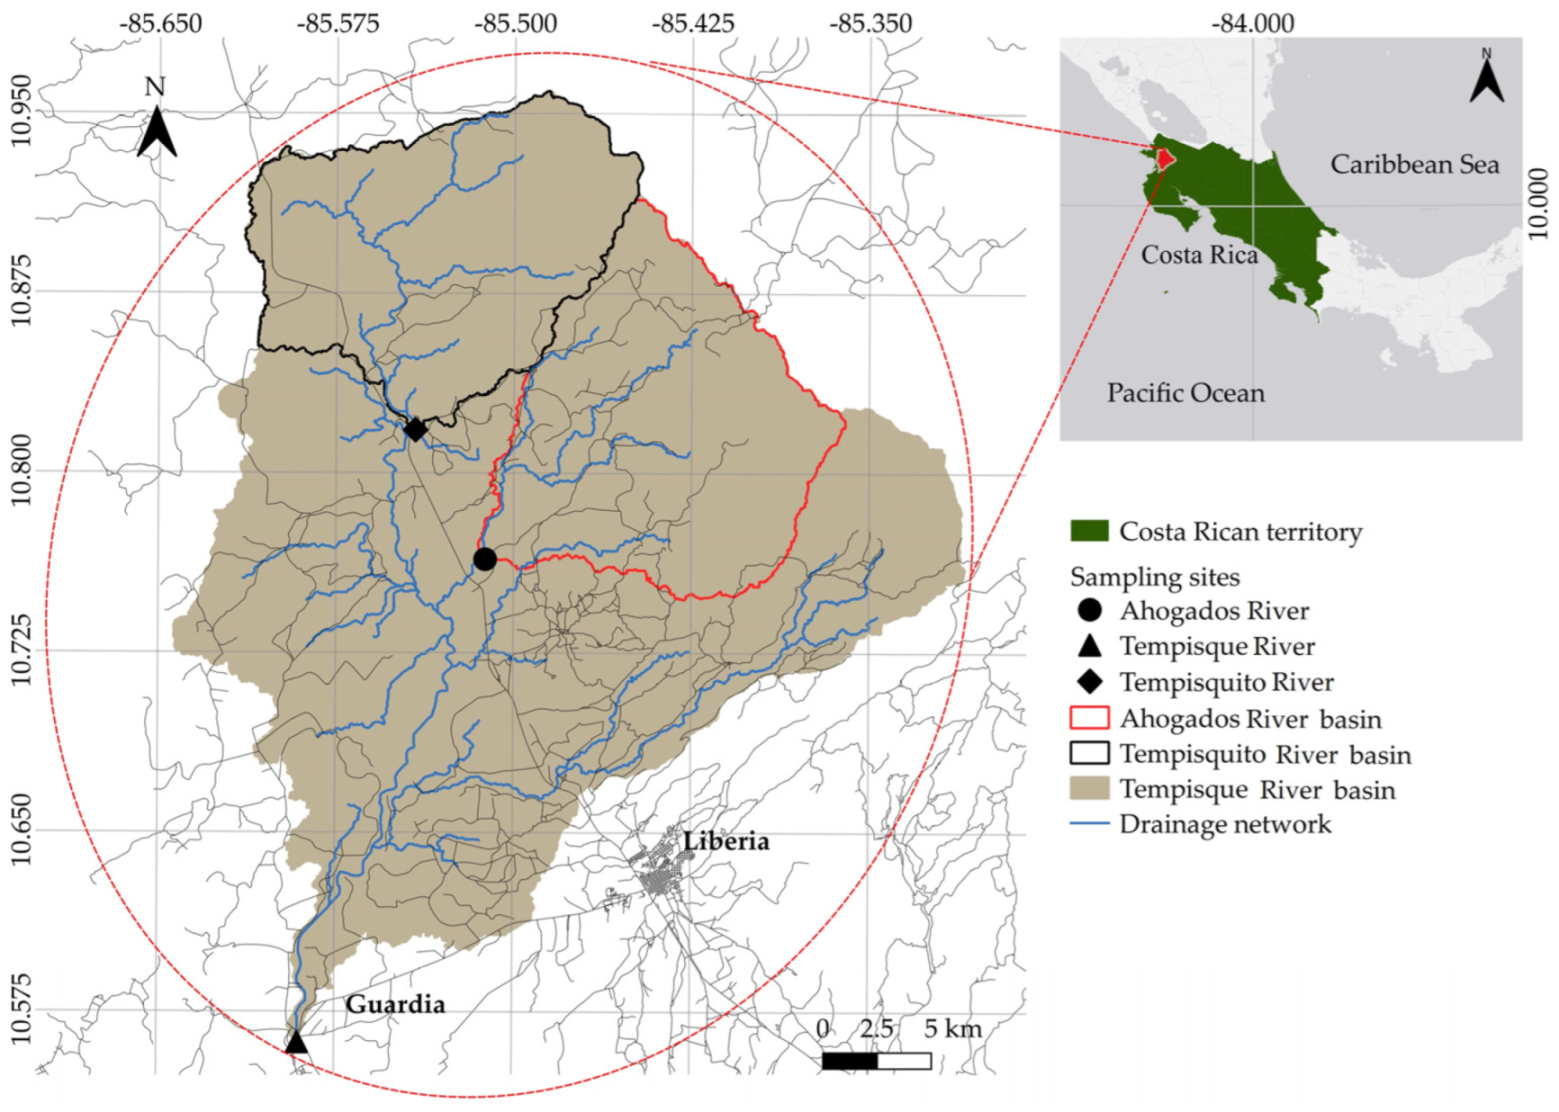
Figure 1. Upper Tempisque River basin and the three studied river paths.
Hydrology 11 00159 g001
Figure 2. Flowchart of the research procedures.
Hydrology 11 00159 g002
Figure 3. Hydrologic regime variability (A), flow duration curve (B) and flow duration curve in April (C), 1992–2010.
Hydrology 11 00159 g003
Figure 4. Frequency and habitat selection (velocity in m/s) for (A) Baetodes (Ephemeroptera: Baetidae) and (B) Traverella (Ephemeroptera: Leptohlebiidae) in the three studied paths.
Hydrology 11 00159 g004
Figure 5. Frequency and habitat selection (velocity in m/s) for (A) Astyanax aeneus (Characidae) and (B) Amatitlania nigrofasciata (Cichlidae) in the three studied paths.
Hydrology 11 00159 g005
Figure 6. Weighted Usable Areas (WUAs) behavior for the (A) Tempisque River (Guardia), (B) Ahogados River, and (C) Tempisquito River.
Hydrology 11 00159 g006
Figure 7. Potentially Usable Areas (PUAs) for analyzed socio-economic activities in the (A) Tempisque River (Guardia), (B) Ahogados River, and (C) Tempisquito River.
Hydrology 11 00159 g007
Table 1. Classification ranges of evaluated hydraulic variables in relation to their respective habitats.
HabitatVelocity (m/s)Depth (m)
BaetodesTraverellaAstyanaxAmatitlaniaBaetodesTraverellaAstyanaxAmatitlania
Inadequate [0.00–0.04[ [0.00–0.05[[0.00–0.04[
Regular[0.00–0.44[[0.04–0.10[ [0.05–0.10[[0.04–0.10[[0.00–0.10[[0.00–0.20[
Optimal[0.00–1.10[[0.10–0.40[[0.00–0.40[[0.00–0.55[[0.10–0.30[[0.10–0.40[[0.10–0.40[[0.20–0.50[
Regular[1.10–1.30[[0.40–0.60[[0.40–1.00[[0.55–1.30[[0.30–0.69[[0.40–0.60[[0.40–0.70[[0.50–0.70[
Inadequate≥1.30≥0.60≥1.00≥1.30≥0.69≥0.60≥0.70≥0.70
Table 2. Relative distribution of depth requirements for various activities in the Tempisque River at Guardia [31].
ActivitiesWater Depth Requirement
Relative Distribution (%)
132 cm78 cm45 cm
HighMediumLowTotal
Tourism44.5039.0016.50100.00
Agriculture (irrigation for intensive crops)77.8015.007.20100.00
Mechanized sand mining36.7028.8034.50100.00
Artisanal sand mining20.5029.2050.30100.00
Local recreation18.5056.0025.50100.00
Daily activities7.2044.3048.50100.00
Self-consumption fishing28.5046.0025.50100.00
Table 3. Flow ranges for biological and socioeconomic components during the most critical month based on the water regime.
ComponentFlow Range (m3/s)
Ahogados RiverTempisquito RiverTempisque River (Guardia)
Lower LimitUpper LimitLower LimitUpper LimitLower LimitUpper Limit
Biological0.802.501.002.501.007.00
Socio-economic1.823.752.174.474.4611.08
Intersection1.822.502.172.504.467.00
Table 4. Recommended environmental flow regime for each studied path.
MonthFlow Regime (m3/s)
Ahogados RiverTempisquito RiverTempisque River (Guardia)
Lower LimitUpper LimitLower LimitUpper LimitLower LimitUpper Limit
January2.823.793.393.818.2414.18
February2.403.272.913.285.6410.98
March2.132.842.542.834.637.96
April1.822.502.172.504.467.00
May1.572.291.902.514.517.95
June2.203.032.753.267.1114.07
July2.873.093.293.479.6315.57
August3.233.753.333.9310.6817.17
September3.815.004.135.2110.3824.36
October5.297.555.557.9512.8831.55
November4.785.074.645.3911.9825.26
December4.344.524.194.7211.3818.27
Discharge Exceedance Probability (%)94.9088.4294.7489.1295.0063.86
Disclaimer/Publisher’s Note: The statements, opinions and data contained in all publications are solely those of the individual author(s) and contributor(s) and not of MDPI and/or the editor(s). MDPI and/or the editor(s) disclaim responsibility for any injury to people or property resulting from any ideas, methods, instructions or products referred to in the content.