Abstract
Arsenic contamination poses significant challenges to environmental and public health, with mining activities contributing to its wider distribution. This study investigates the fate of arsenic and iron in mine waters at a decommissioned tin mine, now a visitor mine, located in Ehrenfriedersdorf, Germany, situated in the Free State of Saxony. Despite the general shortage of data, which is common for old mining sites, we explored the complex interplay of climatic conditions, hydrological processes, and arsenic and iron behavior in the mine waters through a comprehensive approach encompassing general site characterization, mine water monitoring, and analysis of local weather data. Over a period of three years, we conducted 14 sampling campaigns, collecting a total of 95 water samples, each consisting of three filtration subsamples, resulting in the analysis of 285 water samples. These samples were collected both aboveground and underground. Aboveground samples included mine outflows, a tailing outflow, and an adjacent creek, while underground sampling points were scattered throughout the mine initially and later focused on the identified “main” mine water system. The chemical data from the analyses were correlated with local climatic water balances to reveal distinctive patterns in arsenic and iron concentrations at various locations within the mine system. Our findings shed light on the hydrological behavior of the mine, helping to elucidate the impact of precipitation and potential evapotranspiration on arsenic and iron concentrations in a tailing outflow, in the flooded mine body, and at the portal of the main dewatering gallery. Our findings emphasize the importance of sustained monitoring and the utilization of local weather data to comprehend metalloid and metal contamination risks in similar mining environments.
1. Introduction
Arsenic, a toxic metalloid, is ubiquitously distributed in the environment, with both natural and anthropogenic sources contributing to its widespread occurrence. Natural processes, such as the weathering of rocks and volcanic activity, release arsenic into soil and water, while human activities like mining and industrial processes further amplify its presence [1,2].
The concerns surrounding human health and the elevated presence of arsenic in the environment have been extensively investigated and are well-documented [3]. Prolonged exposure to arsenic can result in various adverse health effects, including various types of cancer. Among the spectrum of arsenic sources in the environment, airborne arsenic and drinking water emerge as potential major threats to human health. The latter is contingent on local availability and stems from various sources, each varying in terms of arsenic-related risks [4]. Consequently, the World Health Organization (WHO) has established a guideline value for arsenic in drinking water of 10 µg/L [5]. Aligning with these standards, the current German Drinking Water Ordinance also mandates a limit of 10 µg/L, which is set to further decrease to 4 µg/L starting in mid 2036 [6].
The fate of arsenic is determined by physico-chemical conditions such as pH, redox potential, and the presence of other ions [7]. Arsenic minerals, specifically arsenopyrite which is the most prominent of them, escort bismuth–cobalt–nickel, lead–zinc–silver, tin–tungsten, and gold deposits [4].
The weathering of arsenopyrite may be the dominating process in the distribution of arsenic near former mine sites. The following equation describes the global arsenopyrite oxidation reaction [1,8]:
Extensive studies on the oxidation of arsenopyrite underscore its role in liberating arsenic into the environment [1,7,8]. During this process, both elements, sulfur and arsenic, undergo various oxidation states. It is evident that arsenopyrite weathering significantly contributes to the presence of arsenic in mining surroundings.
In mining environments, apart from arsenopyrite oxidation, emissions of arsenic trioxide from pyrometallurgy also contribute to the quality of soil in the spatial vicinity of ore processing plants. During the roasting and smelting processes of ores, an offgas containing arsenic is released, subsequently sublimating into solid arsenic trioxide (As2O3). With a relatively high water solubility of 0.94 g/L at 20 °C [9], arsenic trioxide aggravates the environmental risk in ore processing areas.
A comprehensive investigation into European agricultural and grazing lands has revealed that the concentration of arsenic (as well as other elements) is intricately linked to geological factors. Different regions exhibit distinct geochemical backgrounds, challenging the notion of a singular background level universally applicable to all of Europe. Nevertheless, the study successfully identified areas with elevated arsenic concentrations, which are notably correlated with recognized mineral districts and mining regions [10,11].
Greif and Klemm [12] conducted a reassessment of the determination of geogenic background levels of heavy metals and arsenic in water phases and suspended-matter-borne sediments within Saxony’s flowing waters in the Erzgebirge/Vogtland watershed (Ore Mountains/Vogtland). Their findings revealed that arsenic almost consistently surpasses the former applicable standards for sediments across the scoped area. Consequently, the authors propose and recommend the use of an addition model for element evaluation in regions characterized by high geogenic backgrounds. This model takes into account the geogenic background while incorporating the respective eco-toxicological threshold.
The elevated background concentrations of metals and arsenic in the Ore Mountains region in Saxony can be attributed to the abundant presence of ores, including galena, sphalerite, and arsenopyrite. Extensive mining and ore processing activities in these regions have resulted in the generation of tailings, the deposition of dust, and the discharge of mine waters contaminated with metals [13,14].
Numerous studies, including those by [11,13,14], consistently report elevated concentrations of arsenic in the specified region. In particular, [13] highlights the Ehrenfriedersdorf-Geyer area in Saxony as having the most extensive occurrence of arsenic-contaminated soils. This elevation is notably pronounced in the central zones of tin mineralizations and within areas associated with past ore processing activities, such as smelting plants and stamp mills. The arsenic concentrations in the soil horizons extend up to 16,000 mg/kg, as documented by [13,15].
In Germany, the maximum arsenic concentration for surface waters is 40 mg/kg respective to suspended matter or sediments [16]. Those are often exceeded in creeks and river bedrock sediments, for example, in the Ore Mountains (Erzgebirge) because of ore mineralizations, ore deposits, or mining activities.
1.1. Site Characterization
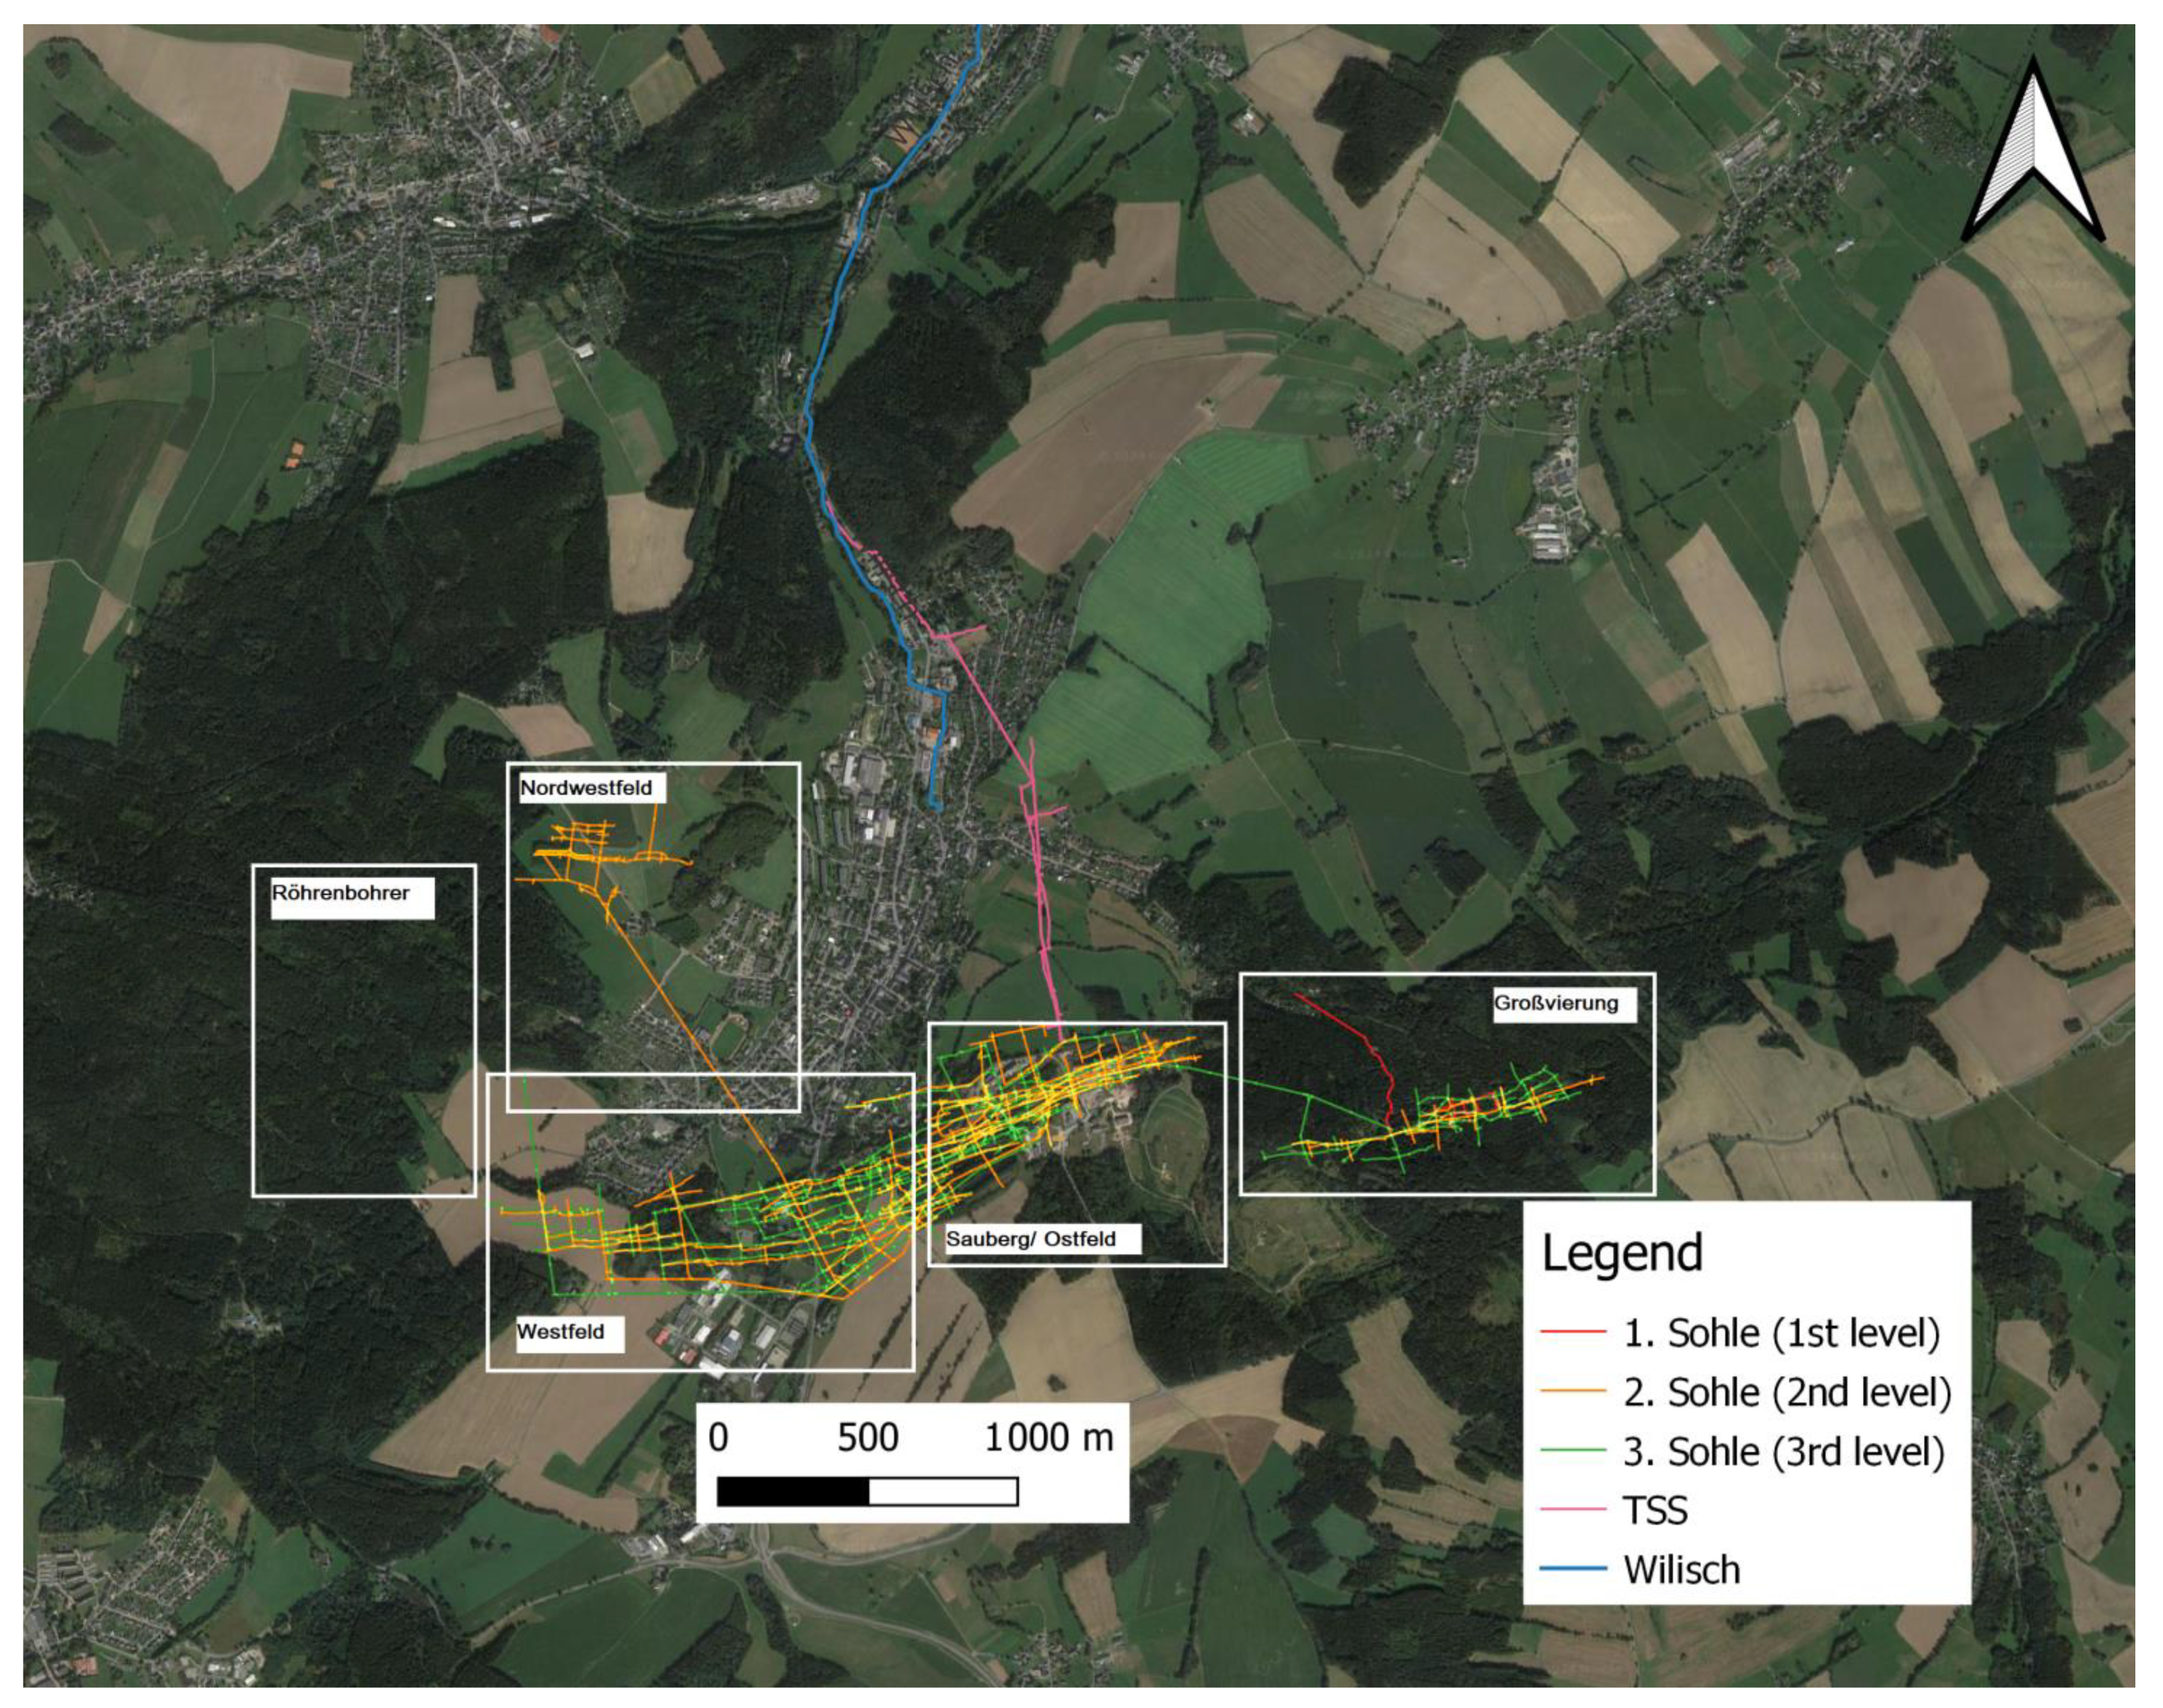
The geological setting is well described by Hösel [17]. The Ehrenfriedersdorf tin deposit is divided into Sauberg/Westfeld, Vierung, Nordwestfeld, and Röhrenbohrer subfields and is situated in southern Saxony close to the Czech Republic. It belongs to the Saxothuringian zone of the Variscan Orogeny as displayed in the Figure 1:
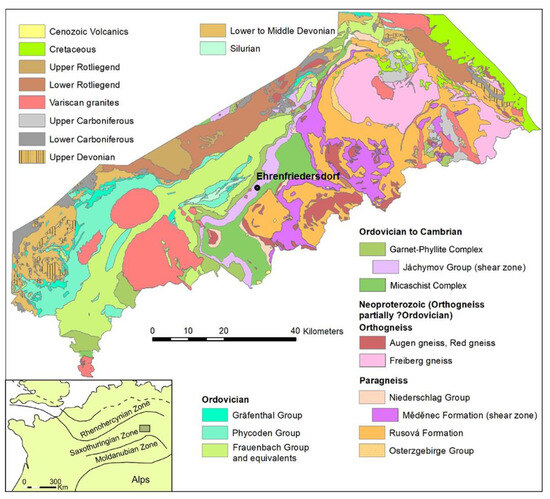
Figure 1.
Geological general map of the area. Author: Andreas Brosig.
The countryrock is dominated by gneiss and mica schists of metamorphic series of amphibolite to greenschist facies from Cambrian to Ordovician educts. The Variscan granite intrusions underneath are responsible for multiple greisenization phases, which are directly linked to tin mineralization. These tin-bearing structures are present as sheeted vein complexes, stock works, and subordinate stratiform (skarn) bodies. Commonly, these mineralizations are associated with arsenopyrite. A later mineralization event of the so-called BiCoNi formation in the Erzgebirge region is also known from the Ehrenfriedersdorf tin district. It is associated with arsenopyrite and native arsenic. In 1990, the Ehrenfriedersdorf tin mine was abandoned after a 750-year mining history and flooded. The mine waters of this area exhibit contamination primarily by arsenic and fluoride. From a chemical perspective, the mine waters derive from near-surface groundwater sources. The ore dressing included various steps from crushing, separating, jigging, concentrating, grinding, sulfide flotation, and filtering. Notably, arsenic emerges as the main contaminant from historical mining activities, with anthropogenic anomalies concentrated at smelters, stamp mills, and tailing ponds.
Following the decommissioning of the mine, backfilling was carried out within the shafts and raises. Comprehensive surface damage analyses were conducted, and plans were made for flooding the mine. Both tailing bodies were covered with soil to mitigate dust emissions. However, the cover on the tailing bodies is relatively thin and supports sparse vegetation, rather than a proper recultivation layer, which may contribute to fluctuating and concentrated tailing outflows. Additionally, there has been no change in land use on the tailing bodies over the years.
The second level of the Sauberg mining area was transformed into a visitor mine [17]. Subsequently, it was found that this mine held potential for geothermal utilization of the mine water. Presently, it serves as a source of geothermal energy for several buildings in Ehrenfriedersdorf [18].
The mine subfields of Röhrenbohrer and Nordwestfeld were hydraulically decoupled during decommissioning from the center of the deposit (Sauberg–Ostfeld, Westfeld) using water dams. This initiative aimed to restore the original hydrological conditions by preventing the intermingling of mine waters and facilitating separate water management for each mine subfield.
Within the central deposit area, specifically, Sauberg–Ostfeld/Westfeld, six levels are present at varying distances. The Sauberg mine subfield spans horizontally between 1000 and 1500 m and vertically 250 m. Notably, the second level in the Sauberg–Ostfeld/Westfeld region features a permanent water outlet. This outlet serves the dual purpose of averting potential impacts from old mined areas above the second level and preventing uncontrolled water leaking to the surface. To provide a concise overview, the mine below the second level is flooded, while the area above the second level is drained by the Tiefer Sauberger Stolln (TSS) gallery. The mine waters from the deeper levels ascend through a winze to the gallery four meters below the second level, known as Gesenk 2. Sohle. Subsequently, these ascending waters join the TSS and exit at the TSS portal.
The Figure 2 displays the geographical setting:
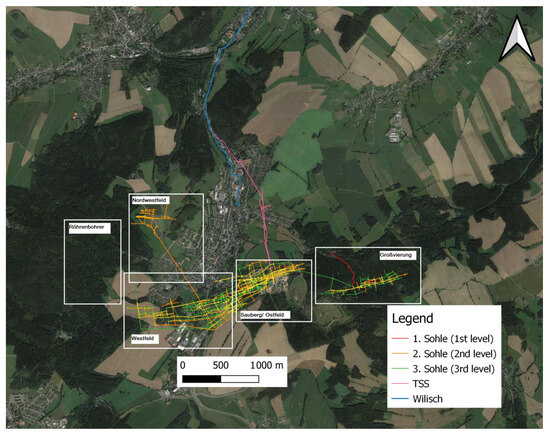
Figure 2.
Ehrenfriedersdorf with displayed mine plans and the Wilisch Creek, modified after [19], modified by Andy Tauber, 2008, and Zinnerz Ehrenfriedersdorf GmbH.
The TSS, excavated as early as the 16th century, extends for approximately two kilometers and effectively removes 1000 kg/a of arsenic, discharging it into the local drainage system. The discharge is initially to Wilisch Creek, which discharges into the Zschopau River, a tributary of the Freiberger Mulde River situated in the catchment area of the Elbe River [15,17].
As a result of a long-term experiment, the collected effluent from tailings known as “Rigole 28”, characterized by elevated concentrations of arsenic and heavy metals (pH 6.2–6.7, EH 230–380 mV, As 0.5–1.5 mg/L, Fe 2–7 mg/L, Mn 1.5–3.5 mg/L, Zn 1.5–2.5 mg/L), are reintroduced into the flooded mine body as a natural measure for mine water treatment. The mine water properties, including circumneutral pH, intrinsic iron, and aluminum content, have proven conducive to oxidizing iron from the tailing outflow, adsorbing arsenic onto iron hydroxides, and utilizing the flooded mine as a space for reaction and sedimentation. Consequently, the quality of the ascending waters at Gesenk 2. Sohle does not exhibit any deterioration even following the introduction of the tailing outflow [20,21].
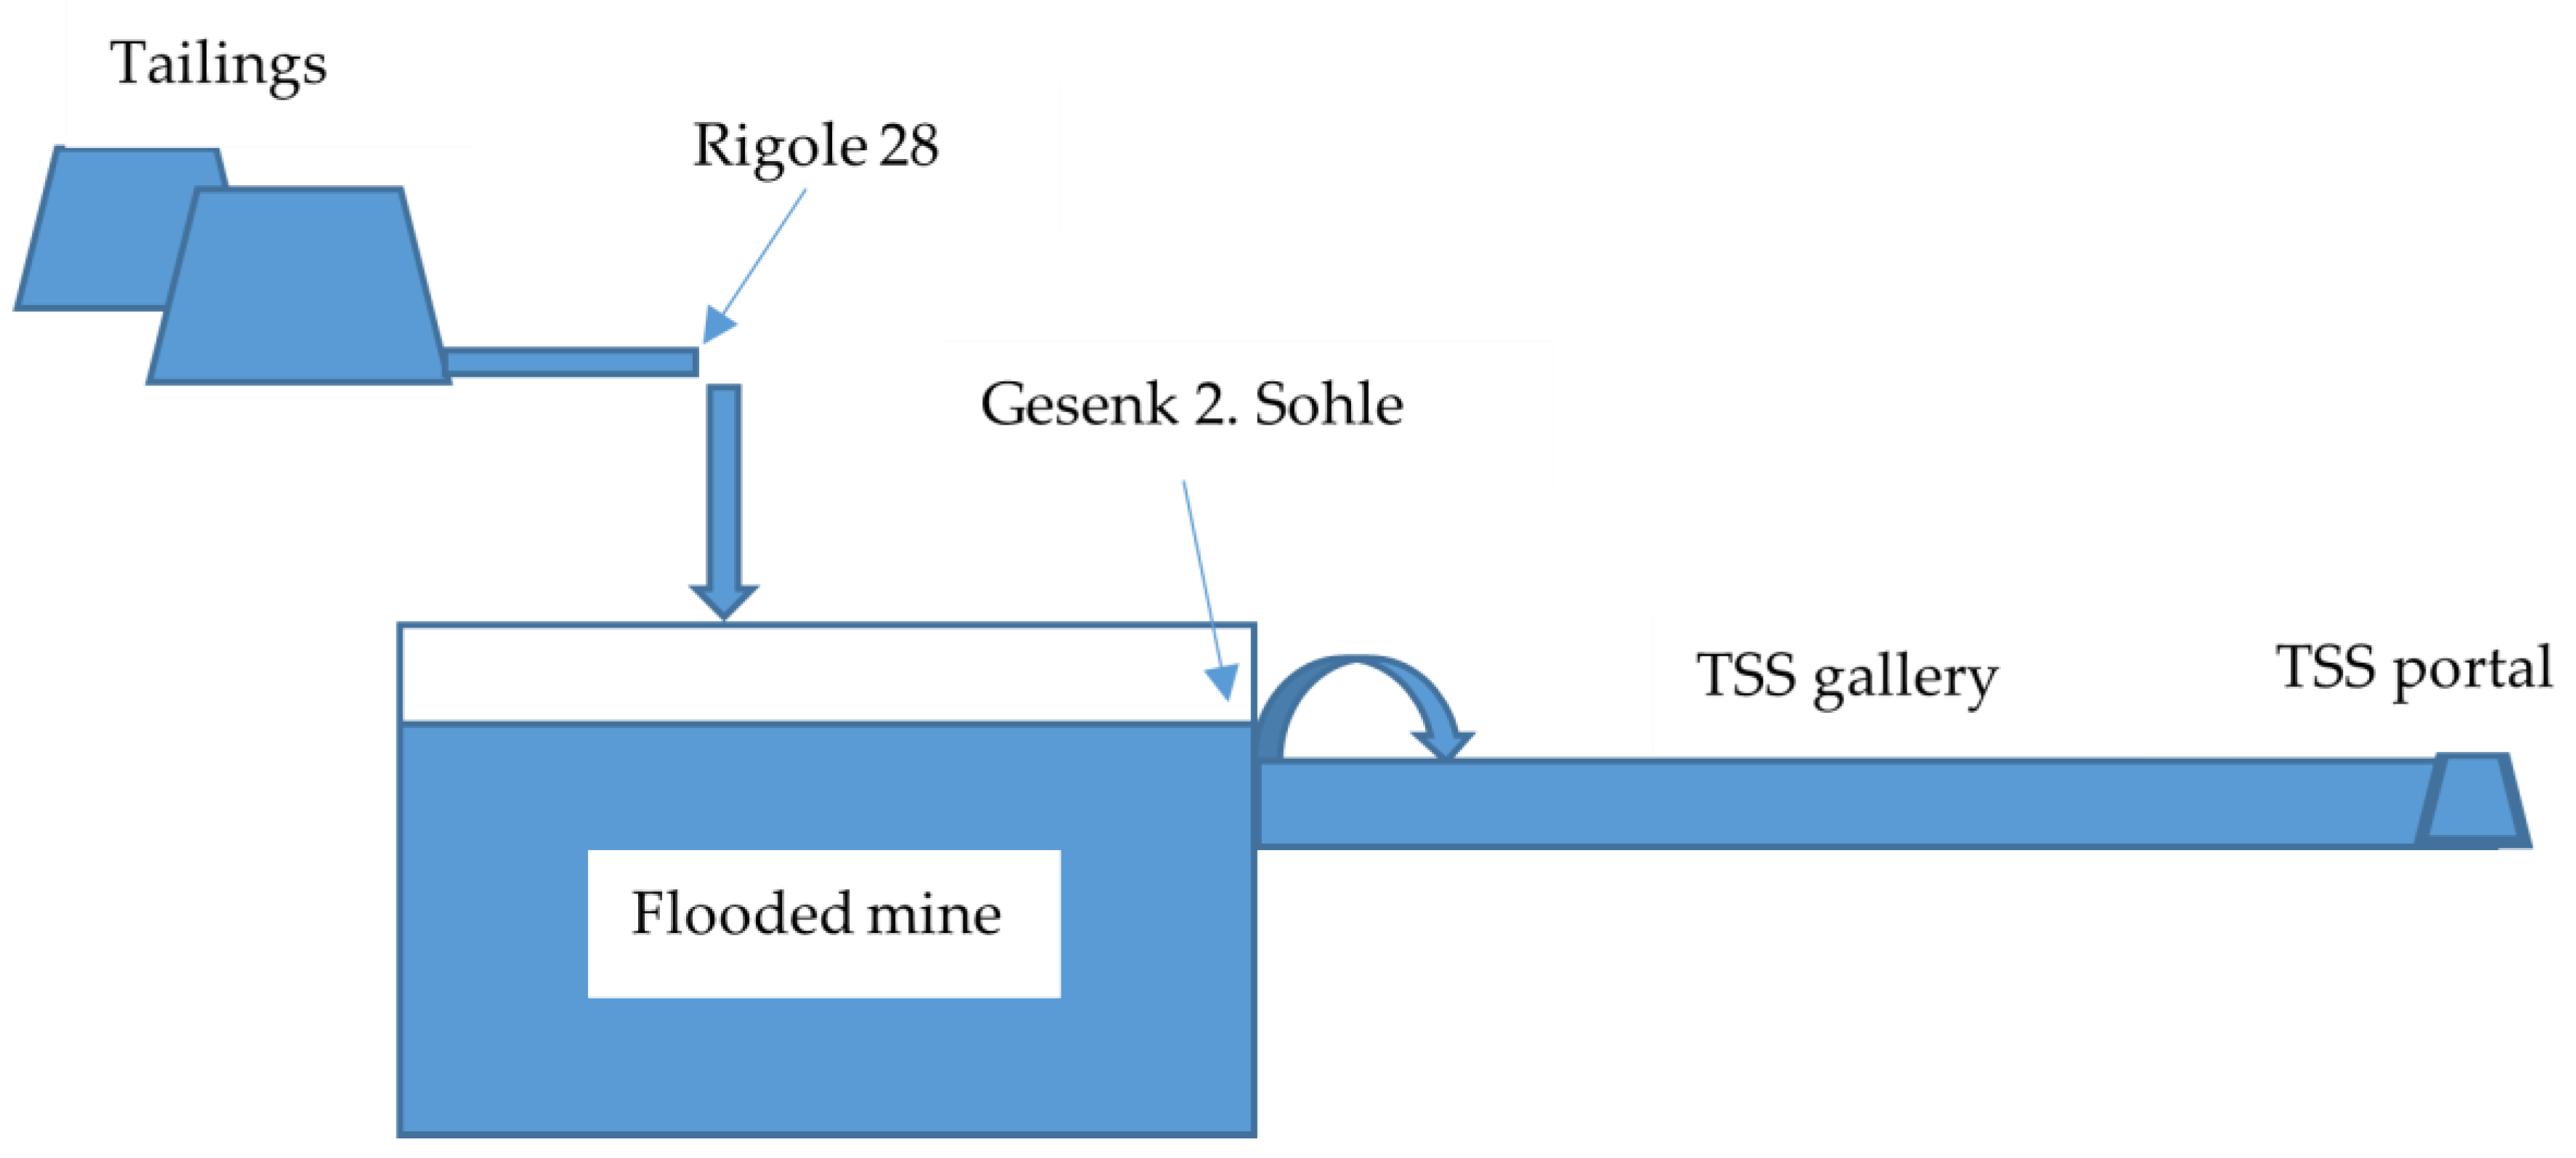
The Figure 3 displays a simplified mine flow chart.

Figure 3.
Simplified scheme of the Ehrenfriedersdorf mine (not drawn to scale).
1.2. Initial Situation
Following the completion of mine flooding, consistent and comprehensive monitoring of the mine water was not undertaken. The existing database is characterized by sparse data of uncertain quality, spanning from 2002 to 2015. The monitoring of mine water quality, starting in 1990, was confined to a limited set of parameters officially required by the Free State of Saxony. This restricted dataset makes a thorough evaluation of the geochemical and hydrological conditions challenging. Accessibility to the flooded mine is either non-existent or severely limited, resulting in a lack of spatial and temporal distribution data for physico-chemical parameters. Furthermore, the absence of flow models contributes to only a rough estimation of water movement within the flooded mine. During this timeframe, various projects and theses were conducted in the Ehrenfriedersdorf tin mine area, yielding isolated, short-term monitoring data [15,20,21,22,23,24].
In summary, it has been reported that approximately 40% of the mine water at the TSS portal originates from deeper mine levels flowing through the winze (Gesenk 2. Sohle). Here, arsenic and iron are predominantly present in a colloidal state (particles larger than 0.45 µm). Along the course of the TSS gallery, multiple diffuse water inflows carrying higher levels of As infiltrate and increase the gallery water throughput up to threefold. The mine water at the TSS portal exhibits nearly the same arsenic concentration (0.3 mg/L) but in a dissolved state (particles smaller than 0.45 µm). The discharge at the TSS portal and the volume of water passing through Gesenk 2. Sohle are not constant and vary considerably, presumably responsive to the hydrological situation. Furthermore, the behavior of the mine water at the portal deviates from a classical pattern—often, higher arsenic concentrations are observed with increased water throughput. In contrast, the chemistry at Gesenk 2. Sohle changes only slightly even with variations in water throughput in tenths of m3/h for water throughputs ranging from 40 to 120 m3/h in the observed period.
The full extent of the location and characteristics of the diffuse water inflows to the TSS gallery has not been described adequately in previous studies. These inflows, which appear to increase the volume of mine water about threefold and significantly contribute to the arsenic load, require efforts to locate them and assess their chemical properties.
Furthermore, while previous studies have observed variations in mine water discharges at Gesenk 2. Sohle and the TSS portal [15,24], the correlations to current weather conditions have not been investigated.
The water quality of the tailing outflow (Rigole 28) similarly exhibits changes linked to hydrological conditions. Between April 2021 and November 2022, arsenic concentrations in the outflow appeared to be increasing. In response to this trend, additional measurements of the flow rate at this sampling point were initiated, complementing the chemical analyses. Furthermore, considering the absence of data on arsenic speciation, a literature search was conducted to identify suitable analytical techniques and arsenic speciation was incorporated into our monitoring program. Thus, a complex monitoring program for a deeper understanding of the hydrological mine behavior was initiated.
1.3. Aim
The objective of this research is to understand the geochemical and hydrological controls of the system with the help of monitoring campaigns aimed at gathering ample site-specific data. This study encompasses a detailed description of the entire mine, including its subfields, with a subsequent focus on the most critical mine water intersection points. By correlating these physico-chemical parameters with local weather data, our goal is to enhance the understanding of the hydro(geo)logical processes within the mine site, with a specific emphasis on comprehending the mine’s dynamic with respect to arsenic and iron. Ultimately, our aspiration is to develop a model that predicts trends in arsenic and heavy metal concentrations at the site.
2. Materials and Methods
2.1. Sampling
The aim of mine water sampling is to capture a representative sample at a specific moment and ensure the constancy of parameters in the sample or subsample until analysis. On-site measurements of certain parameters, such as pH, electrical conductivity, and redox potential, were immediately conducted following sample collection using electrodes attached to a WTW Multimeter 3630 measurement device (Xylem Analytics Germany GmbH, Weilheim, Germany).
The following subsamples were taken and analyzed at our laboratory:
- A 20 mL brown glass bottle with a septum, filled bubble-free with a native sample for TIC, TC, TN, and KS, KB titration [25].
- A 50 mL brown glass bottle with a septum, filled bubble-free with a native sample for photometrical analysis of anions [26].
- A 20 mL brown glass bottle containing 5 mL stabilization agent, filled with 15 mL of a native sample for photometric analysis of sulfide [27,28].
- A 10 mL PE bottle with Hach’s Ferrous Iron Powder Pillow Reagent, filled with 10 mL of a 0.45 µm filtered sample for photometric Fe2+ determination [29,30].
- A 50 mL PE bottle, filled with a native sample, stabilized with 1 Vol% of Suprapur® (Merck, Warsaw, Poland) concentrated HNO3 for MP-AES analysis.
- A 50 mL PE bottle, filled with 5 µm filtered (over cellulose–acetate syringe filter) sample, stabilized with 1 Vol% of Suprapur® concentrated HNO3 for MP-AES analysis.
- A 50 mL PE bottle, filled with a 0.45 µm filtered (over cellulose acetate syringe filter) sample, stabilized with 1 Vol% of Suprapur® concentrated HNO3 for MP-AES analysis.
Sulfate, chloride, ferrous iron, and sulfide were measured using a DR3900 photometer (Hach Lange GmbH, Düsseldorf, Germany). TIC, TC, and TN measurements were conducted using a TOC analyzer multi N/C 2100S (Analytik Jena GmbH+Co. KG, Jena, Germany). Metal concentrations were analyzed using microwave-plasma atom emission spectrometer 4200 MP-AES (Agilent Technologies Deutschland GmbH, Waldbronn, Germany). Arsenic was determined using MP-AES with a multiple sample introduction system (MSIS).
Data from chemical analyses were computed using PHREEQC geochemical modeling code by using the WATEQ4F hydrogeochemical database [31].
Between April 2021 and November 2023, a total of 14 sampling campaigns were conducted.
2.2. Arsenic Speciation
Based on the findings of [32,33], a method for on-site arsenic speciation based on selective retention onto solid-phase ion exchanger cartridges (Supelco LC-SAX SPE) was tested, validated, and applied as follows:
- LC-SAX SPE cartridges were preconditioned with a mixture of methanol and ultrapure water.
- Immediately after drawing the sample, 15 mL of a 0.45 µm filtered sample was run through the cartridge at a max. speed of 5 mL/min, and the eluate was collected in a 20 mL PE bottle and subsequently stabilized with 1 Vol% of Suprapur® concentrated HNO3.
As (V) is retained in the exchanger column, while As (III) does not react with the exchanger. Therefore, As (III) can be analyzed in the eluted subsample using the usual MSIS-MP-AES method, whereas total As can be determined from a native or 0.45 µm (total dissolved) filtered sample. The method is valid for use in waters where the presence of organic As species can be excluded.
2.3. Hydrological Data
The challenges posed by the limited availability of data needed a pragmatic approach. To establish a correlation between weather data from the Ehrenfriedersdorf site and the water throughput at the TSS portal, we applied the climatic water balance (CWB). The climatic water balance represents the difference between the precipitation amount and the potential evapotranspiration within a specified timeframe at a particular location. Given its consideration of potential evapotranspiration, the CWB offers a more precise reflection of ground- and mine water formation compared with relying solely on precipitation amounts, making it more suitable for hydroclimatic characterization. Climatic water balances can manifest as either positive (surplus) or negative (deficit) values. It is essential to acknowledge that the numerical values of the CWB may vary based on the computation method used for input data. Additionally, various formulations exist for calculating potential evapotranspiration.
In this context, we utilized the potential evapotranspiration calculation valid in Germany, based on Haude [34], since it does not require an extensive weather data pool. The potential evapotranspiration is derived from a saturated vapor pressure at 2 pm, relative air humidity at 2 pm, and a monthly coefficient as follows:
- x: monthly coefficient (Jan 0.26; Feb 0.26; Mar 0.33; Apr 0.39; May 0.39; Jun 0.37; Jul 0.35; Aug 0.33; Sep 0.31; Oct 0.26; Nov 0.26; Dec 0.26).
- H14: relative humidity at 2 pm.
- t: air temperature at 2 pm.
3. Results
3.1. Monitoring
3.1.1. Characterization of Mine Subfields
The Table 1 displays pH and electrical conductivity as well as redox potential data in the main mine subfields.

Table 1.
Mine subfields with their basic characteristics.
As mentioned earlier, Nordwestfeld is hydraulically decoupled by a dam from the other mine subfields. The sample was collected at a dam discharge valve. The water exhibits a neutral pH, oxidized redox potential, and low electrical conductivity. As, Fe, Mn, and Ni are present in low concentrations and can be effectively removed through filtration.
Mine water samples from Westfeld display higher variations in their metal concentrations. We observe elevated concentrations of As, Ba, Cd, Cu, and Fe in Westfeld; however, these can be easily remedied with a 0.45 µm filter.
The galleries Großvierunger Stolln and Greifensteinstolln, representative of the mine subfields Vierung and Röhrenbohrer, respectively, generally channel oxidized waters with low mineralization levels. Most metal species and arsenic are found in “very low” to “low” concentrations and in a dissolved state (<0.45 µm).
Mine water samples from Ostfeld/Sauberg are oxidized and exhibit higher electrical conductivity compared with Nordwestfeld and Westfeld, respectively. This is attributed to a greater number of mine workings in this mine subfield. Additionally, in comparison with samples from other fields, the Ostfeld/Sauberg samples show higher concentrations of Al, Mn, Ni, Sr, and Zn. As and Fe are predominantly present in a colloidal form (>0.45 µm), while other elements are mostly in a dissolved state.
3.1.2. Characteristics of the Tailing Outflow Rigole 28
Rigole 28 demonstrates the highest measured electrical conductivity among all the collected samples, along with the lowest pH and redox potential. Correspondingly, the concentrations of measured anions, arsenic, and metals also attain peak values. Furthermore, the majority of elements are found in a dissolved state. Exclusively at this sampling point, As (III) was detected using the method described in Section 2.2. As a rule of thumb, the concentration of dissolved arsenic roughly corresponds to the concentration of As (III).
Furthermore, during our sampling campaign, we occasionally detected sulfide concentrations in the tailing outflow. Upon closer examination of the photometric measurements, we observed a shift in the absorption maximum of the methylene blue–sulfide complex to a shorter wavelength. This suggests that the measured sulfide concentrations may be overestimated. Alternatively, the presence of reduced sulfur species, which are pertinent to mine waters with a reduced redox potential, could also explain these findings [28].
3.1.3. Report on the Ascending Mine Waters at Gesenk 2. Sohle
The milieu parameters at Gesenk 2. Sohle show minimal variation. The obtained mine water at this location maintains a circumneutral pH, oxidized redox potential, and an EC of 0.6 mS/cm. The concentrations of Al, Mn, and Zn appear to exhibit a gentle decreasing trend, while Fe and Mn are prone to slightly higher fluctuations. Notably, the concentration of As remains stable. Al, Mn, Sr, and Zn are found in a dissolved state, while Fe is predominantly present in a colloidal form. Approximately one-third of the arsenic exists in a dissolved state.
3.1.4. Characteristics of the Mine Water at the Portal of the Dewatering Gallery Tiefer Sauberger Stolln
The water’s pH is slightly above 7, the redox potential indicates a moderately oxidized environment, and the electrical conductivity is low. Except for Fe, the other metals and As predominantly exist in a dissolved form. There is no discernible overall trend in the concentrations of these elements. The median total As concentration here is 0.38 mg/L, whereas at Gesenk 2. Sohle, it is 0.25 mg/L.
During the sampling campaigns, it was apparent that Wilisch Creek, which flows somewhat parallel to the course of the TSS gallery, sometimes disappears in its riverbed underground. It was noted that it disappears sometimes closer to the portal of the TSS gallery, sometimes further south of the portal, and sometimes, the creek flows as usual and joins with the gallery outflow a few tenths of meters away from the portal.
Moreover, a chemical resemblance between the gallery outflow and the creek has been noticed, where the courses of earth’s alkaline elements, including sulfate, chloride, Al, and Fe, were very similar. Thus, it has become evident that Wilisch water seeps into the gallery and “dilutes” the mine water.
The As concentration in Wilisch corresponds to the geogenic background levels of the area (0.06 mg/L). Therefore, between the winze of ascending mine waters (Gesenk 2. Sohle) and the TSS portal, infiltrating Wilisch water can be held responsible for the increased water throughput in the gallery but cannot be held responsible for the elevated As content in the mine water measured at the portal.
3.2. Hydrological Behavior of the Mine System
3.2.1. TSS Portal Water Discharge
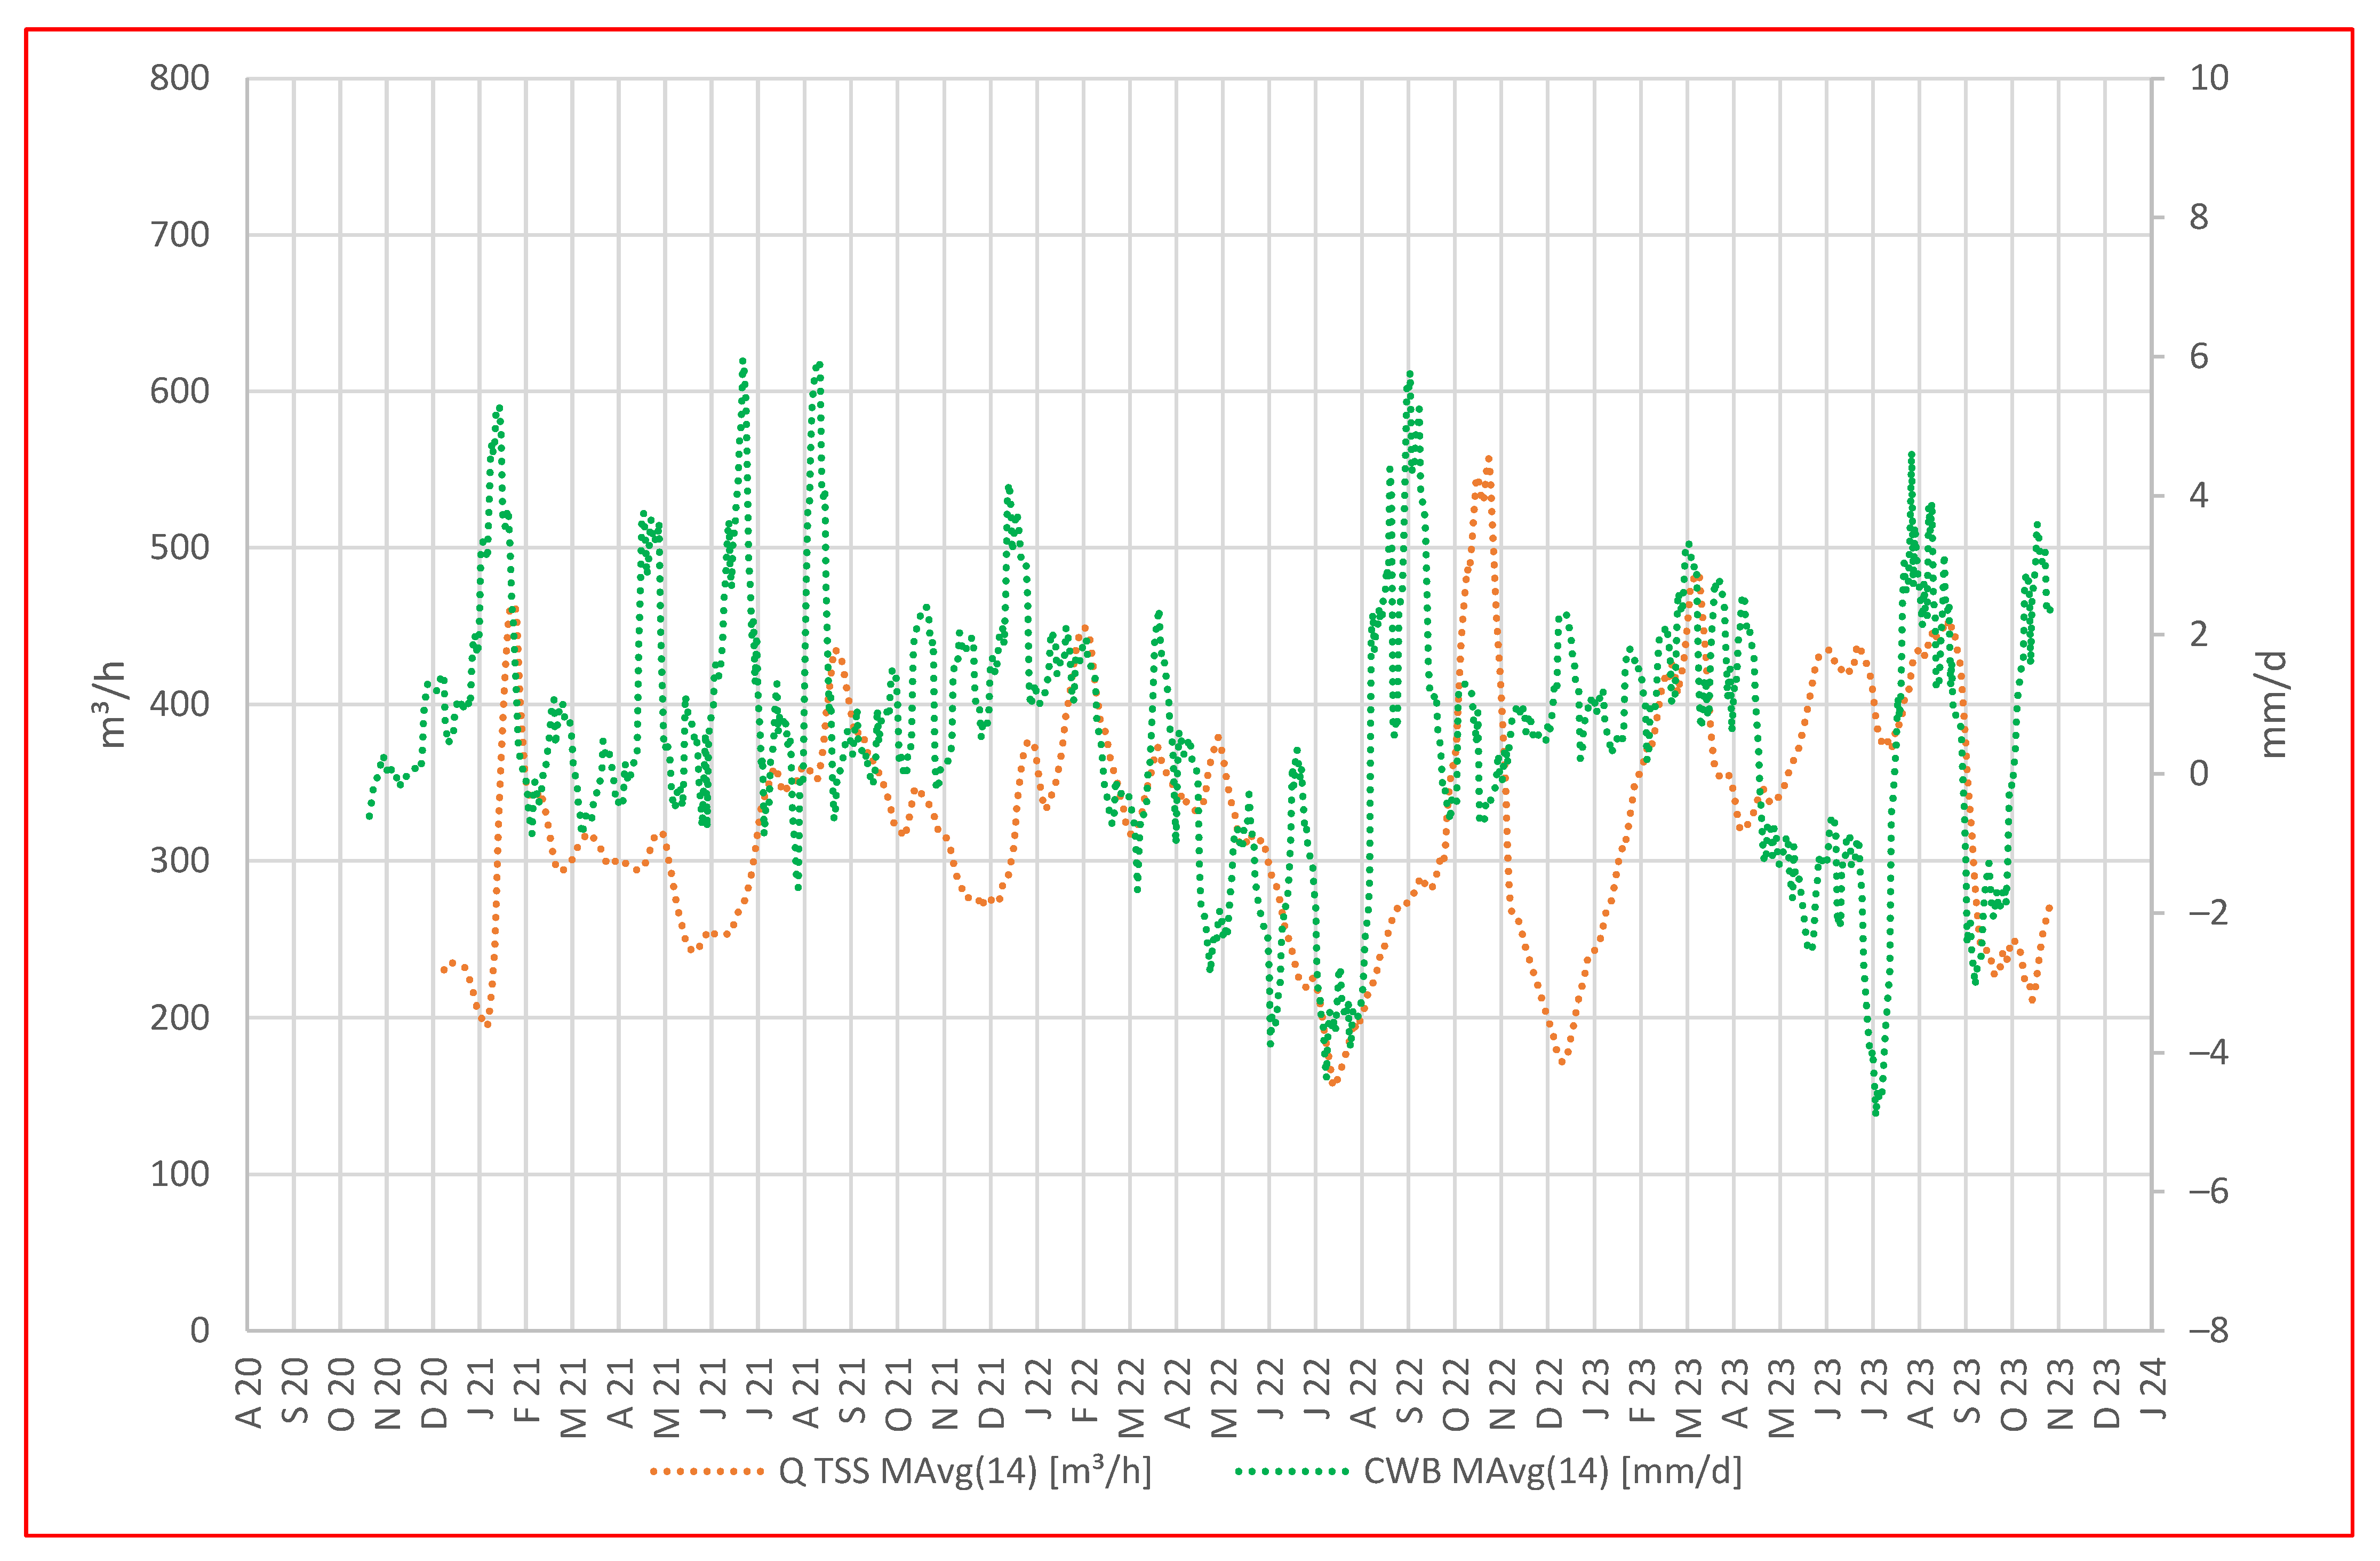
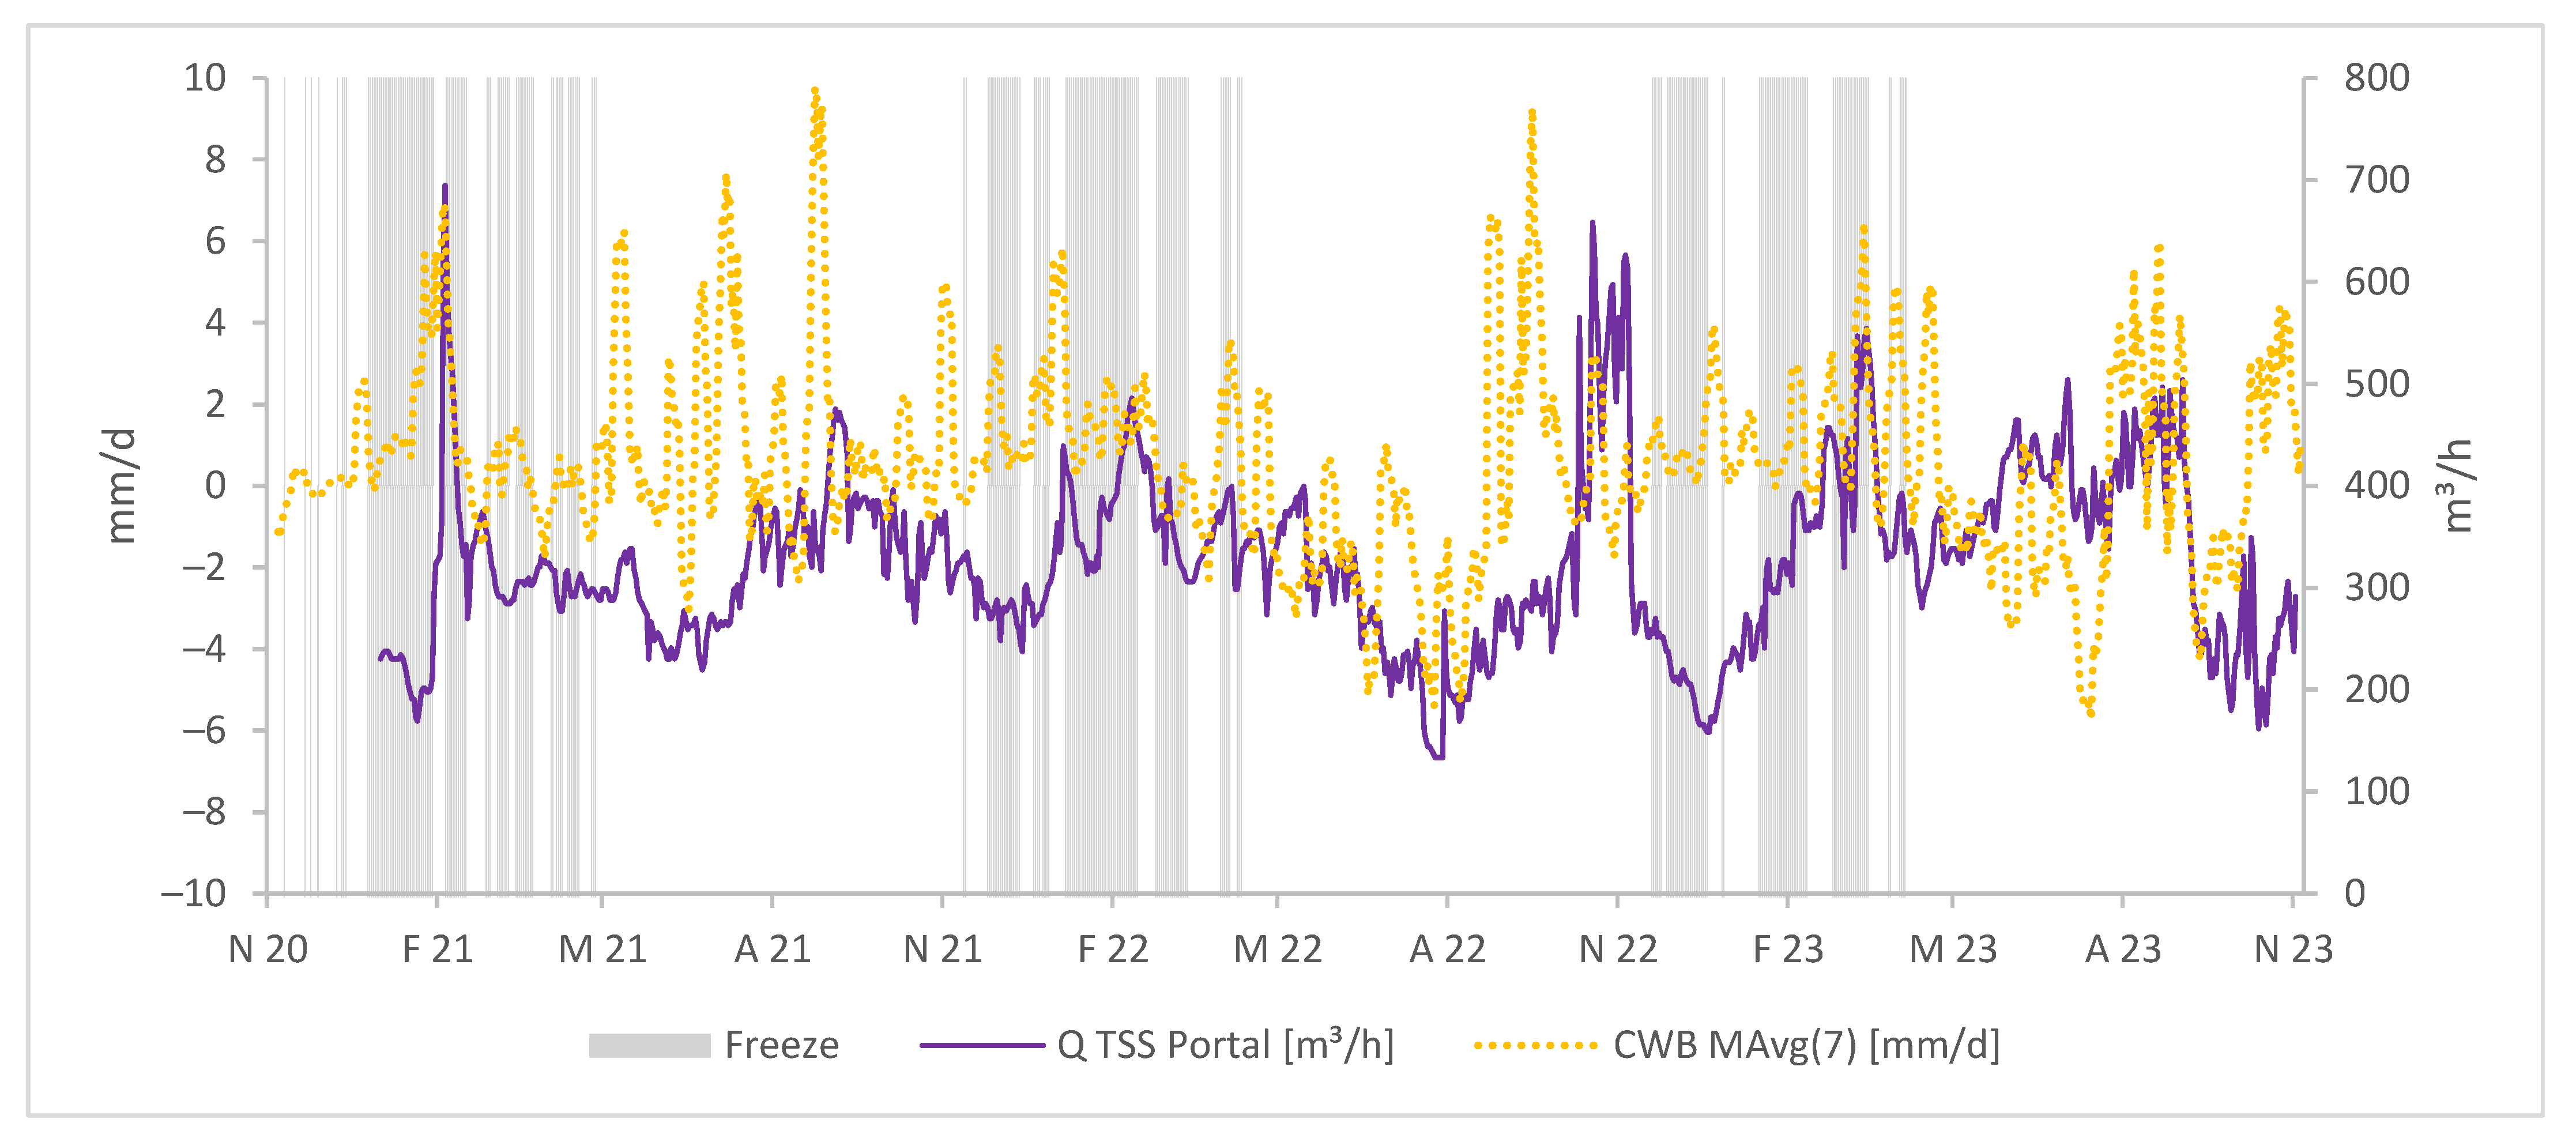
To explore the mine’s response to local precipitation and climatic water balance, in Figure 4, we compare a representation of daily CWB with the daily average water discharge rate at the TSS portal.
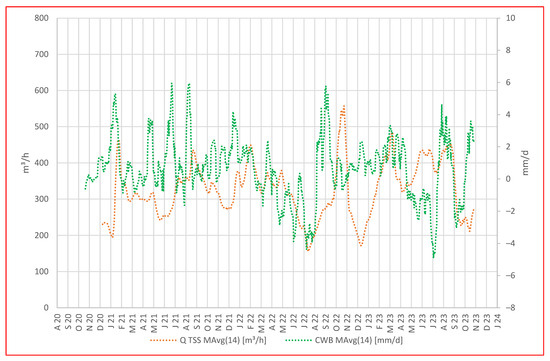
Figure 4.
Daily value of CWB in mm/d vs. daily average discharge rate in m3/h displayed as moving averages.
From the beginning of the hydrological year 2021 (November 2020) until the beginning of the hydrological year 2023 (November 2022), the discharge rate at the TSS portal appears to mirror the overall pattern in the climatic water balance, with a short delay. Periods characterized by peak CWB values succeed after about 14 days by peaks in discharge at the portal, while periods with low to negative CWBs correspond to reduced water discharge at the portal.
In addition, we observed an intriguing phenomenon during the summer of 2022, characterized by a local minimum in climatic water balances (CWBs) and discharge, indicating an extended dry period. Shortly thereafter, a significant CWB peak suggested persistent and heavy precipitation; however, there was initially no change in water discharge at the portal. More than 6 weeks later, the water discharge abruptly increased within 2 days and then dropped to a minimum again despite positive CWBs (October–November 2022). It is hypothesized that during the dry period, the timbers used as fill and support material in galleries and raises may have dried up and deteriorated, leading to temporary clogging in a section of the Tiefer Sauberger Stolln (TSS) gallery or further inside the mine. Subsequent heavy rainfall likely caused the mine water to accumulate behind the barrier, and when the barrier gave way due to water pressure, the outflow from TSS increased abruptly and remained high for several days. The subsequent period of low discharge can be attributed to the refilling of voids in the structures above and within the TSS gallery.
The calculation of climatic water balance (CWB) represents the difference between precipitation and potential evapotranspiration; therefore, we must consider potential differences in a real scenario where actual evapotranspiration occurs. Calculating with potential evapotranspiration does not accurately account for factors like vegetation type, vegetation periods, or freeze periods. Consequently, discrepancies between CWB trends and mine discharge rates may emerge.
In Figure 4, we observe such discrepancies, e.g., in Apr–July 2021, where water discharge at the portal is low despite a positive CWB. Equally, during the winter months, especially with snow cover and freeze, anticipating high discharge rates is unrealistic as mine water forms at a slower rate.
Figure 5 additionally displays the freeze periods in the observed time period.
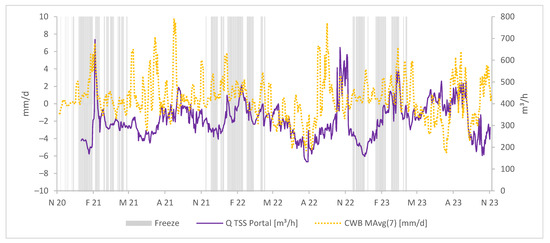
Figure 5.
Daily CWBs in mm/d as a moving average, freeze periods, and average daily water discharges at the TSS portal in m3/h.
Notably, from December 2022 to March 2023, between freeze periods, water discharge rates rapidly increase while CWBs remain relatively stable. This observation suggests the potential mixing of mine water with surface water, a point we will explore further in the Discussion Section.
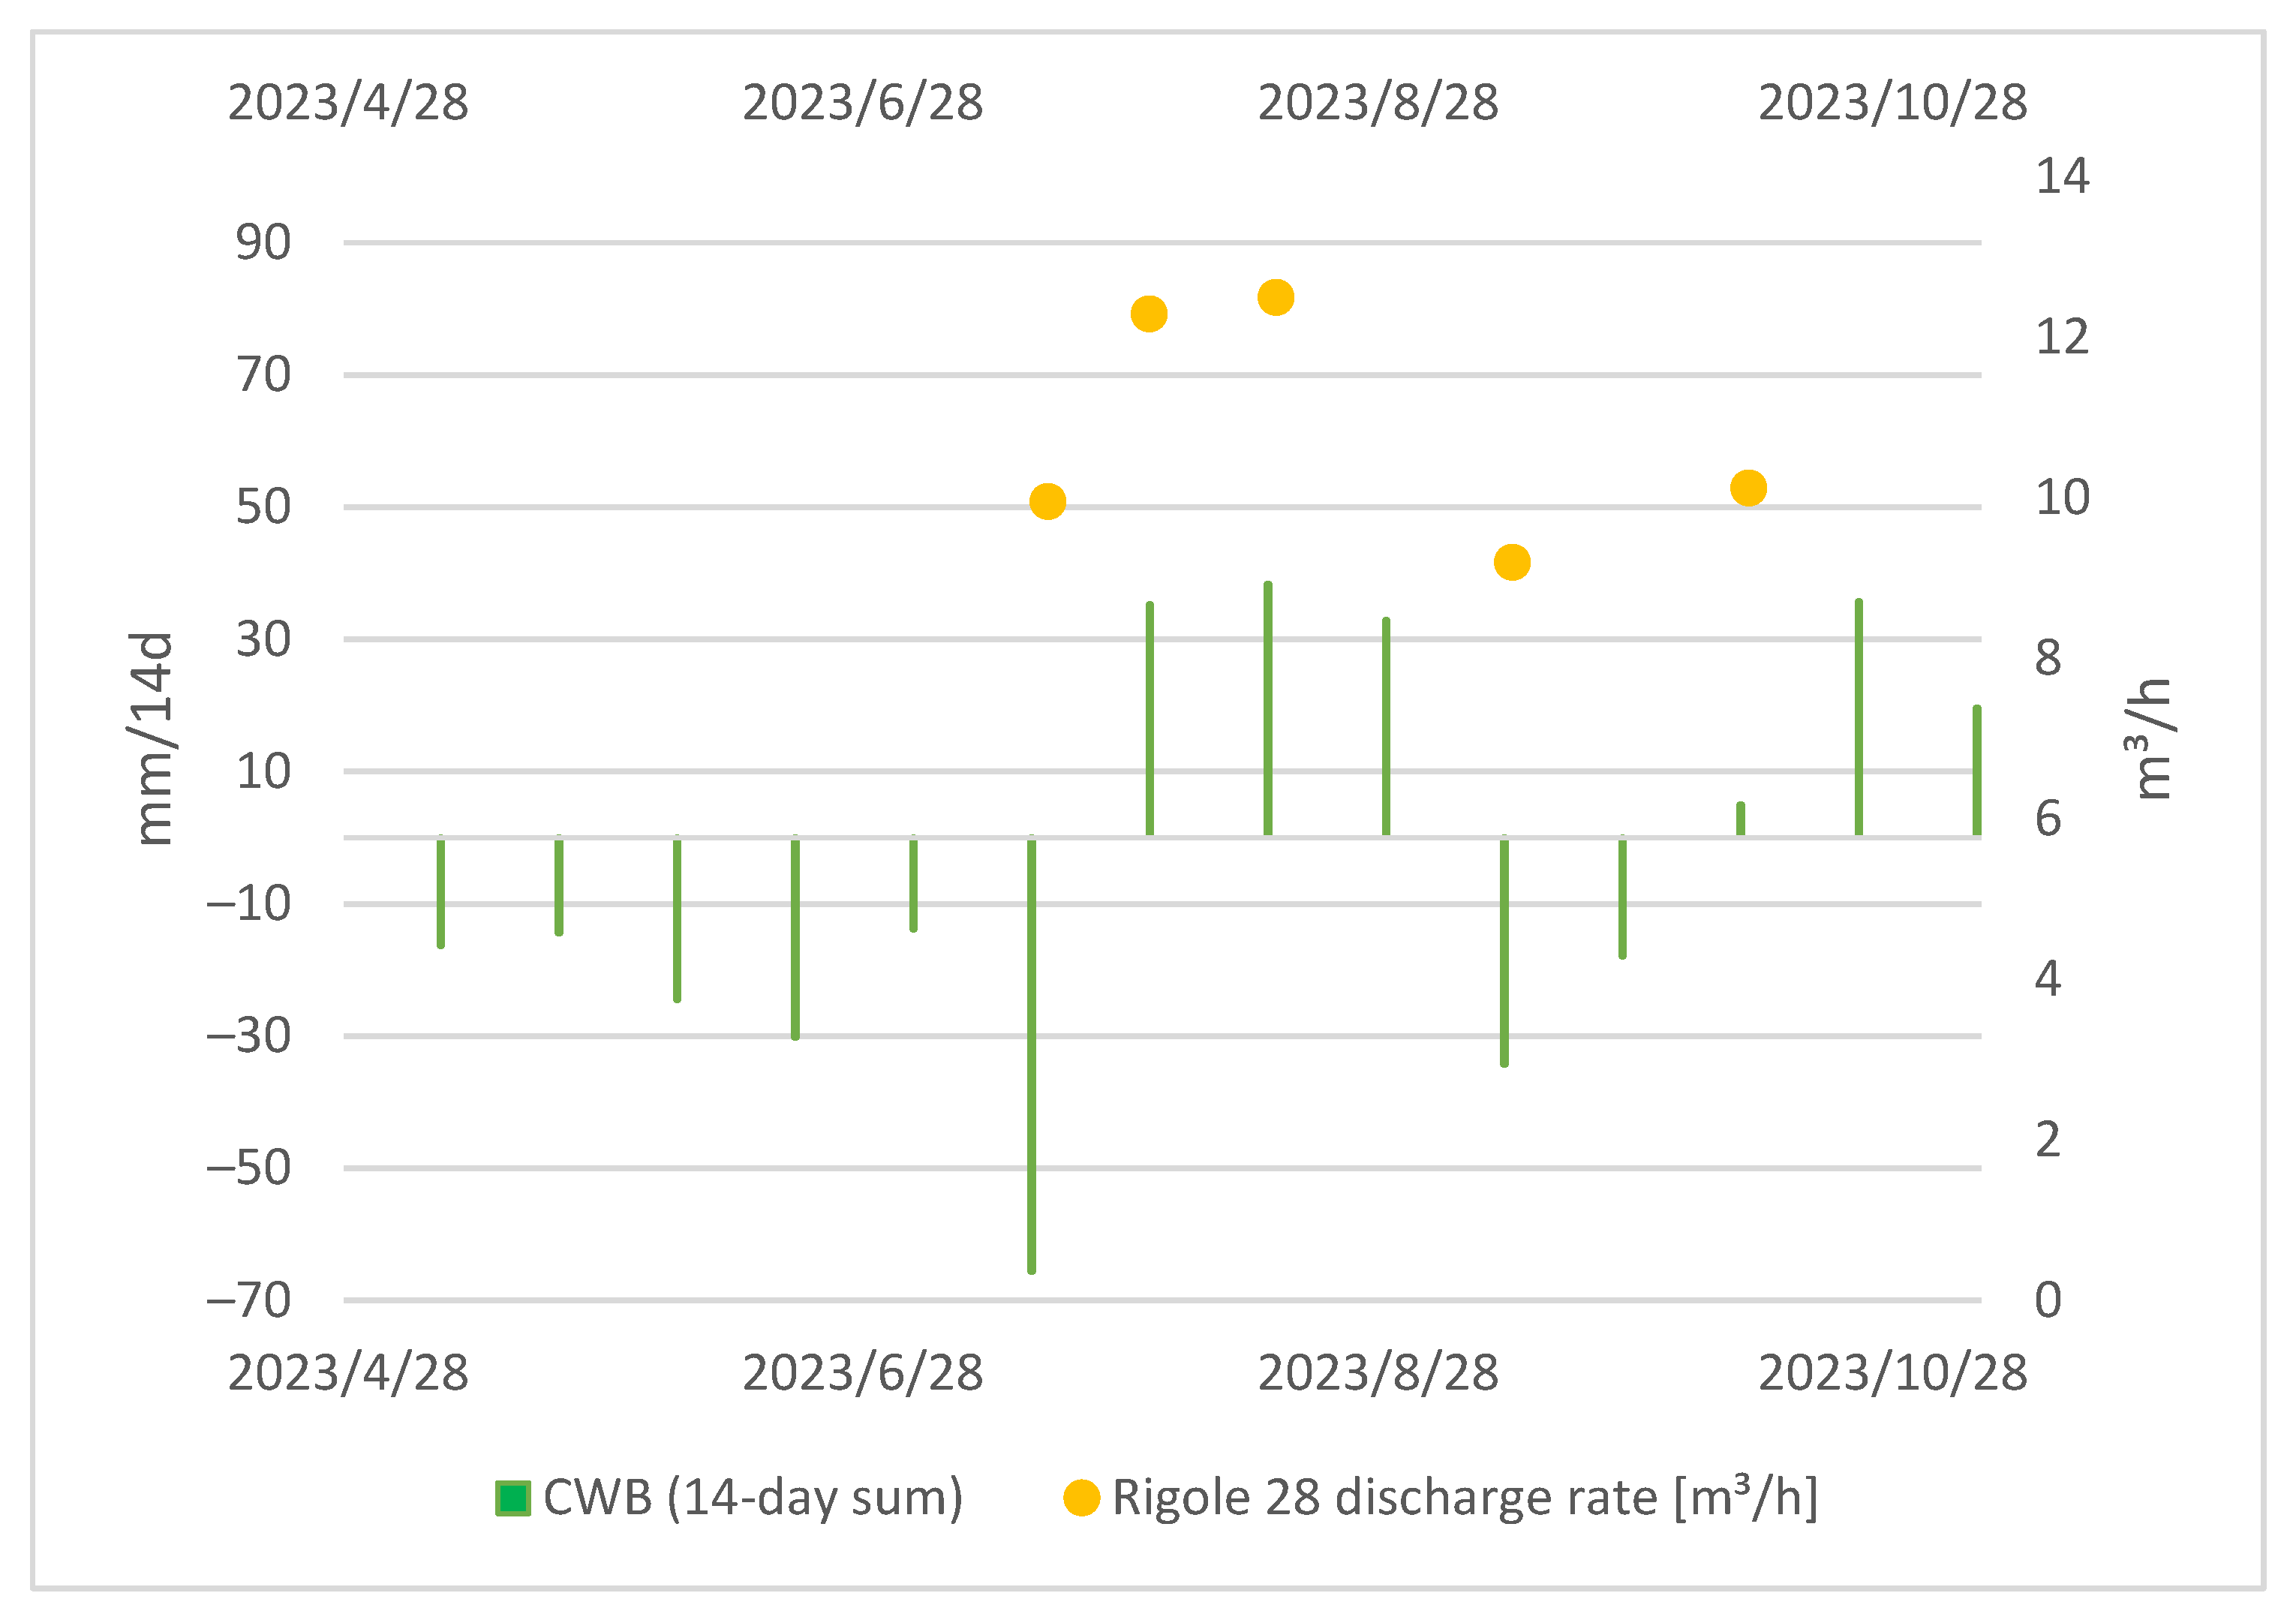
3.2.2. Tailing Discharge Rigole 28
The measurement of the discharge rate at the tailings began later in the project, primarily because of organizational and technical constraints. The challenging terrain and unique properties of the mine water at the discharge duct called for a specific setup. Despite this, the correlation between the water discharge at Rigole 28 and CWBs is obvious, as displayed in Figure 6.
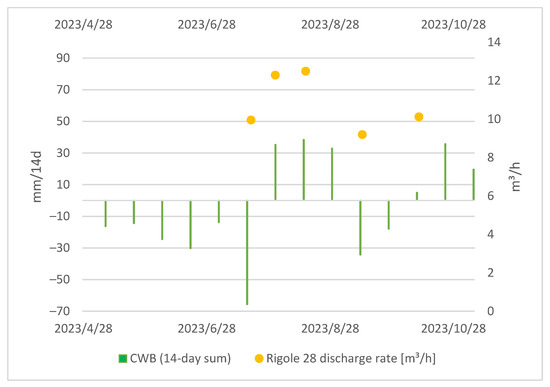
Figure 6.
Local CWBs (14-day sum) and tailing discharge at Rigole 28.
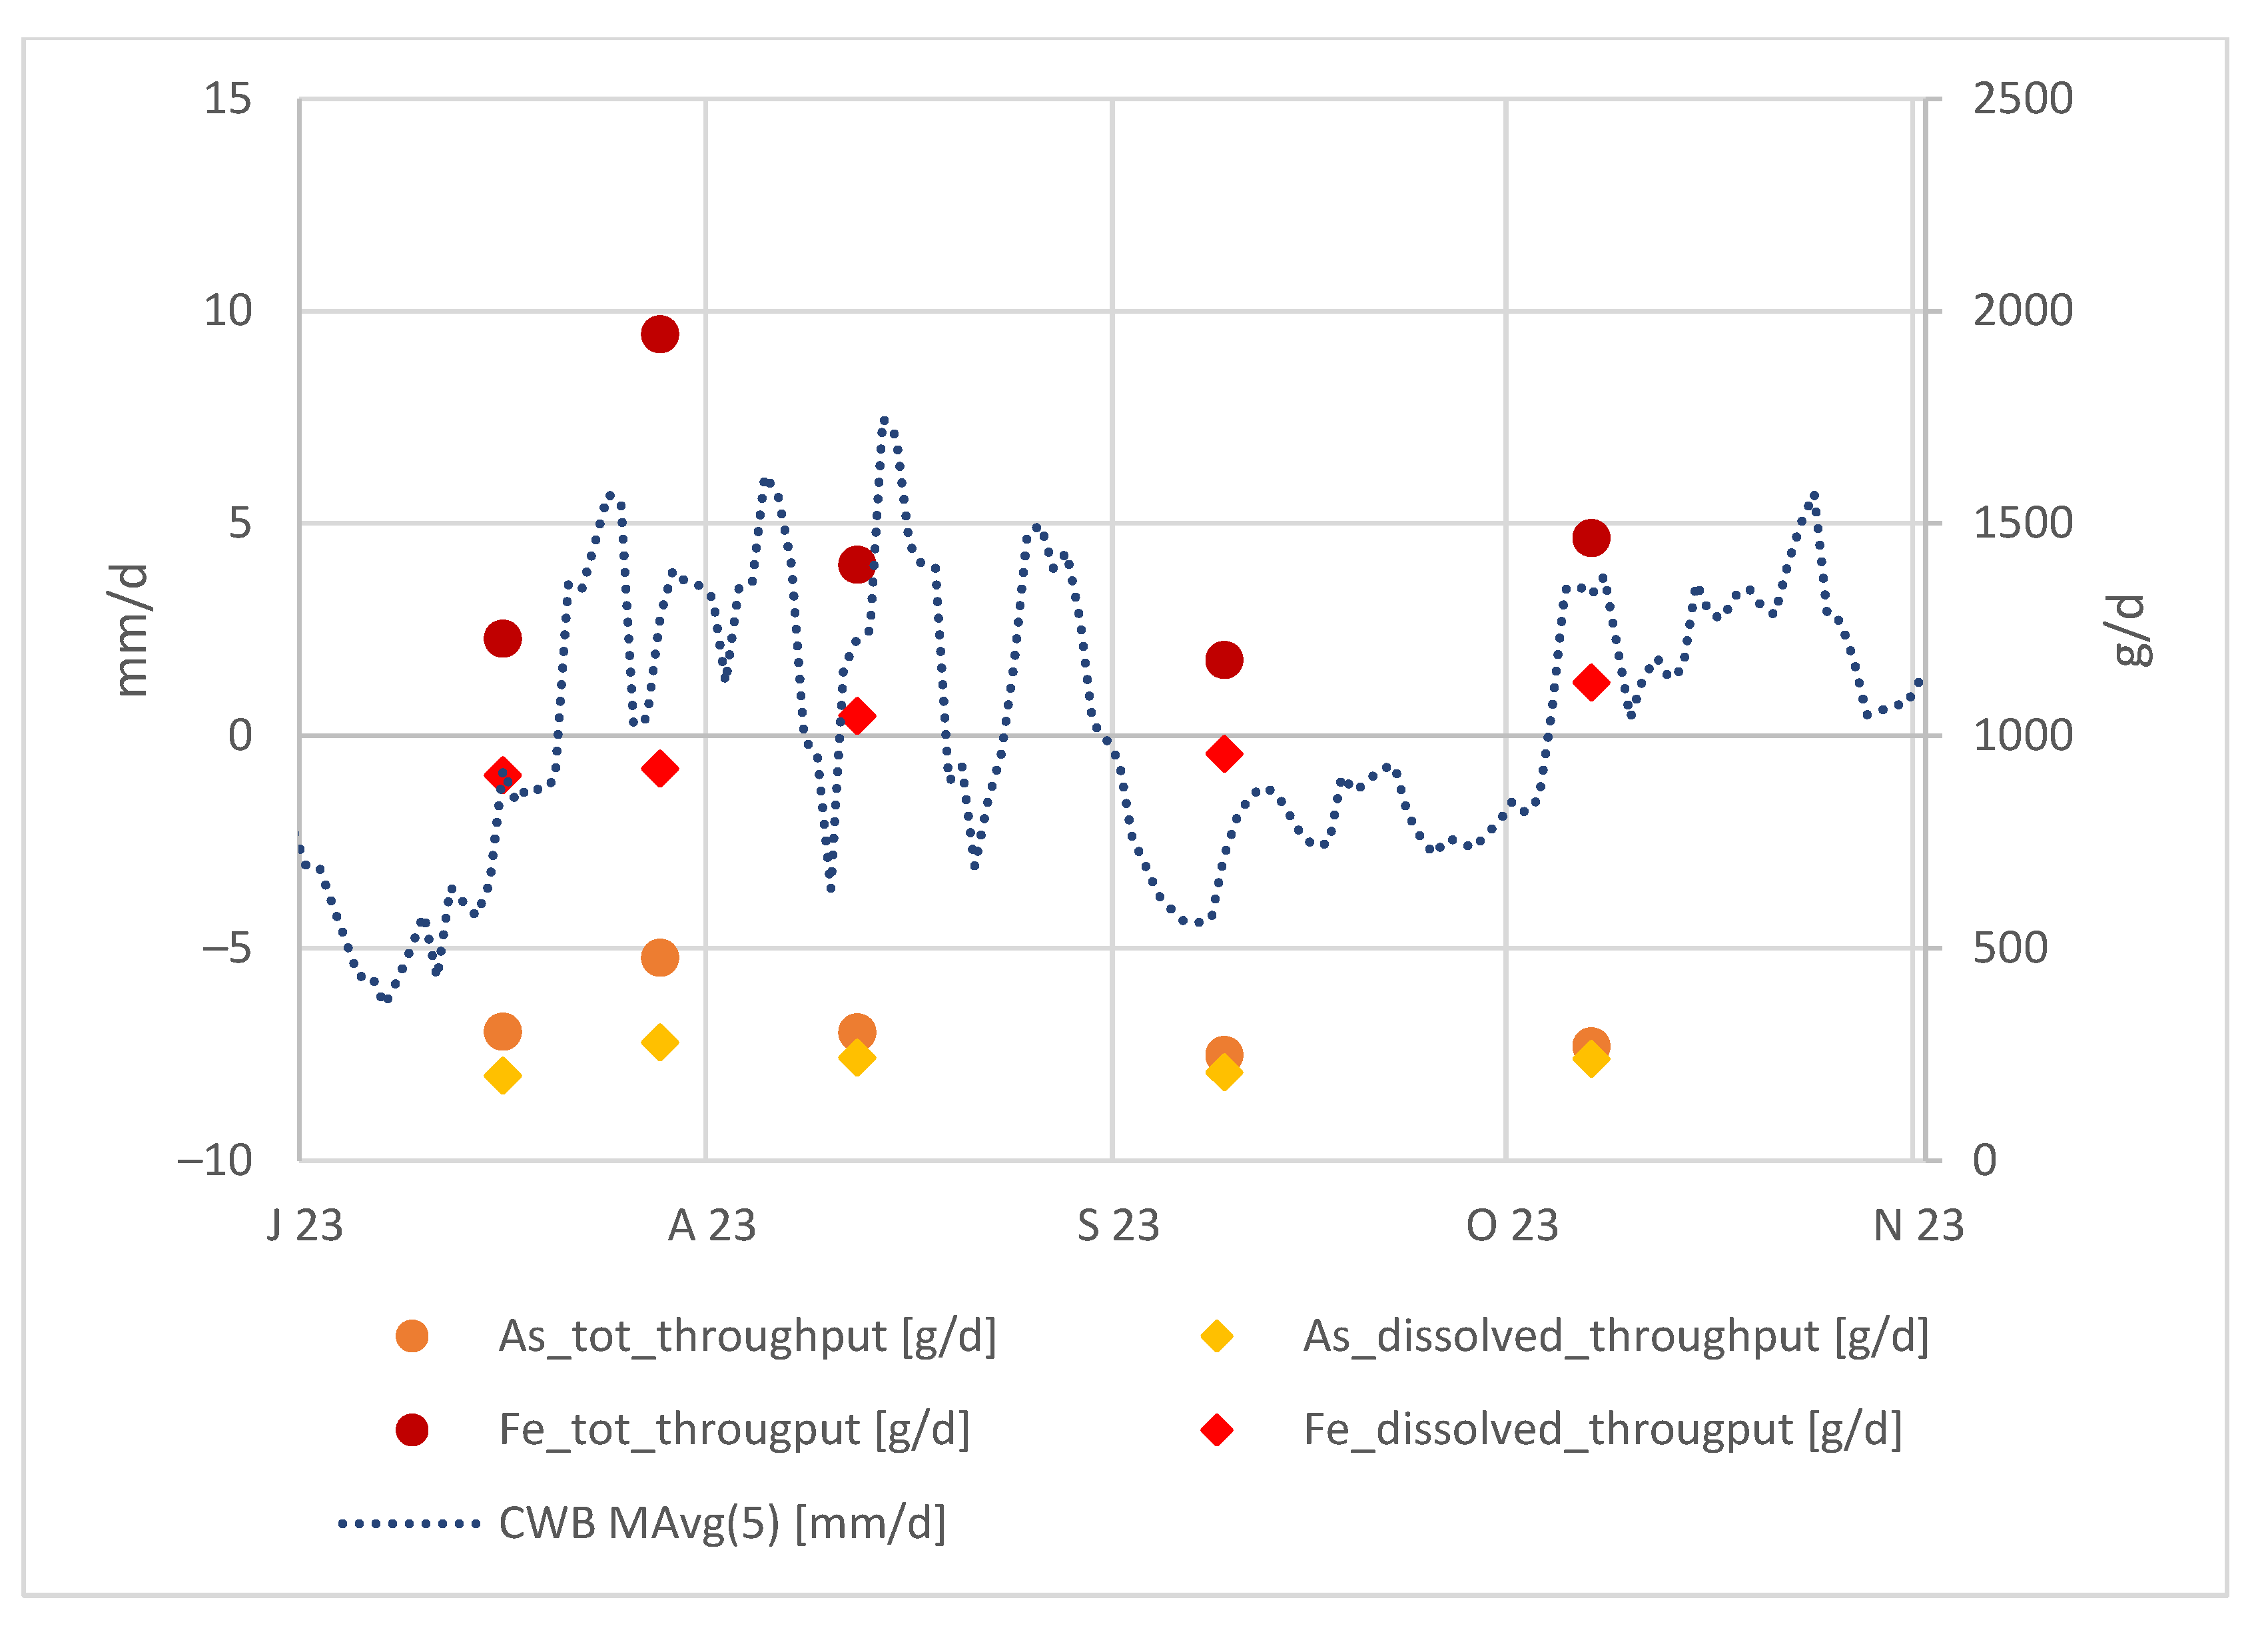
Apart from this, we can examine the absolute arsenic and iron values in the tailing outflow in relation to the local CWBs as shown in the Figure 7:
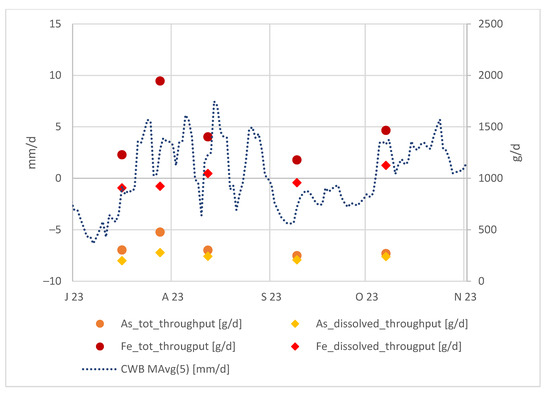
Figure 7.
Local CWBs (moving average of 5 days) and As and Fe throughput in the tailing discharge at Rigole 28.
When considering the As and Fe throughput in the tailing discharge, they clearly follow the CWB trend. This is because, after a period of lower CWBs, the water infiltrating into the tailings becomes more concentrated, and the elevated As and Fe concentrations are detectable shortly after a period with higher precipitation.
Moreover, we can affirm that when Fe predominantly exists in a colloidal form, As is similarly prevalent in a colloidal state, and vice versa. A notable trend is observed: a larger gap between total and dissolved Fe corresponds to a larger gap between total and dissolved As. This behavior is anticipated, given that arsenic is bound to iron hydroxides.
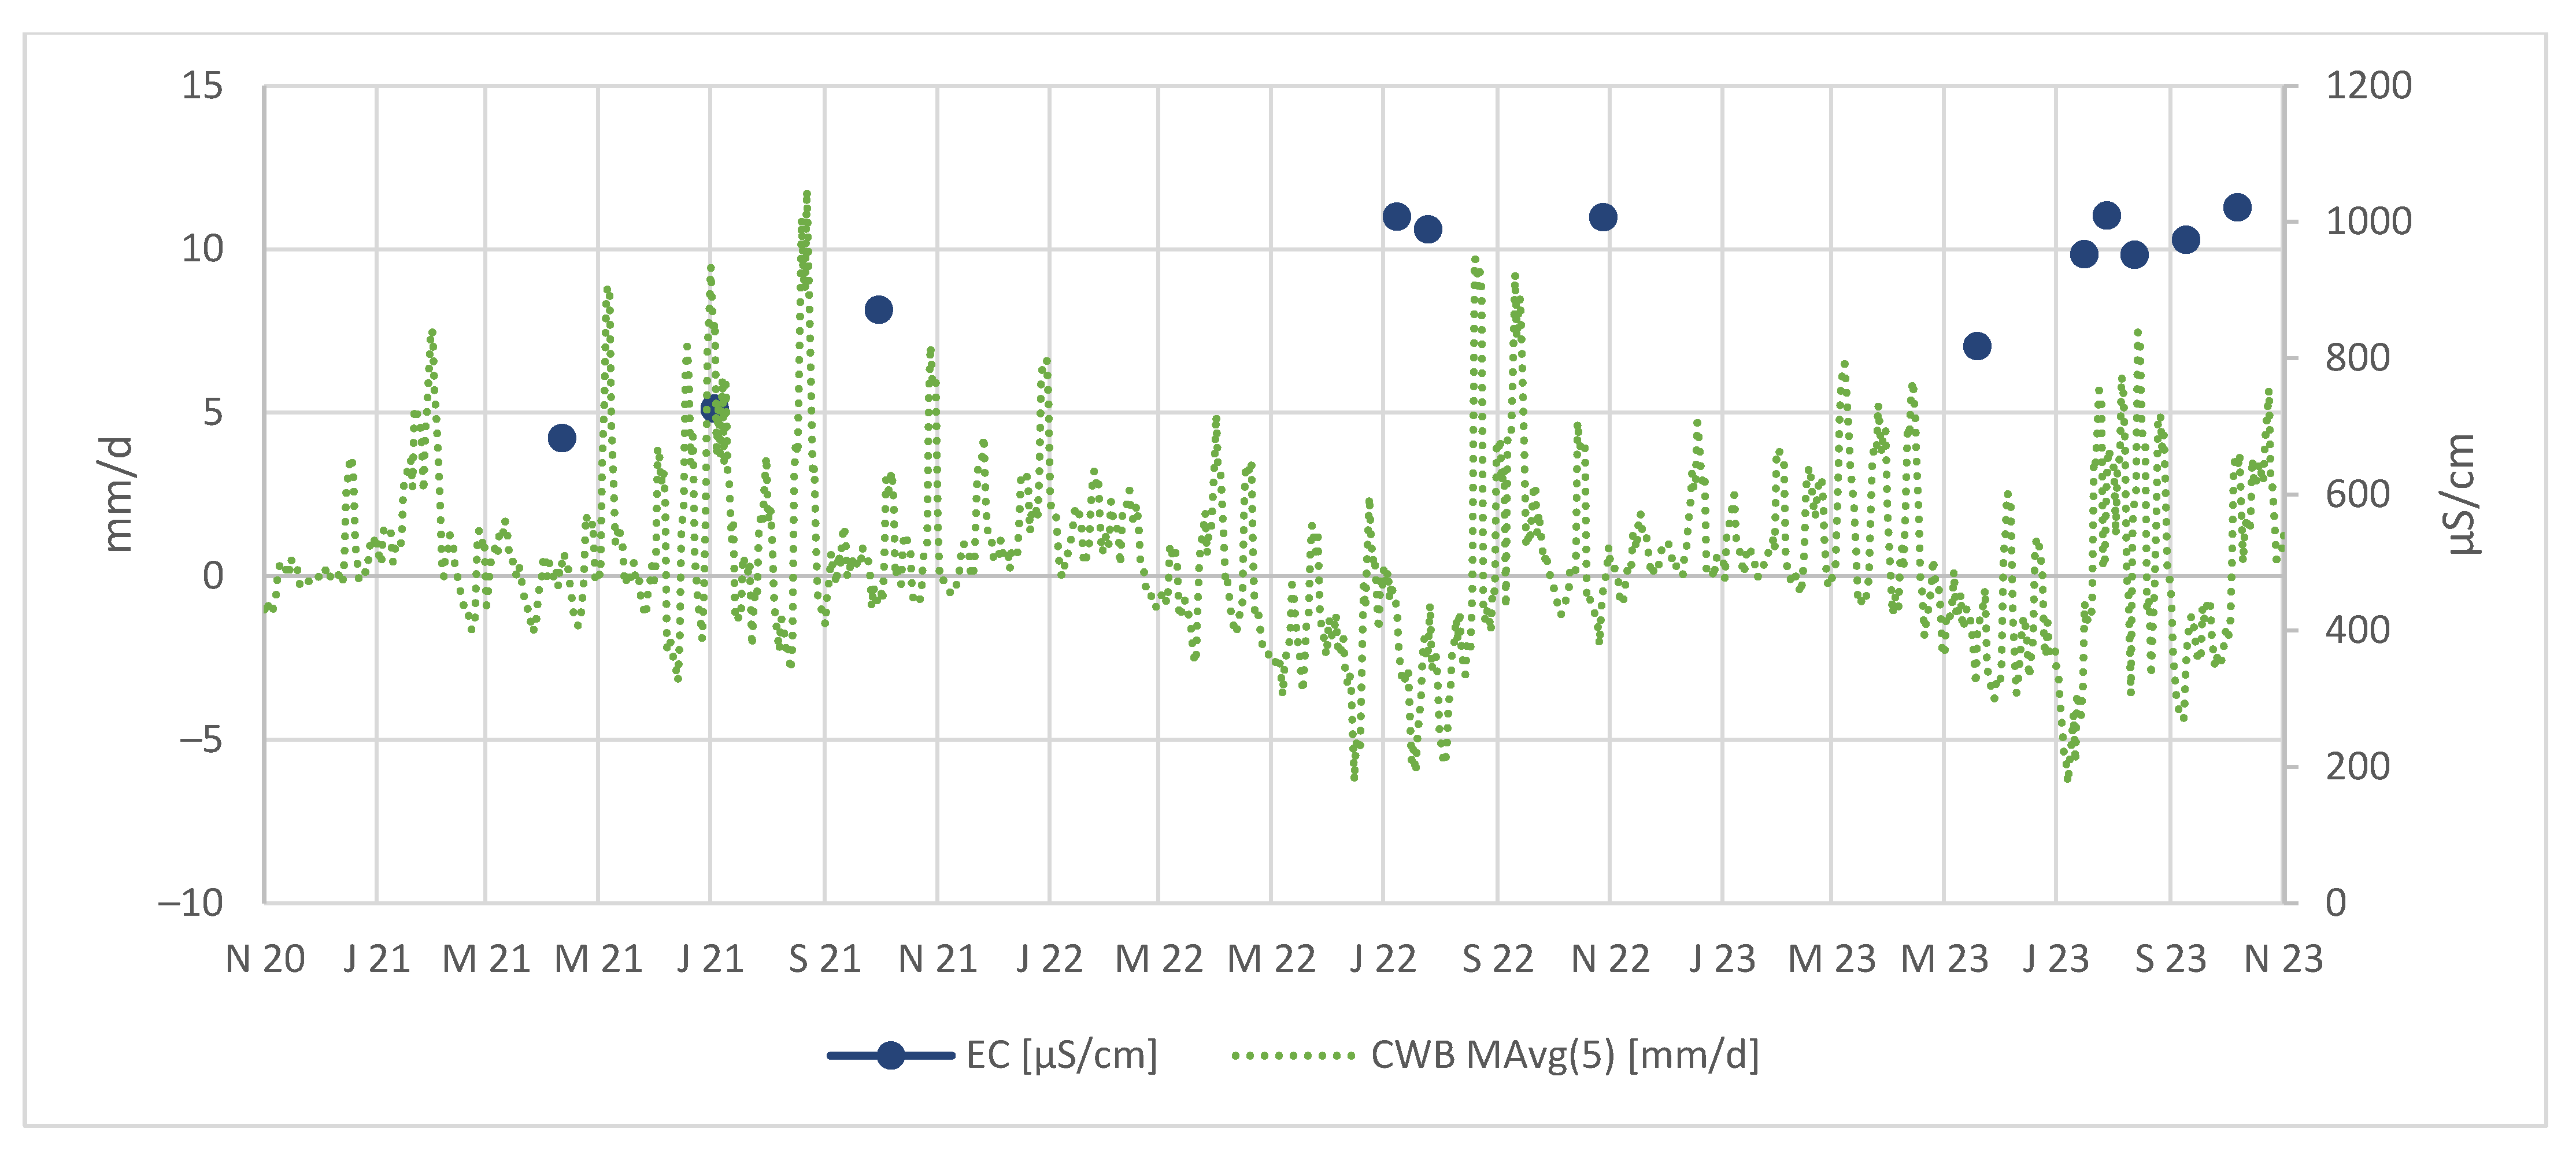
In the Figure 8, we can observe that the electrical conductivities in the tailing discharge are notably higher after periods of negative CWBs. This confirms processes of As and metal concentration in the tailing body, followed by a release during periods with higher CWBs, likely driven by increased rainfall.
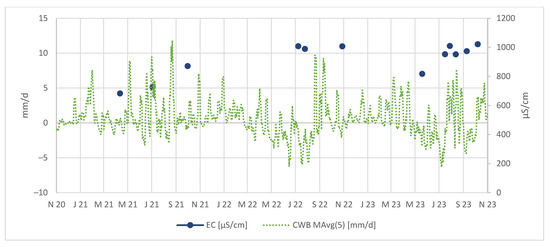
Figure 8.
EC in µS/cm measured in tailing discharge.
In general, we can infer that the tailing discharge amount reacts to the present local hydrological conditions without a larger delay; however, the chemistry of the tailing discharge reflects the CWBs with a delay.
3.2.3. Observation of the Ascending Mine Waters at Gesenk 2. Sohle
As mentioned in the Introduction, the mine waters that are generated in the flooded mine cavities ascend through the winze to the gallery four meters below the second level. The discharge rate here would be expected to react to local weather conditions in some way.
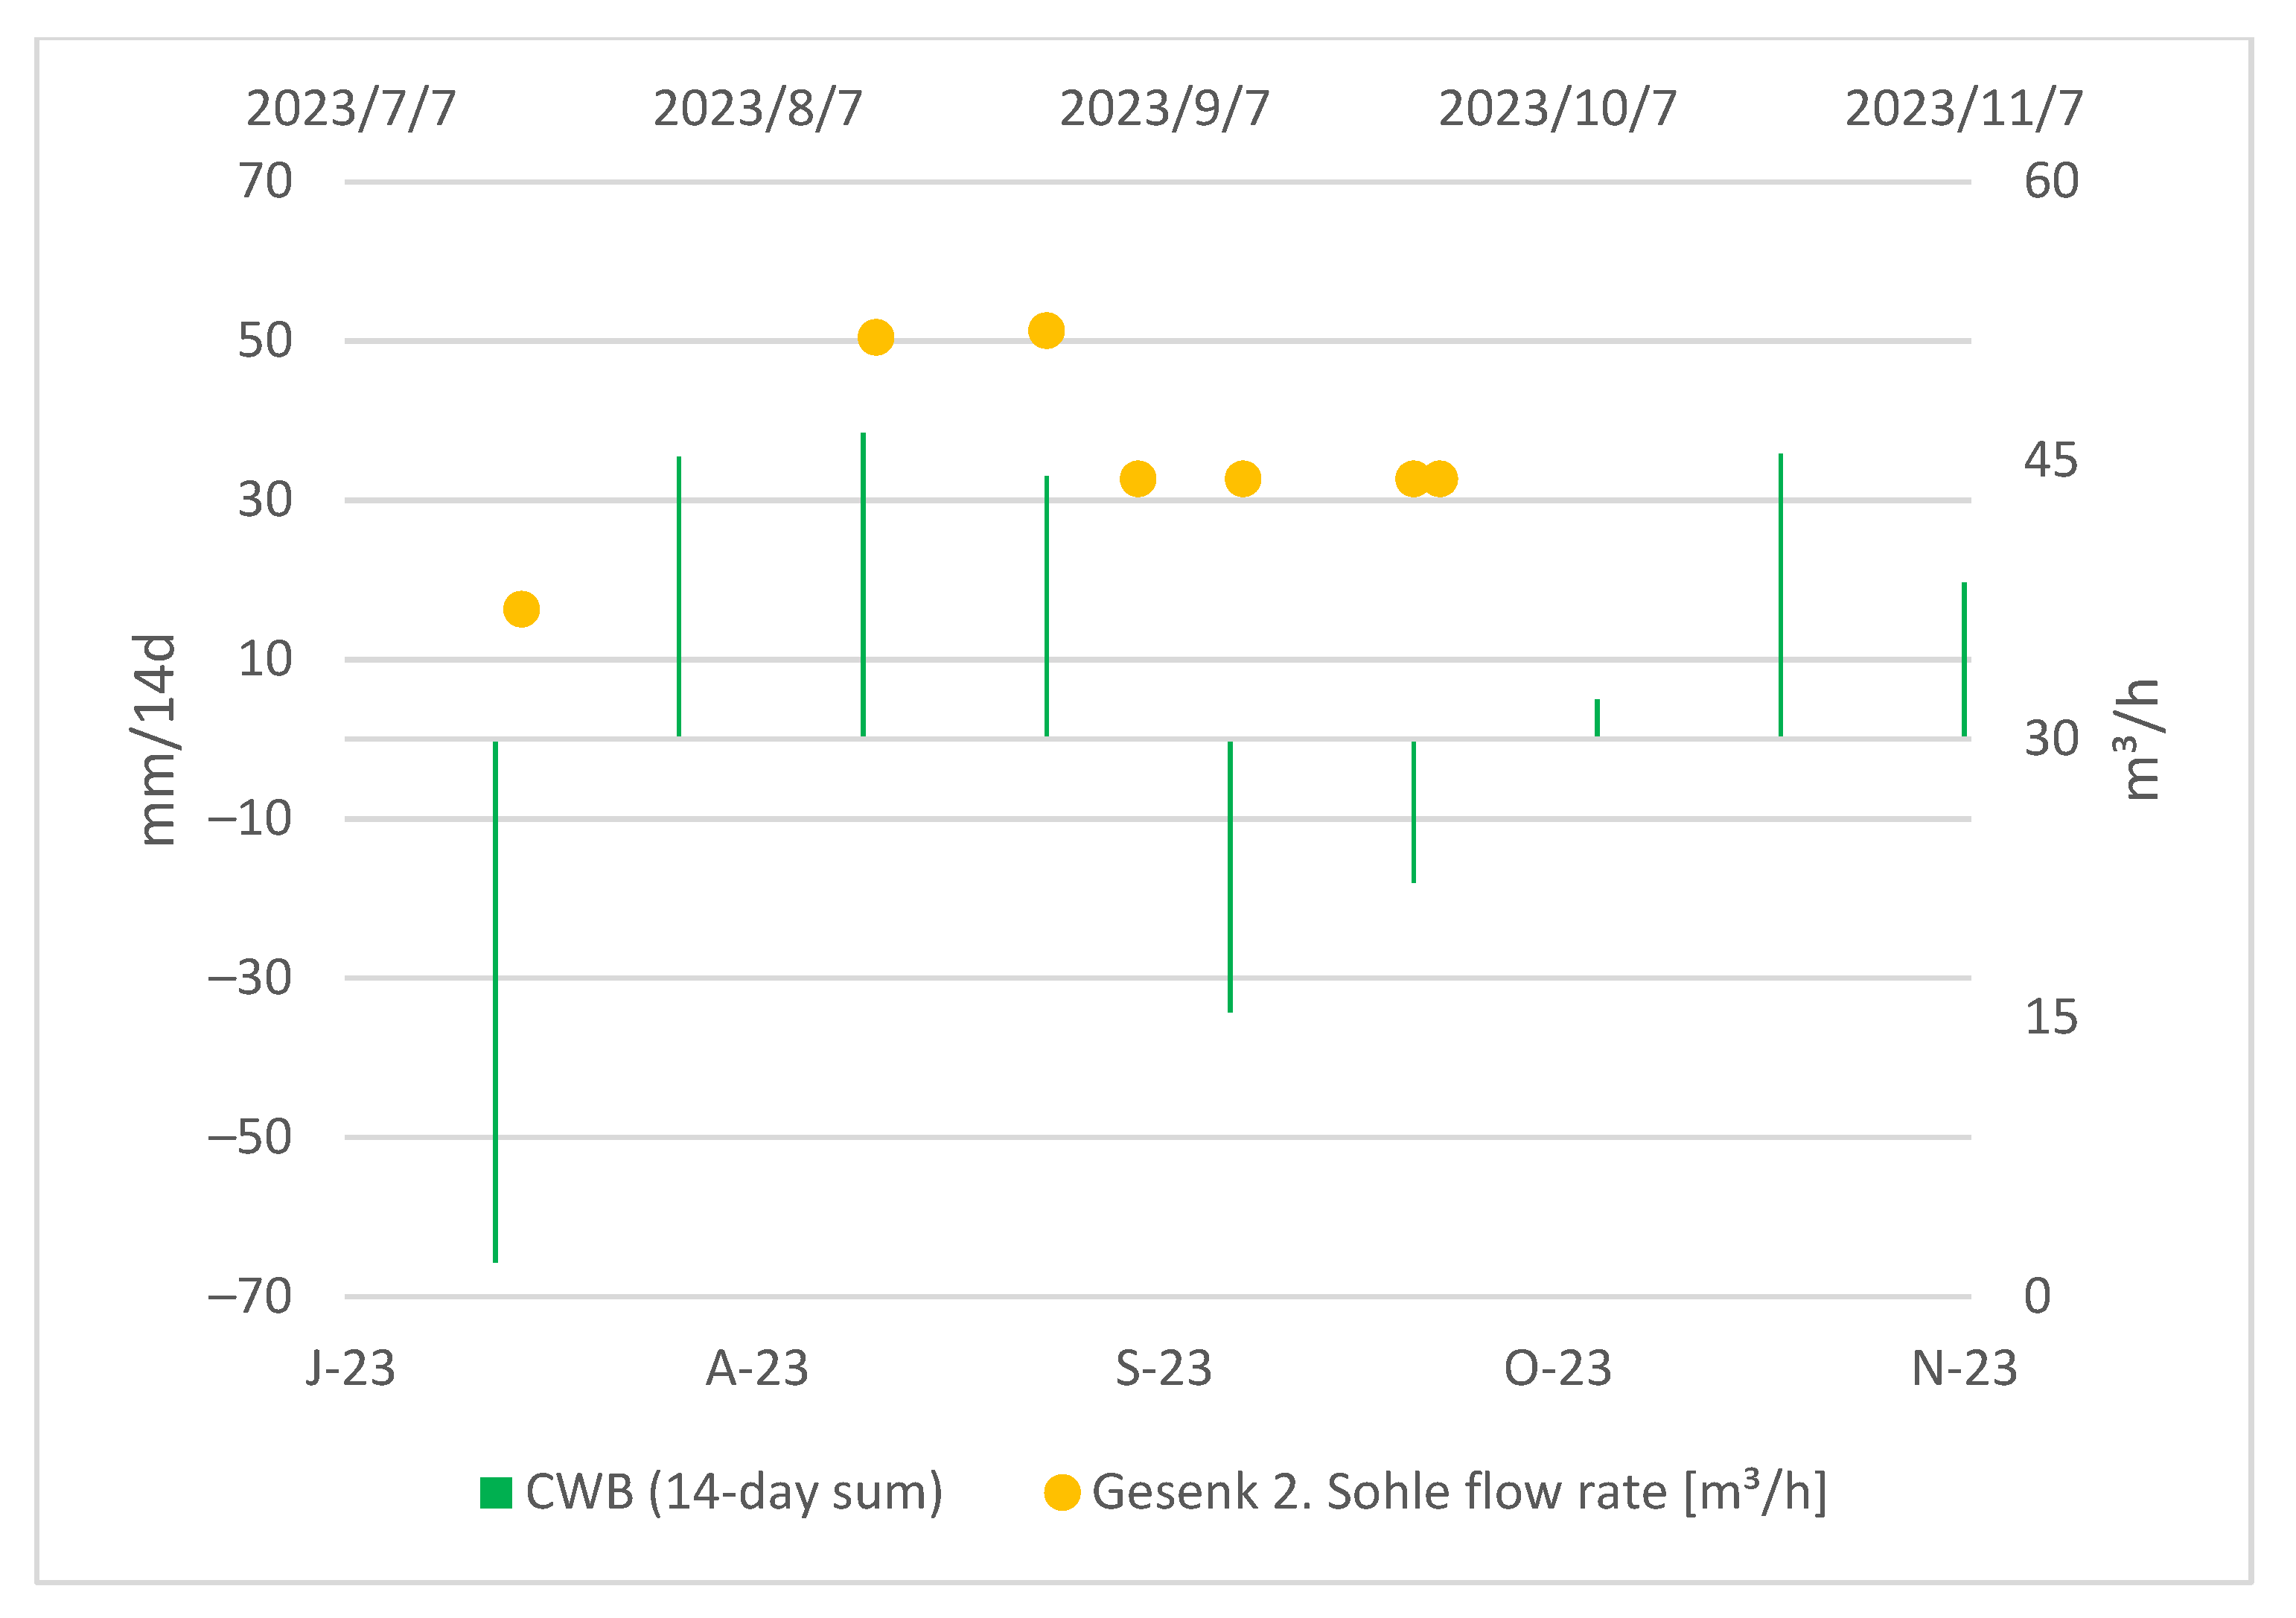
Gesenk 2. Sohle is located underground, and the access to it is limited. Moreover, it lacks an automatic measuring unit, so an observation of a longer time period was not possible. From the obtained data, we can generally conclude that the discharge rate at Gesenk 2. Sohle is higher after periods characterized by higher CWBs and reacts to a CWB change with approximately a two-week-long delay as can be seen in the Figure 9:

Figure 9.
CWBs (14-day sum) and measured flow rate at Gesenk 2. Sohle.
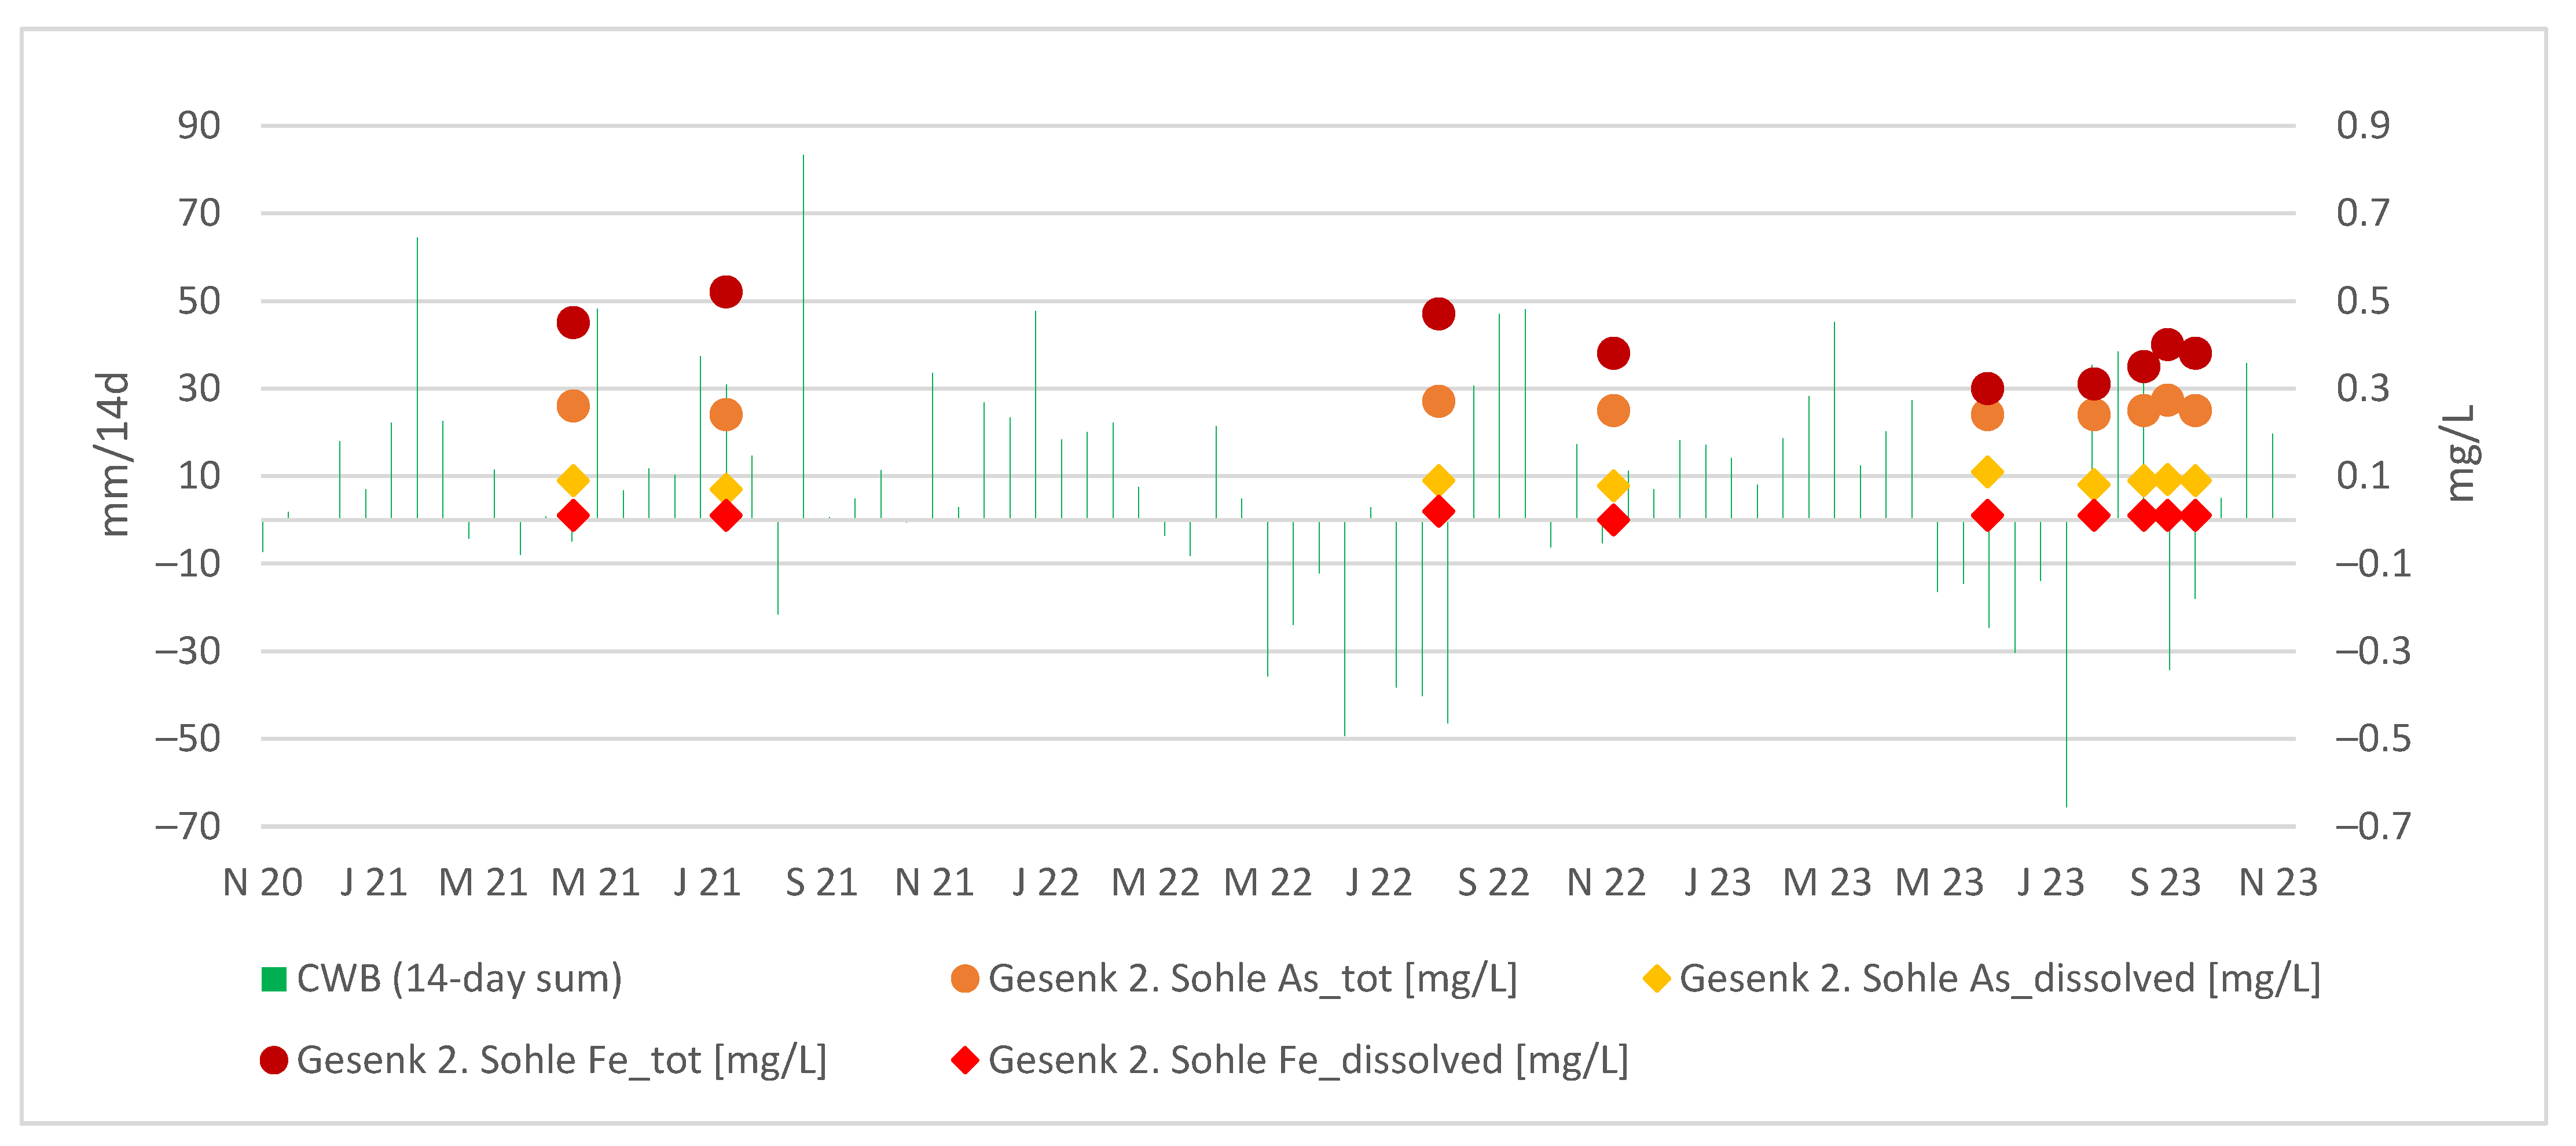
Interestingly, the arsenic concentrations at Gesenk 2. Sohle appear relatively stable regardless of the CWBs, as illustrated in the Figure 10. In general, the dissolved fraction of As and Fe remains constant, whereas the colloidal contributions of As and Fe to the total concentrations exhibit more noticeable fluctuations.
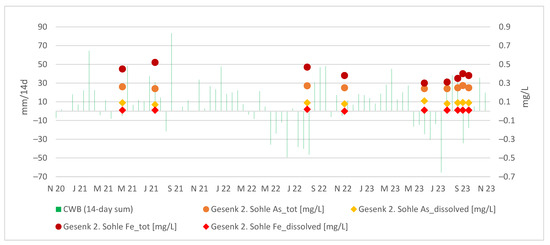
Figure 10.
Absolute values of As and Fe in the discharge at Gesenk 2. Sohle vs. the 14-day sum of local CWBs.
4. Discussion
4.1. Interpretation of the Tiefer Sauberger Gallery Behavior
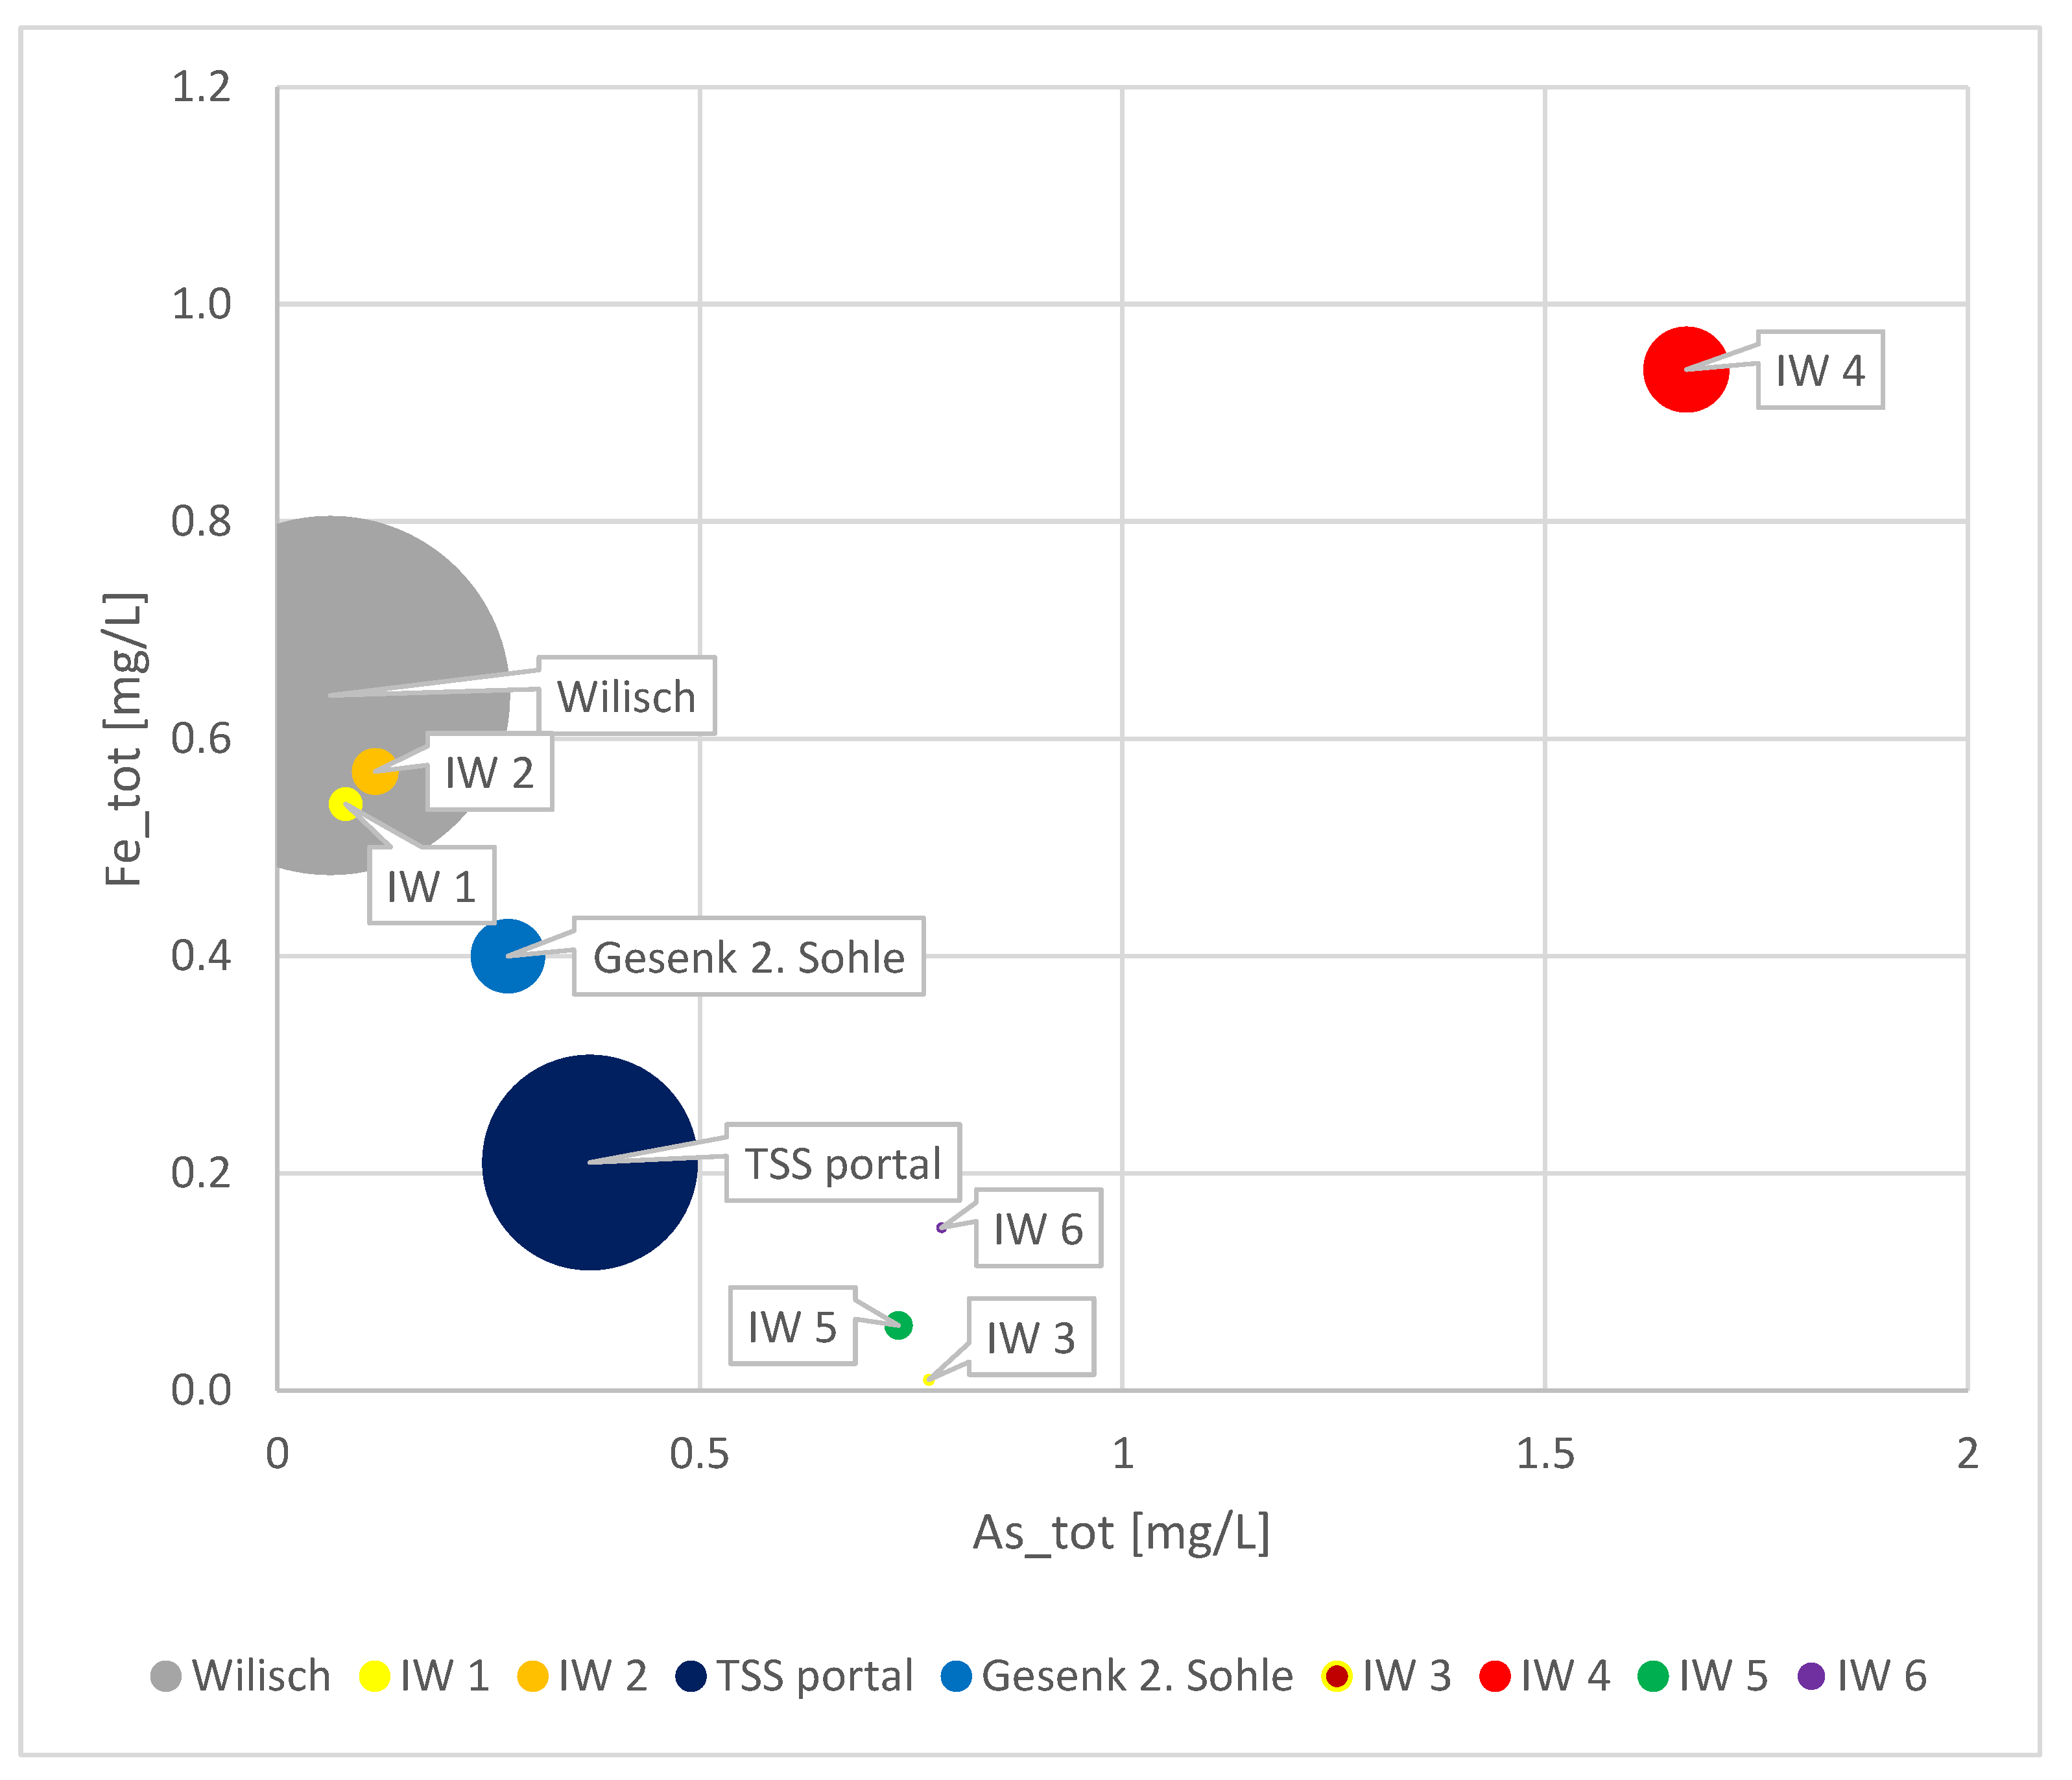
Based on previous research and the current findings that the TSS portal exhibits an immediate response to a snowmelt period, as shown in Figure 5, the evidence supporting the infiltration of Wilisch Creek into the gallery was compelling. To confirm this hypothesis, in August 2023, we accessed the TSS gallery at its portal and traveled up to the Gesenk 2. Sohle to conduct sampling of the visible infiltrating waters into the gallery.
During this exploration, we observed and collected samples at six infiltration points with varying flow rates, primarily located within the first 500 m from the portal. The first two infiltration points were discovered approximately 5 m from the aboveground-flowing Wilisch Creek. The chemical analysis of these two infiltration points undeniably confirmed the seepage of Wilisch water into the gallery, providing an explanation for the challenges in interpreting the gallery discharges and understanding the dynamics of As and Fe at the portal.
The Figure 11 provides an overview of the sampled infiltrated waters, Gesenk 2. Sohle, Wilisch, and TSS water on the day of sampling.

Figure 11.
Comparison of As and Fe content in Wilisch River, Gesenk 2. Sohle, TSS portal, and infiltrating waters. The bubble size represents the flow rate.
Infiltration of other water streams into the TSS gallery cannot be ruled out, as the combined water flux at Gesenk 2. Sohle and the infiltrating waters accounts for only approximately 40% of the total water flux at the portal. Other infiltration points may have gone unnoticed, particularly if they occur below the water level in the gallery.
Only two of the infiltrating waters are relatable to Wilisch water. The others exhibit higher As and Fe concentrations. Moreover, their physical proximity to the riverbed of Wilisch Creek is not established. Therefore, the other infiltrating waters are of a different source, possibly historic mining workings, which may not be well documented or understood. Another plausible explanation could be fault structures penetrating the course of TSS, allowing meteoric and surface waters to seep into the gallery and contribute to additional As and Fe contamination as they pass through As-containing layers or sulfidic mineralizations along the fault structures.
4.2. Climatic Water Balance and the Mine System Rigole 28-Gesenk 2. Sohle-TSS Gallery
The analysis of climatic water balance, alongside other relevant parameters, proves to be a valuable tool for understanding the hydrological behavior at our site. Despite a relatively small data pool, we gained a better grasp of the hydrological processes.
An illustration of the impact of precipitation and overall climate on the quality of groundwater and surface water is evident in the literature. For instance, in Bangladesh’s coastal rivers and estuaries, there is a notable increase in the salinity of both groundwater and surface water during the post-monsoon season [35].
Related research suggests that pedogenic processes support the accumulation of arsenic in shallow groundwater during groundwater replenishment via soil interaction with irrigation and rainfall [36].
Understanding local weather conditions is crucial for accurately interpreting chemical data for both ground- and mine waters.
Since the initiation of measuring campaigns at the Ehrenfriedersdorf sites, the concentrations of arsenic (As), heavy metals, and sulfate in the tailing outflow Rigole 28 appeared to be increasing, raising concerns about the integrity of the tailing ponds. The absence of past monitoring for discharge flow rate prompted us to initiate data collection independently. Analysis of climatic water balances, As, Fe, and electrical conductivity in Rigole 28 revealed that concentrations in the discharge increase after periods of low or negative CWBs. This observation helped explain the initial alarming trend since the samplings were conducted mostly in low-precipitation periods. Additionally, Fe and As concentrations showed a correlated trend, and an increased concentration of As and Fe led to a larger difference between the total and dissolved (smaller than 0.45 µm) portions. Evidently, longer retention time within the tailing body during low or negative CWBs favors Fe oxidation and As adsorption onto Fe hydroxides.
This tailing discharge undergoes in-situ Fe and As oxidation when introduced into the flooded mine body and may reoccur at Gesenk 2. Sohle, representing the ascending mine waters from deeper levels of the mine. Tracer tests in the past could not definitively explain the overall underground flow conditions [23].
However, upon comparing the arsenic throughput in Rigole 28 with that of Gesenk 2. Sohle, we observe that the arsenic concentration at Gesenk 2. Sohle is either lower or comparable to that of the tailing outflow. This implies that arsenic from Rigole 28 settles partially or entirely within the flooded body. Conversely, the iron throughput at Gesenk 2. Sohle is greater than that in the tailing outflow. Similarly, when comparing Gesenk 2. Sohle with the TSS portal, we find that the arsenic from the flooded mine body constitutes only a minor portion of the total arsenic flowing through the portal, further indicating that the majority of arsenic input occurs within the TSS gallery.
When we look at the distribution between dissolved and colloidal species, the dissolved (<0.45 µm) As and Fe at Gesenk 2 Sohle exhibit a nearly constant trend, while the colloidal portion shows noticeable fluctuations. A local maximum in Fe and As concentrations on 1 August 2023, at Rigole 28, is observed about a month later, on August 29, at Gesenk 2. Sohle. More frequent, ideally daily, measurements would be necessary for precise confirmation.
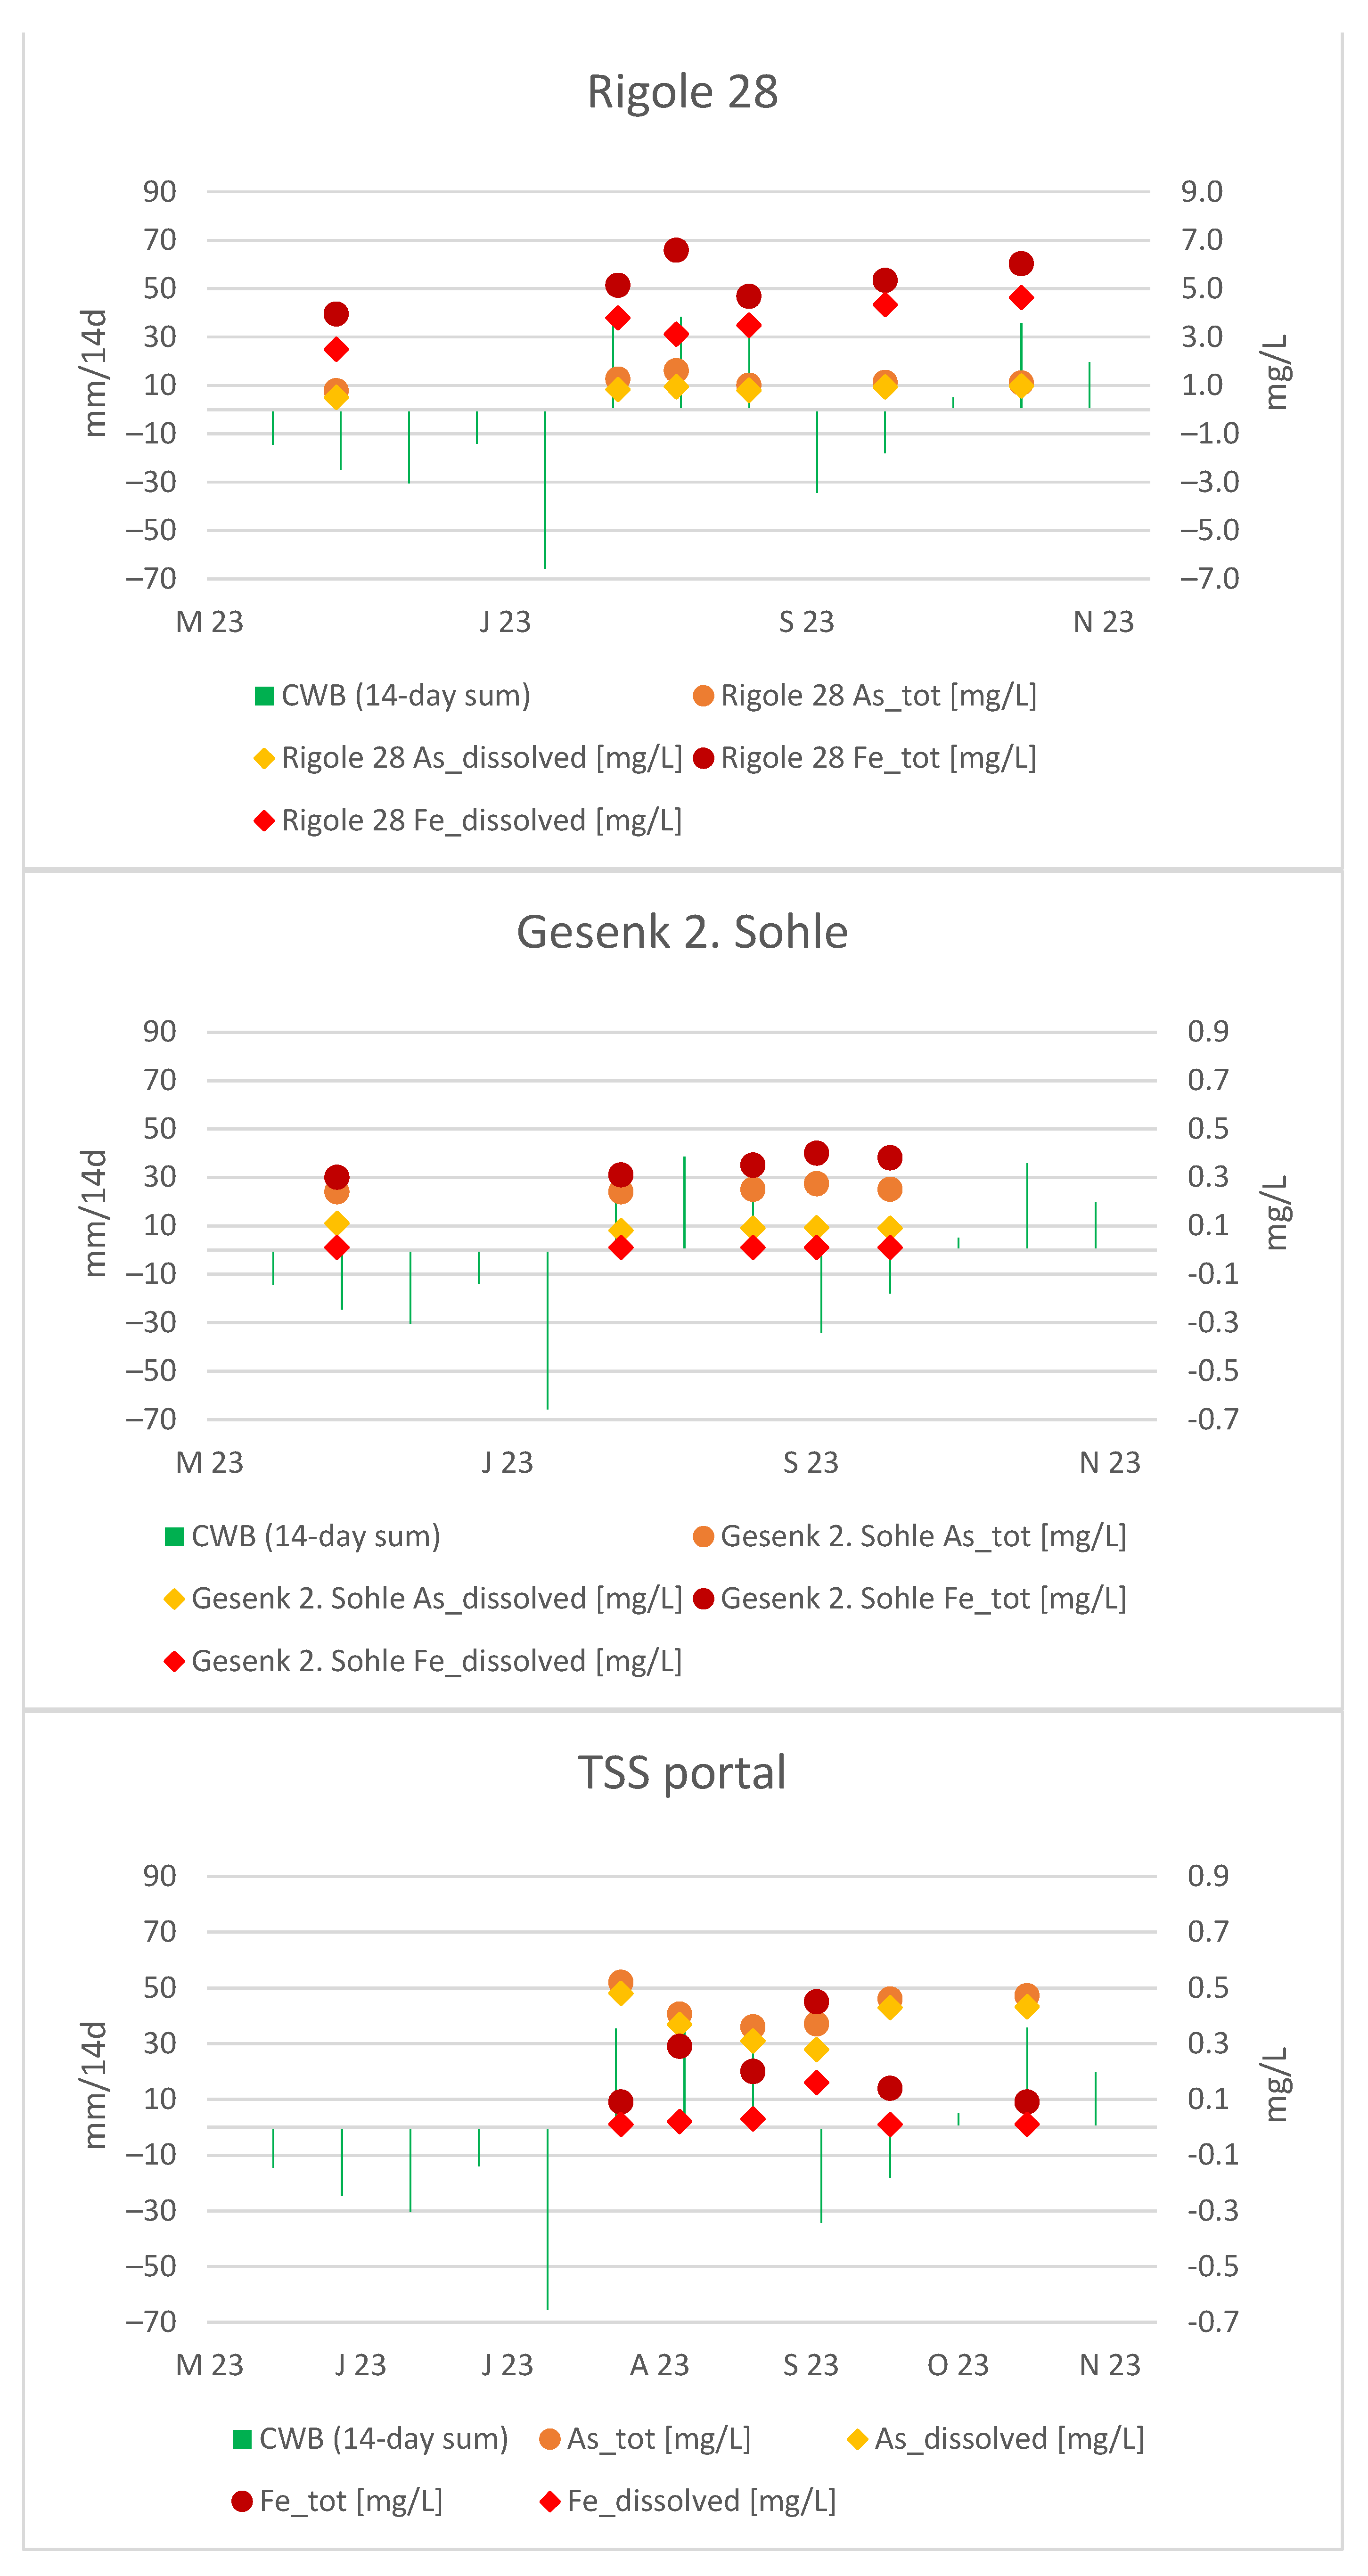
Similarly, a local maximum in Fe concentrations was recorded at the portal of the TSS gallery on 29 August 2023, which was expected due to its direct connection. Figure 12 provides a look at all measuring points simultaneously:
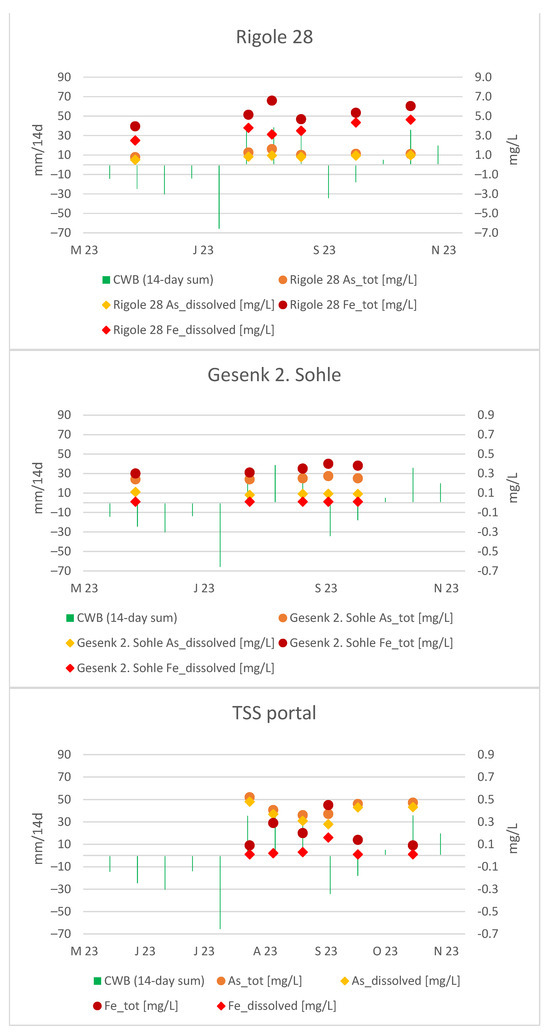
Figure 12.
As and Fe courses in Rigole 28, Gesenk 2. Sohle and TSS portal.
The As course at the portal indicates its “external” origin, as it differs significantly from the As trend at Gesenk 2. Sohle. Building on evidence from the previous section, we have demonstrated that the mine water at the TSS portal is influenced by infiltrating water from the neighboring Wilisch Creek and presumably historical mining sites. This external influence on the mine water at the portal is also suggested by the non-correlative pattern observed in CWBs and flow rates.
4.3. Assessment of Saturation Indices (SIs)
Saturation indices were examined concerning sulfide detection in the tailing outflow, as mentioned in Section 3.1.2. All analyses were conducted using PHREEQC, enabling an assessment of saturation indices in Rigole 28. For samples where no sulfide was detected, a concentration of 2.5 µg/L S2−—equivalent to half the limit of detection (LOD) for this measurement—was assumed for calculations.
The Table 2 presents the median saturation index values of relevant mineral phases in Rigole 28. Gesenk 2. Sohle and the TSS portal are not considered relevant because of the absence of detected sulfide, and their high redox potential precludes sulfate reduction.
Table 2.
Median SI for relevant amorphous sulfide phases in the tailing outflow.
Considering ZnS as an insoluble phase with a detected Zn concentration of 1.5–2 mg/L in Rigole 28, notable positive saturation indices suggest immediate ZnS precipitation in the presence of free S2− ions. Hence, the detected sulfide is likely a false positive result.
Median saturation indices of amorphous Fe(OH)3 in Rigole 28, Gesenk 2. Sohle, and the TSS portal are 2.0, 2.8, and 2.5, respectively, indicating precipitation of the iron hydroxide phase.
5. Conclusions
The climatic water balance (CWB) emerged as a valuable and resource-efficient tool, requiring minimal data input, for comprehending the hydrological dynamics at the Ehrenfriedersdorf tin mine site using only local precipitation and relative evapotranspiration data.
Integrating climatic water balances with monitoring data proved instrumental in elucidating the rising concentrations of arsenic (As) and iron (Fe) in the tailing pond discharge.
The quality of tailing discharge follows the trend in the CWB, resulting in higher concentrations of As and Fe in the tailing outflow after periods of dry weather. Similarly, the discharge volume at Gesenk 2. Sohle changes about two weeks after a shift in the CWB trend, while the discharge quality at this location exhibits only minor fluctuations. Notably, the discharge from the primary dewatering gallery, Tiefer Sauberger Stolln (TSS), demonstrates distinct hydrological and chemical behavior. Our findings have strengthened the evidence supporting the notion that the TSS gallery does not only convey mine water from the flooded mine but also facilitates infiltrated water from the surface and historical mining sites, hereby introducing additional arsenic contamination. In fact, the infiltrating waters into the TSS gallery constitute the majority of the water flowing through the TSS portal and carry the largest portion of As amount that leaves the gallery portal and is discharged into the local drainage system.
Author Contributions
V.R.: writing—original draft, formal analysis, investigation, and visualization. M.G.: methodology and writing—review and editing. F.S.: methodology, investigation, and visualization. M.R.: writing—review and editing, and visualization. N.H.: conceptualization, supervision, writing—review and editing, and funding acquisition. All authors have read and agreed to the published version of the manuscript.
Funding
This research was conducted as a part of the TERZinn project (FKZ 03WIR1906D) in the research program rECOmine, funded by the Federal Ministry of Education and Research in Germany (BMBF).
Data Availability Statement
The local weather data are third-party data, purchased from DTN°. The TSS portal discharge rates are third-party data, available upon request from the Saxon State Office for Environment, Agriculture, and Geology. Own monitoring data are available upon request from the corresponding author.
Acknowledgments
We want to thank the site owner Zinnerz Ehrenfriedersdorf GmbH for very good cooperation and the team of Zinngrube Ehrenfriedersdorf that operates the shaft. Furthermore, we thank the Saxon State Office for Environment, Agriculture, and Geology and DTN° for providing discharge rates at the Tiefer Sauberger Stolln portal and weather data (daily and hourly temperatures, precipitation, and relative humidity), respectively. Last but not least, we want to thank Alexander Robb Roy Hudson for proofreading our article.
Conflicts of Interest
The authors declare no conflicts of interest.
References
- Silva, J.C.M.; dos Santos, E.C.; Heine, T.; de Abreu, H.A.; Duarte, H.A. Oxidation Mechanism of Arsenopyrite in the Presence of Water. J. Phys. Chem. C 2017, 121, 26887–26894. [Google Scholar] [CrossRef]
- Topaldemir, H.; Taş, B.; Yüksel, B.; Ustaoğlu, F. Potentially hazardous elements in sediments and Ceratophyllum demersum: An ecotoxicological risk assessment in Miliç Wetland, Samsun, Türkiye. Environ. Sci. Pollut. Res. Int. 2023, 30, 26397–26416. [Google Scholar] [CrossRef] [PubMed]
- Abdul, K.S.M.; Jayasinghe, S.S.; Chandana, E.P.S.; Jayasumana, C.; de Silva, P.M.C.S. Arsenic and human health effects: A review. Environ. Toxicol. Pharmacol. 2015, 40, 828–846. [Google Scholar] [CrossRef] [PubMed]
- Smedley, P.; Kinniburgh, D. A review of the source, behaviour and distribution of arsenic in natural waters. Appl. Geochem. 2002, 17, 517–568. [Google Scholar] [CrossRef]
- World Health Organization. Guidelines for Drinking-Water Quality, 4th edition incorporating the first addendum; World Health Organization: Geneva, Switzerland, 2017; ISBN 9789241549950. [Google Scholar]
- Federal Law Gazette 2023 I No. 159. Ordinance on the Quality of Water Intended for Human Consumption: TrinkwV 2023. 2023. Available online: https://www.gesetze-im-internet.de/englisch_trinkwv/englisch_trinkwv.html (accessed on 21 November 2023).
- Cen, L.; Cheng, H.; Liu, Q.; Wang, S.; Wang, X. Arsenic release from arsenopyrite weathering in acid mine drainage: Kinetics, transformation, and effect of biochar. Environ. Int. 2022, 170, 107558. [Google Scholar] [CrossRef] [PubMed]
- Corkhill, C.L.; Vaughan, D.J. Arsenopyrite oxidation—A review. Appl. Geochem. 2009, 24, 2342–2361. [Google Scholar] [CrossRef]
- Wächter, M. Tabellenbuch der Chemie: Daten zur Analytik, Laborpraxis und Theorie; Viskosimetrie, Pyknometrie, Kryoskopie, Ebullioskopie, Spektroskopie, 1. Aufl.; Wiley-VCH: Weinheim, Germany, 2012; ISBN 3527329609. [Google Scholar]
- Reimann, C.; Demetriades, A.; Birke, M.; Filzmoser, P.; O’Connor, P.; Halamić, J.; Ladenberger, A. Distribution of Elements/Parameters in Agricultural and Grazing Land Soil of Europe. In Chemistry of Europe’s Agricultural Soils; Reimann, C., Ed.; Schweizerbart: Stuttgart, Germany, 2014; pp. 101–472. ISBN 9783510968466. [Google Scholar]
- Tarvainen, T.; Albanese, S.; Birke, M.; Poňavič, M.; Reimann, C. Arsenic in agricultural and grazing land soils of Europe. Appl. Geochem. 2013, 28, 2–10. [Google Scholar] [CrossRef]
- Greif, A.; Klemm, W. Geogene Hintergrundbelastungen: Oberflächenwassergenaue Ableitung von Referenzwerten geogener Hintergrundbelastungen für Schwermetalle und Arsen in der Wasserphase sowie im schwebstoffbürtigen Sediment sächsischer Fließgewässer im Einzugsgebiet des Erzgebirges/Vogtlandes. In Zusammenstellung Geogener Hintergrundwerte in Sächsischen Gewässern; Rohde, S., Ed.; LfULG: Dresden, Germany, 2015; pp. 6–276. [Google Scholar]
- Rank, G.; Kardel, K.; Weidensdörfer, H. Sachstandsbericht: Die Schwermetallgehalte der Böden im Raum Ehrenfriedersdorf—Geyer für die Bewertung der Gefährdungspfade Boden ⇒ Mensch, Boden ⇒ Nutzpflanze und Boden ⇒ Sickerwasser nach Bundes-Bodenschutz- und Altlastenverordnung (BBodSchV), Freiberg. 2000. Available online: https://www.boden.sachsen.de/download/boden/ehf_beri.pdf (accessed on 18 November 2023).
- Tarvainen, T.; Reichel, S.; Müller, I.; Jordan, I.; Hube, D.; Eurola, M.; Loukola-Ruskeeniemi, K. Arsenic in agro-ecosystems under anthropogenic pressure in Germany and France compared to a geogenic as region in Finland. J. Geochem. Explor. 2020, 217, 106606. [Google Scholar] [CrossRef]
- Greif, A.; Klemm, W.; Klemm, K. Influence of Arsenic from Anthropogenic Loaded Soils on the Mine Water Quality in the Tin District Ehrenfriedersdorf, Erzgebirge (Germany). Eng. Life Sci. 2008, 8, 631–640. [Google Scholar] [CrossRef]
- Federal Law Gazette 2016 I No. 28. Ordinance on the Protection of Surface Waters: OGewV. 2016. Available online: https://www.gesetze-im-internet.de/ogewv_2016/OGewV.pdf (accessed on 21 November 2023).
- Hösel, G. Das Zinnerz-Lagerstättengebiet Ehrenfriedersdorf, Erzgebirge: Bergbaumonographie; Sächsiches Landesamt für Umwelt und Geologie, Sächsiches Oberbergamt: Freiberg, Germany, 1994; ISBN 3-86170-427-7. [Google Scholar]
- Abeywickrama, J.; Grimmer, M.; Hoth, N.; Grab, T.; Drebenstedt, C. Geochemical characterization of fouling on mine water driven plate heat exchangers in Saxon mining region, Germany. Int. J. Heat Mass Transf. 2021, 176, 121486. [Google Scholar] [CrossRef]
- Einenkel, S. Kalibrierung und Abbildung der Menschlichen Hand auf Einen Dreifingrigen Greifer zur Mehrfingrigen Telemanipulation. Master‘s Thesis, Technische Universität München, München, Germany, 2006. [Google Scholar]
- Klemm, W.; Greif, A. Reinigung belasteter Haldensickerwässer durch In-situ-Eisenhydroxidfällung—Ergebnisse eines Langzeitversuchs unter Realbedingungen. In 57. Berg und Hüttenmännischer Tag: Behandlungstechnologien für Bergbaubeeinflusste Wässer. GIS—Geowissenchaftliche Anwendungen und Entwicklungen; Merkel, B.J., Schaeben, H., Wolkersdorfer, C., Hasche-Berger, A., Eds.; Institut für Mineralogie: Freiberg, Germany, 2006; pp. 47–54. [Google Scholar]
- Klemm, W.; Greif, A.; Hartmann, J. Nachhaltige Arsenrückhaltung durch Eisenhydroxid-Fällung im gefluteten Grubenraum—Ergebnisse eines mehrjährigen Pilotversuchs (2002–2010). In Nachhaltigkeit und Langzeitaspekte bei der Sanierung von Uranbergbau- und Aufbereitungsstandorten: Proceedings des Internationalen Bergbausymposiums WISSYM; Wismut GmbH: Chemnitz, Germany, 2011; pp. 275–283. [Google Scholar]
- Klemm, W. Die Entwicklung des Grubenwasserchemismus im Verlauf der Flutung der Zinnerzgrube Ehrenfriedersdorf. In Gewässerschutz im Einzugsgebiet der Elbe: 8. Magdeburger Gewässerschutzseminar; Geller, W., Punčochář, P., Bornhöft, D., Bouček, J., Feldmann, H., Guhr, H., Mohaupt, V., Simon, M., Smrták, J., Spoustová, J., et al., Eds.; Vieweg+Teubner Verlag: Wiesbaden, Germany, 1998; pp. 271–274. ISBN 9783322800114. [Google Scholar]
- Klemm, W.; Greif, A. Erarbeitung eines Verfahrens zur Behandlung von Gruben- und Haldensickerwässern; Abschlussbericht: Freiberg, Germany, 2006. [Google Scholar]
- Tauber, A. Wasserhaushalt des Zinnerzbergwerks Ehrenfriedersdorf; Technische Universität Bergakademie Freiberg: Freiberg, Germany, 2008. [Google Scholar]
- DIN EN 1484:2019-04; Wasseranalytik_- Anleitungen zur Bestimmung des gesamten organischen Kohlenstoffs_(TOC) und des gelösten organischen Kohlenstoffs_(DOC); Deutsche Fassung EN_1484:1997. Beuth Verlag GmbH: Berlin, Germany, 2019.
- EPA. Sulfate (Turbidimetric). 1986 (EPA 9038). Available online: https://www.epa.gov/sites/default/files/2015-12/documents/9038.pdf (accessed on 30 November 2023).
- DIN 38405-27:2017-10; Deutsche Einheitsverfahren zur Wasser-, Abwasser- und Schlammuntersuchung_- Anionen (Gruppe_D)_- Teil_27: Bestimmung von Sulfid durch Gasextraktion_(D_27). Beuth Verlag GmbH: Berlin, Germany, 2017.
- Rafique, V.; Grimmer, M.; Hoth, N.; Abeywickrama, J.; Drebenstedt, C. Intermediate Species Accounts for more Than a Half of Sulfur Speciation in Mine Waters—A Case Study Revealed using Vis Spectrophotometry and Microwave Plasma Atomic Emission Spectrometry. IMST 2022, 3, 555607. [Google Scholar] [CrossRef]
- DIN 38406-1:1983-05; Deutsche Einheitsverfahren zur Wasser-, Abwasser- und Schlammuntersuchung; Kationen (Gruppe_E); Bestimmung von Eisen (E_1). Beuth Verlag GmbH: Berlin, Germany, 1983.
- Hach Company. Iron, Ferrous: 1,10-Phenanthroline Method; DOC316.53.01049 (Hach), Hach Company: Loveland, CO, USA, 2019; Available online: https://cdn.bfldr.com/7FYZVWYB/at/3w6zc95hcmfvhfcbnp3bsjx/DOC3165301049.pdf (accessed on 30 November 2023).
- Parkhurst, D.L.; Appelo, C.A.J. User’s Guide to PHREEQC (Version 2): A Computer Program for Speciation, Batch-Reaction, One-Dimensional Transport, and Inverse Geochemical Calculations; U.S. Geological Survey: Menlo Park, CA, USA, 1999.
- Bombach, G.; Klemm, W.; Greif, A. An Analytical Method for the Separation and Determination of As(III) and As(V) in Seepage and Acid Mine Drainage Water. Microchim. Acta 2005, 151, 203–208. [Google Scholar] [CrossRef]
- Le, X.C.; Yalcin, S.; Ma, M. Speciation of Submicrogram per Liter Levels of Arsenic in Water: On-Site Species Separation Integrated with Sample Collection. Environ. Sci. Technol. 2000, 34, 2342–2347. [Google Scholar] [CrossRef]
- Haude, W. Zur Bestimmung der Verdunstung auf Möglichst Einfache Weise: 4 Tabellen; Schweinfurter Dr. und Verlag-Ges: Schweinfurt, Germany, 1955. [Google Scholar]
- Shammi, M.; Rahman, M.M.; Bondad, S.E.; Bodrud-Doza, M. Impacts of Salinity Intrusion in Community Health: A Review of Experiences on Drinking Water Sodium from Coastal Areas of Bangladesh. Healthcare 2019, 7, 50. [Google Scholar] [CrossRef] [PubMed]
- Qaiser, F.U.R.; Zhang, F.; Pant, R.R.; Zeng, C.; Khan, N.G.; Wang, G. Characterization and health risk assessment of arsenic in natural waters of the Indus River Basin, Pakistan. Sci. Total Environ. 2023, 857, 159408. [Google Scholar] [CrossRef] [PubMed]

Disclaimer/Publisher’s Note: The statements, opinions and data contained in all publications are solely those of the individual author(s) and contributor(s) and not of MDPI and/or the editor(s). MDPI and/or the editor(s) disclaim responsibility for any injury to people or property resulting from any ideas, methods, instructions or products referred to in the content. |
© 2024 by the authors. Licensee MDPI, Basel, Switzerland. This article is an open access article distributed under the terms and conditions of the Creative Commons Attribution (CC BY) license (https://creativecommons.org/licenses/by/4.0/).