Article

Geo-Referenced Databases and SWOT Analysis for Assessing Flood Protection Structures, Measures, and Works at a River Basin Scale

by
Eleni Tzanou
1 and
Charalampos Skoulikaris
2,*
1
Faculty of Engineering, School of Surveying and Geoinformatics Engineering, International Hellenic University, GR62124 Serres, Greece
2
Department of Civil Engineering, Aristotle University of Thessaloniki, GR54124 Thessaloniki, Greece
*
Author to whom correspondence should be addressed.
Hydrology 2024, 11(9), 136; https://doi.org/10.3390/hydrology11090136
Submission received: 28 June 2024 / Revised: 18 August 2024 / Accepted: 24 August 2024 / Published: 27 August 2024
(This article belongs to the Section Water Resources and Risk Management)

Abstract

:
This research aims to evaluate the operational effectiveness of current flood protection infrastructure and measures in a flood-prone area using geo-referenced information systems and SWOT analysis. To achieve this, all existing flood protection measures and works in the case study basin, namely Strymonas River basin in Greece, were mapped and recorded. These data, along with water-related spatial information, were stored in a geo-referenced database created within an open-source GIS environment. Additionally, the system was populated with the basin’s recorded historic floods, derived from the European Union’s Floods Directive implementation process. The outputs of the research, which include a spatial comparison of flood protection measures and works with flood event occurrences as well as analyses of the figures, density, and locations of flood protection works, were evaluated as an integrated system and further processed using SWOT analysis. The latter was informed by questionnaire results, and the identified strengths and weaknesses of the flood protection infrastructure were used to explore potential opportunities and threats, which could respectively reinforce or jeopardize the basin’s capacity to effectively respond to future floods. The research framework can be applied to any river basin and could provide important assets in flood protection planning at a basin scale.

1. Introduction

Flood risk management is not solely a technical issue; it also requires effective governance to implement strategies and achieve societal integration and acceptance [1]. The quality and quantity of data describing the hydrosystem are essential for the successful implementation of policy measures and action plans [2]. Regardless of the model used, whether developed by a specific scientific discipline or professional community, accurate data and information are crucial [3]. At the European Union (EU) level, the gradual employment since the early 2000s of the Water Framework Directive (WFD) and of the Directive on the Assessment and Management of Flood Risks, commonly known as the Floods Directive (FD), has both expanded and enhanced the understanding of water resources among EU Member States. This has been achieved through dedicated monitoring programs on designated water bodies [4], which has subsequently triggered the implementation processes of these directives.
Focusing on the Floods Directive, its sequential steps are repeated every 6 years to consider the latest available data, concluding in the development of flood risk management plans (FRMPs) [5,6]. A key element in FRMPs is flood hazard estimation, performed thought hydrologic and hydraulic modeling under various return periods and expressed as flood extents, water depths/levels, and velocities. The business-as-usual process combines deterministic and probabilistic hydraulic approaches to: (i) formulate design storm hyetographs, (ii) convert the hyetographs to flood runoff (design flood hydrographs), and (iii) simulate water movement within the river channel (1D hydraulic models) and/or the floodplain area (2D models) [7,8,9,10,11,12,13]. It should be noted that the main flood protection infrastructures, such as dams, levees, diversion channels, floodplain areas, and bridges, or measures, such as low water crossings, are considered during hydraulic simulations. However, many other flood defense structures, such as culverts, river beddings with gravel or other materials, channeling works, and gabions, are often neglected during hydrosystem modelling. Additionally, routine flood protection works, including the enhancement, repair, or cleaning of existing infrastructures and water bodies, are not evaluated during simulation processes.
The spatial nature of the data required in hydrologic-hydraulic modeling and management emerged geographic information systems (GIS), an essential tool in these processes [14,15,16,17,18]. By combining various datasets, GIS changes the way flood hazard modeling is handled. Kourgialas and Karatzas [19], for instance, presented a GIS-based methodology for identifying flood hazard areas in a case study region. This approach used six factors—flow accumulation, slope, land use, rainfall intensity, geology, and elevation—derived as thematic layers by GIS tools. These factors are combined using a weighting factor approach proposed by Shaban et al. [20] and the synthesis equation of Gemitzi et al. [21]. Samela et al. [22] developed the Geomorphic Flood Area (GFA) tool, an open-source GIS plugin, to identify flood-prone areas by combining geomorphological information from DEMs with flood hazard data from existing inundation maps using a linear binary classifier based on the Geomorphic Flood Index (GFI). Ogato et al. [23] suggested coupling GIS with multi-criteria analysis methods to analyze flooding hazards and risks. Specifically, factors such as land use/land cover, elevation, slope, drainage density, soil, and rainfall were derived from experts’ and stakeholders’ opinions and ranked accordingly. The objective weight of each factor was determined using the analytical hierarchy process, and the weighted linear combination method was used to aggregate the criteria maps with GIS, an approach that was also proposed by Tzanou et al. [24].
In multi-objective water management, one of the most prevalent approaches is the SWOT (strengths, weaknesses, opportunities, and threats) analysis [25]. SWOT analysis evaluates internal and external factors of a system, such as a hydrosystem, to identify elements that either facilitate the achievement of planned objectives (strengths or opportunities) or impede progress (weaknesses or threats) [26]. For example, Nagara et al. [27] used SWOT analysis to assess the benefits and limitations of water scarcity solutions like virtual water trading, reverse osmosis desalination, groundwater extraction, and wastewater reuse in Asia and Africa. SWOT analysis is also recommended as a valuable tool for transboundary river basin management [28,29]. Other scholars have used the SWOT framework to enhance irrigation systems to meet current social and environmental demands [30], to evaluate the productivity of paddy water resources [31], or to explore the role of hydropower in national sustainable development [32]. However, a review of the literature reveals that few studies have focused on integrating flood management with SWOT analysis.
The research objective is to investigate the effectiveness of flood protection structures, measures, and works at a basin scale using geo-referenced information systems and SWOT analysis. The process involved mapping all water-related and floods-related spatial information, with their geospatial analysis in GIS providing the basis for a SWOT analysis. This analysis was informed by custom-developed questionnaires focused on the status of the selected case study hydrosystem. The scores received in the strengths, weaknesses, opportunities, and threats categories highlighted the advantages and issues that should be better addressed to mitigate flood hazards in the study area. The proposed methodological concept is applicable to any river basin with a well-established flood monitoring system and can facilitate integrated flood protection planning.

2. Materials and Methods

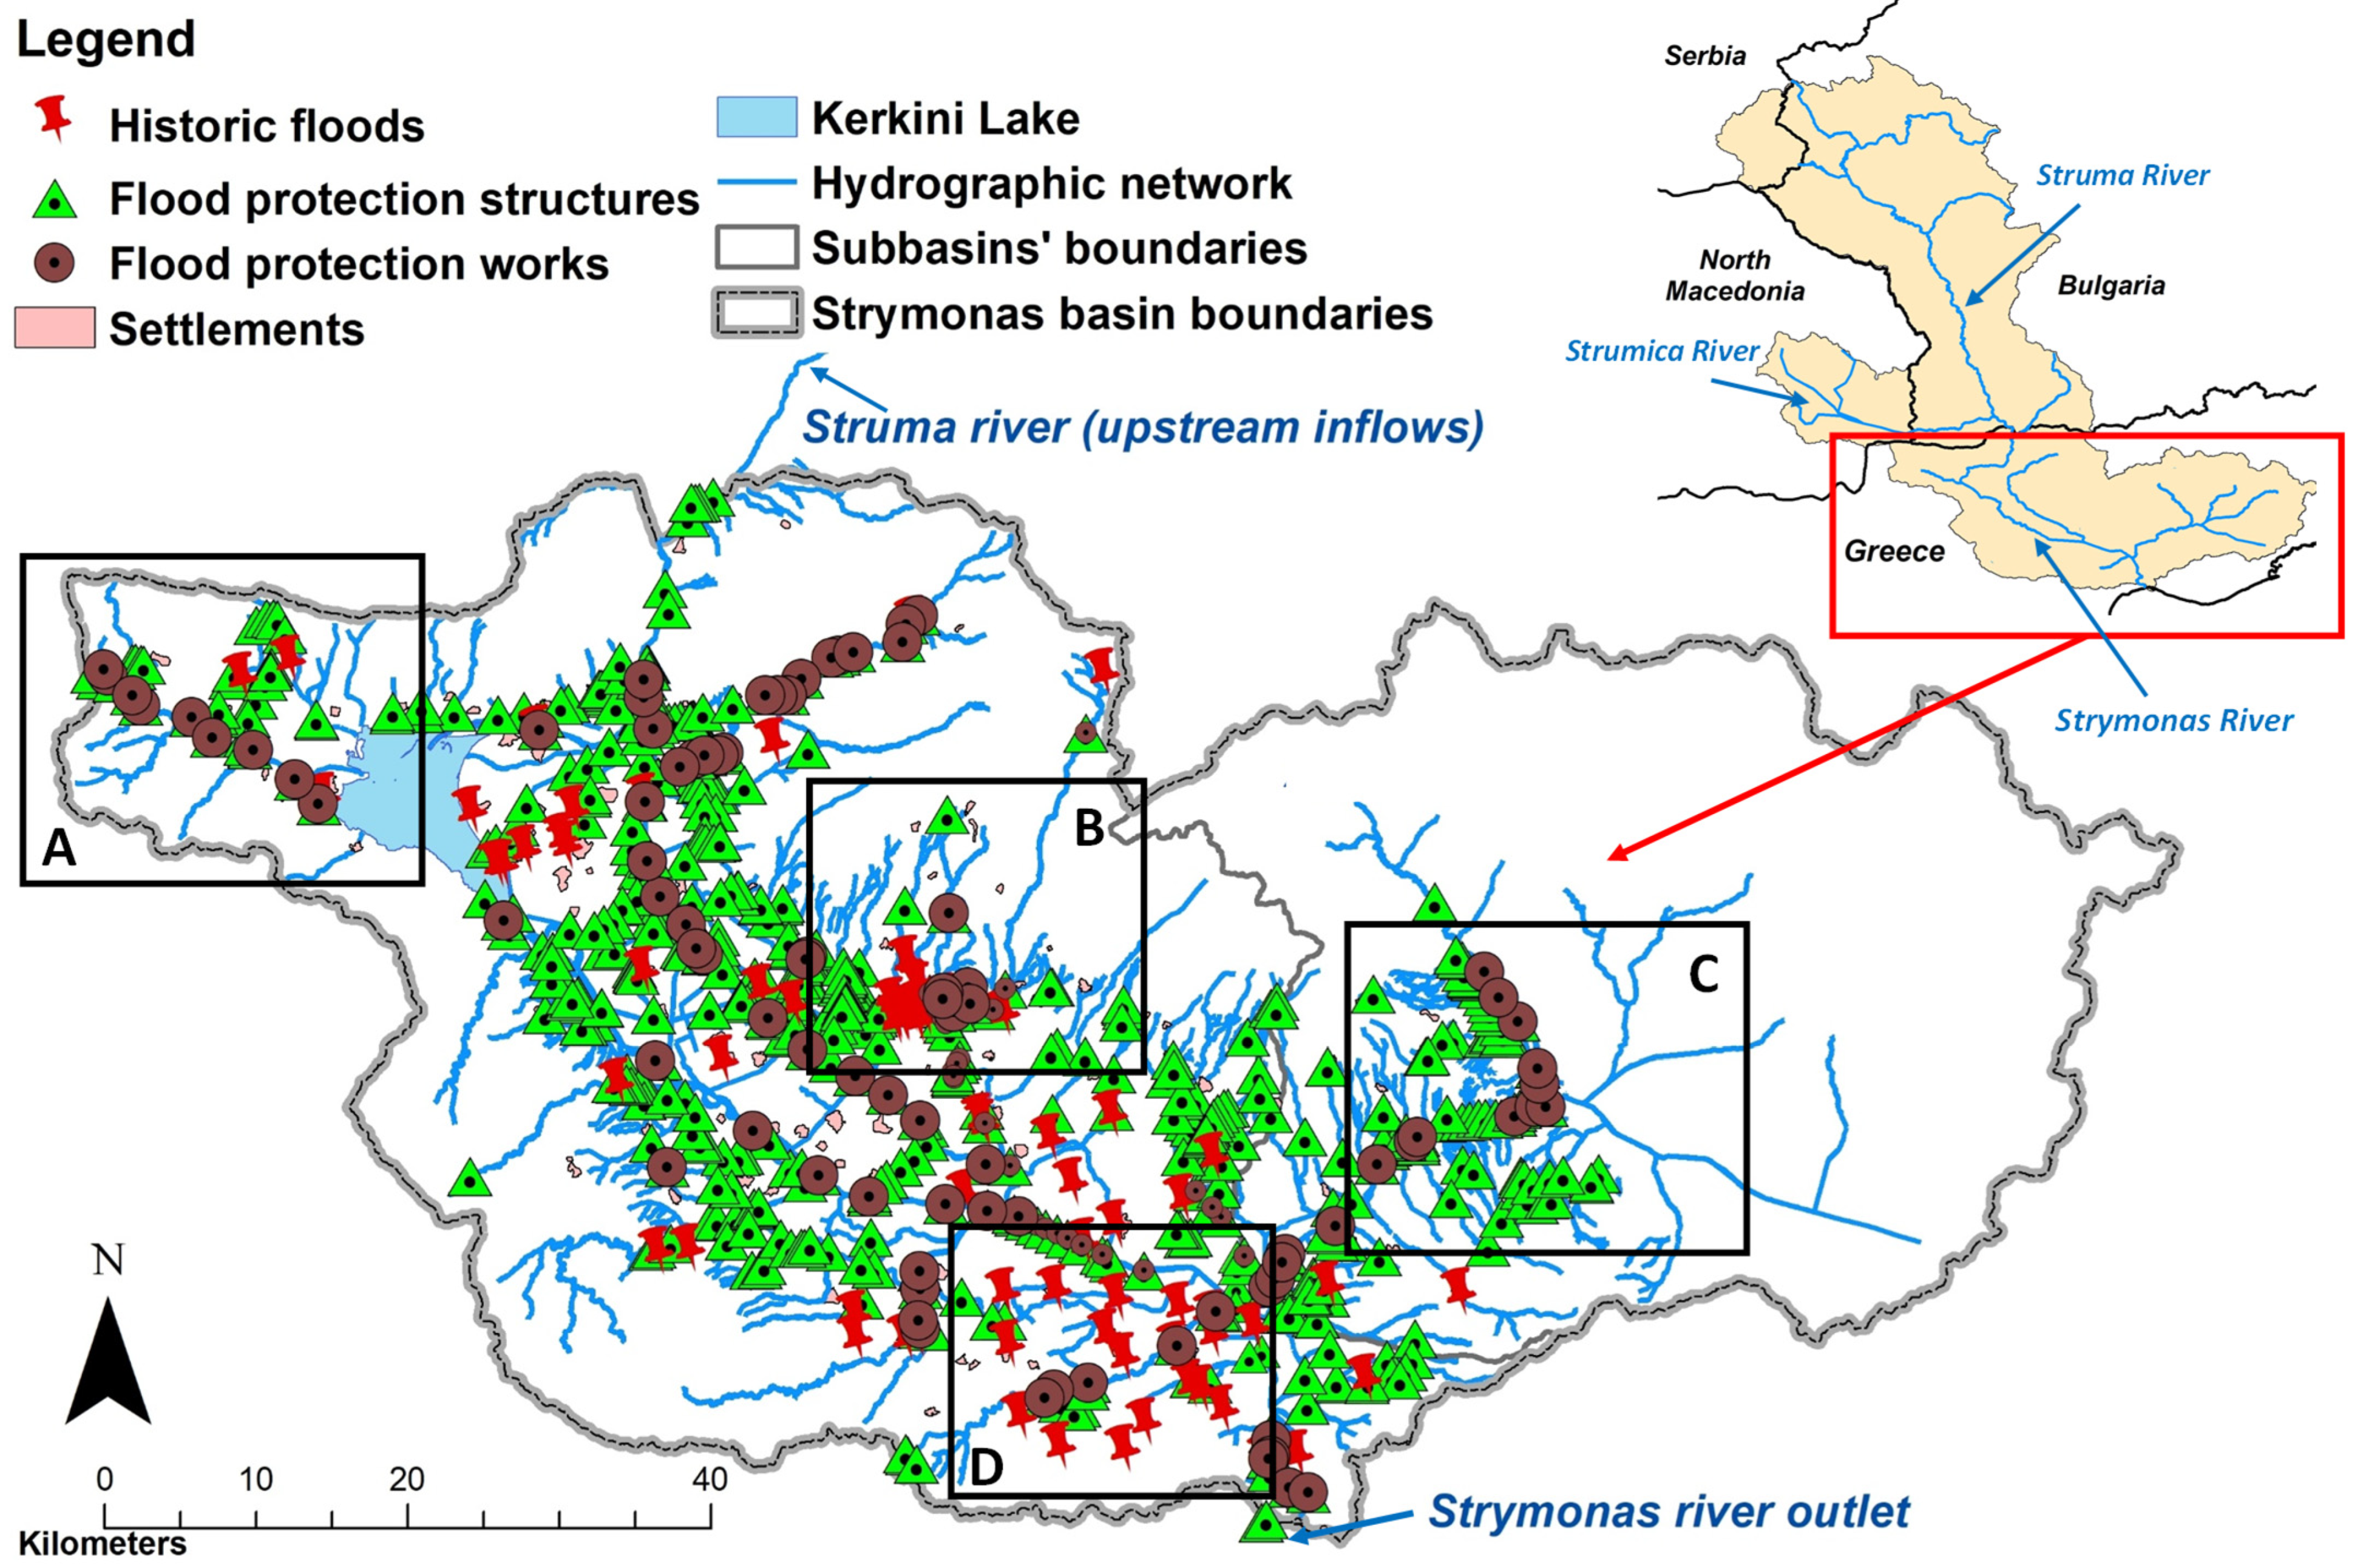
2.1. Case Study Area

The Strymonas River basin, which is the Greek part of the Struma/Strymonas transboundary river basin shared between Bulgaria, North Macedonia, Serbia (upstream countries), and Greece (downstream country), serves as the case study basin. The headwaters originate from the Vitosha Mountain in Bulgaria. The river’s main course converges with the Strumica River, a major tributary located in the western part of the basin that drains waters from North Macedonia, just a few kilometers before crossing the border into Greece (Figure 1). Thereafter, the Struma River is renamed the Strymonas River upon entering Greece and flows southeast for 110 km before outflowing into the North Aegean Sea [33].
In Greece, the river’s flow is regulated by Lake Kerkini, located less than 20 km downstream of the border. This artificial lake was constructed in the year 1932 as a major flood protection project and has since been connected to large-scale land reclamation projects to irrigate important parts of the 833 km2 of the basin’s plain areas. Additionally, a small hydropower plant with a capacity of 8.35 MW regulates the lake’s outlets to the river [34]. Besides its roles in flood protection and agricultural water supply, Lake Kerkini is designated as a Ramsar wetland and is part of the Natura 2000 network [35]. The major tributary of the Strymonas River within Greece is the Aggitis River draining the eastern part of the basin to the main river course. Administratively, the Strymonas River belongs to the River Basin District (RBD) of Eastern Macedonia (EL11). The river network of RBD EL11 consists of 76 river water bodies with a total length of 758.8 km [33]. The main hydrological characteristics of the basin are depicted in Table 1 [33], which also includes the main hydrological features of the river in other riparian regions for completeness. As can be observed, the contribution of the upstream waters is significant, as they consist of 59.4% of the basin’s waters, with Greece extensively using these waters to meet the increased irrigation demands for the 84,500 hectares of irrigated land.
The Greek FRMP of the EL11 area [36] confirms the basin’s vulnerability to flood events both in its northern part and in the plains downstream of Lake Kerkini. In particular, flooding between the borders and Lake Kerkini is attributed to increased inflows from the Bulgarian part of the basin, which cannot be absorbed when the lake’s elevation is already high [33,36,37]. This issue might arise in late spring when the lake is fully retained to meet irrigation demands during the summer dry period. In the plains area downstream of the lake, the elevation difference between the lake’s outlet and the river’s outlet to the sea is less than 40 m. Combined with the river segment’s length of approximately 90 km, this results in a small river slope of less than 0.04%, indicating the river’s limited capacity to rapidly drain upstream waters. The combination, thus, of elevated water levels in the main river course and increased water volumes from tributary rivers results in inundation phenomena. Finally, flooding in the peripheral areas of the basin’s plain primarily involves torrential flash floods originating from the steep mountainous areas surrounding the plain. To that end, FRMP of EL11 proposes 26 flood protection measures [36], including structural measures, such as constructing flood protection structures around waste treatment plants located in high flood hazard areas and increasing levee height in specific river sections, as well as non-structural measures, such as developing a flood early warning system.

2.2. Geographic Information System and Integrated Data

In the research, we use the Quantum GIS v.3.28.2 (QGIS, http://www.qgis.org (assessed on 14 February 2023)) software for the development of the geo-referenced database. The specific system is a free and open-source geographic information system under the Open Source Geospatial Foundation (OSGeo) framework. It is compatible with multiple operating systems, provides a clear graphical user-friendly interface, supports multiple data formats and data sources, permits the development of dedicated customized plugins (e.g., [38]), and moreover, it is supported by an active developer community. Briefly, it is comprised of four major subsystems: (a) the input/capture of data subsystem, (b) the data management/modification subsystem, (c) the manipulation/analysis of data to required formats, and (d) the display of the produced outputs subsystem [39]. Regarding the data used in the study, they were classified into six categories (datasets), with each category containing various independent data that were further integrated with the use of spatial analysis to produce the required outputs. The datasets, their description, as well as the sources are synoptically presented in Table 2. In parallel, a cloud-based version of the geo-reference system (https://gis.consortis.gr/strimonas/ (assessed on 10 June 2024) populated with the datasets of Table 2 was also created. Specifically, the basin’s hydrological characteristics, the land uses, and the environmentally protected areas (Table 2) are publicly available geodatasets in the shapefiles format, originating from the WFD implementation process in the Strymonas basin, the European CORINE Land Cover programme, and the Natura 2000 online repository, respectively. Similarly, the flood hazard maps and the historical floods are the outputs of the FD implementation process, also publicly available in the cloud with the critical infrastructure datasets as part of the EU SEVESO Directive, being freely accessible as well. Finally, spatiotemporal information on the flood protection structures, measures, and works were derived from the repositories of the Directorate of Technical Works and Projects of the seven municipalities located within the basin’s boundaries, the Water Directorate of the Decentralized Administration of Eastern Macedonia, and the Environmental Directorate of the Central Macedonia Region, i.e., the administrative authorities within the basin. In many cases, these repositories were in analog format, so the necessary information, such as the location of the structures and works, was digitized in a common projection system as the existing geodata and linked with descriptive attribute files containing details about the project implementation date and its technical characteristics.

2.3. SWOT Analysis and Questionnaires’ Identity

To perform a SWOT analysis of the Strymonas hydrosystem to determine the strengths, weaknesses, opportunities, and threats of its flood protection capacity and to correlate the findings with GIS analysis and spatial data, four distinct questionnaires were developed following a format similar to that used in the research of Katirtzidou et al. [41]. Each questionnaire targeted a different thematic category, namely, the urban environment, riparian environment, agricultural environment, and natural environment, located within the Strymonas River catchment. To enable respondents to evaluate the questions and measures included in the SWOT analysis questionnaires, they were provided with a comprehensive illustration of the case study’s hydrosystem, detailing flood occurrences and defense infrastructures (i.e., flood protection capabilities) via a custom-developed geo-referenced database. This approach ensured that respondents had a thorough understanding of the system, enhancing the credibility of their responses by combining their expertise in water-related projects with detailed system knowledge. The sample of respondents comprised an interdisciplinary group of 17 individuals. All respondents held a university degree or diploma in natural sciences or engineering. Additionally, 85% of the respondents had at least a master’s degree in their discipline, and 75% had at least 15 years of work experience in civil and environmental engineering.
The topics in each questionnaire covered three sectors within the same area, i.e., (i) economic, (ii) social, and (iii) environmental, and presented pre-determined options regarding flood protection for each of the SWOT analysis components. In order to have unbiased answers, significant effort was made to ensure equal coverage of all sectors in each questionnaire, avoiding directed answers [42]. Table 3 presents the number of questions per SWOT analysis component, while the whole set of questionnaires is available in Appendix A. All respondents rated each proposed measure/element on a scale from 0 (low score) to 5 (high score) for all 190 elements of the four questionnaires (Table 3) that formed the SWOT analysis. The scores were then normalized to a 0 to 5 scale by dividing the sum of the scores for each element by the number of respondents (17 responders in total). Elements receiving a mark between X.0 and X.33 were given a final score of X.0, elements with a score between X.34 and X.66 were given a final score of X.5, and elements scoring between X.67 and (X + 1).00 were given a final score of (X + 1).0, where X corresponds to integers 0, 1, 2, 3 and 4. For example, the proposed measure “S6—Development of wetland-based flood protection projects” (see Section 3.3.4 for more details) received 61 marks. After normalization, it had a score of 3.58 (=61/17), resulting in a final score of 3.5. It is important to note that some of the questions posed to respondents were consistent across all categories, but they targeted different thematic environments. For instance, the question regarding the usefulness of mobile flood protection systems appears in each questionnaire. Nevertheless, respondents assessed and rated the effectiveness of these systems within each specific environment, which allowed for different ratings depending on the applied environment.

3. Results

3.1. Flood Protection Projects and Flood Occurrences

The survey data analysis concerning the technical structures and measures in the case study area and their integration into a GIS environment, revealed that 649 flood protection structures and measures have been constructed within the Strymonas basin, as shown in Figure 2. The oldest recorded flood protection structure is the construction of Lake Kerkini in 1933, which was created as a flood protection reservoir in the northwestern section of the basin and later transformed into one of the most significant wetlands [43]. The most recent structural measure focuses again on Lake Kerkini and involves reinforcing the lake’s eastern dikes, extending 2570 m. This project was completed in 2023 and was funded through the “Flood Protection—Cross Border Planning and Infrastructure Measures for Flood Protection” initiative under the INTERREG V-A European Territorial Cooperation Program “Greece-Bulgaria 2014–2020” [24]. Among the other flood protection constructions, bridges are the most common, making up 41.9% (272 out of 649) of the projects. This is followed by 185 culvert constructions, representing 28.5% of the structures. The third most common type, accounting for 17.1% of the flood protection measures, involves low-water crossing projects, also known as Irish bridges, which facilitate the crossing of water bodies during dry conditions, i.e., when the water flow is low, but are designed to be submerged during high-flow conditions, such as floods. Other types of constructions, such as weirs, dams, and gabions, are approximately 2.0–3.0% of the projects.
At the same time, as demonstrated in Table 4, 101 flood events were recorded in the Strymonas River basin from 1950 to 2018, with 29 of them being characterized as significant. According to Greek legislation, significant floods are those associated with human losses, flooded areas larger than 500 hectares, and/or financial compensations exceeding 200,000€ [44]. The flood events are divided into two time periods: until the year 2011 and from 2012 to 2018. The later period coincides with the operation of the national official database for recording and mapping floods, which includes 1953 significant floods at the national level. In contrast, the 297 significant floods recorded in the earlier period, up to the year 2011, are based on sparse data and information, such as past newspaper reports and regional records; thus, they are notably fewer than those in the second period [45]. Most historic flood events, i.e., 32 floods, occurred in the Municipality of Serres (symbolized by the black square with the label B in Figure 1), which hosts the largest city in the basin, namely Serres, with approximately 75,000 inhabitants. According to the Directorate of Technical Works and Projects of the specific municipality, one of the sources used for populating the flood protection structures and measures repository of the research, the lack of canalization projects in the ephemeral streams originating from the mountainous parts and crossing the municipality has played a crucial role in the occurrence of floods. The directorate supports the straightening and deepening of the river channels to increase the river’s carrying capacity in inhabited areas, thereby protecting these areas from flooding.
The spatial analysis comparing flood events with the locations of flood protection structures revealed that the broader area of the Municipality of Serres (indicated by the black square labeled B in Figure 1) is highly susceptible to flooding, leading to numerous flood protection initiatives. Despite these efforts, four major flood events were recorded between 2012 and 2018, representing 21% of the significant floods across the entire basin during this timeframe. This indicates that the flood protection measures in this region require further enhancement. In contrast, the Aggitis River region (shown as the black square labeled C in Figure 1), which is the largest tributary of the Strymonas River in Greece, has not experienced any flood events, demonstrating the effectiveness of its flood mitigation infrastructure. Lastly, the southwestern part of the basin (marked by the black square labeled D in Figure 1) is the most flood-prone area, as evidenced by the high density of red pins representing flood occurrences during both recording periods. This area has relatively few flood protection measures, underscoring the need for additional interventions.

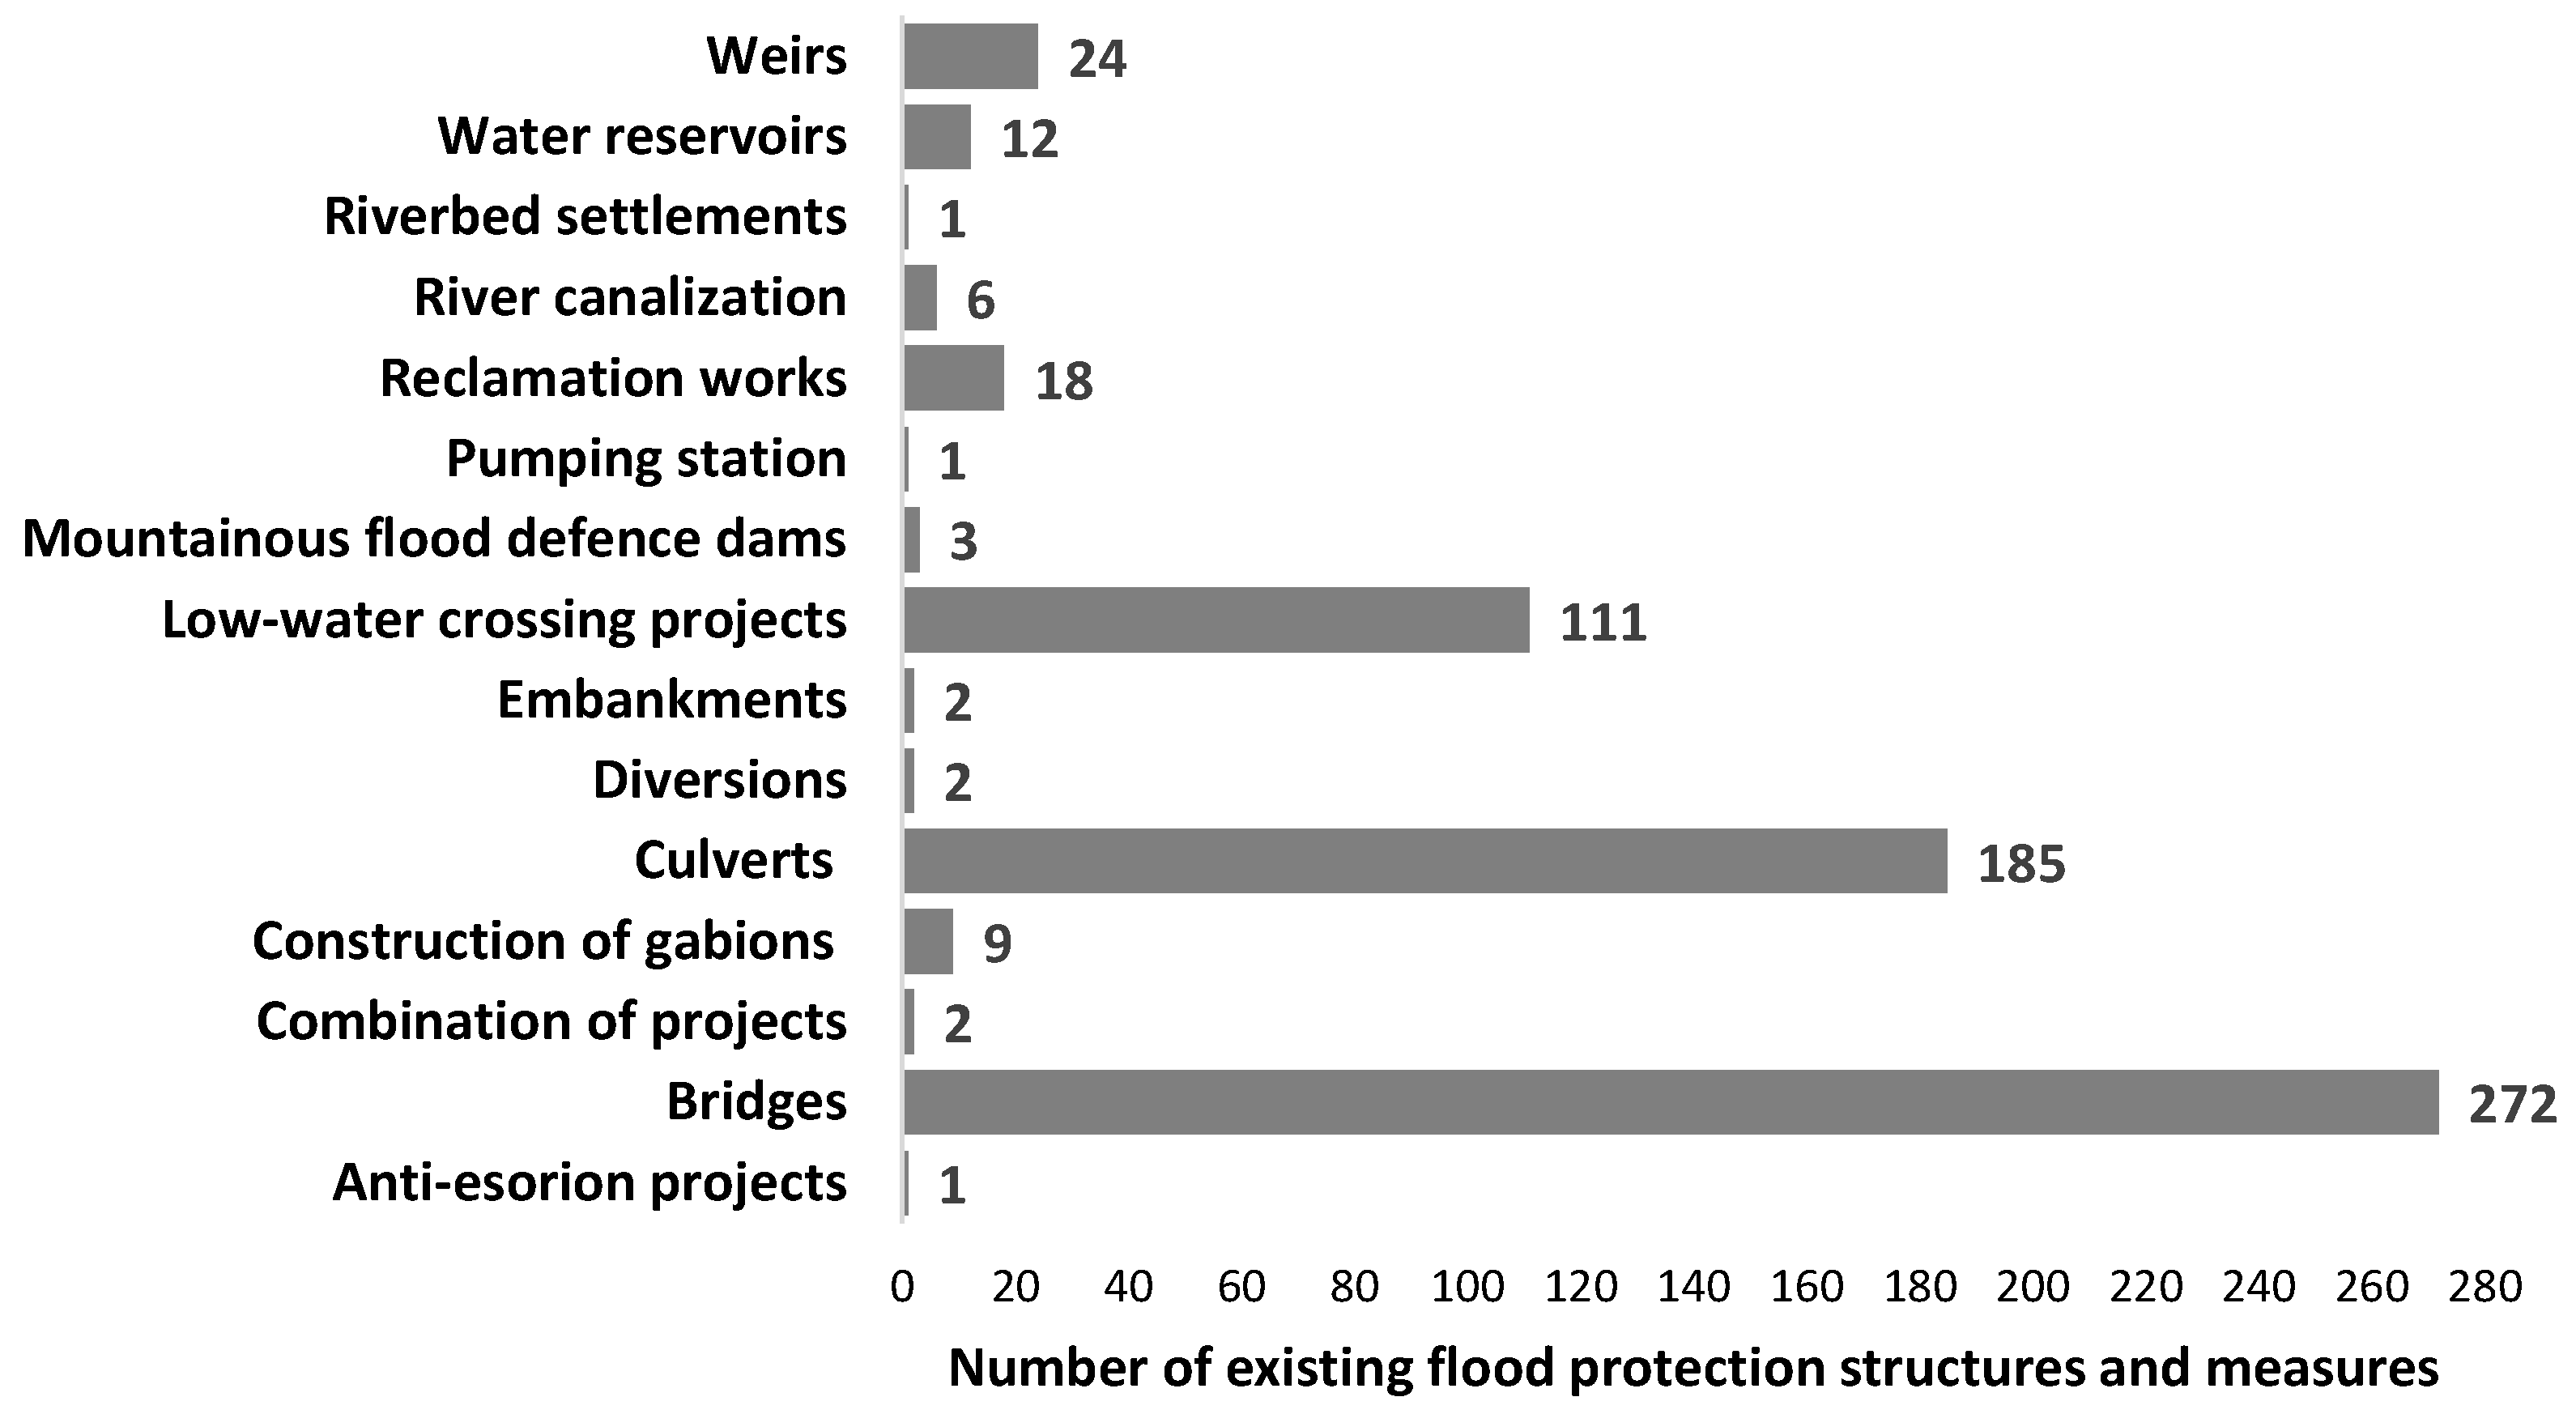
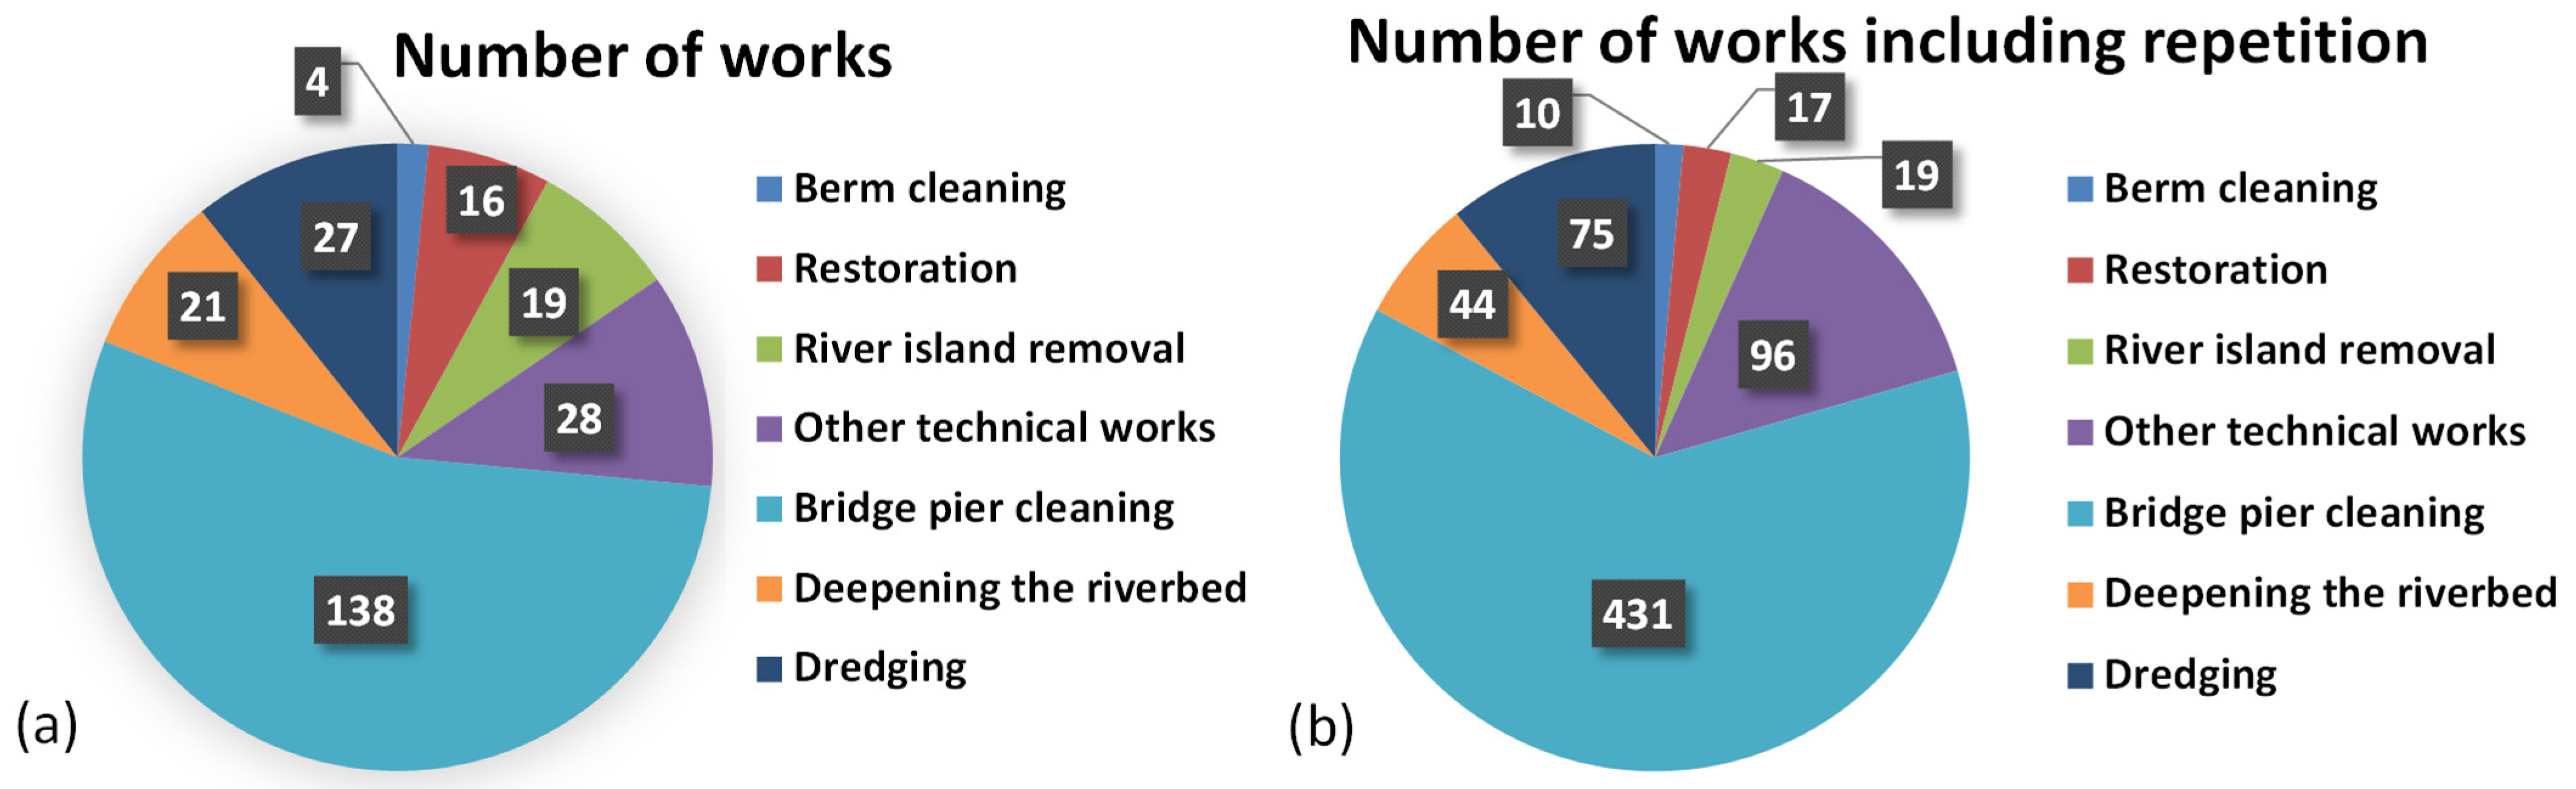
3.2. Flood Protection Technical Works

The identified flood protection technical works were classified into seven general categories: berm cleaning, restoration, river island removal, bridge pier cleaning, deepening the riverbed, dredging, and other technical works. Berm cleaning involves the removal of sediments and debris from berms to increase their efficiency in flow regulation. Restoration involves activities like earth filling of embankments, canalization studies, embankment reinforcement, protecting the riverbed, and stabilizing banks with gabions. River island removal focuses on removing obstacles created by sediment depositions. Bridge pier cleaning refers to maintenance activities undertaken to remove sediment, debris, vegetation, and other materials that accumulate around bridge piers, obstructing water flow. Deepening the riverbed involves activities to increase the depth of the river channel, enhancing its capacity to carry water. Dredging is the process of removing sediment, silt, debris, and other materials from water bodies. Additionally, other technical works include projects that do not fit into these categories, such as the restoration of low-water passage structures.
The analysis of the retrieved data revealed, as shown in Figure 3a, that during the last few years, 253 flood technical protection works have been recorded at distinct parts of the basin. Most of these flood protection works focused on clearing materials gathered on bridges’ piers, accounting for 55.0% (138 out of 253 works). Dredging and other technical works each accounted for 11% (28 out of 253 works for each type), while the occurrence of other types of works was less frequent. When factoring in the repetition of these works over time for the same structures, for example, performing bridge pier cleaning on the same bridge multiple times a year, as depicted in Figure 3b, the total number of works increased significantly to 692 technical works, nearly 2.7 times more than the initial count. Bridge pier cleaning remained the most frequent work, accounting for 62.0% (431 out of 692 works), with the number of occurrences rising from 138 to 431, coinciding with a percentage increase of over 300%. Dredging constituted 11.0% of the total works (75 out of 692 works), while other technical works represented 14% (96 out of 692 works). The occurrence and repetition percentages of other works conducted in the basin, such as deepening the riverbed, were much smaller.
Regarding the correlation between flood locations and the placement of flood protection works, the analysis showed that proactive maintenance of water bodies, such as in the case of the Aggitis River and its tributaries (black square labeled C in Figure 1), effectively eliminated the occurrence of flood events. On the other hand, the results indicate that despite the repeated implementation of flood protection actions, such as berm and bridge pier cleaning or dredging works in specific parts of the basin (highlighted in black squares B and D in Figure 1), these efforts have not been fully effective, as floods continue to occur. Given the high costs associated with these recurring flood protection works, it is essential to explore alternative solutions in the regional flood risk management plans.

3.3. SWOT Analysis Outputs

The results from the SWOT analysis for each category are illustrated in the following spider charts. Each chart displays the score for each question, ranging from 0 to 5. The labels SXX, WXX, OXX, and TXX represent the numbering, i.e., XX focused on strengths, weaknesses, opportunities, and threats, respectively.

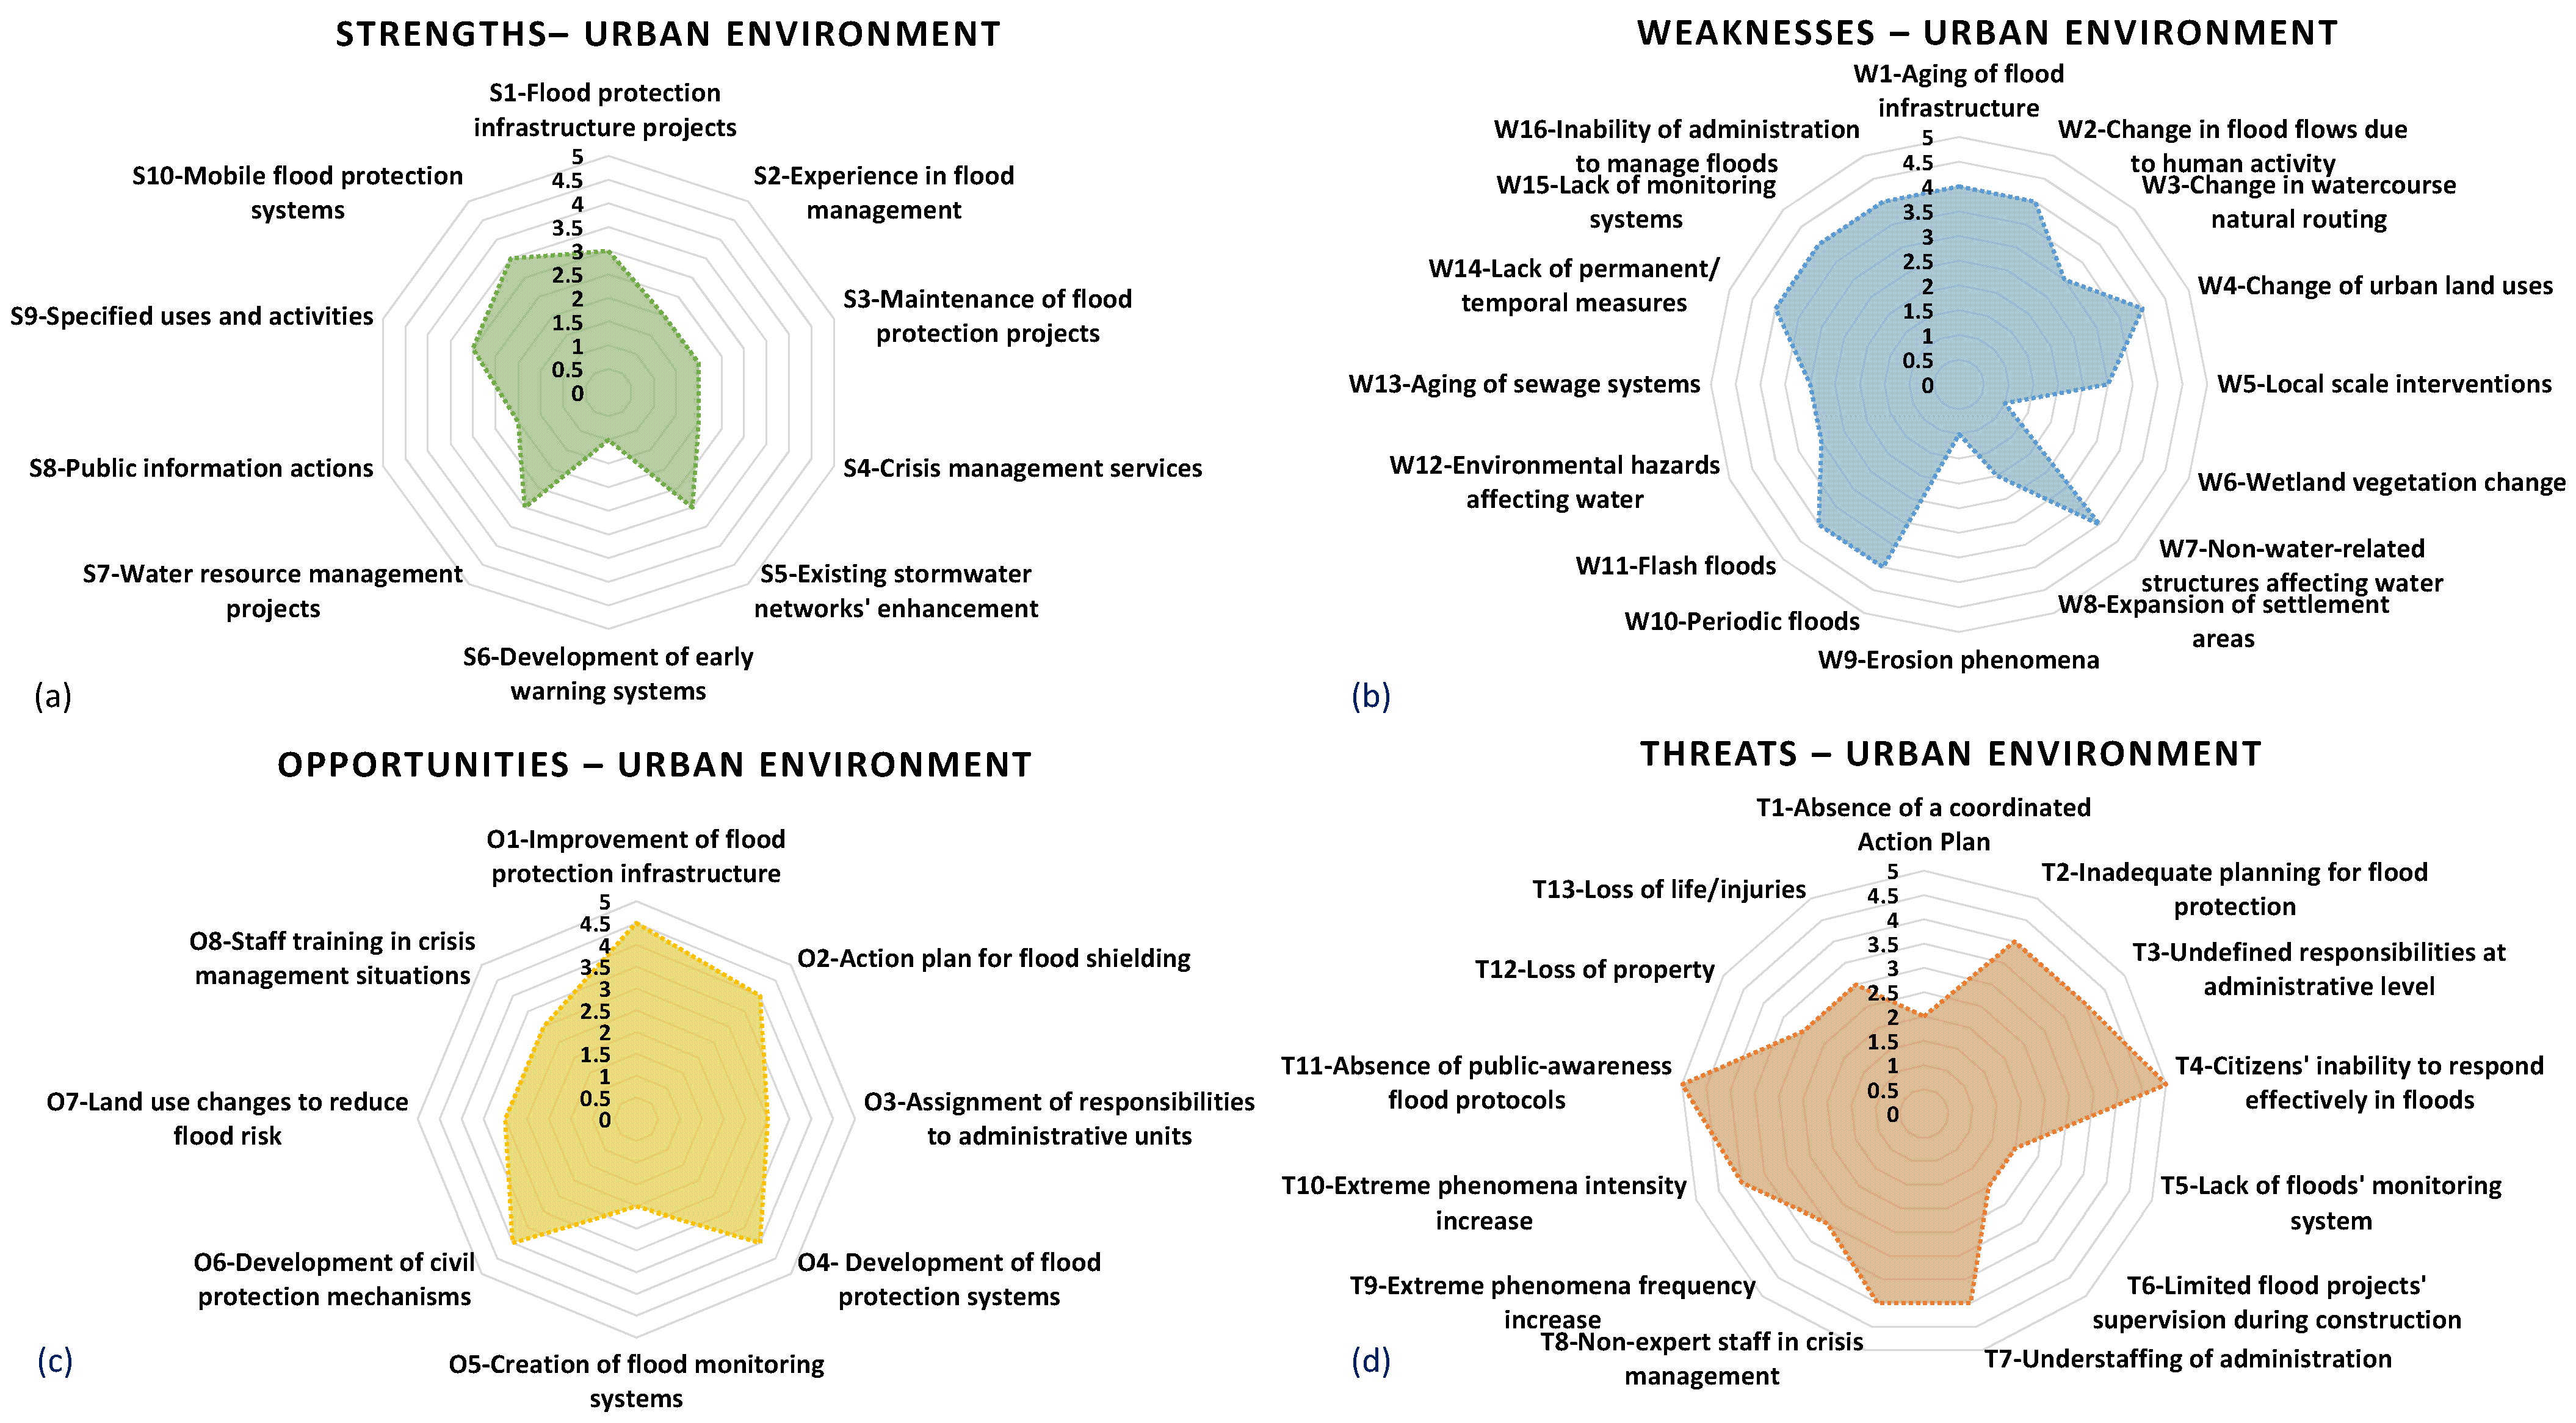
3.3.1. Urban Environment

Starting with the urban environment and its strength elements (Figure 4a), the existing flood protection infrastructure, represented by the option “S1—Flood protection infrastructure projects”; the improved stormwater networks, represented as “S5—Existing stormwater networks’ enhancement”; the conducted water resources management projects, attributed as “S7—Water resource management projects”; and the knowledge on specific actions, expressed through “S9—Specified uses and activities”, all received a higher score of 3.0 points. Actions such as experience in flood management (S2) and maintenance of flood protection infrastructure (S3) received lower rankings, while the question regarding the development of early warning systems (S6) received the lowest mark, highlighting the deficiency in these types of flood protection measures.
In terms of weaknesses, 9 out of 16 elements (i.e., more than 55% of the responses), as shown in Figure 4b, received a grade of 4.0, signifying the system’s weaknesses. Among the highlighted weaknesses are the degradation of flood protection measures over time in terms of safety and resilience (W1), human activities and urban infrastructure within or near river courses that obstruct water flow (W7), and the incapability of administrative units to respond effectively during flood events (W16). Conversely, erosion phenomena (W9) received the lowest mark of 1.0, demonstrating the absence of erosion in urban environments. In term of threats, the lack of procedures and mechanisms to inform the public (T11), along with the citizens’ inability to properly respond in case of extreme events (T4), are considered the highest threats, receiving 5.0 points, as depicted in Figure 4c. Regarding the identified opportunities within the hydrosystem (Figure 4d), the improvement of flood protection infrastructure (O1), the development of new flood protection systems in flood prone areas (O4), and the enhancement of civil protection mechanisms (O6) are considered the best opportunities, receiving grades of 4.5, 4.0, and 4.0, respectively. Contrarily, the creation of a flood monitoring system is not perceived as a significant flood protection opportunity, as it only received a grade of 2.0.

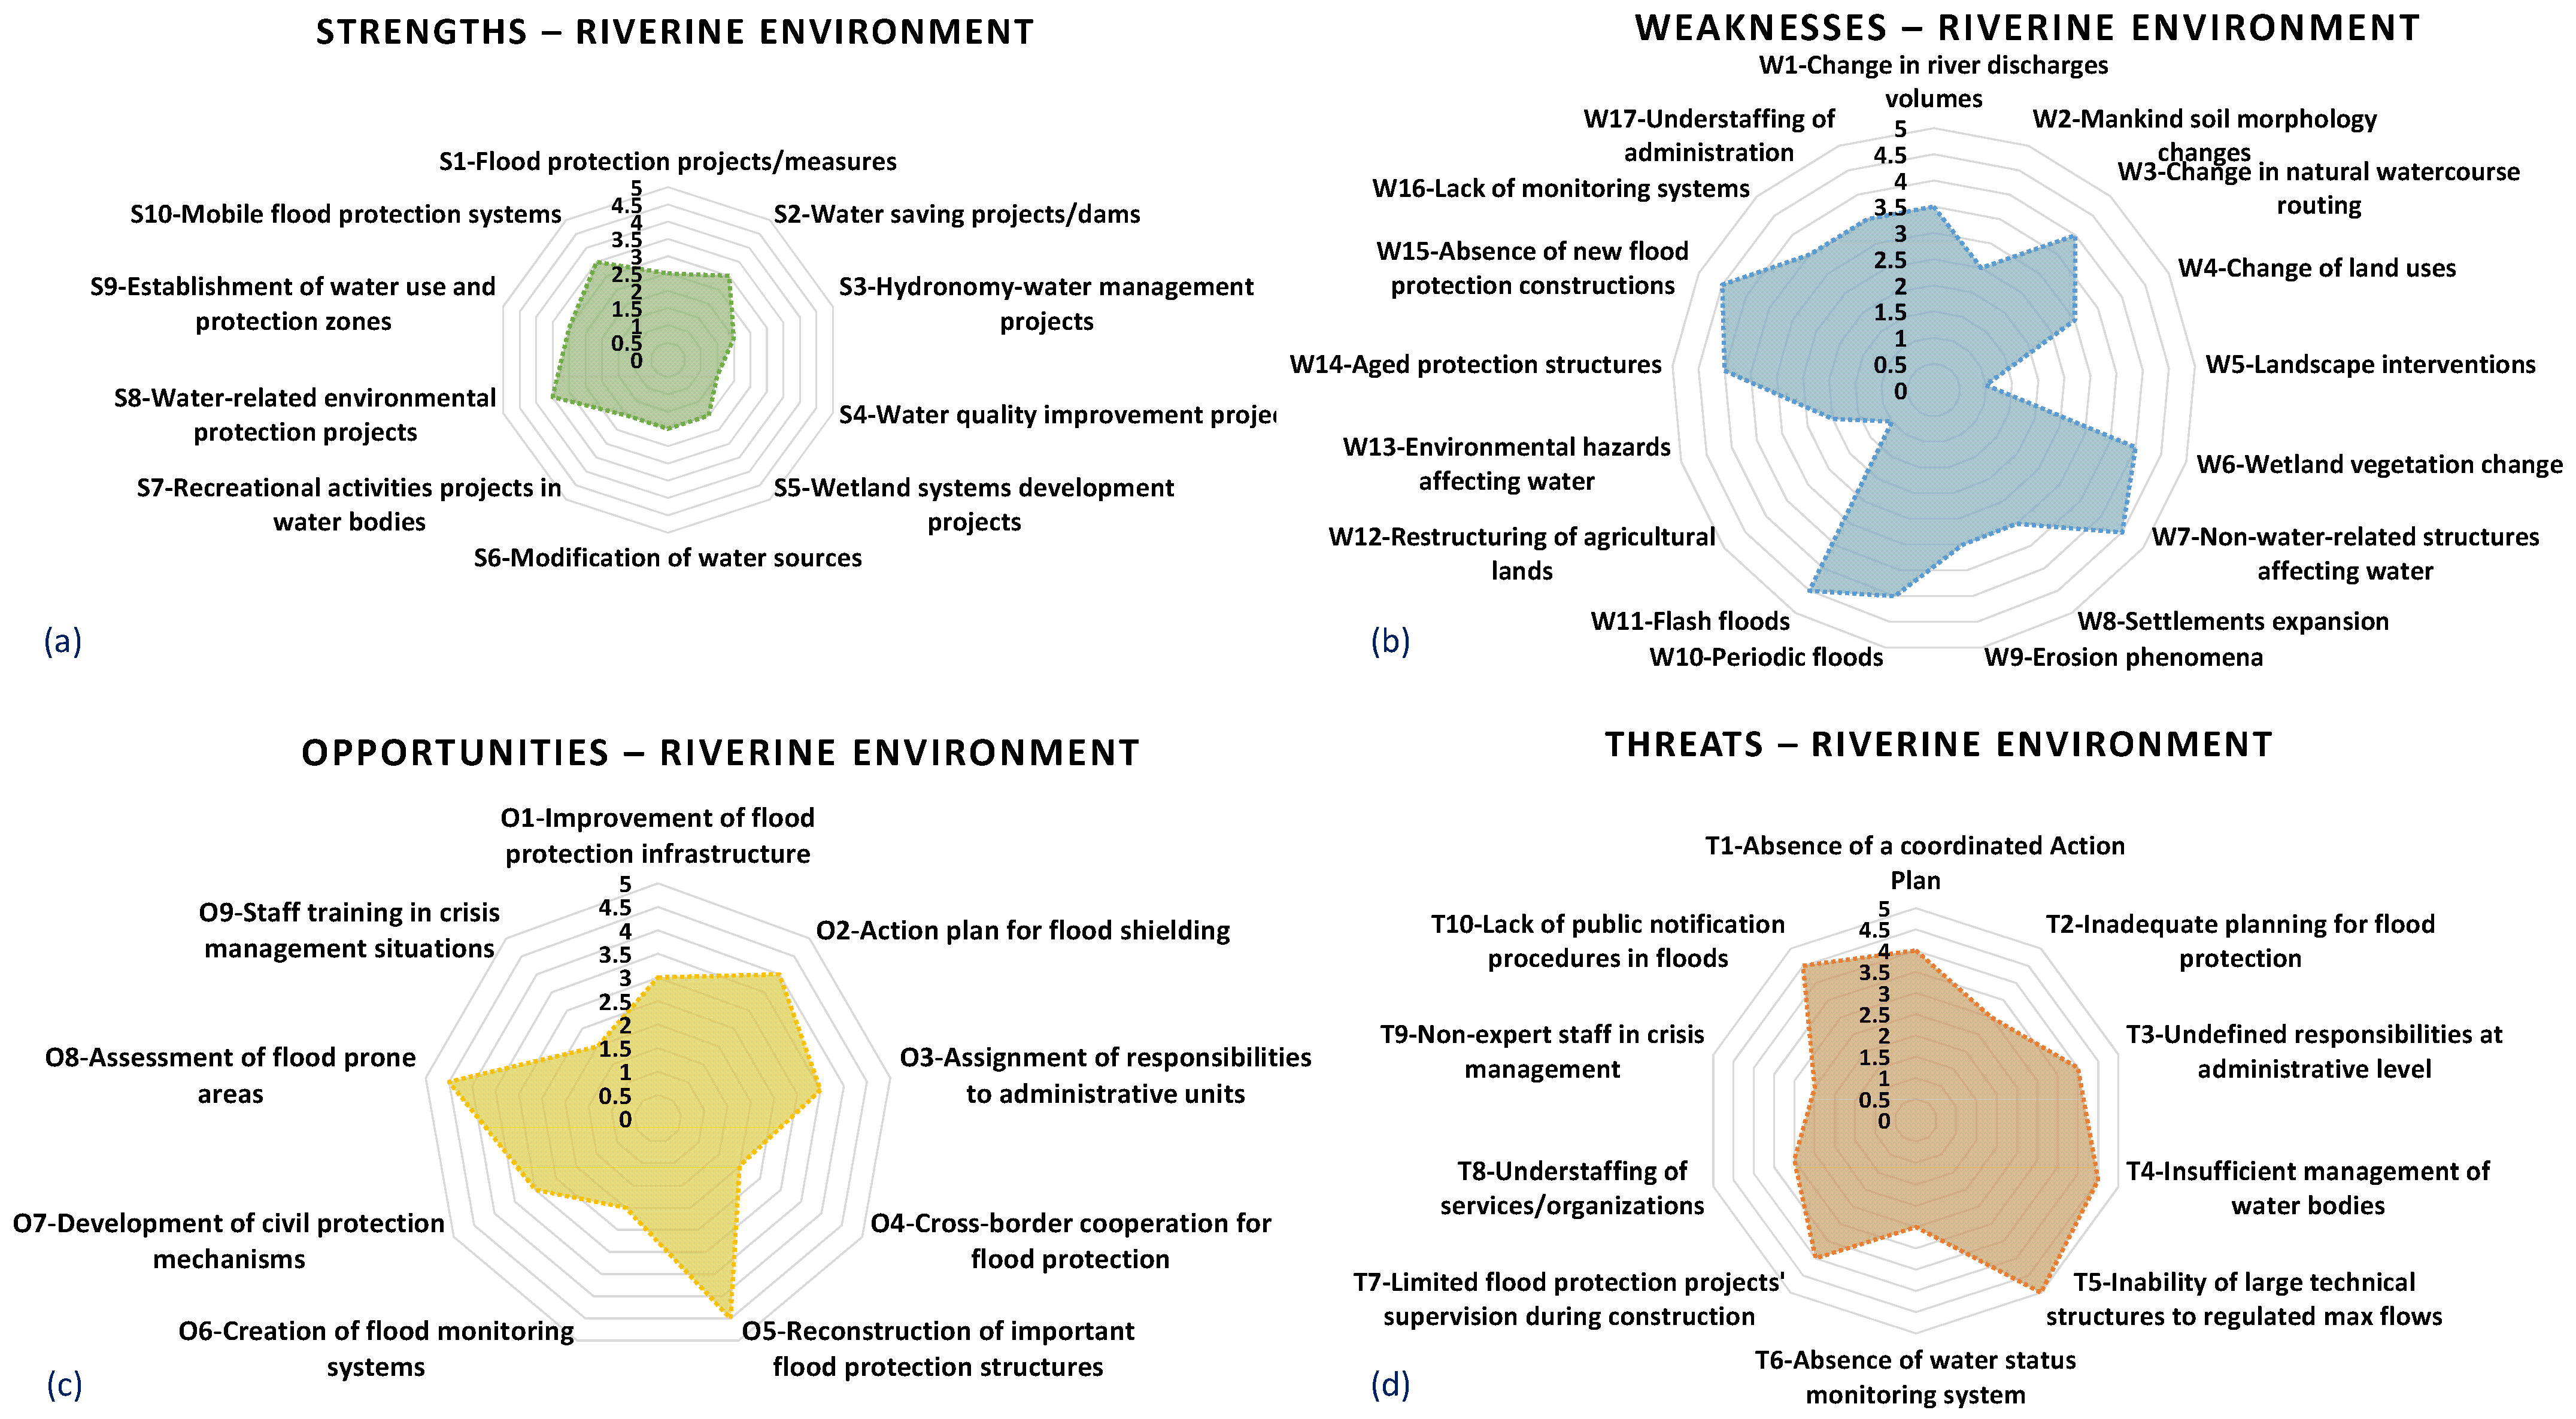
3.3.2. Riparian Environment

The strength elements within the riparian environment revealed a moderate situation, as shown in Figure 5a. This is particularly evident from the element “S8—Water system environmental protection projects,” which received a score of 3.5 out of 5.0 points, the highest in this category. This score demonstrates that environmental projects in riparian areas significantly contributed to flood mitigation. Actions such as “S2—Water saving projects/dam” and “S9—Establishment of zones of use and protection in areas with water potential” received the next highest score of 3.0 out of 5.0. In contrast, actions related to water management projects, such as S3 and S5, and modifications of water sources, like “S6—Modification of water sources” and “S7—Projects to develop recreational activities in water bodies,” received lower rankings. The item “S10—Mobile flood protection systems”, received the lowest score, indicating that respondents believe these projects provide minimal flood protection strength for large rivers.
Regarding weaknesses in riparian zones, Figure 5b shows that numerous elements received scores higher than 3.5, with six elements scoring above 4.0 out of 5.0. Notably, the major weaknesses identified include changes in watercourse routing/physical flow change conditions (W3), changes in wetland vegetation (W6), construction of technical works and infrastructures not related to water (W7), flash floods (W11), obsolete construction of protective measures (W14), and the absence of construction of protective measures (W15). The high-scoring opportunities are external environmental elements that can be leveraged to enhance protection. In the riparian environment, the most significant opportunities, as depicted in Figure 5c, included the development of an action plan for flood shielding (O2), the reconstruction of essential protection and civil works (O5), the assessment of vulnerable spots/places (O8), and the prioritization of interventions (O10). These results indicate substantial opportunities, mainly focusing on the implementation of new and more efficient flood protection works and measures in specific areas, emphasizing the need for an action plan, particularly in vulnerable areas. In the threats category, the most critical threats identified are the inability of current construction works to prevent flooding (T5) and the lack/insufficiency of flood control mechanisms and public awareness procedures (T4 and T10, respectively), as shown in Figure 5d.

3.3.3. Agricultural Environment

The results of the SWOT analysis for agricultural areas revealed that no strength element scored higher than 3.5 out of 5.0, Figure 6a, indicating that only 8% of respondents believed there is adequate flood protection for the agricultural sector. This suggests that minimal efforts have been made to improve flood protection measures, and the current infrastructure is poorly rated due to inadequately constructed flood protection infrastructure, poor maintenance, and a lack of sustainable management and action plans for flood protection in agricultural zones. The highest score, 3.5 out of 5.0, was only given to one element focusing on the current flood protection infrastructure in relation to overall environmental protection (S9). However, most elements scored below 2.5 out of 5.0, highlighting the need for a more targeted approach to protecting irrigation systems in agricultural land (S4), modifying land use (S11), and developing new intervention measures (S1).
In respect to weaknesses in agricultural areas (Figure 6b), element scores exhibited a range from 4.5 to 1.0. The least pronounced weakness was the restructuring of agricultural land (W13), indicating that the spatial distribution of cultivations is not a significant concern in flood management plans, scoring 1.0 out of 5.0. Similarly, issues such as soil erosion (W10) and soil morphology (W3) received scores of 2.0 out of 5.0, reflecting moderate weaknesses. Conversely, the three top-scored weaknesses highlighted in the analysis pertained to the non-water-related structures affecting water (W7), the absence of projects capable of restraining floodwaters (W1), and the inadequate arrangement of cultivation types in agricultural land to mitigate flooding impacts (W4).
Regarding external factors for flood protection in agricultural land, the opportunities with the highest scores, 4.5 out of 5.0, as depicted in Figure 6c, are restructuring crop cultivation (O9) and changes in land use (O8). These opportunities were widely recognized and supported by the questionnaire respondents, indicating strong potential for improving flood resilience through strategic agricultural practices and land use planning. Conversely, informing farmers about flood-related issues (O3) received the lowest score among the opportunities identified. Finally, the threats identified in Figure 6d indicate that 73% of the elements in the questionnaire are of medium to high importance. This reveals numerous critical external factors that could potentially undermine and expose agricultural land to flood risks in the study area. Particularly, the limited supervision of flood protection projects during their construction phase (T6) and the loss of incomes (T9) are considered the most important threats.

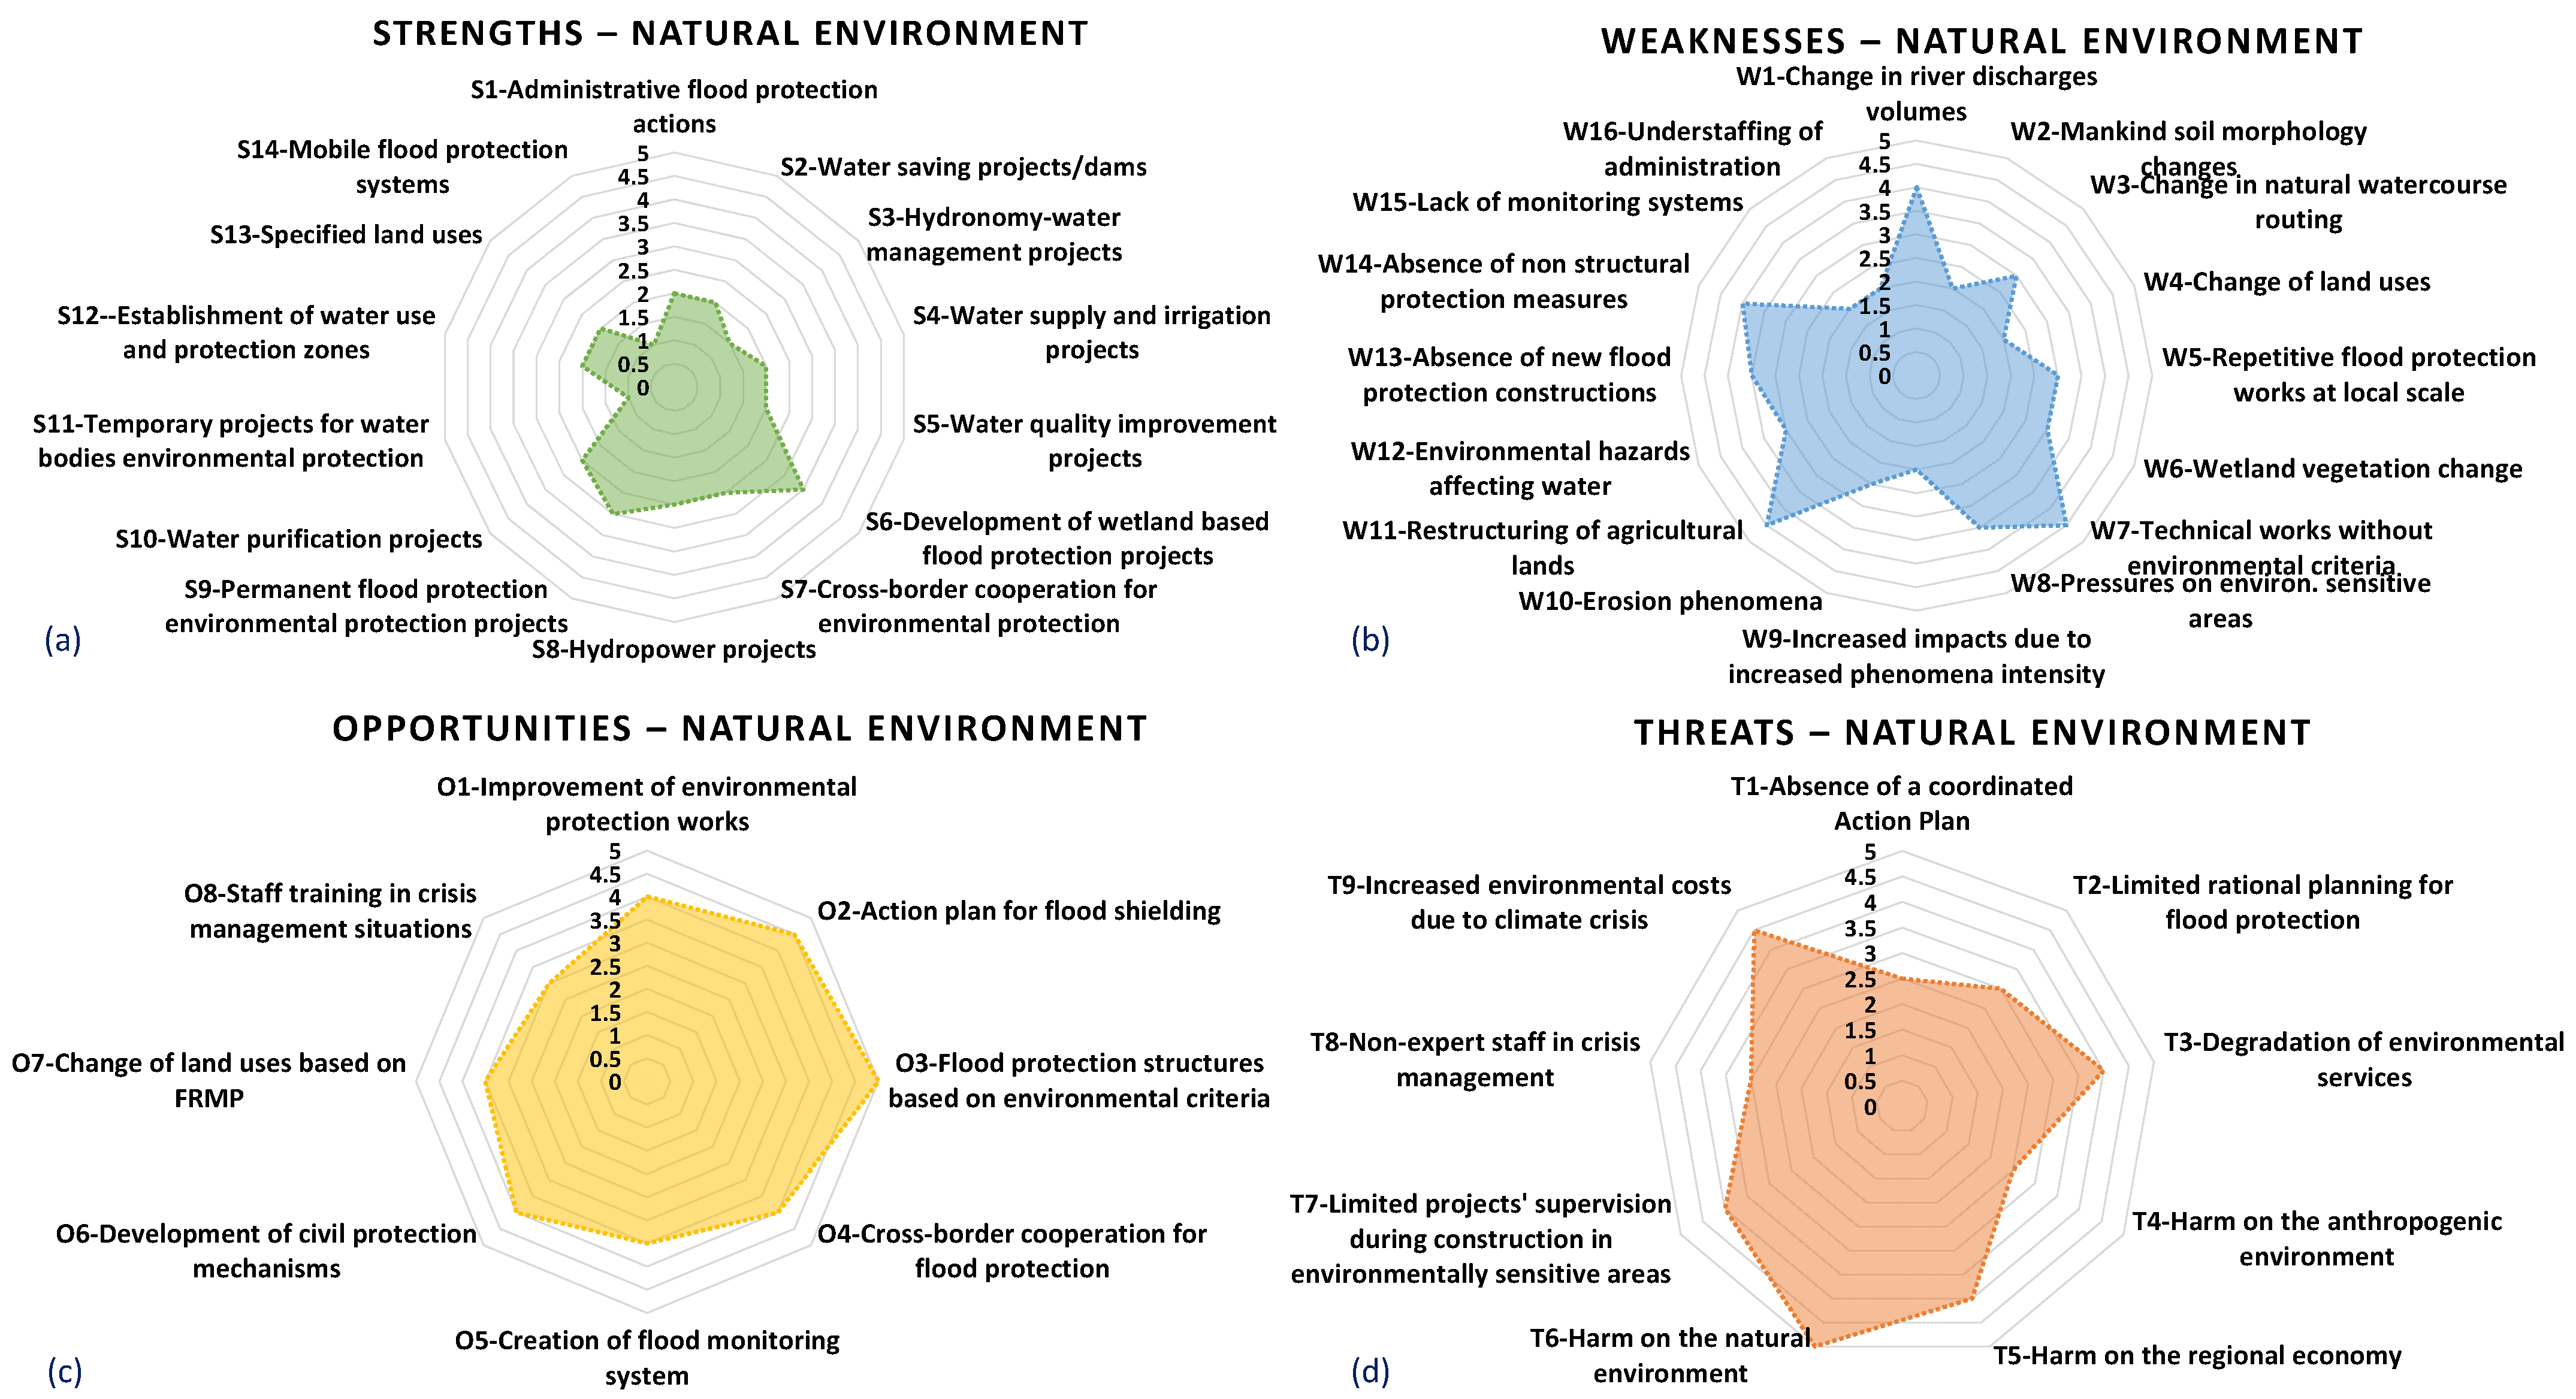
3.3.4. Natural Environment

The strength analysis of the natural environment indicates that the scores for existing flood protection infrastructure averaged between 2.0 and 3.0 out of 5.0. The highest score of 3.5 was associated with the development of wetland-based flood protection projects (S6) aimed at providing protection during flooding events. The relatively low scores of all other elements underscore the limited effort and attention given to the protection of the natural environment and natural resources concerning floods. In fact, the strengths in this category showed the lowest average value, 1.9/5.0, compared to those identified in urban, riverine, and agricultural environments. This suggests that flood protection measures in the natural environment receive the least interest and investment.
Regarding weaknesses in the natural environment, several elements scored more than 3.0 out of 5.0, indicating a significant lack of proper infrastructure and actions for the protection and restoration of the natural environment and its inhabitants. A critical issue is that most flood protection infrastructure has been constructed and maintained without considering environmental criteria (W7). Additionally, elements W1, W10, and W14 all highlight the inadequacy of current flood protection infrastructure and management practices. Concerning the opportunities and threats in the natural environment category, the opportunities emerging from four high scoring elements (>3.5/5.0) were the improvement of environmental protection works (O1), the necessity for the elaboration of an action plan for flood shielding (O2), flood protection structures based on environmental criteria (O3), and cross-border cooperation for flood protection (O4). The average score of all elements in the opportunities category was 3.2/5.0. In the threats category, the elements also scored high, with an average of 3.6/5.0 across nine questions. The most critical threats were those referring to economic and financial elements, such as harm to the regional economy (T3), the absence of mechanisms for supervision and control of projects in environmentally sensitive areas (T7), and the increase in environmental costs related to the climate crisis (T9).

4. Discussion

The literature demonstrates the routine use of GIS in flood studies, either for rainfall and runoff data preparation [46], spatial data manipulation for producing useful terrain insight [47], or flood extent visualization [48]. Conversely, SWOT analysis has been rarely applied in the context of flood protection, with most studies focusing on the management or prioritization of flood protection measures [49,50]. Similarly, the integration of GIS with SWOT analysis in environmental contexts has been scarcely addressed in the literature. The innovative aspect of this study is its combination of flood-related GIS with SWOT analysis utilizing structured questionnaires. This integration enhances decision-making capabilities [51], with the questionnaires serving as the link between the geo-referenced database and the SWOT analysis. A detailed presentation of case study data is crucial for developing a well-rounded opinion, which is then reflected in the questions and elements of the SWOT analysis. Additionally, the online publication of the geo-referenced system is considered an asset, as it facilitates stakeholder involvement [52] and serves to highlight areas where further flood protection actions are necessary. Moreover, the detailed mapping of flood protection structures, measures, and works is crucial for effective flood management, an initiative that many countries, including Greece, have yet to fully develop despite how its necessity is outlined in the flood risk management plans for each river basin.
The decision to work on four distinct categories—urban environment, riparian environment, agricultural areas, and natural environment—was based on the need to assess and parameterize their unique requirements and characteristics. Each questionnaire was slightly modified to elicit targeted and clear responses relevant to its category. This approach stemmed from the assessment of flooding phenomena and related structural and non-structural measures via the GIS platform, which clearly indicated that different areas require different approaches to flood protection. In addition, the SWOT analysis aimed to classify and place a hierarchical order on the existing status and flood protection infrastructures, since specific infrastructures may benefit one area while disadvantaging another. For example, river channelization assists with water routing (urban environment) but negatively impacts sediment management and transfer (natural environment) [53].
The spatial analysis of flood protection data not only revealed areas with a high concentration of flood protection structures and measures but also pinpointed regions with a high likelihood of flooding, highlighting where additional flood mitigation efforts were needed. By further comparing the locations of these flood protection structures with historical flood occurrences, we identified the most flood-prone areas, assessed the presence or absence of flood protection projects, and evaluated the effectiveness of these measures. This effectiveness was determined by comparing the completion dates of flood protection works with the dates of flooding events in nearby areas. The results showed that the measures were largely effective, as no inundations were reported in areas after the completion of flood protection structures. For instance, in the Kerkinitis River, a tributary of the Strymonas River (marked with a black square labeled A in Figure 1), significant historic flooding occurred before 2011. However, after the implementation of dredging and riverbed deepening works starting in 2016, no further floods have been recorded. Additionally, most existing flood protection projects have proven effective, as historic flooding has mostly occurred in river sections, watercourses, and streams where no flood protection measures have been installed. For example, a major historic flood took place in the Eziovis stream area (black square labeled D in Figure 1) during 2012–2018, but no flood protection structures or measures have been implemented in this area.
However, it is important to note that the presence of numerous large-scale flood protection projects in the Strymonas River basin affects the quality characterization of the water bodies. Human activities like land drainage, flood protection, and water abstraction alter these water bodies, negatively impacting river flows and wildlife migration. These alterations are identified under the WFD, which categorizes water bodies as natural and heavily modified water bodies. In the case study basin, only 69.7% (i.e., 53 out of 76) of river water bodies are considered natural, while 27.6% (i.e., 21 out of 76) are heavily modified, and 2.7%, i.e., 2 water bodies, are artificial [33].
In our case study basin, the SWOT analysis provided a structured framework to evaluate the internal and external factors that can impact the effectiveness of flood protection measures as well as to assist policy makers in developing a comprehensive and realistic plan that addresses both current conditions and future risks [54]. By identifying strengths, weaknesses, opportunities, and threats, SWOT assisted in evaluating what is functioning effectively within the current flood protection system. For instance, water-related environmental protection projects received a score of 3.5 out of 5.0 in both riverine and agricultural environments (Figure 5a and Figure 6a, respectively), which can inform strategic planning and implementation. On the other hand, the recognized weaknesses of changes in land use and non-water-related infrastructure within the river course (Figure 6b) allowed for targeted improvements and resource allocation. The identification of opportunities, such as the strategic change of land uses based on the exposure and vulnerability identified within the regional FRMP (Figure 6d) improves overall resilience and efficiency. Additionally, assessing threats, such as increased environmental costs due to the predicted climate crisis (Figure 7c) provides crucial information that, if not considered, could jeopardize the effectiveness of flood protection efforts [55]. The observed imbalance between strengths and weaknesses, particularly in urban and natural environments (i.e., weaknesses receiving higher scores than strengths), demonstrates that the primary legislative flood framework imposed by the flood directive focuses on basin scales rather than regional urban areas. Therefore, specific efforts at the governance level should be directed towards addressing this issue. In the natural environment, according to the respondents’ perceptions, environmental policies either do not cover all raised issues or are not well implemented. This situation calls for regional and national authorities to better address these shortcomings.
Due to the lack of relevant literature for cross-referencing the research findings in the case study area and thus the inability of applying triangulation methods, i.e., cross-checking with real data or other scholars, for validating the SWOT analysis process, the repeatability of specific questions across all questionnaires was used as an internal quality check process to ensure reliable responses and avoid significant discrepancies [42]. Consistent answers to specific repeated questions, such as the usefulness of mobile flood protection systems in agricultural and urban environments (where these solutions are typically not applicable in agricultural areas), would indicate less accurate responses or may highlight issues with the questionnaire design or respondents’ understanding; however, that was not the case. Similarly, consistent high scoring for the question “Limited flood protection projects’ supervision during construction” (as it was done) would secure reliable responses, given that the current inadequate regulatory frameworks, insufficient funding, and a lack of transparency and accountability within overseeing bodies are a negative national reality.
The SWOT analysis also demonstrated that existing flood protection projects and measures do not uniformly mitigate floods across all environments, with certain actions and measures performing better in specific environments compared to others. More specifically, comparing the strengths across the four different environments revealed a common perception regarding the current situation and the efficiency of protection measures. None of the cases showed high rates of acceptance of existing measures, and the varied grading of criteria led to prioritizing protection measures needed in each area, as illustrated by the GIS spatial analysis of recorded flood related datasets. Regarding the urban environment, for instance, the fact that the existing flood protection infrastructure received low marks, despite decreasing trends in the number and frequency of flood events in the specific case basin [56], highlight stakeholders’ concerns about the adequacy of current infrastructure in climate change conditions. It should be noted that the questionnaire sample was intentionally selected due to the respondents’ backgrounds in the development of large-scale management plans, such as the River Basin Management Plan of Central Macedonia, which is a neighboring basin to the case study basin, and thus their technical expertise in protection measures. However, this sample limitation in terms of covering different domains, such as public administration or local stakeholders, means that opinions and perceptions from these areas were not considered; this issue is acknowledged as a topic for further development.
Additionally, SWOT depicts the most prioritized flood protection measures, such as the mobile flood protection systems, which received a higher score of 3.5 out of 5.0 in the urban environment. Although SWOT analysis helps categorize the proposed questionnaire elements within each designated thematic environment, highlighting those that should be further evaluated based on the highest scores from stakeholders, the research does not proceed with their assessment. However, the detailed investigation of the designated high-scoring elements through specialized mathematical modeling is a proposed ongoing further advancement of the research. Specifically, elements that received high scores in the SWOT analysis, such as “Improvement of flood protection infrastructure” and “Mobile flood protection systems,” should be evaluated using 2D hydraulic models to assess their flood protection capacity in the urban environment for floods of different return periods occurring in the ephemeral streams that cross the city of Serres (the area symbolized by the black square labeled C in Figure 1). Regarding the hydrosystem’s weaknesses, in all cases, weaknesses outweighed the strengths, indicating inadequate flood protection management, with the respondents of the questionnaire believing that projects constructed in the past for different flooding conditions are unable to meet current requirements. The coupling of threats expressed in qualitative terms, such as “T1—Absence of a coordinated Action Plan” and “T3—Undefined responsibilities at administrative level” with the operationality of past and new flood protection measures has not been investigated in detail in the current research and is planned for further development. Similarly, a cost–benefit analysis comparing the construction of new flood infrastructures with the continuous repetition of flood protection works is a limitation that should be addressed in future research advancements.

5. Conclusions

The Floods Directive presumes that flood protection structures are in perfect condition when it comes to implementing FRMPs. However, it often fails to account for their actual state, which can greatly affect their performance. Many flood protection systems might be only partially functional or even completely ineffective due to neglect or deterioration over time. Furthermore, the combined operationality of flood structures and measures is often overlooked, meaning that the failure of one system can impact those downstream, while the role of an upstream or downstream structure may unfortunately not be considered in future flood protection planning. Ignoring the real condition of these infrastructures can lead to inadequate planning and response, potentially resulting in catastrophic failures during floods. Therefore, it is crucial to evaluate the actual condition of these structures and measure and determine the necessary maintenance to ensure they function properly during flood events.
In this research, modern tools and methods, such as GIS technology and SWOT analysis, are proposed as a framework to enhance the integrated management of floods and address issues related to flood protection projects. A key component of this approach is the use of custom-developed questionnaires that capture stakeholders’ and decision makers’ opinions and preferences regarding the future management of hydrosystems. These questionnaires are informed by a comprehensive understanding of the basin, provided through a detailed spatial overview of flood-related elements, including historic floods, flood protection structures, measures, and works. Consequently, the insights gained from this detailed knowledge support holistic strategic planning, leading to the identification of the most preferable, urgent, and cost–benefit solutions. Nevertheless, the frequent updating of floods’ spatiotemporal occurrence repository, unforeseen climate-change-driven changes in the hydrological cycle, and flood protection measures databases are necessary to address the evolving nature of flood risks and infrastructure conditions. Furthermore, identifying the advantages (strengths, opportunities) and disadvantages (weaknesses, threats) of the hydrosystem enhances policy decisions, guiding further investigation into necessary flood protection actions. In our case study, the division of the case study basin in four distinct environments demonstrated that specific measures, such as the mobile flood protection systems, are more favorable for flood protection in a specific domain compared to others. The framework’s applicability to any river basin renders the research an important framework for regional planning, allowing for the evaluation and development of effective flood protection projects.

Author Contributions

Conceptualization, E.T. and C.S.; methodology, E.T.; software, C.S.; validation, E.T. and C.S.; formal analysis, E.T. and C.S.; investigation, E.T. and C.S.; resources, E.T. and C.S.; data curation, E.T. and C.S.; writing—original draft preparation, E.T. and C.S.; writing—review and editing, C.S.; project administration, E.T.; funding acquisition, E.T. All authors have read and agreed to the published version of the manuscript.

Funding

This research was funded by the INTERREG V-A European Territorial Cooperation Program “Greece-Bulgaria 2014-2020 Flood Protection-Cross Border Planning and Infrastructure Measures for Flood Protection”.

Data Availability Statement

All spatial data are available through the web links provided within the paper.

Conflicts of Interest

The authors declare no conflicts of interest.

Appendix A

Table A1. Identified strength and weakness components of the performed SWOT analysis for the urban, riverine, agricultural, and natural environments of the Strymonas River basin.
EnvironmentsStrengths ScoreWeaknessesScore
UrbanS1—Flood protection infrastructure projects 3W1—Aging of protection infrastructure4
S2—Experience in flood management2W2—Change in flood flow due to human activity4
S3—Maintenance of flood protection projects2W3—Change in watercourse natural routing3
S4—Crisis management services2W4—Change of urban land uses4
S5—Existing stormwater networks’ enhancement3W5—Local scale interventions3
S6—Development of early warning systems1W6—Wetland vegetation change1
S7—Water resource management projects3W7—Non-water-related structures affecting water4
S8—Public information actions2W8—Expansion of settlement areas2
S9—Specified uses and activities3W9—Corruption phenomena1
S10—Mobile flood protection systems3.5W10—Periodic floods4
W11—Flash floods4
W12—Environmental hazards affecting water3
W13—Aging of sewage systems3
W14—Lack of permanent/ temporal measures4
W15—Lack of monitoring systems4
W16—Inability of administration to manage floods4
RiverineS1—Flood protection projects/measures2.5W1—Change in river discharge volumes3.5
S2—Water saving projects/dams3W2—Mankind soil morphology changes2.5
S3—Hydronomy: water management projects2W3—Changes in natural watercourse routing4
S4—Water quality improvement projects1.5W4—Changes in land uses3
S5—Wetland-based flood protection projects2W5—Landscape interventions1
S6—Modification of water sources2W6—Wetland vegetation changes4
S7—Recreational activities projects in water bodies2W7—Non-water-related structures affecting water4.5
S8—Water-related environmental protection projects3.5W8—Settlements expansion3
S9—Establishment of water use and protection zones3W9—Erosion phenomena3
S10—Mobile flood protection systems3.5W10—Periodic floods4
W11—Flash floods4.5
W12—Restructuring of agricultural lands1
W13—Environmental hazards affecting water2
W14—Aged protection structures4
W15—Absence of new flood protection constructions4.5
W16—Lack of monitoring systems3.5
W17—Understaffing of administration3.5
AgriculturalS1—Flood protection infrastructure projects1W1—Flood discharges due to lack of projects4.5
S2—Water saving projects/dams2.5W2—Change in soil morphology due to crops2
S3—Hydronomy: water management projects3W3—Change in natural watercourse routing3
S4—Water supply and irrigation projects2.5W4—Change in land uses4.5
S5—Water quality improvement projects2.5W5—Individual projects not falling within the regional planning2.2
S6—Wetland management projects2W6—Change in wetland vegetation2
S7—Water resource management projects2W7—Non-water-related structures affecting water4.5
S8—Recreational activities projects in water bodies2W8—Increased water demands in irrigation period3.3
S9—Water-related environmental protection projects3.5W9—Increase in arable land2.5
S10—Establishment of water use and protection zones3W10—Erosion phenomena2
S11—Specified land uses1W11—Periodic floods4
S12—Mobile flood protection systems1W12—Flash floods4
W13—Restructuring of agricultural lands0.9
W14—Environmental hazards affecting water2.5
W15—Absence of new flood protection constructions3.5
W16—Absence of non-structural protection measures4
W17—Lack of monitoring systems4
W18—Understaffing of administration4
NaturalS1—Administrative flood protection actions2W1—Change in river discharge volumes4
S2—Water saving projects/dams2W2—Mankind soil morphology changes2
S3—Hydronomy: water management projects1.5W3—Changes in natural watercourse routing3
S4—Water supply and irrigation projects2W4—Changes in land uses2
S5—Water quality improvement projects2W5—Repetitive flood protection works at the local scale3
S6—Wetland systems development projects3.5W6—Wetland vegetation changes3
S7—Cross-border cooperation for environmental protection2.5W7—Technical works without environmental criteria4.5
S8—Hydropower projects2.5W8—Pressures on environmentally sensitive areas3.5
S9—Permanent flood protection/environmental protection projects3W9—Increased impacts due to increased phenomena intensity2
S10—Water purification projects2.5W10—Erosion phenomena2.5
S11—Temporary projects for water bodies’ environmental protection 1W11—Restructuring of agricultural lands4.5
S12—Establishment of water use and protection zones2W12—Environmental hazards affecting water3
S13—Specified land uses2W13—Absence of new flood protection constructions3.5
S14—Mobile flood protection systems1W14—Absence of non-structural protection measures4
W15—Lack of monitoring systems2
W16—Understaffing of administration2
Table A2. Identified opportunities and threats of the performed SWOT analysis for the urban, riverine, agricultural, and natural environments of the Strymonas River basin.
EnvironmentsOpportunities ScoreThreatsScore
UrbanO1—Improvement of flood protection infrastructure4.5T1—Absence of a coordinated action plan2
O2—Action plan for flood shielding4T2—Inadequate planning for flood protection4
O3—Assignment of responsibilities to administrative units3T3—Undefined responsibilities at administrative level4
O4— Development of flood protection systems4T4—Citizens’ inability to respond effectively in floods5
O5—Creation of flood monitoring systems2T5—Lack of flood monitoring systems2
O6—Development of civil protection mechanisms4T6—Limited flood protection project supervision during construction2
O7—Land use changes to reduce flood risk3T7—Understaffing of administration4
O8—Staff training in crisis management situations3T8—Non-expert staff in crisis management4
S9—Specified uses and activities4.5T9—Extreme phenomena frequency increase3
S10—Mobile flood protection systems4T10—Extreme phenomena intensity increase4
T11—Absence of public-awareness flood protocols5
T12—Loss of property3
T13—Loss of life/injuries3
RiverineO1—Improvement in flood protection infrastructure3T1—Absence of a coordinated action plan4
O2—Action plan for flood shielding4T2—Inadequate planning for flood protection3
O3—Assignment of responsibilities to administrative units3.5T3—Undefined responsibilities at administrative level4
O4—Cross-border cooperation for flood protection2T4—Insufficient management of water bodies4.5
O5—Reconstruction of important flood protection structures4.5T5—Inability of large technical structures to regulate max flows5
O6—Creation of flood monitoring systems2T6—Absence of water status monitoring system2.5
O7—Development of civil protection mechanisms3T7—Limited flood protection project supervision during construction4
O8—Assessment of flood prone areas4.5T8—Understaffing of services/organizations3
O9—Staff training in crisis management situations2T9—Non-expert staff in crisis management2.5
O10—Prioritization of interventions4T10—Lack of public notification procedures in floods4.5
AgriculturalO1—Improvement in flood protection infrastructure2T1—Absence of a coordinated action plan3
O2—Action plan for flood shielding3.5T2—Limited rational planning for flood protection4
O3—Informing the farmers1T3—Undefined responsibilities at administrative level3.5
O4—Cross-border cooperation for flood protection4T4—Limited technical protection equipment2.5
O6—Creation of flood monitoring systems2T5—Absence of a system for recording existing water status2
O7—Development of civil protection mechanisms3T6—Limited flood protection project supervision during construction4.5
O8—Change in land uses based on FRMP4.5T7—Degradation of regional agricultural economy3
O9—Restructuring of crop cultivation4.5T8—Change to more climate-resistant crops2
T9—Loss of income and products4.5
T10—Expensive use of temporary measures2
T11—Continuous degradation of rural areas due to floods3.5
NaturalO1—Improvement in environmental protection works4T1—Absence of a coordinated action plan2.5
O2—Action plan for flood shielding4.5T2—Limited rational planning for flood protection3
O3—Development of protection systems with environmental criteria5T3—Degradation of environmental services4
O4—Cross-border cooperation for flood protection4T4—Impacts on the anthropogenic environment2.5
O5—Creation of flood monitoring system3.5T5—Harm on the regional economy4
O6—Development of civil protection mechanisms4T6—Harm on the natural environment5
O7—Change in land uses based on FRMP3.5T7—Limited project supervision during construction in environmentally sensitive areas4
O8—Staff training in crisis management situations3T8—Non-expert staff in crisis management3
T9—Increased environmental costs due to climate crisis4.5

References

  1. Raadgever, G.T.; Booister, N.; Steenstra, M.K. The Relevance of Flood Risk Management and Governance. In Flood Risk Management Strategies and Governance; Springer International Publishing: Cham, Switzerland, 2018; pp. 85–92. [Google Scholar]
  2. Glasgow, H.B.; Burkholder, J.M.; Reed, R.E.; Lewitus, A.J.; Kleinman, J.E. Real-time remote monitoring of water quality: A review of current applications, and advancements in sensor, telemetry, and computing technologies. J. Exp. Mar. Biol. Ecol. 2004, 300, 409–448. [Google Scholar] [CrossRef]
  3. Skoulikaris, C.; Ganoulis, J.; Aureli, A. A critical review of the transboundary aquifers in South-Eastern Europe and new insights from the EU’s water framework directive implementation process. Water Int. 2021, 46, 1060–1086. [Google Scholar] [CrossRef]
  4. European Commission. Common implementation strategy for the water framework directive (2000/60/EC). In Guidance Document No. 7—Monitoring under the Water Framework Directive; Office for Official Publications of the Europe: Luxembourg, 2003. [Google Scholar]
  5. Kundzewicz, Z.W.; Pińskwar, I.; Brakenridge, G.R. Changes in River Flood Hazard in Europe: A Review. Hydrol. Res. 2018, 49, 294–302. [Google Scholar] [CrossRef]
  6. Nones, M. Implementation of the floods directive in selected EU member states. Water Environ. J. 2015, 29, 412–418. [Google Scholar] [CrossRef]
  7. Chimene, C.A.; Campos, J.N.B. The Design Flood under Two Approaches: Synthetic Storm Hyetograph and Observed Storm Hyetograph. J. Appl. Water Eng. Res. 2020, 8, 171–182. [Google Scholar] [CrossRef]
  8. Papaioannou, G.; Efstratiadis, A.; Vasiliades, L.; Loukas, A.; Papalexiou, S.M.; Koukouvinos, A.; Tsoukalas, I.; Kossieris, P. An Operational Method for Flood Directive Implementation in Ungauged Urban Areas. Hydrology 2018, 5, 24. [Google Scholar] [CrossRef]
  9. Reil, A.; Skoulikaris, C.; Alexandridis, T.K.; Roub, R. Evaluation of riverbed representation methods for one-dimensional flood hydraulics model. J. Flood Risk Manag. 2018, 11, 169–179. [Google Scholar] [CrossRef]
  10. Teng, J.; Jakeman, A.J.; Vaze, J.; Croke, B.F.W.; Dutta, D.; Kim, S. Flood Inundation Modelling: A Review of Methods, Recent Advances and Uncertainty Analysis. Environ. Model. Softw. 2017, 90, 201–216. [Google Scholar] [CrossRef]
  11. Alfieri, L.; Salamon, P.; Bianchi, A.; Neal, J.; Bates, P.; Feyen, L. Advances in pan-European flood hazard mapping. Hydrol. Process 2014, 28, 4067–4077. [Google Scholar] [CrossRef]
  12. Aronica, G.T.; Franza, F.; Bates, P.D.; Neal, J.C. Probabilistic evaluation of flood hazard in urban areas using monte carlo simulation. Hydrol. Process. 2012, 26, 3962–3972. [Google Scholar] [CrossRef]
  13. Hunter, N.M.; Bates, P.D.; Horritt, M.S.; Wilson, M.D. Simple spatially-distributed models for predicting flood inundation: A review. Geomorphology 2007, 90, 208–225. [Google Scholar] [CrossRef]
  14. Singh, P.; Gupta, A.; Singh, M. Hydrological inferences from watershed analysis for water resource management using remote sensing and GIS techniques. Egypt. J. Remote Sens. Space Sci. 2014, 17, 111–121. [Google Scholar] [CrossRef]
  15. Qi, H.; Qi, P.; Altinakar, M.S. GIS-Based Spatial Monte Carlo Analysis for Integrated Flood Management with Two Dimensional Flood Simulation. Water Resour. Manag. 2013, 27, 3631–3645. [Google Scholar] [CrossRef]
  16. Van Der Knijff, J.M.; Younis, J.; De Roo, A.P.J. LISFLOOD: A GIS-based distributed model for river basin scale water balance and flood simulation. Int. J. Geogr. Inf. Sci. 2010, 24, 189–212. [Google Scholar] [CrossRef]
  17. McKinney, D.C.; Cai, X. Linking GIS and water resources management models: An object-oriented method. Environ. Model. Softw. 2002, 17, 413–425. [Google Scholar] [CrossRef]
  18. Tsihrintzis, V.A.; Hamid, R.; Fuentes, H.R. Use of geographic information systems (GIS) in water resources: A review. Water Resour. Manag. 1996, 10, 251–277. [Google Scholar] [CrossRef]
  19. Kourgialas, N.N.; Karatzas, G.P. Flood management and a GIS modelling method to assess flood-hazard areas—A case study. Hydrol. Sci. 2011, 56, 212–225. [Google Scholar] [CrossRef]
  20. Shaban, A.; Khawlie, M.; Abdallah, C. Use of remote sensing and GIS to determine recharge potential zones: The case of Occidental Lebanon. Hydrogeol. J. 2006, 14, 433–443. [Google Scholar] [CrossRef]
  21. Gemitzi, A.; Petalas, C.; Tsihrintzis, V.A.; Pisinaras, V. Assessment of Groundwater Vulnerability to Pollution: A Combination of GIS, Fuzzy Logic and Decision Making Techniques. Environ. Geol. 2006, 49, 653–673. [Google Scholar] [CrossRef]
  22. Samela, C.; Albano, R.; Sole, A.; Manfreda, S. A GIS Tool for Cost-Effective Delineation of Flood-Prone Areas. Comput. Environ. Urban Syst. 2018, 70, 43–52. [Google Scholar] [CrossRef]
  23. Ogato, G.S.; Bantider, A.; Abebe, K.; Geneletti, D. Geographic Information System (GIS)-Based Multicriteria Analysis of Flooding Hazard and Risk in Ambo Town and Its Watershed, West Shoa Zone, Oromia Regional State, Ethiopia. J. Hydrol. Reg. Stud. 2020, 27, 100659. [Google Scholar] [CrossRef]
  24. Tzanou, E.; Skoulikaris, C.; Chatzigiannis, A. Result-Based Management Tool for the Assessment of Existing Structural Flood Protection and Future Planning; Case Study in the Strymon River Basin, Greece. Environ. Sci. Proc. 2023, 25, 17. [Google Scholar] [CrossRef]
  25. Ghazinoory, S.; Abdi, M.; Azadegan-Mehr, M. SWOT methodology: A state-of-the-art review for the past, a framework for the future. J. Bus. Econ. Manag. 2011, 12, 24–48. [Google Scholar] [CrossRef]
  26. Lazaridou, D.; Michailidis, A.; Trigkas, M.; Stefanidis, P. Exploring irrigation water issue through quantitative SWOT Analysis: The case of Nestos river basin. In Economic and Financial Challenges for Eastern Europe; Sykianakis, N., Polychronidou, P., Karasavvoglou, A., Eds.; Springer: Cham, Switzerland, 2019; pp. 445–460. [Google Scholar]
  27. Nagara, G.; Lam, W.-H.; Lee, N.C.H.; Othman, F.; Shaaban, G. Comparative SWOT Analysis for Water Solutions in Asia and Africa. Water Resour. Manag. 2015, 29, 125–138. [Google Scholar] [CrossRef]
  28. Skias, S.; Pliakas, F.; Kallioras, A. Application of SWOT analysis for the management of transboundary river Evros (Bulgaria, Greece, Turkey). Int. J. Water 2013, 7, 104–121. [Google Scholar] [CrossRef]
  29. Mylopoulos, Y.; Kolokytha, E.; Kampragou, E.; Vagiona, D. A combined methodology for transboundary river basin management in Europe. Application in the Nestos-Mesta catchment area. Water Resour. Manag. 2008, 22, 1101–1112. [Google Scholar] [CrossRef]
  30. Supriyasilp, T.; Pongput, K.; Boonyanupong, S.; Suwanlertcharoen, T. Enhanced Water Management for Muang Fai Irrigation Systems through Remote Sensing and SWOT Analysis. Water Resour. Manag. 2021, 35, 263–277. [Google Scholar] [CrossRef]
  31. Goli, I.; Azadi, H.; Nooripoor, M.; Baig, M.; Viira, A.; Ajtai, I.; Ozgueven, A. Evaluating the Productivity of Paddy Water Resources through SWOT Analysis: The Case of Northern Iran. Water 2021, 13, 2964. [Google Scholar] [CrossRef]
  32. Sibtain, M.; Li, X.; Bashir, H.; Azam, M.I. Hydropower exploitation for Pakistan’s sustainable development: A SWOT analysis considering current situation, challenges, and prospects. Energy Strategy Rev. 2021, 38, 100728. [Google Scholar] [CrossRef]
  33. Skoulikaris, C. Transboundary Cooperation Through Water Related EU Directives’ Implementation Process. The Case of Shared Waters Between Bulgaria and Greece. Water Resour Manag. 2021, 35, 4977–4993. [Google Scholar] [CrossRef]
  34. Ovakoglou, G.; Alexandridis, T.K.; Crisman, T.L.; Skoulikaris, C.; Vergos, G.S. Use of MODIS satellite images for detailed lake morphometry: Application to basins with large water level fluctuations. Int. J. Appl. Earth Obs. Geoinf. 2016, 51, 37–46. [Google Scholar] [CrossRef]
  35. Alexandridis, T.K.; Lazaridou, E.; Tsirika, A.; Zalidis, G.C. Using Earth Observation to Update a Natura 2000 Habitat Map for a Wetland in Greece. J. Environ. Manag. 2009, 90, 2243–2251. [Google Scholar] [CrossRef]
  36. Hellenic Ministry of Environment and Energy. Flood Risk Management Plan of River Basin District of Eastern Macedonia, Greece. 2018. Available online: https://cdr.eionet.europa.eu/gr/eu/frmp/el11/doc/envw9bc5a/FRMP_EL11.pdf (accessed on 29 July 2024). (In Greek).
  37. Capolongo, D.; Refice, A.; Bocchiola, D.; D’Addabbo, A.; Vouvalidis, K.; Soncini, A.; Zingaro, M.; Bovenga, F.; Stamatopoulos, L. Coupling Multitemporal Remote Sensing with Geomorphology and Hydrological Modeling for Post Flood Recovery in the Strymonas Dammed River Basin (Greece). Sci. Total Environ. 2019, 651, 1958–1968. [Google Scholar] [CrossRef] [PubMed]
  38. Rossetto, R.; De Filippis, G.; Borsi, I.; Foglia, L.; Cannata, M.; Criollo, R.; Vázquez-Suñé, E. Integrating free and open source tools and distributed modelling codes in GIS environment for data-based groundwater management. Environ. Model. Softw. 2018, 107, 210–230. [Google Scholar] [CrossRef]
  39. Bhatt, G.; Kumar, M.; Duffy, C.J. A tightly coupled GIS and distributed hydrologic modeling framework. Environ. Model. Softw. 2014, 62, 70–84. [Google Scholar] [CrossRef]
  40. Directive 2012/18/EU of the European Parliament and of the Council of 4 July 2012 on the Control of Major-Accident Hazards Involving Dangerous Substances. July 2012. Available online: https://eur-lex.europa.eu/legal-content/EN/TXT/?uri=celex%3A32012L0018 (accessed on 24 February 2024).
  41. Katirtzidou, M.; Skoulikaris, C.; Makris, C.; Baltikas, V.; Latinopoulos, D.; Krestenitis, Y. Modeling Stakeholders’ Perceptions in Participatory Multi-risk Assessment on a Deltaic Environment Under Climate Change Conditions. Environ. Model. Assess. 2023, 28, 367–388. [Google Scholar] [CrossRef]
  42. Beierle, T.C.; Konisky, D.M. Values, conflict, and trust in participatory environmental planning. J. Policy Anal. Manag. 2000, 19, 587–602. [Google Scholar] [CrossRef]
  43. Psilovikos, A.; Margoni, S. An empirical model of sediment deposition processes in Lake Kerkini, Central Macedonia Greece. Environ. Monit. Assess. 2010, 164, 573–592. [Google Scholar] [CrossRef] [PubMed]
  44. Hellenic Ministry of Environment and Energy. 1st Revision of the Preliminary Flood Risk Assessment and Areas of Potential Significant Flood Risk. 2019. Available online: https://cdr.eionet.europa.eu/gr/eu/floods2019/pfra_2019/documents/national/envx7ufyg/PFRA_REVISION_REPORT_vf.pdf (accessed on 27 May 2024). (In Greek).
  45. Skoulikaris, C. Toponyms: A neglected asset within the water framework and flood directives implementation process; the case study of Greece. Acta Geophys. 2023, 71, 1801–1815. [Google Scholar] [CrossRef]
  46. Theofanous, N.; Myronidis, D. A streamflow hydrograph analysis and simulation for a study case watershed. Int. J. Sustain. Agric. Manag. Inform. 2020, 6, 94–105. [Google Scholar] [CrossRef]
  47. Bhuiyan, H.A.K.M.; McNairn, H.; Powers, J.; Merzouki, A. Application of HEC-HMS in a Cold Region Watershed and Use of RADARSAT-2 Soil Moisture in Initializing the Model. Hydrology 2017, 4, 9. [Google Scholar] [CrossRef]
  48. Kulkarni, A.; Mohanty, J.; Eldho, T.; Rao, E.; Mohan, B. A web GIS based integrated flood assessment modeling tool for coastal urban watersheds. Comput. Geosci. 2014, 64, 7–14. [Google Scholar] [CrossRef]
  49. Ghorbani, M.K.; Hamidifar, H.; Skoulikaris, C.; Michael, N. Concept-Based Integration of Project Management and Strategic Management of Rubber Dam Projects Using the SWOT–AHP Method. Sustainability 2022, 14, 2541. [Google Scholar] [CrossRef]
  50. Long, Y.; Li, Y.; Lei, X.; Hou, Y.; Guo, S.; Sun, J. A Study on Comprehensive Evaluation Methods for Coordinated Development of Water Diversion Projects Based on Advanced SWOT Analysis and Coupling Coordination Model. Sustainability 2021, 13, 13600. [Google Scholar] [CrossRef]
  51. Srinivas, R.; Singh, A.P.; Dhadse, K.; Garg, C.; Deshmukh, A. Sustainable management of a river basin by integrating an improved fuzzy based hybridized SWOT model and geo-statistical weighted thematic overlay analysis. J. Hydrol. 2018, 563, 92–105. [Google Scholar] [CrossRef]
  52. Miles, V.; Esau, I.; Pettersson, L. Using web GIS to promote stakeholder understanding of scientific results in sustainable urban development: A case study in Bergen, Norway. Sustain. Dev. 2024, 32, 2517–2529. [Google Scholar] [CrossRef]
  53. Kaffas, K.; Pisaturo, G.R.; Premstaller, G.; Hrissanthou, V.; Penna, D.; Righetti, M. Event-based soil erosion and sediment yield modelling for calculating long-term reservoir sedimentation in the Alps. Hydrol. Sci. J. 2024, 69, 321–336. [Google Scholar] [CrossRef]
  54. Thaler, T.; Nordbeck, R.; Seher, W. Cooperation in flood risk management: Understanding the role of strategic planning in two Austrian policy instruments. J. Environ. Sci. Policy 2020, 114, 170–177. [Google Scholar] [CrossRef]
  55. Cea, L.; Costabile, P. Flood Risk in Urban Areas: Modelling, Management and Adaptation to Climate Change. A Review. Hydrology 2022, 9, 50. [Google Scholar] [CrossRef]
  56. Tolika, K.; Skoulikaris, C. Atmospheric circulation types and floods’ occurrence; A thorough analysis over Greece. Sci. Total Environ. 2023, 865, 161217. [Google Scholar] [CrossRef]
Figure 1. Illustration of Strymonas River basin and its hydrographic network overlayed by the location of historic floods (red pins), flood protection structures and measures (green triangles), and flood protection works (brown circles). Indication of areas (black squares with numbering) with significant flood potentiality and linkage with flood protection actions.
Hydrology 11 00136 g001
Figure 2. Identified flood protection structures and measures in the Strymonas River basin.
Hydrology 11 00136 g002
Figure 3. Pie charts demonstrating the flood protection works in the case study basin in (a) distinct cases and (b) including the works’ repetition during the last years.
Hydrology 11 00136 g003
Figure 4. Spider charts of SWOT analysis results for the urban environment ((a): strengths, (b): weaknesses, (c): opportunities and (d): threats).
Hydrology 11 00136 g004
Figure 5. SWOT analysis ((a): strengths, (b): weaknesses, (c): opportunities and (d): threats) results for the riparian environment.
Hydrology 11 00136 g005
Figure 6. Agriculture environment and results of the implemented SWOT analysis ((a): strengths, (b): weaknesses, (c): opportunities and (d): threats).
Hydrology 11 00136 g006
Figure 7. Spider charts of SWOT analysis results for the natural environment ((a): strengths, (b): weaknesses, (c): opportunities and (d): threats).
Hydrology 11 00136 g007
Table 1. Hydrological characteristics of the Strymonas River basin.
River BasinRiparian CountriesArea (km2)Country’s Share (%)Mean Elevation (m)River Length (km)Annual Rainfall (mm)Annual Discharges (×106 m3)
Struma/StrymonasBulgaria854548.99002909002160
Greece728241.74301106751514
North Macedonia16489.48638168850.1
Table 2. Clusters of spatial data used for the population of the geo-referenced system.
NoDataset NameDescriptionSource
1Hydrological characteristicsContains information related to the basin’s boundaries, the surface water bodies network, the sub-catchments, and the monitoring stations.Ministry Portal of the WFD implementation process in Greece 1
2Land uses and environmentally protected areasCORINE land uses and Natura 2000 Special Areas of Conservation (SACs) and Special Protection Areas (SPAs).CORINE Land Cover inventory 2; Natura 2000 Network and protected areas 3
3Settlements, critical infrastructures and SEVESOContains the basin’s settlements, infrastructures of particular importance (e.g., hospitals, schools, administration buildings, roads, etc.), and industries subject to the SEVESO Directive of the EU [40].Open geospatial data and services for Greece 4
4Flood hazard maps and historical floodsIncludes flood boundaries for different return periods and historical flood events until the year 2018.Ministry Portal of the FD implementation in Greece 5
5Flood protection structures and measuresShapefiles indicating the location and the descriptive characteristics of the flood protection structures (e.g., dams, bridges, levees, berms, etc.) and measures (e.g., low water crossing projects)Survey in public administration’s records
6Flood protection worksLocation and descriptive characteristics of flood protection works (e.g., work type, cost, implementation date)Survey in public administration’s records
Table 3. Number of flood protection questions per questionnaire and per SWOT analysis.
Urban Env.Riparian Env.Agricultural Env.Natural Env.Total
Strengths1010121446
Weaknesses1617181566
Opportunities1310110943
Threats81090835
Table 4. Recorded flood events in the case study basin for the period of 1950–2018.
Time PeriodHistoric FloodsSignificant FloodsSignificant over Total Floods
1950–2011 691014%
2012–2018321959%
Total1012929%
Disclaimer/Publisher’s Note: The statements, opinions and data contained in all publications are solely those of the individual author(s) and contributor(s) and not of MDPI and/or the editor(s). MDPI and/or the editor(s) disclaim responsibility for any injury to people or property resulting from any ideas, methods, instructions or products referred to in the content.

