Abstract
Given the widespread presence of non-native vegetation in urban and Mediterranean watersheds, it is important to evaluate how these sensitive ecosystems will respond to activities to manage and restore native vegetation conditions. This research focuses on Del Cerro, a tributary of the San Diego River in California, where non-native vegetation dominates the riparian zone, creating flooding and fire hazards. Field data were collected in 2018 to 2021 and consisted of water depth, streamflow, and stream temperature. Our data set also captured baseline conditions in the floodplain before and after the removal of burned non-native vegetation in November 2020. Observed changes in hydrologic and geomorphic conditions were used to parameterize and calibrate a two-dimensional hydraulic model to simulate urban floodplain hydraulics after vegetation removal. We utilized the U.S. Army Corps of Engineers’ Hydrologic Engineering Center River Assessment System (HEC-RAS) model to simulate the influence of canopy loss and vegetation disturbance and to assess the impacts of vegetation removal on stream restoration. We simulated streamflow, water depth, and flood extent for two scenarios: (1) 2019; pre-restoration where non-native vegetation dominated the riparian area, and (2) 2021; post-restoration following the removal of non-native vegetation and canopy. Flooding after restoration in 2021 was more frequent compared to 2019. We also observed similar flood extents and peak streamflow for storm events that accumulated half the amount of precipitation as pre-restoration conditions. Our results provide insight into the responses of small urban stream reaches to the removal of invasive vegetation and canopy cover.
Keywords:
urban streams; vegetation restoration; HEC-RAS; canopy loss; invasive vegetation; riparian 1. Introduction
Globally, Mediterranean climates are floral biodiversity hot spots [1,2] and are challenged by urbanization and climate change [2,3]. These waterways are sensitive to changes in ambient air temperature, which can contribute to undesirable stream and habitat conditions [4,5,6,7] for flora and fauna [8]. However, changes in vegetation biomass and canopy, either by the introduction of non-native vegetation species or abrupt removal of vegetation, can also impact low flow and shallow streams found in Mediterranean systems [9]. Impermeable surfaces such as roads and sidewalks are associated with excess runoff generation (“urban drool”), increasing dry weather baseflows and leading to challenges for sustainable channel and ecosystem maintenance [10]. Changes in streamflow regimes and nutrient availability can also propagate or contribute to altered native riparian vegetation density and community structure, encouraging infestations or the rapid settlement of opportunistic and alien vegetation species [10,11].
Interaction with waterways in urban areas are a result of accessibility, leading to opportunities for non-native vegetation growth, fire ignition, and water quality risks associated with anthropogenic activities [12,13,14]. The high-density growth created by invasive plant infestations and anthropogenic debris can alter riverine hydrology and geomorphology [15,16,17]. For example, the high tensile strength and dense root structure of invasive giant reed can induce bank instability and subsequently bank collapse during severe floods [18,19]. Infestation of invasive vegetation throughout the stream and river systems of coastal California may also facilitate an invasive grass-fire feedback regime within the urban environment [10], where post-fire conditions provide an optimal environment for non-native vegetation to thrive and in turn, enhances fuel loads and increases the propensity towards fire [15]. Additionally, Mathews and Kinoshita [10] observed that the number of urban fires in the riparian environment are increasing in southern California, partly attributed to non-native vegetation regimes. While climate plays an important role in the increase in fire frequency and durations, pressures from expansive urbanization, heavy recreational usage, and activities of unsheltered individuals can contribute to urban fire ignition and exacerbate the grass-fire cycle [14,20]. For example, the Los Angeles Fire Department observed that the number of fires related to unsheltered individuals have nearly tripled since 2018 [20]. The negative consequences associated with non-native vegetation motivates restoration activities and the removal of dense, non-native vegetation, such as Arundo donax, in these areas.
Arundo donax, also known as Giant Reed, is a non-native species that is classified as an emergent aquatic plant [21,22] and has been designated as a high priority for eradication by the California Invasive Plant Council. While it was originally introduced to California for erosion control and building materials [23,24], Arundo donax is now ubiquitous across major coastal watersheds in southern California [15]. Arundo donax is of concern for many reasons. It is a rapid resprouter that can outcompete native vegetation species, contributes to significant above-ground biomass that increases fuel loads for fire [25,26,27], has a shallow rhizome network that contributes to geomorphic instability [10,18], and uses three times more water resources than native species, potentially leading to riparian aridification [19,28].
Vegetation restoration is utilized to improve stream health and functionality, and includes removal, maintenance, and revegetation techniques [29,30]. As management activities to mitigate non-native vegetation and its impacts on urban and coastal waterways become more frequent, there is a need to understand the corresponding short- and long-term impacts on hydrologic and hydraulic processes. There are limited studies that document the hydrologic and hydraulic changes following vegetation restoration of urban Mediterranean streams. While studies note that riparian vegetation has the capability to alter fundamental processes that control surface and subsurface streamflow on a local scale, studies toward understanding the role riparian vegetation on water quality [31] and the dynamic changes and impacts over time [32] are needed.
Field observations, data, and modeling tools are required to guide sustainable watershed management given projected climate change and disturbances in urban waterways and landscapes. This study utilized hydrologic field data after a small fire and removal of non-native and burned vegetation within an urban Mediterranean creek in San Diego, California to parameterize an unsteady flow model to simulate the hydrologic and hydraulic responses. We modeled two vegetation conditions to understand the impacts of vegetation biomass and canopy loss on streamflow, water depth, and flood extent, which has implications for stream restoration activities in urban Mediterranean streams.
2. Materials and Methods
2.1. Study Area
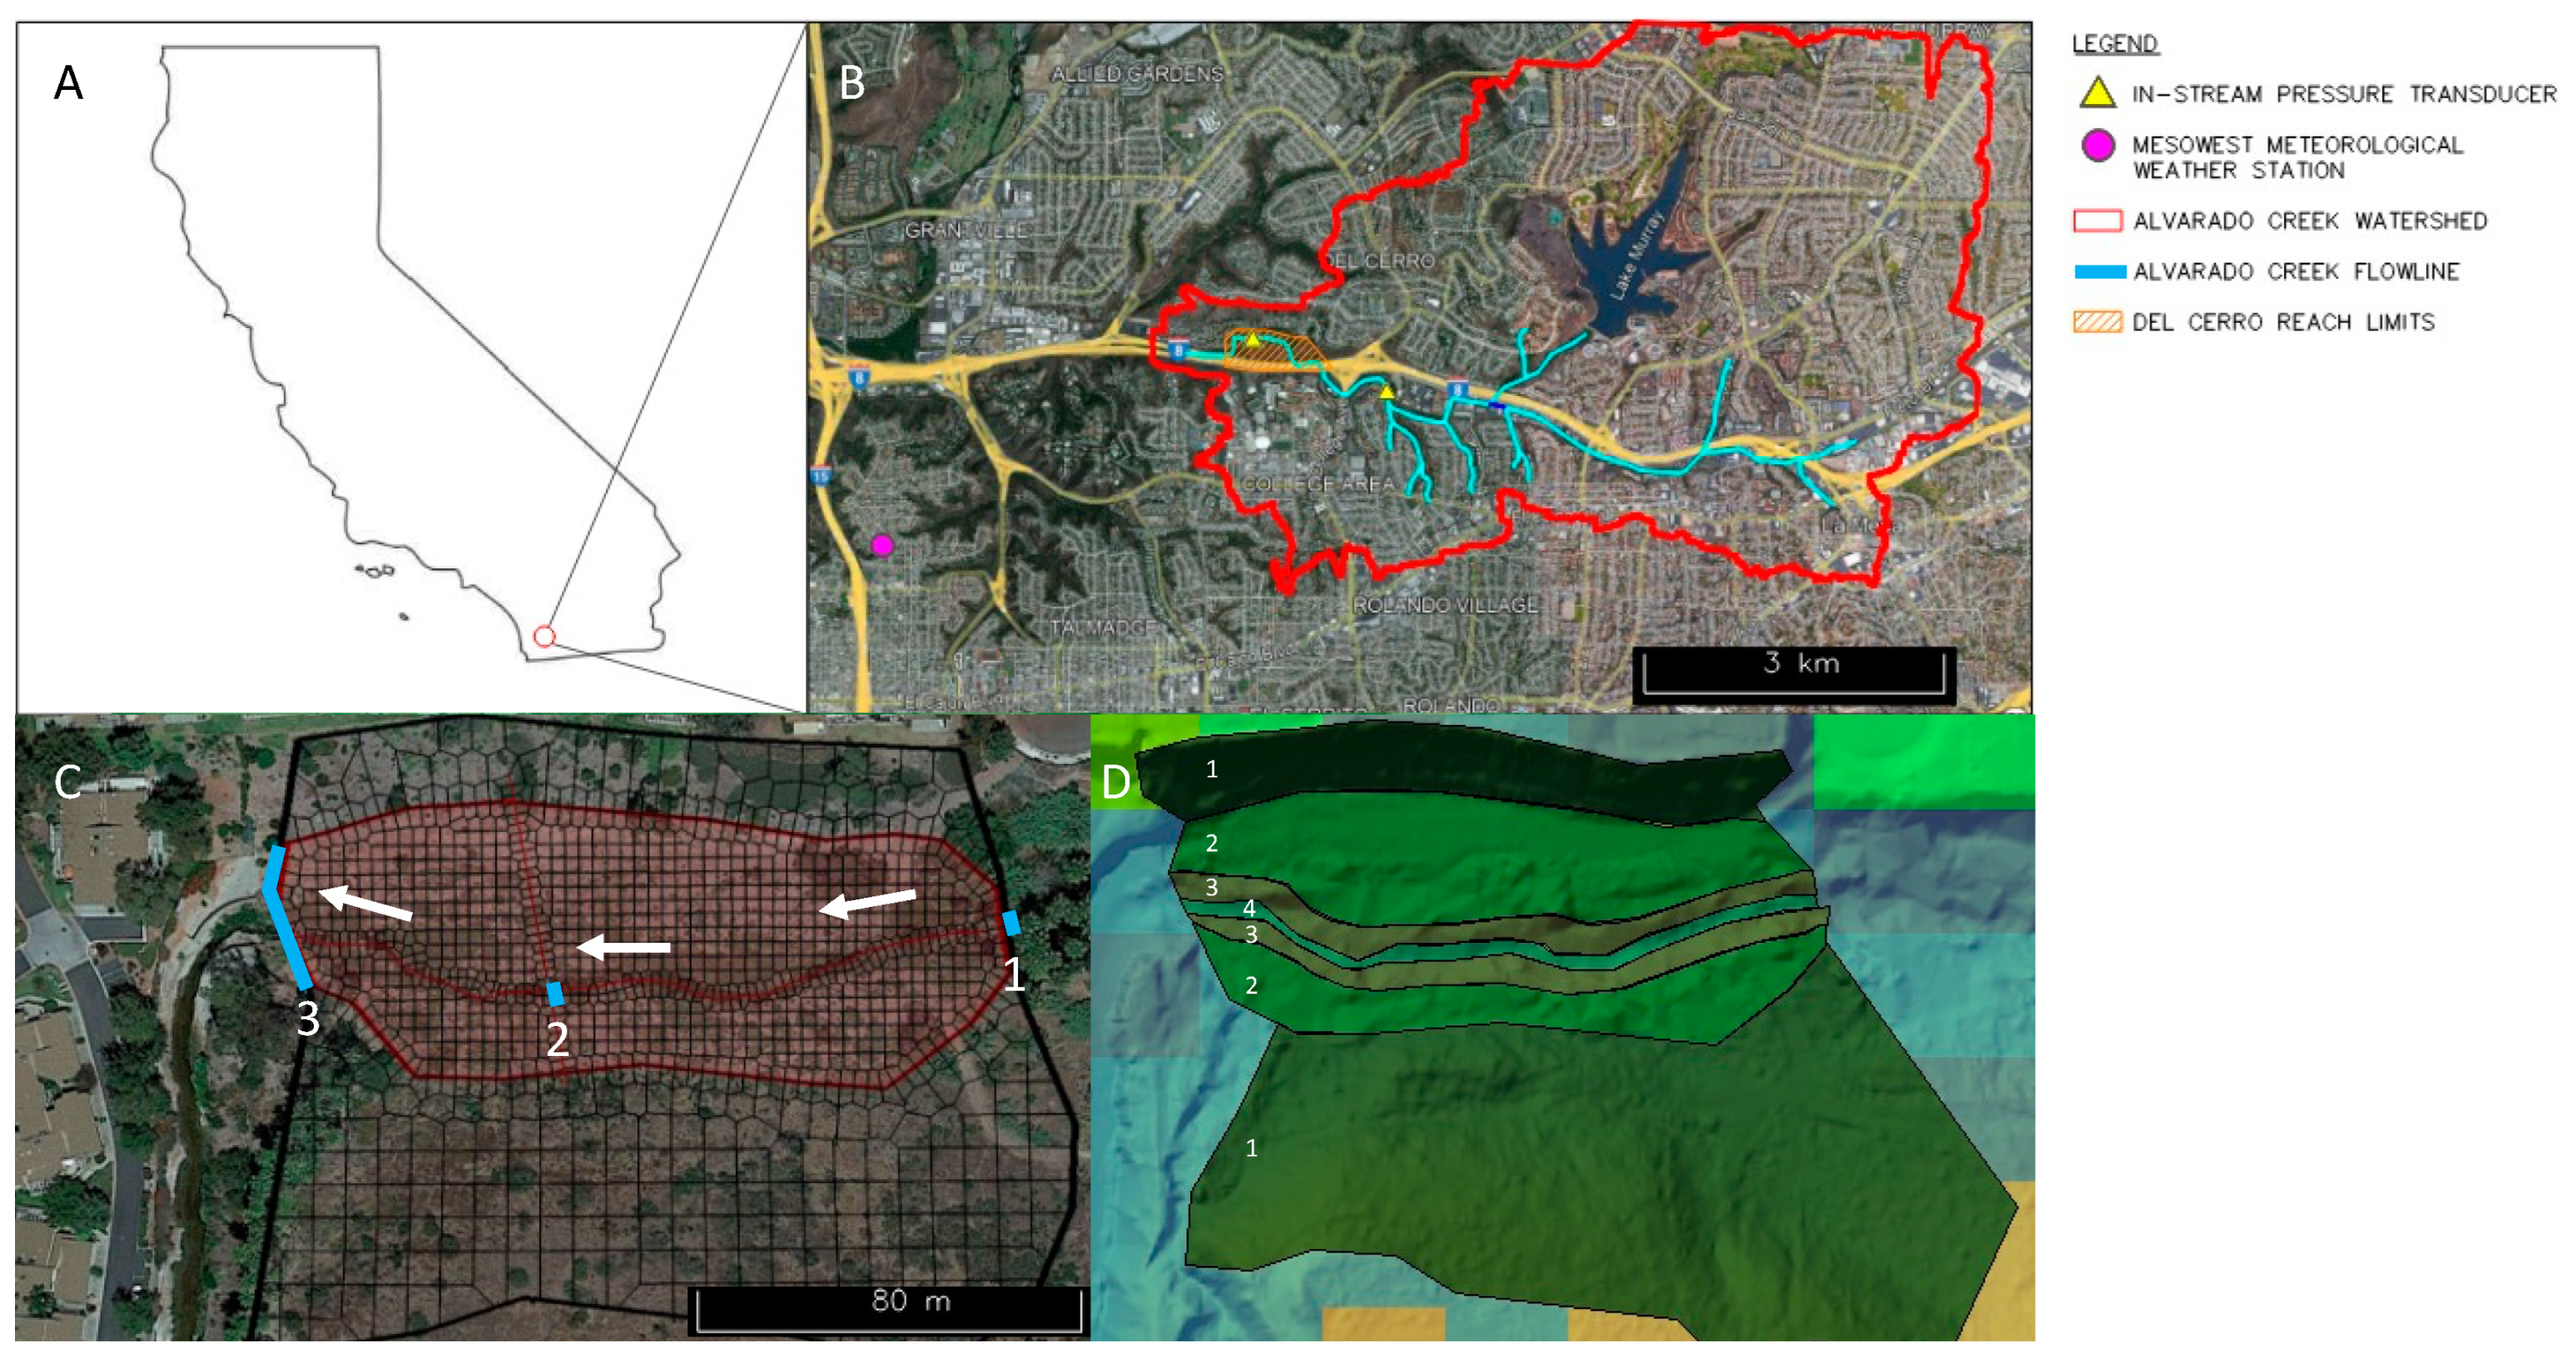
Alvarado Creek is a tributary of the San Diego River in California, United States (Figure 1). It is an urban channelized stream that has substantial non-native vegetation that contributes to frequent flooding and fuel for brush fires. Along the creek, the vegetation consists of a variety of native and non-native species including Salix lasiolepis, Artemisia californica, and Platanus racemosa, commonly known as willow trees, sagebrush and sycamore trees, respectively; as well as Arundo donax and Washingtonia filifera, commonly known as giant reeds and palm trees, respectively [33]. This work focused on the Del Cerro reach of Alvarado Creek, which has experienced fire and restoration efforts (Figure 1C). In June 2018, the human ignited Del Cerro Fire damaged approximately 38 acres within the Alvarado Creek watershed. Restoration efforts in Fall 2020 removed burned and non-native vegetation species to mitigate fire potential and encourage the regrowth of native vegetation. Invasive vegetation was removed within the riparian zone and the adjacent floodplain throughout the Del Cerro study reach (Figure 1D). Although this reach represents approximately 0.03% of the entire Alvarado Creek watershed, hydraulic modeling was focused entirely in this affected area, which allowed us to study the impacts of the management efforts, which is valuable for future management activities. The climate is Mediterranean, where precipitation generally occurs between October and April and the summer months are warm and dry. The annual average precipitation near the coast is approximately 25 cm and the high-intensity, peak storm events in this semiarid region can result in extensive short-term urban flooding [34,35].

Figure 1.
(A) Alvarado Creek is located in San Diego, California. (B) Data collection and modeling are concentrated in the Del Cerro reach within the Alvarado Creek watershed. The location of the in-stream pressure transducer and Mesowest meteorological station DW3640 are denoted by a yellow triangle and magenta circle, respectively. (C) A computational mesh for the Del Cerro reach was defined in HEC-RAS 2D. The refinement region is shaded in red, and three boundary condition lines (external inflow (1), an internal boundary condition (2), and outflow (3)) are denoted in blue. The white arrows indicate the direction of flow. (D) HEC-RAS 2D calibration regions (1 is hillside, 2 is floodplain, 3 is riparian zone, and 4 is the channel or open water).
2.2. Precipitation and Stream Reach Data
Event-based precipitation and air temperature were gathered from the Mesowest weather station DW3640 [36], which is located approximately 3 km west of the Del Cerro reach of Alvarado Creek (Figure 1B; magenta circle). We considered 24 h storms with a total rainfall of at least 12.7 mm for modeling. Six storms were selected, three in 2019 (pre-vegetation restoration) and three in 2021 (post-vegetation restoration). These storms were analyzed for a 24 h period and the maximum rainfall intensities were aggregated to 60 min intervals (Max I-60). The recurrence interval for each storm was determined from the National Oceanic and Atmospheric Association Atlas (NOAA) ATLAS 14-point precipitation frequency [37] to estimate the probability of occurrence for the associated storm magnitude.
Water pressure and temperature were recorded every 10 min using an in-stream pressure transducer (Figure 1B; yellow triangle). Water depth was estimated by subtracting the air pressure from the water pressure and streamflow was derived from a rating curve developed from water depth and streamflow measured in the field (Equation (1)). Data are available from October 2018 to present; however, some data gaps exist. This study utilized data from 2019 and 2021 to assess pre- and post-vegetation restoration conditions after fire.
where D and Q represent water depth (m) and flow rate (m3/s), respectively.
Q = (D + 22.625)/22.81
2.3. Hydrologic Engineering Center’s River Analysis System
We utilized the United States Army Corps of Engineers’ Hydrologic Engineering Center’s River Analysis System (HEC-RAS) to model streamflow, water depth, and flood extent. The HEC-RAS model was parameterized to simulate the impacts of vegetation removal and canopy loss for six storms that occurred in Alvarado Creek during 2019 and 2021.
2.3.1. Parameterization
A two-dimensional (2D) unsteady flow model was developed for Alvarado Creek to simulate multidirectional flow across floodplains and the fluctuation of streamflow during a precipitation event. The unsteady flow simulated fluctuating velocity, depth and discharge. Storm hydrographs at each boundary location were used to calibrate to observed stage heights. Hydrologic and hydraulic parameters were incorporated into the model to represent the Del Cerro reach of Alvarado Creek (Table 1). A 1 m digital elevation map (DEM) was used to represent the topography [38]. Water depth and streamflow based on field measurements were used in the 2D model simulations for the six selected storm events. Streamflow hydrographs were input directly into the model to provide boundary conditions.
The 2D unsteady flow area in HEC-RAS was delineated for the study area (Figure 1C) using RASmapper. The 7 m spatial resolution 2D flow area simulated the effective stormflow that passes through our study reach for each modeled storm event. The final computational mesh was made up of 1378 cells that individually calculated the stream hydraulics for each simulated storm duration (Figure 1C). Within this 2D flow area, a refinement region (Figure 1C; shaded red polygon), or an interior polygon was created to produce a higher definition 2D area using 3 m resolution for the flow area of interest. Breaklines are polylines that enforce cells along a characteristic feature and guide water movement within a 2D flow area. A breakline was created along the centerline of the channel to obtain higher resolution information of the modeled storm events. Boundary conditions can be internal or external and are used to bring flow in or out of the 2D model. Three boundary conditions were used in this study, an external upstream boundary condition (Figure 1C (1)), an internal flow hydrograph aligned with the Del Cerro in-stream pressure transducer (Figure 1C (2)), and an external downstream boundary condition that represented the normal depth friction slope (Figure 1C (3)) estimated from the surveyed longitudinal channel slope (Appendix Figure A1) for the 2D HEC-RAS model. Since the Del Cerro reach is relatively short, we assumed that the same flow hydrographs derived from the pressure transducer were representative of the internal (Figure 1C (2)) and upstream inflow boundary condition (Figure 1C (1)) due to the close proximity.
We defined the land cover types for the study area based on the 2019 Multi-Resolution Land Characteristics Consortium (MLRC) National Land Cover Database (NLCD) [39]. The primary land cover types within the study area were: developed–medium intensity, developed–high intensity, and shrub and scrubs. The Manning’s roughness coefficient, n, represents the frictional roughness due to the channel material and obstructions to flow. Guided by the land cover types, we assigned Manning’s n parameters to represent frictional roughness within the Del Cerro reach [40].

Table 1.
Hydrologic and hydraulic parameters for HEC-RAS.
Table 1.
Hydrologic and hydraulic parameters for HEC-RAS.
| Parameter | Temporal/Spatial Resolution | Source |
|---|---|---|
| Streamflow and Water Temperature | 10 min | In-stream pressure transducer |
| Precipitation | 60 min | MesoWest Station DW3640 [36] |
| Topography | 1 m | 2014 National Elevation Dataset [38] |
| Manning’s n | N/A | HEC-RAS 2D ModelingUser’s Manual [40] |
| Land Cover | 30 m | 2019 MLRC NLCD [39] |
2.3.2. Model Calibration and Validation
Storm data from 2019 and 2021 were used to calibrate the model. The primary objectives were to minimize the difference between the observed and modeled stage. We calibrated Manning’s n for four calibration regions: channel (open water), riparian zone, floodplain and hillside (Figure 1D). These regions were used to differentiate roughness across the flow area. The model was calibrated manually by incrementally increasing the roughness values for each region until the objective functions were minimized, which was similar to the methods used by Moriasi et al. [41] and David and Schmalz [42]. Calibration regions allowed the model to better represent roughness values initially defined by land cover. The initial parameters (Table 1) were used to produce baseline or uncalibrated flow in the stream for six storm events. Roughness values (Table 2) were adjusted within the calibration regions (Figure 1D) to reflect conditions before and after the vegetation restoration for three storms per scenario. Uncalibrated Manning’s n values for the calibration regions were based on suggestions for each predominant land cover type [40,41]. The pre-vegetation restoration channel calibration region was assigned “open water” and hillside and floodplain regions were “shrubs/scrubs.” Following Janda-Timba [43], we utilized an “ultimate vegetative condition” to reflect the dense vegetative conditions without maintenance. We assumed a Manning’s n of 0.15 for an earthen reach and pre-vegetation restoration conditions in the riparian zone (Figure 1D (3)). To represent the change in roughness for the post-vegetation restoration condition, baseline roughness values from 2021 were approximated as 150% less than those in 2019 to reflect the removal of non-native canopy and surrounding vegetation in 2021.
Table 2.
Uncalibrated and calibrated Manning’s n roughness values for calibration regions.
Two objective functions were used to evaluate model performance, the root mean squared error (RMSE) and the percent bias (Bias). The root mean squared error provides the accuracy of the model predictions; the objective is to minimize the magnitude of this error function. The percent bias represents the tendency of a model to underestimate (negative bias), or overestimate (positive bias) observed values; a value of 0 represents no bias. Similarly to Moriasi et al. [41] and David and Schmalz [42], we defined an acceptable level of percent bias as less than 25%. During calibration, we increased the roughness values for the four calibration regions in the model incrementally until all storms simulated water depth with a RMSE and Bias of less than 0.10 m and 20%, respectively.
3. Results
3.1. Precipitation and Stream Temperature
In 2019, 2020 and 2021 the average annual precipitation was 434 mm, 262 mm and 187 mm, respectively. Generally, most of the precipitation occurred during the winter (October to April), from which we selected storms for modeling. During the wet seasons, we identified a total of fifteen significant storms in 2019 (pre-vegetation restoration) and nine in 2021 (post-vegetation restoration). Although the total precipitation in 2021 was 43% of that in 2019, we selected six storm events of similar magnitude to model in 2019 and 2021 (Table 3). Three storms were used for each year, where two were used for model calibration and one for model validation. These six storm events allowed us to investigate the impacts of vegetation removal on streamflow under similar precipitation conditions (Table 3). The highest 60 min precipitation intensity (10.9 mm/h) and the largest total 24 h rainfall occurred (37.6 mm) in the 2019 wet season.
Table 3.
Storm events and characteristics (maximum 60 min rainfall intensity (Max I-60), recurrence interval, and total rainfall) selected for calibration and validation of pre-vegetation restoration (2019) and post-vegetation restoration (2021) conditions.
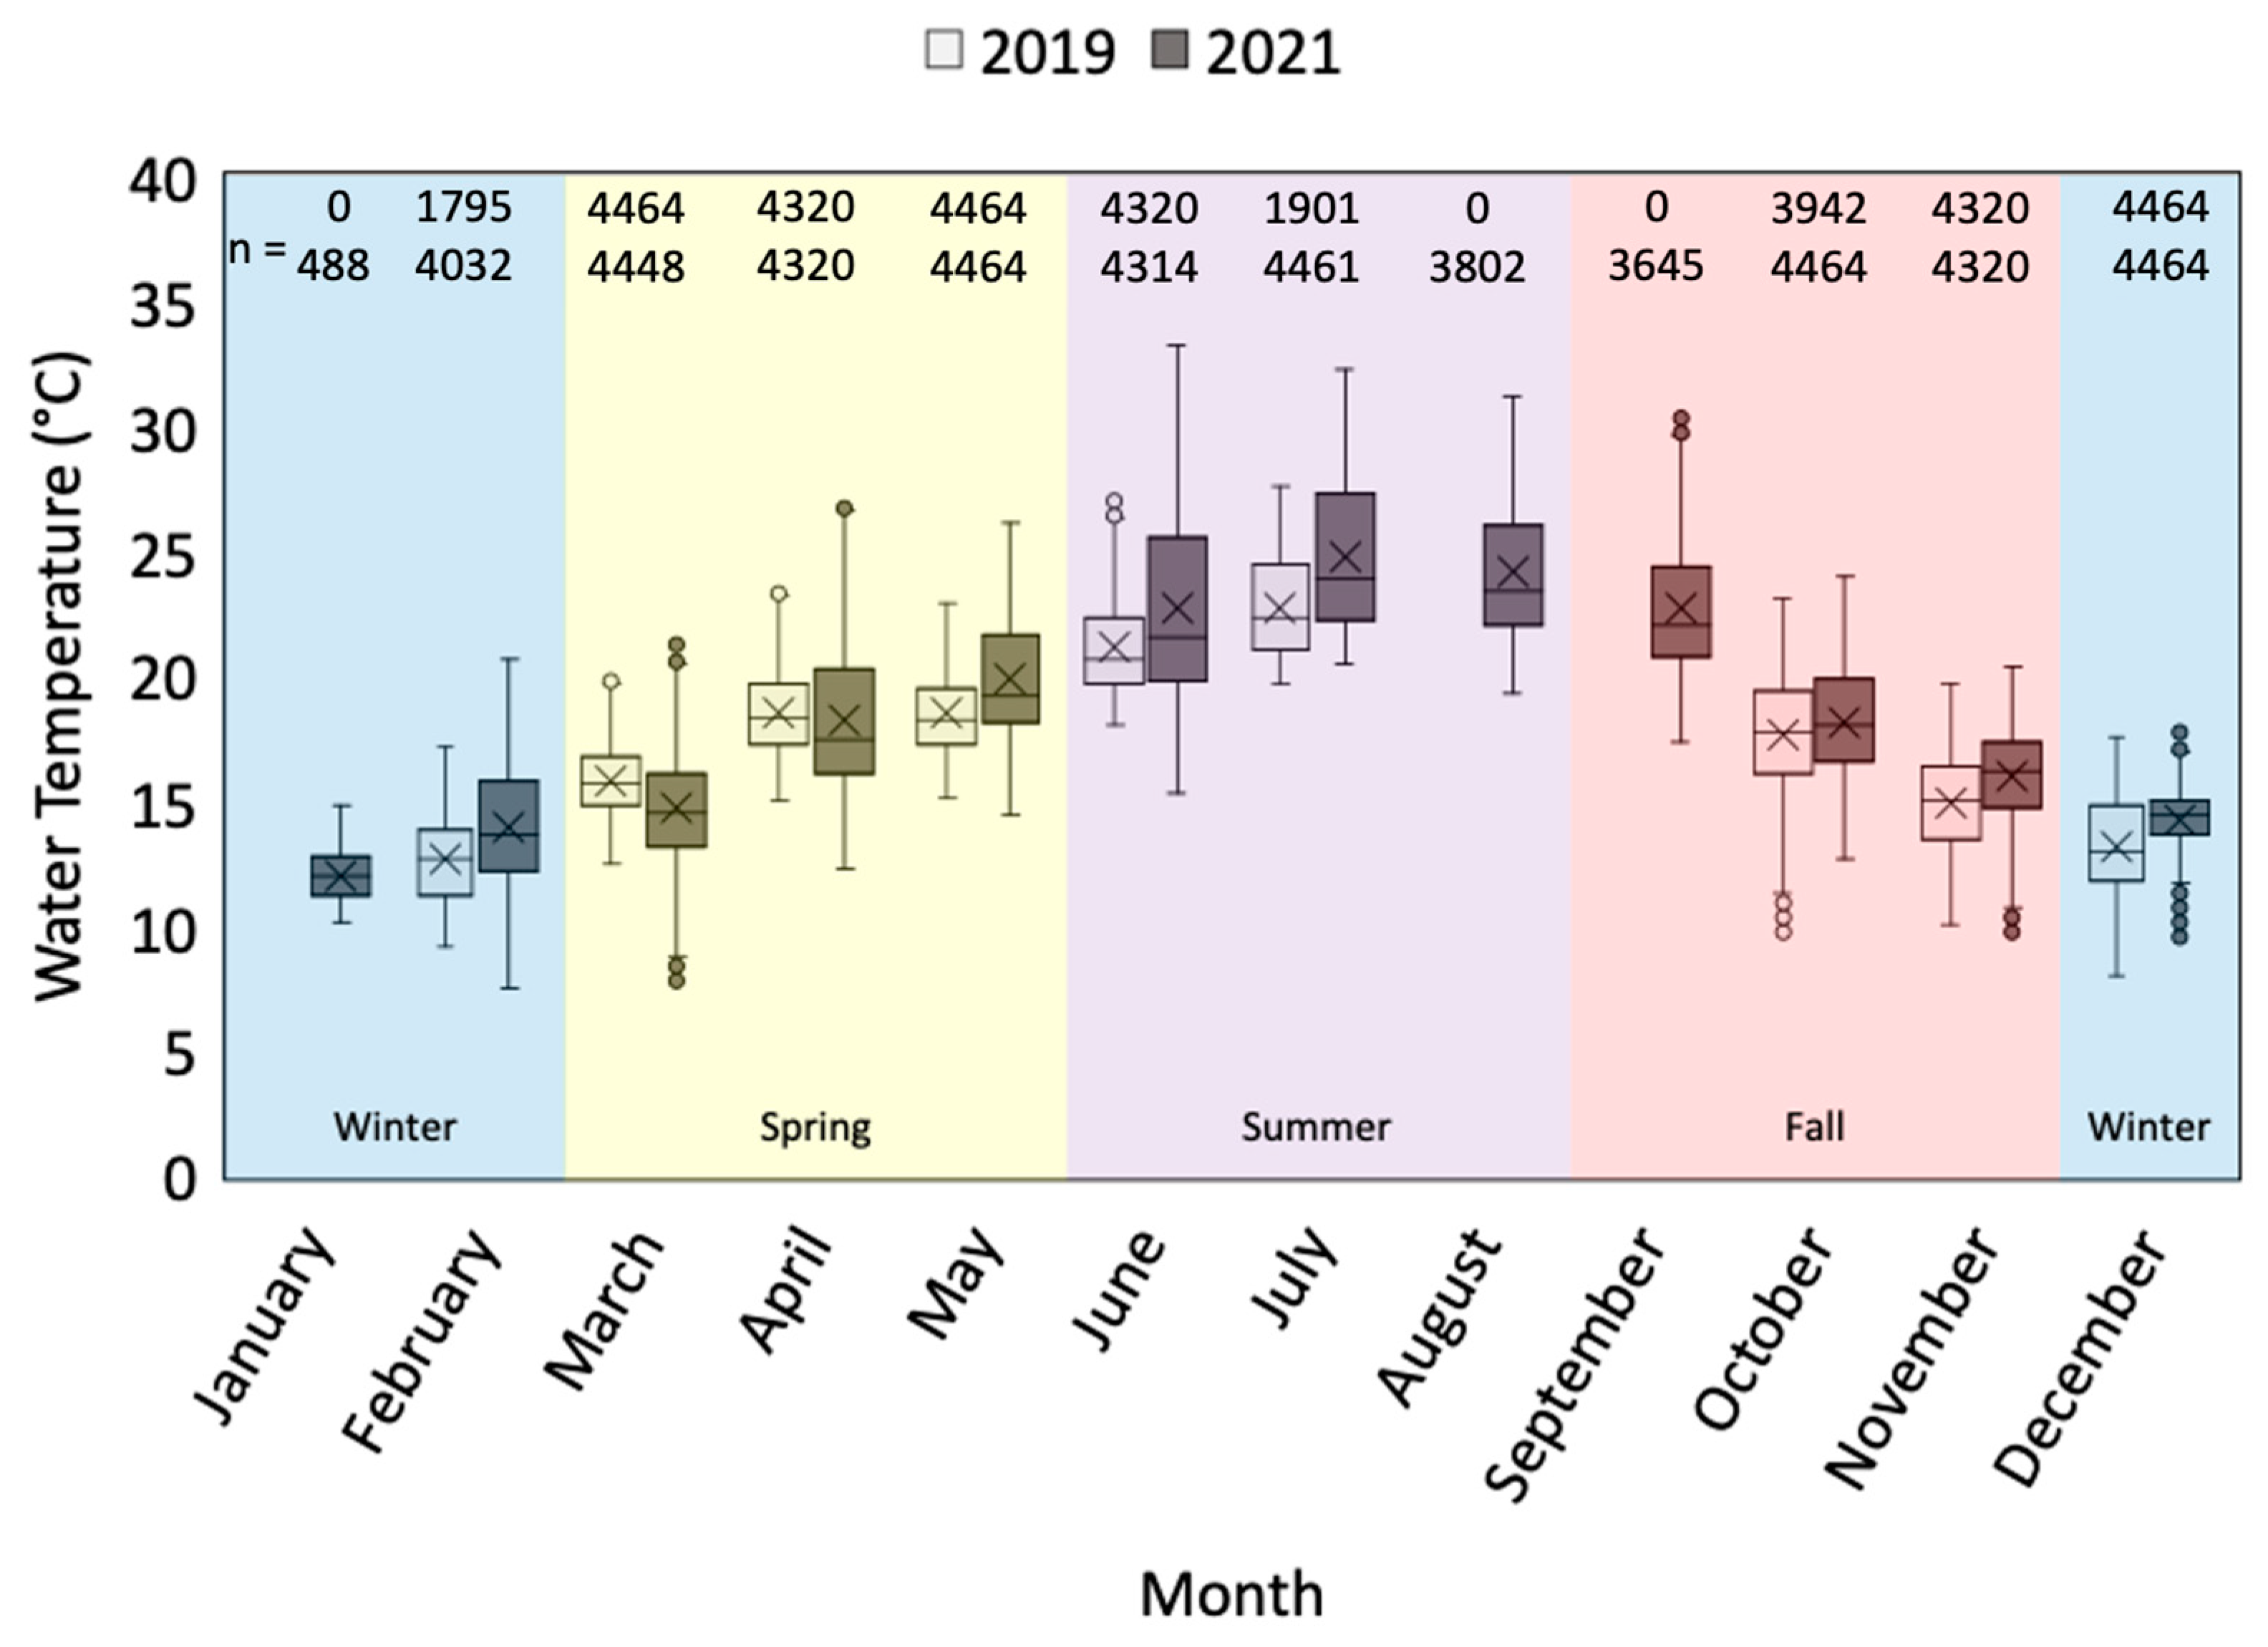
Local air temperature in 2019 was lower than in 2021. The average ambient air temperatures for 2019 were 16.35 °C compared to 17.11 °C in 2021. Water temperatures followed similar trends with the air temperature, where seasonal average water temperatures also increased (Figure 2). The maximum recorded stream temperature for 2019 was 27.6 °C on 12 July 2019, while the minimum recorded temperature was 8 °C on 19 December 2019. In 2021, the maximum and minimum temperature was 33.2 °C on 26 June 2021 and 7.48 °C on 19 February 2021, respectively. Both years differed statistically, pre-vegetation restoration scenarios had a lower standard deviation of stream temperatures than post-vegetation restoration for every month except October and December. The average monthly water temperature was greater during the post-vegetation restoration year for every month that data was recorded consecutively for both 2019 and 2021 conditions, except in March.

Figure 2.
Boxplots of average monthly water temperatures for 2019 (light gray) and 2021 (dark gray). Seasons are shaded blue for winter, yellow for spring, purple for summer, and red for fall. The number of values, n, available in 2019 (top) and 2021 (bottom) are noted.
3.2. Baseline Simulations
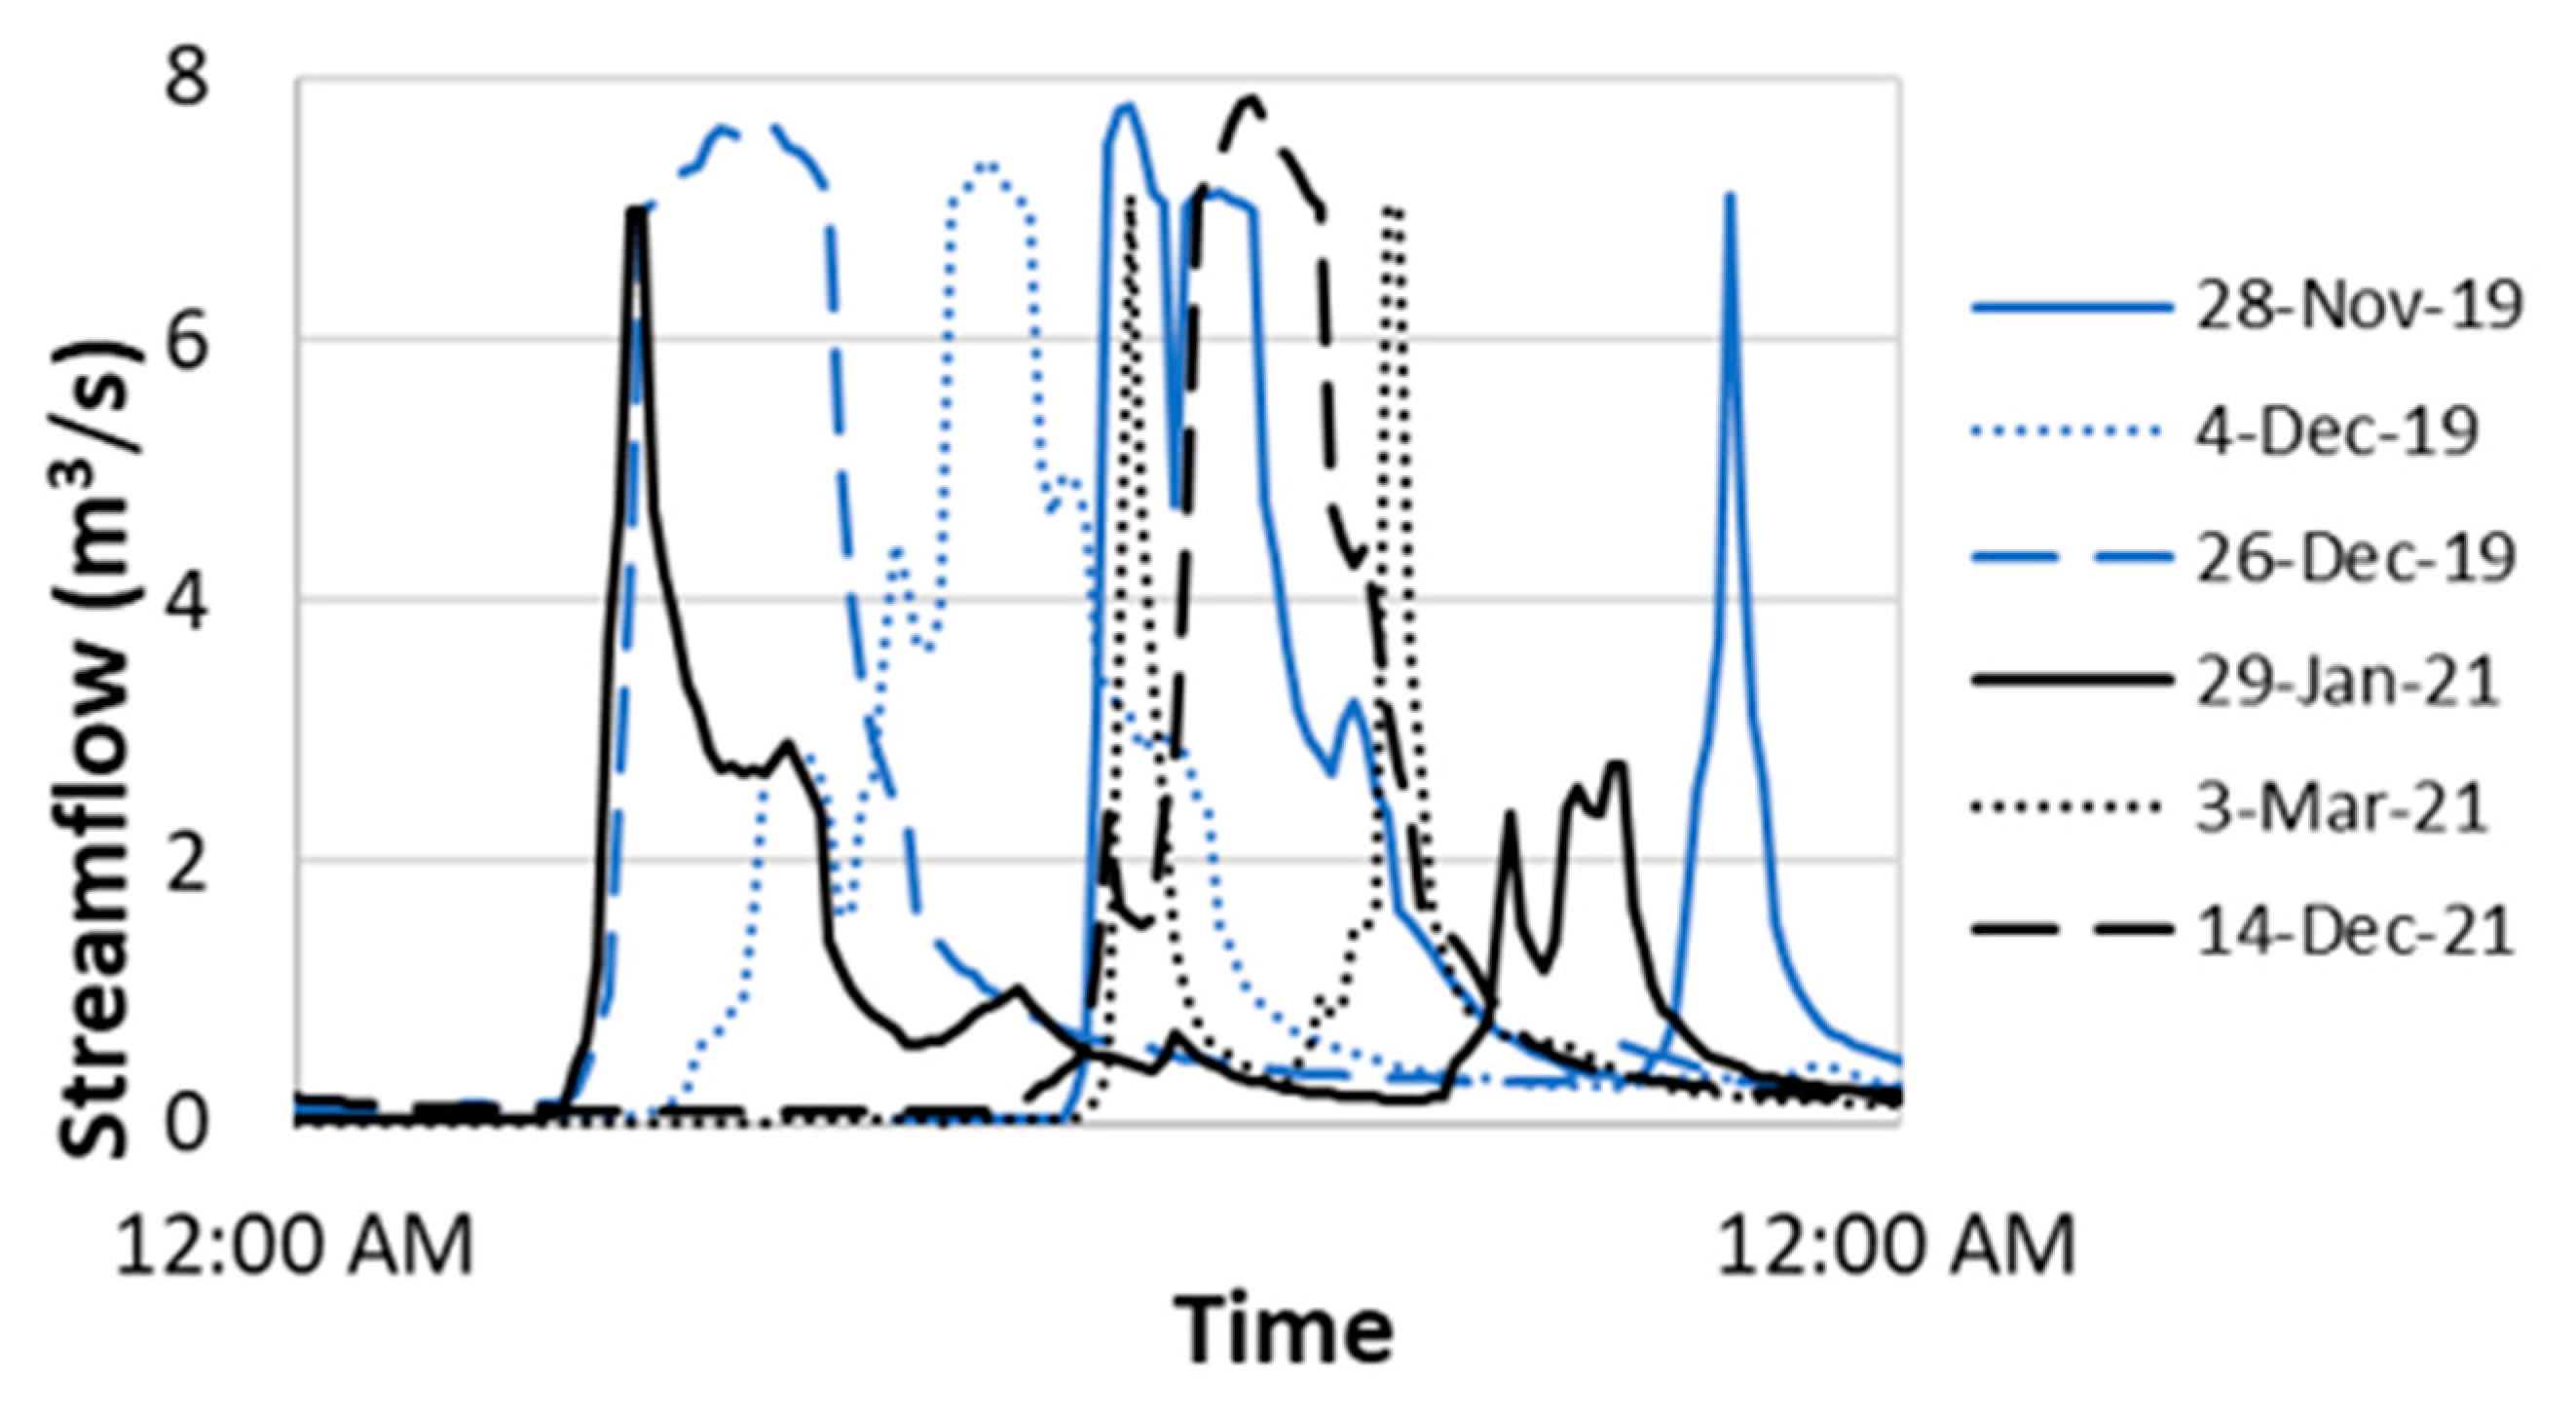
The water depth and streamflow were simulated at a 10 min resolution and compared to data from the in situ pressure transducer. Minimum and maximum observed water depth recorded in the field ranged from 0.10 to 0.27 m and 1.2 to 1.8 m, respectively. Water depth was converted to streamflow by Equation (1) for each storm (Table 3). For the six storms of interest, the minimum and maximum streamflow rates ranged from 0.01 to 0.08 m3/s and 7.0 to 7.8 m3/s, respectively.
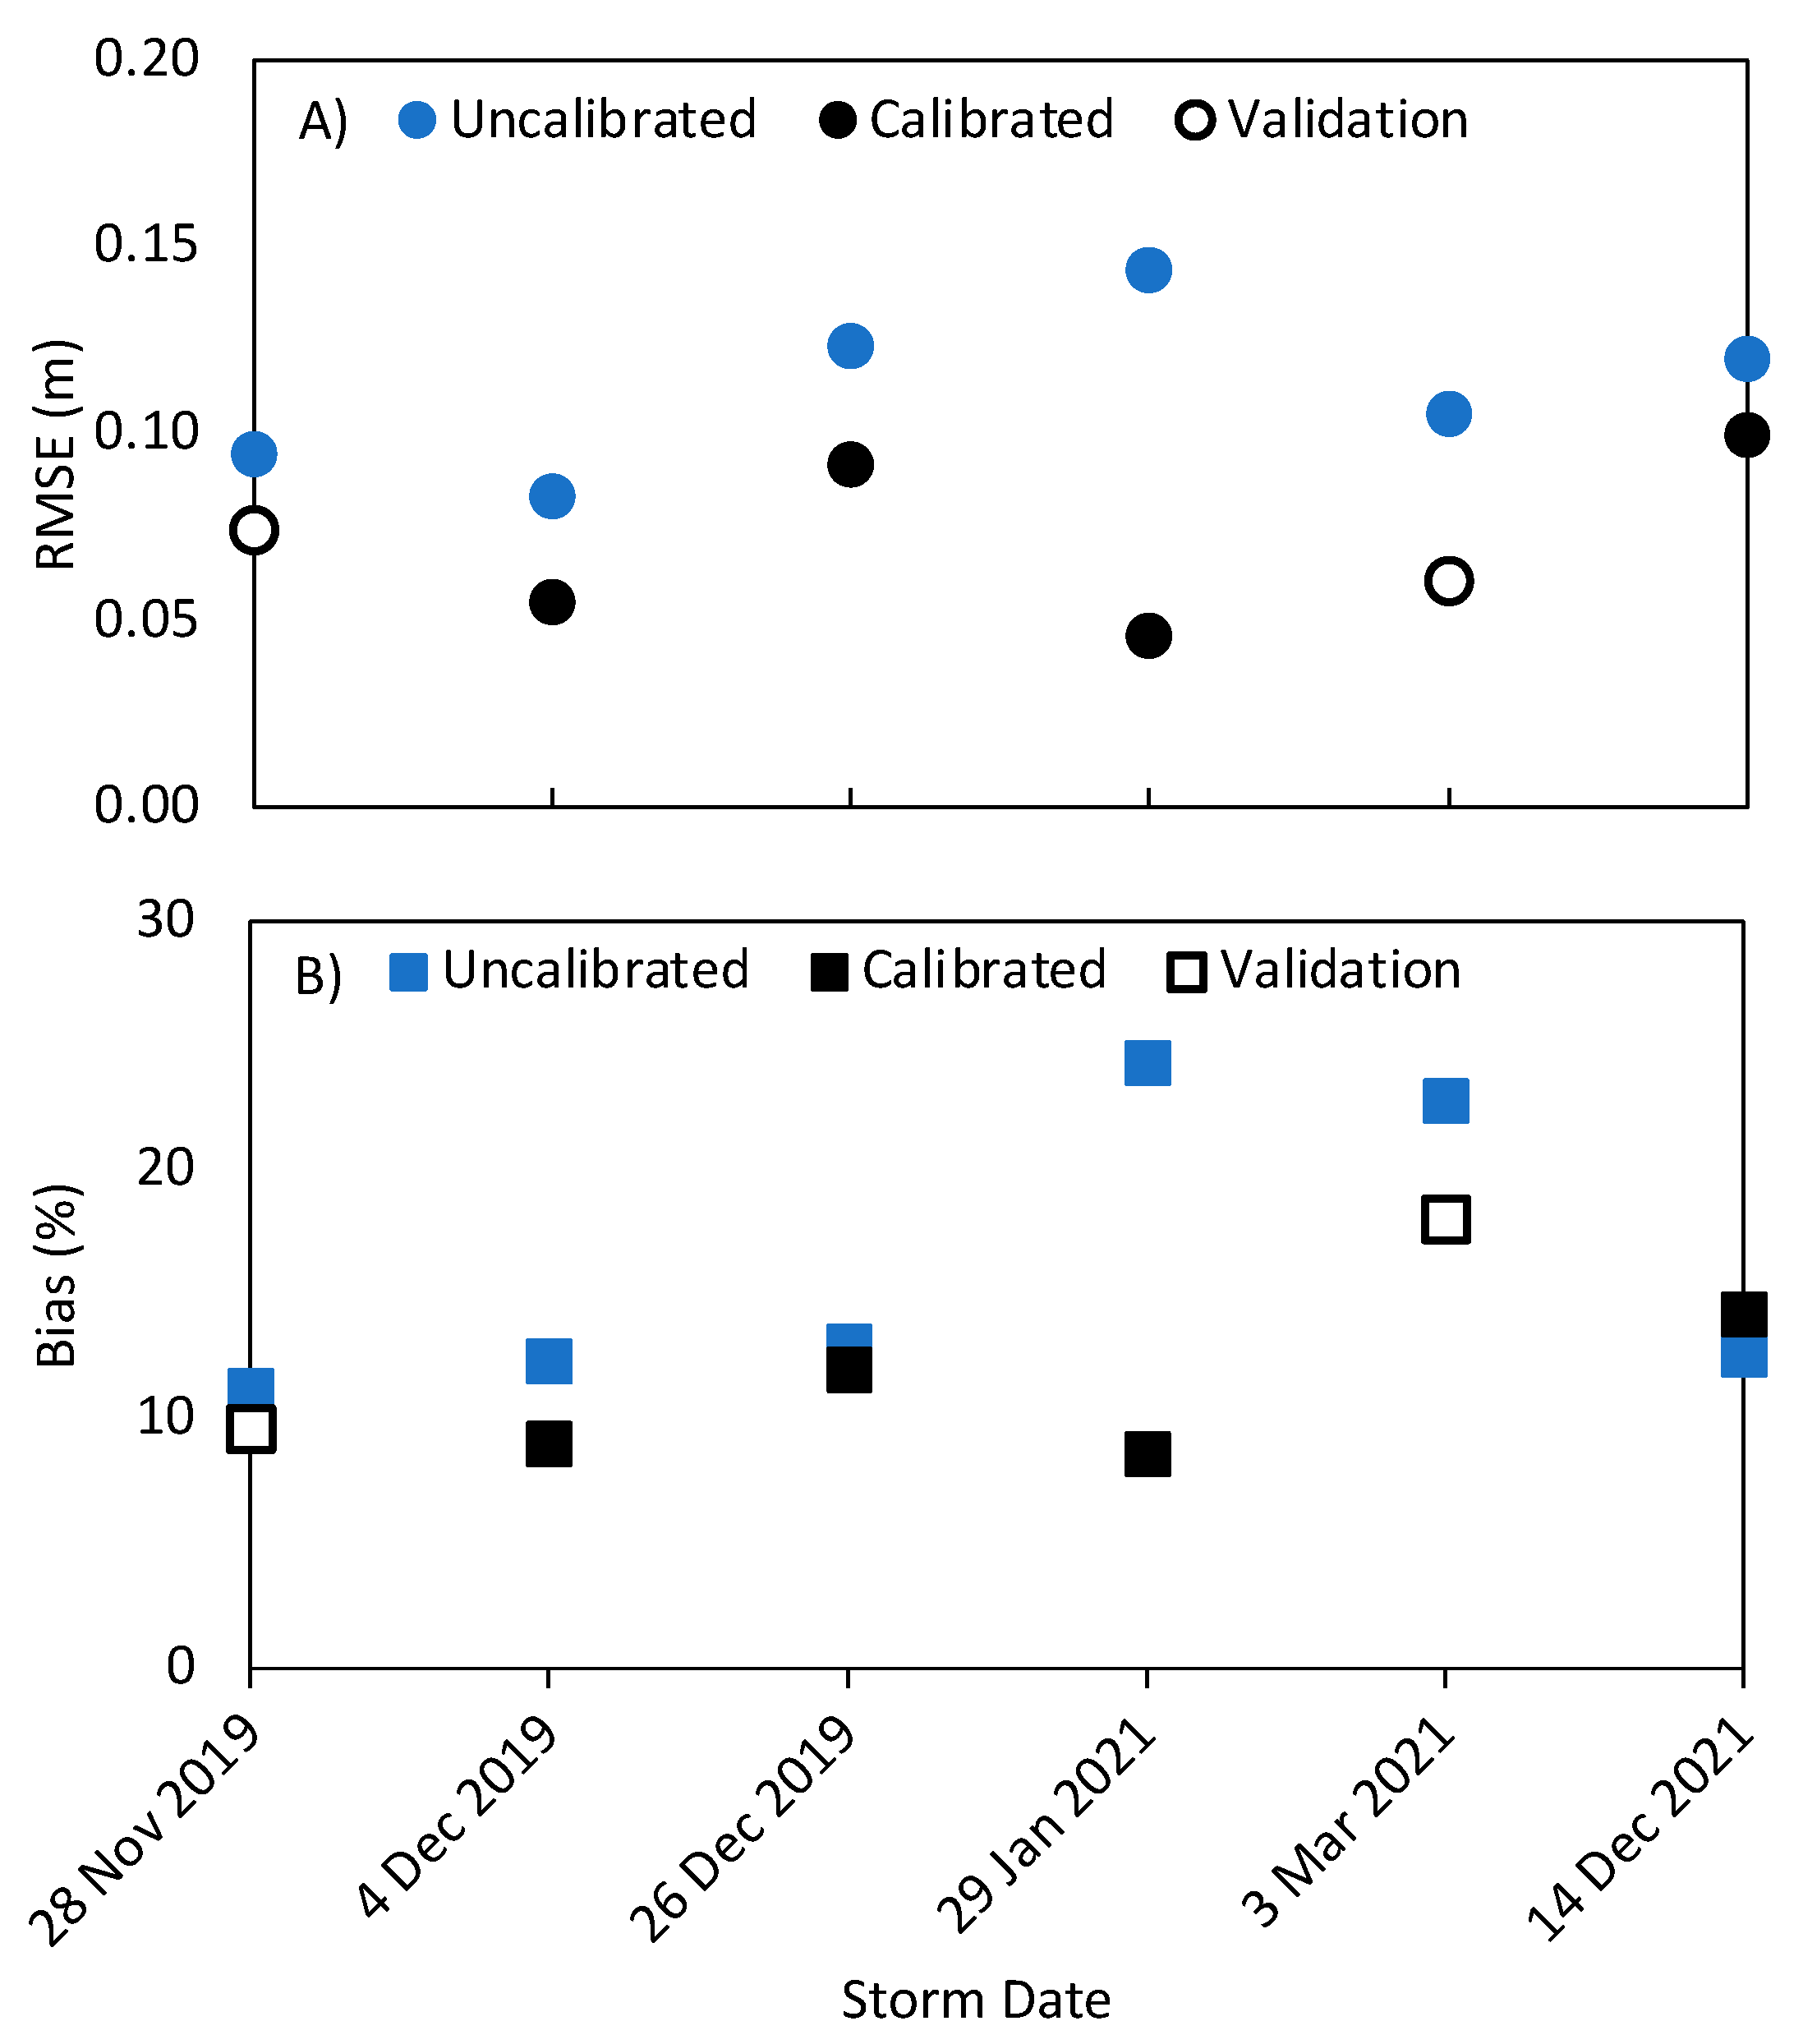
The uncalibrated model simulations served as the baseline, from which we could evaluate improvements made to the model through calibration. The uncalibrated models performed well; baseline simulations of all six storms predicted the water depth with errors below 0.15 m and 25% for RMSE and Bias, respectively (Figure 3). For RMSE, the 2019 storms had the lowest levels of error for baseline results, which ranged between 0.08 to 0.12 m, while 2021 had slightly larger errors, between 0.11 to 0.14 m. The Bias was generally equal between 2019 and 2021, ranging between 11 to 13%, except Storms 4 (29 January 2021) and 5 (03 March 2021), which had a Bias of 24% and 22%, respectively (Figure 3). All storms, except Storm 6 (14 December 2021), had a reduction in error after calibration. For the six storms, the minimum and maximum uncalibrated water depth was between 0.11 to 0.30 m and 1.03 to 1.23 m, respectively.
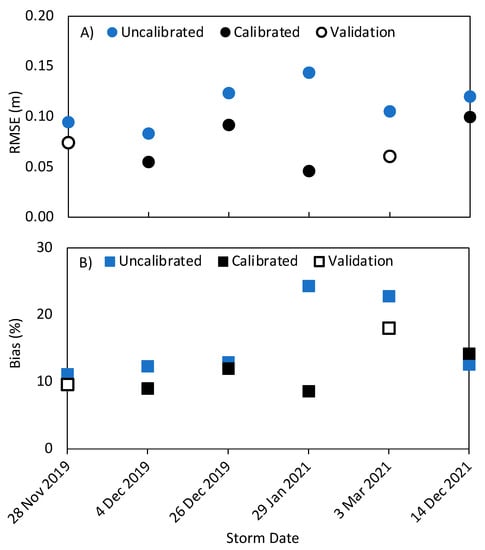
Figure 3.
(A) Root mean squared error (RMSE) and (B) percent bias (Bias) for uncalibrated, calibrated, and validated model results for simulated water depth.
3.3. Calibration and Validation
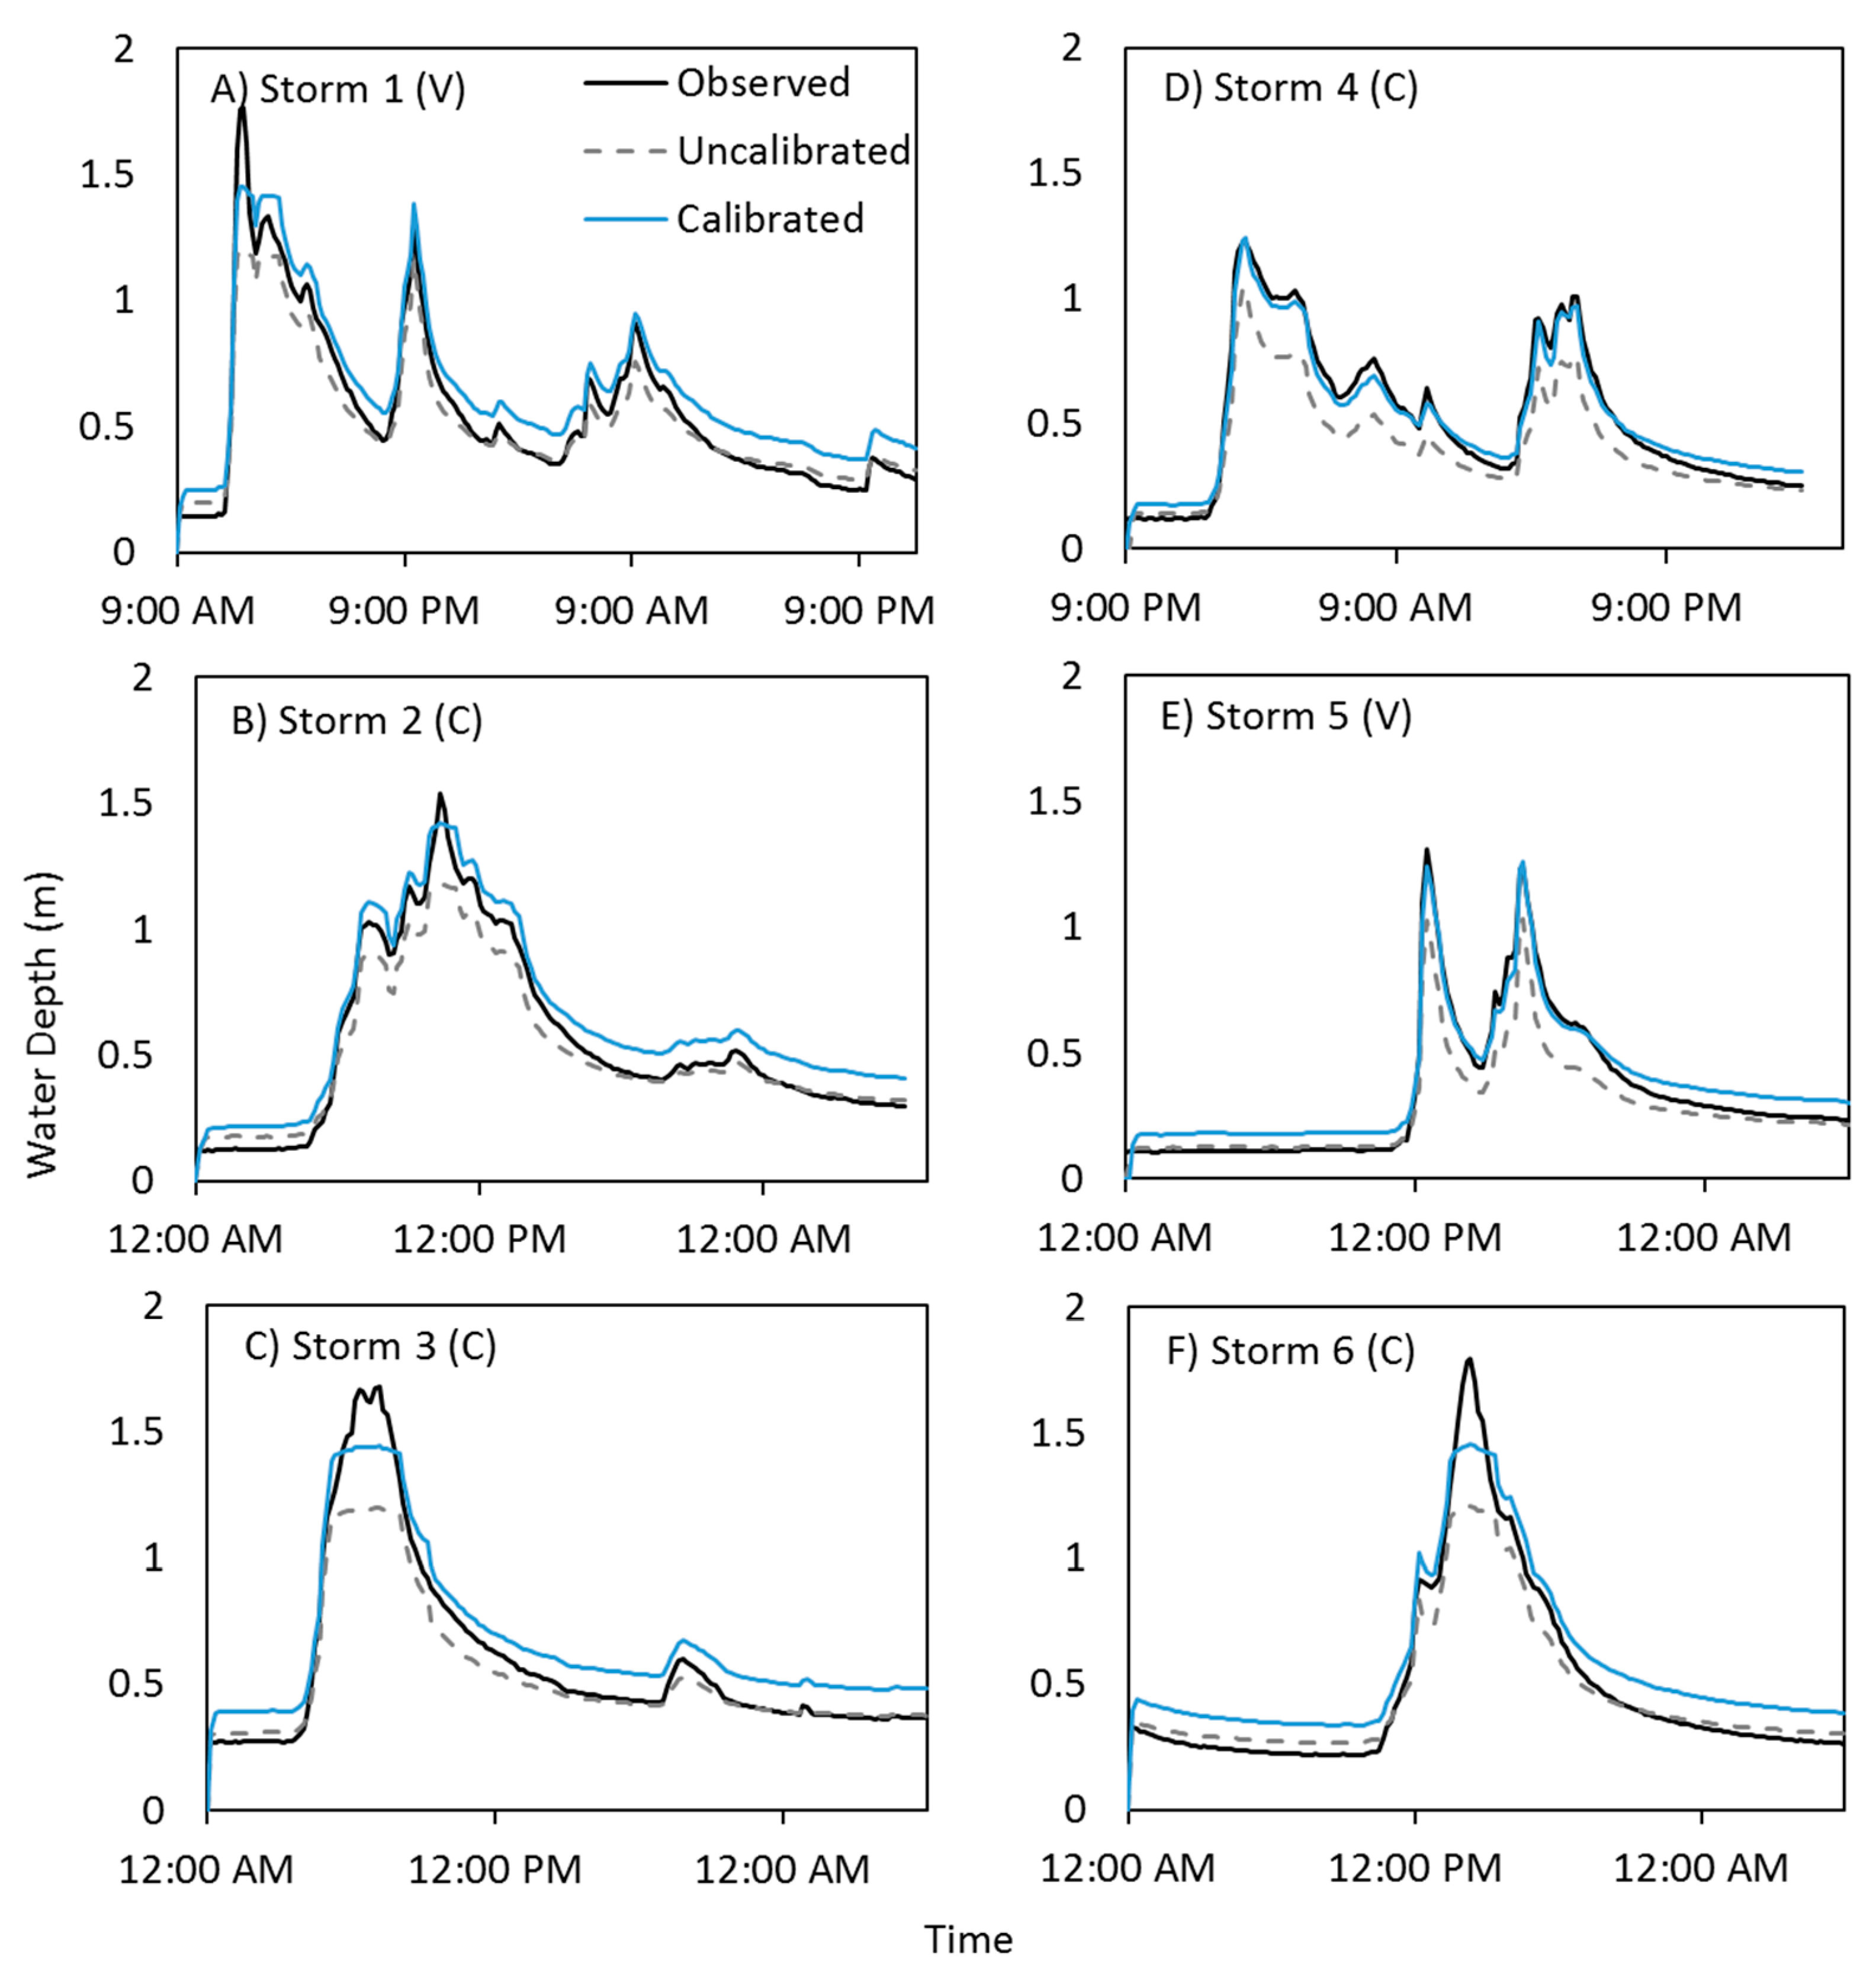
Water depth was sensitive to the Manning’s roughness coefficient, which directly affected the volume of water passing through the area of interest and the rate at which the water travels through the stream. Manning’s n is one of the primary parameters requiring calibration as it has the most variability and uncertainty amongst the HEC-RAS parameters [44]. The maximum observed water depth occurred during Storm 4 (29 December 2021) and was 1.22 m, while the maximum water depth for the calibrated model was 1.24 m (Figure 4). Simulation of Storm 4 (29 January 2021) improved the greatest after calibration, which had the most accurate water depth values, where RMSE and Bias decreased from 0.14 to 0.05 m and 24.32% to 8.58%, respectively (Figure 3).
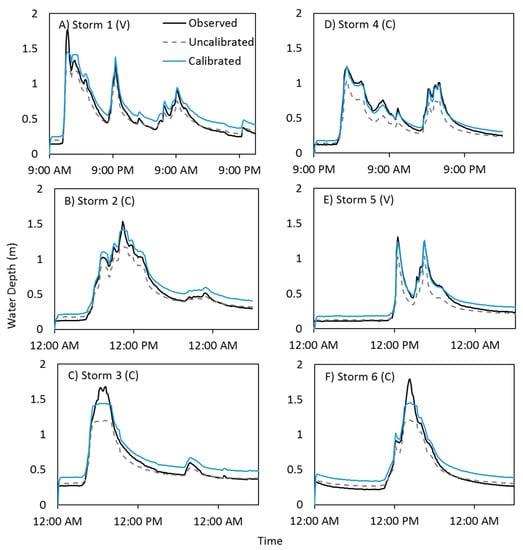
Figure 4.
Observed water depth, uncalibrated, and final calibrated model simulations for (A) Storm 1 (28 Nov 2019), (B) Storm 2 (4 Dec 2019), (C) Storm 3 (26 Dec 2019), (D) Storm 4 (29 Jan 2021), (E) Storm 5 (3 Mar 2021), and (F) Storm 6 (14 Dec 2021). Where C and V denote calibration and validation, respectively.
The final calibrated model performed well, where RMSE and Bias for 2019 reached 0.05 m and 9.02%, respectively. The most accurate RMSE and Bias for 2021 was 0.05 m and 8.58%, respectively. The minimum and maximum calibrated water depth ranged from 0.13 to 0.15 m and 1.26 to 1.45 m, respectively. Calibration improved the accuracy of water depth prediction for each of the model scenarios (Figure 4).
4. Discussion
4.1. Canopy Loss and Stream Hydraulics
We used the 2D HEC-RAS model to simulate streamflow under pre- and post-vegetation restoration conditions. The initial performance of the uncalibrated events was better than expected and improved through calibration. The high resolution 1 m DEM and the integration of field observations likely provided a better representation of the topography in Del Cerro.
Despite lower precipitation in 2021, the maximum observed and modeled streamflows and water depths for all six storms were relatively similar (Appendix A Figure A2), suggesting that riparian vegetation restoration has the potential to increase flood extent and frequency. Studies have observed that forest canopy contributes to interception, evaporation, and transpiration, which can attenuate peak flows and soil erosion [45]. Following the removal of riparian canopy, the peak storm flow rate increased. The increase in peak streamflow was attributed to the decrease in evapotranspiration and vegetative resistance, as well as altered infiltration in the riparian zone, leading to higher observed runoff [46,47,48,49]. Another consequence of canopy removal is a higher soil moisture content throughout the year, contributing to saturated riparian soil conditions that can lead to increased peak storm flows [50].
Uncertainty and errors are inherent in field data collection and parameter estimation, which could impact the modeling results. However, we accounted for drift in the water depth by manually adjusting depths read from a staff gauge paired with the sensor in the field. Additionally, only one high resolution 1 m DEM existed, so we assumed the same landscape for both model conditions (pre- and post-vegetation restoration). While we assumed that the vegetation removal was on the surface of the land, subtle changes within the topography and bathymetry of the reach between 2019 and 2021 may not be represented in the model. Finally, while rapid vegetation regrowth was observed throughout the year, we only applied a single roughness value to each type of land cover and calibration region.
4.2. Vegetation Restoration and Implications for Ecosystem Services
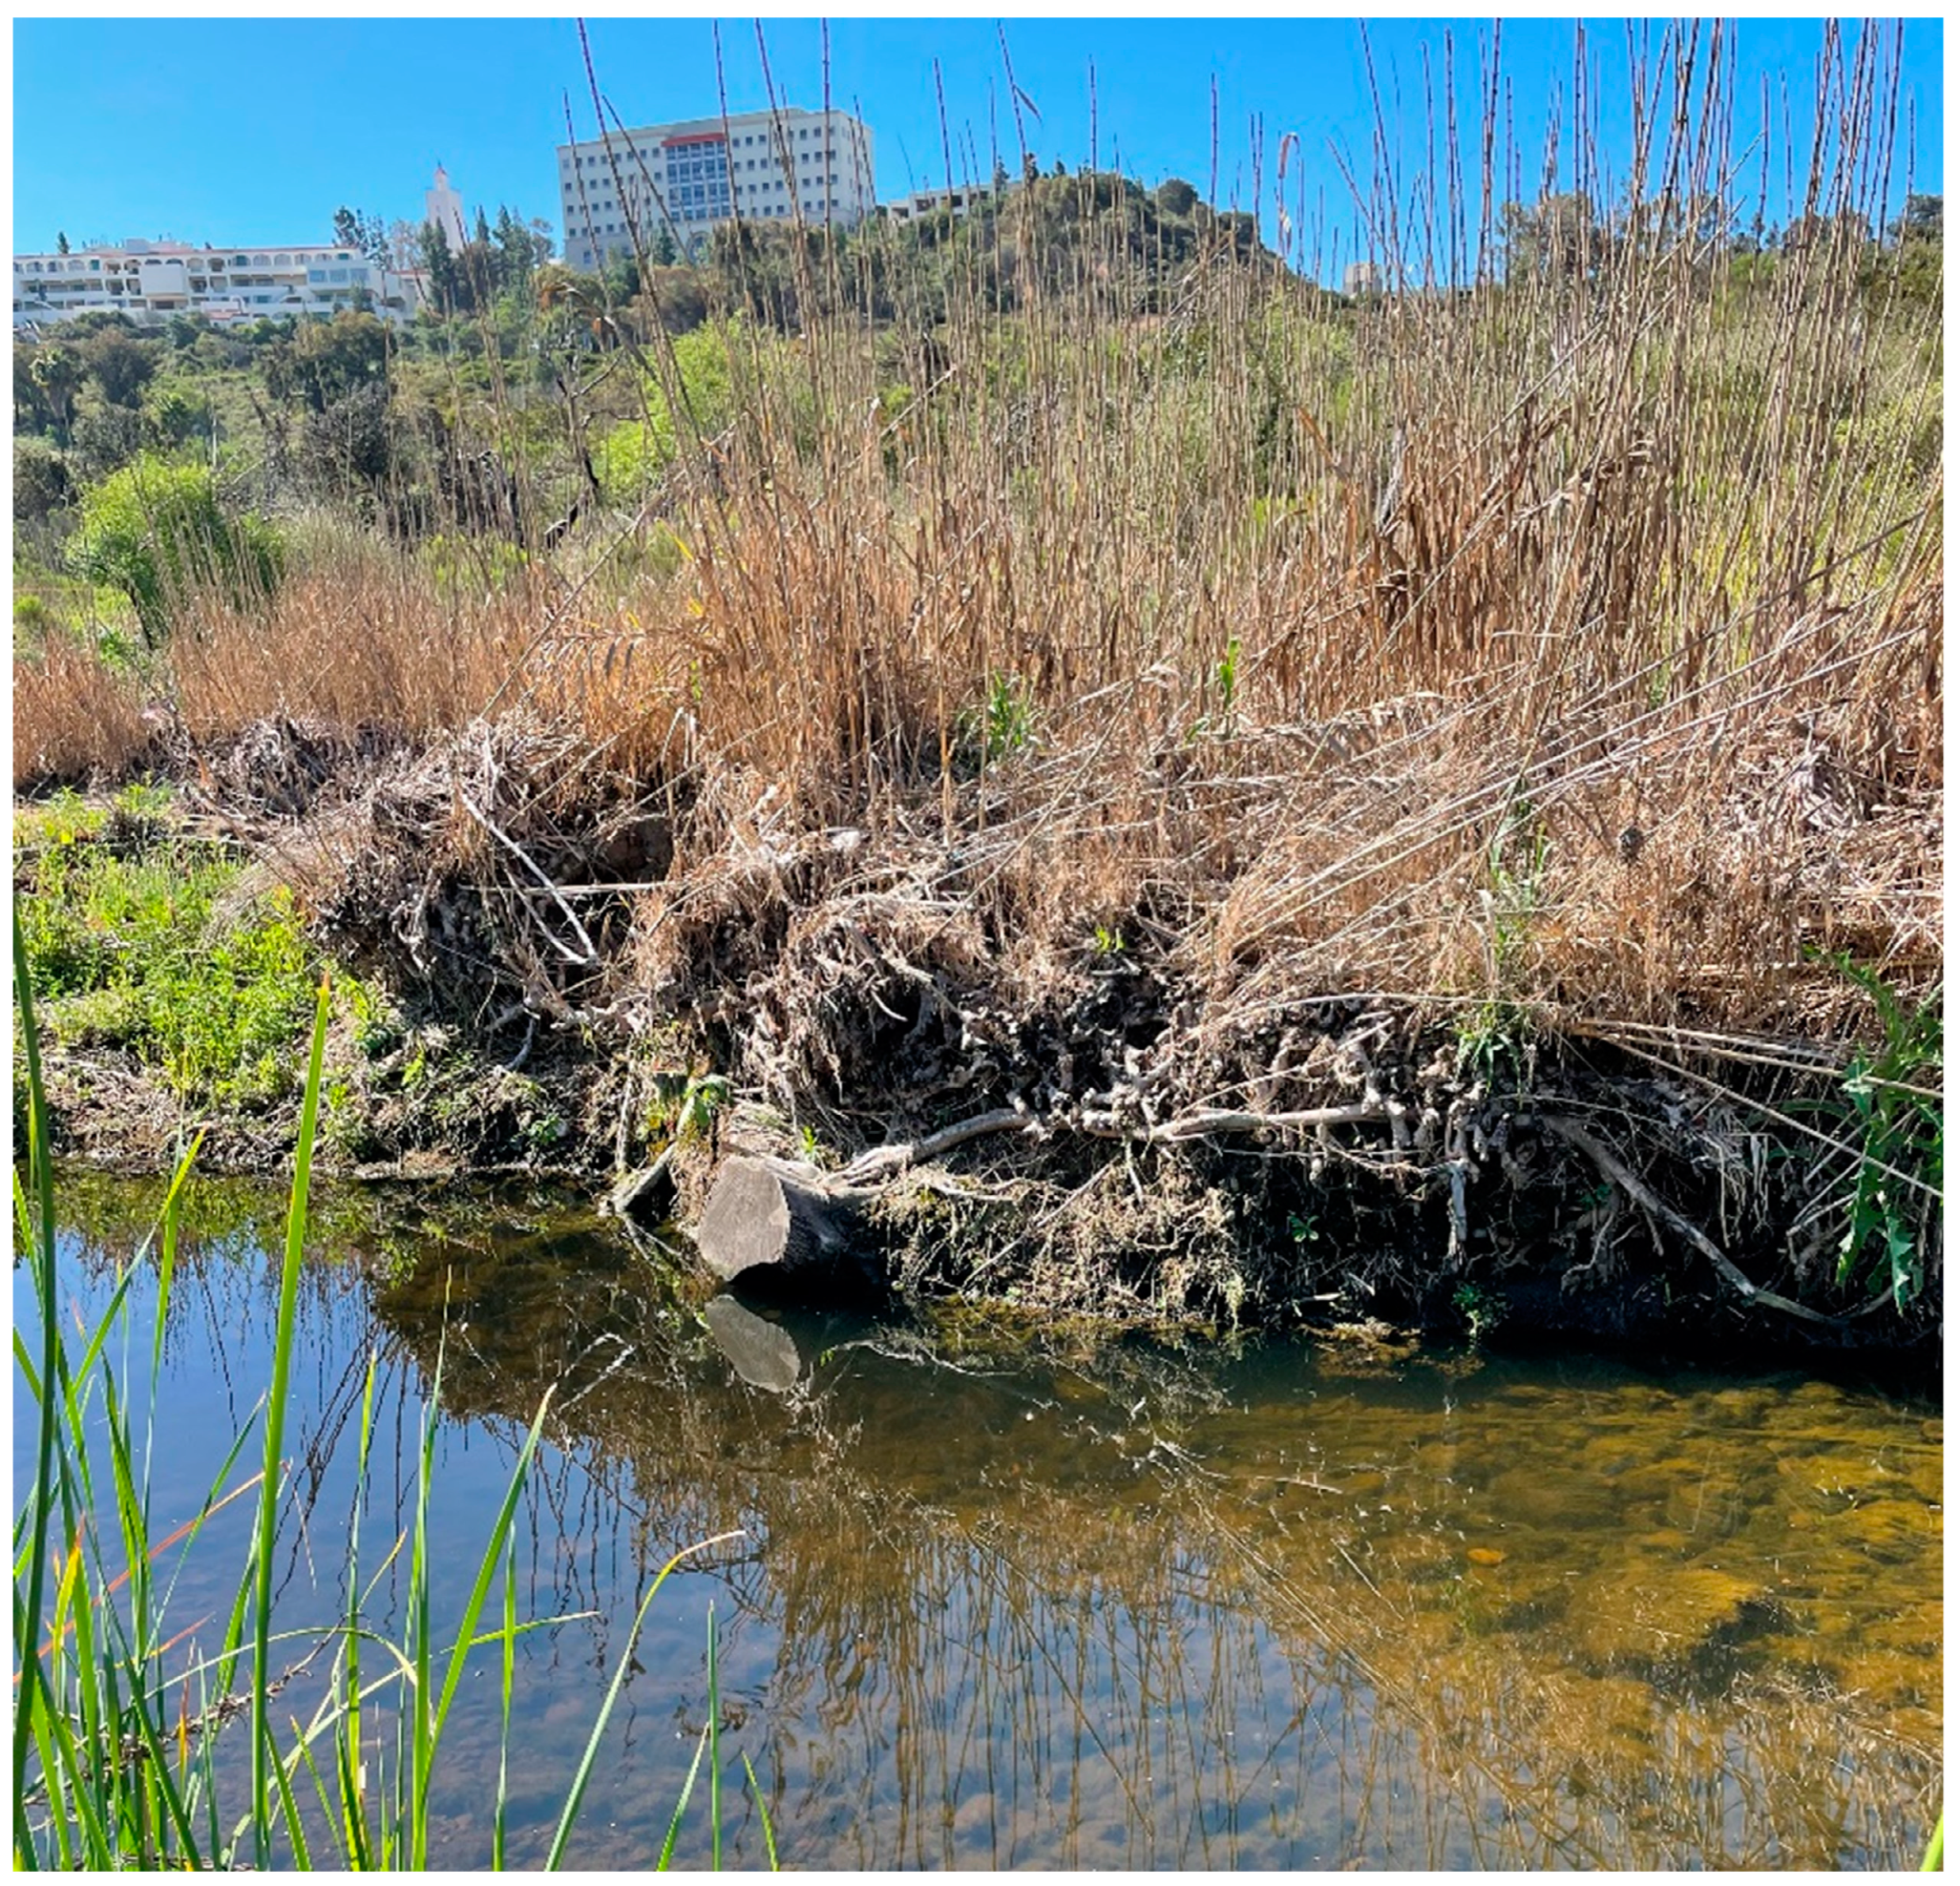
Vegetation restoration may have multiple ecosystem service benefits in urban Mediterranean ecosystems, such as improved habitat for native fauna and flora and enhanced watershed conditions. Goals of native streamside vegetation management may include the reduction in sediment and nutrient transport within the stream, reinforcement of bank stability [51], or mitigation of fire risk [52]. Without the presence of an established riparian biomass, stream banks may weaken, and the flow of nutrients and sediment can become disrupted, altering the microclimate of the stream [53]. The presence of invasive species in the riparian zone also has the potential to create new channels due to oversized roots and consumption of extra water, which can lead to exclusion of native vegetation and aridification of the riparian zone [32]. Invasive species such as Arundo donax can undercut the root system of native species, resulting in streambank failure [18], which we observed in an upstream channel section in the summer of 2022 (Figure 5). Following the removal of vegetation, stream temperatures increased. Higher water temperatures were likely due to warmer air temperatures and the decrease in canopy cover, exposing the stream to more solar radiation, which may potentially disrupt aquatic habitat and processes. However, not enough data was collected to assess and model these conditions and further field observations are encouraged.

Figure 5.
Bank failure within the upstream reach of Del Cerro, Alvarado Creek.
This study focuses mainly on Arundo donax, which is present within many urban stream systems and coastal watersheds and is becoming of particular concern in southern California due to the negative ecosystem consequences. Mathews and Kinoshita [10], documented an elevation disparity between the main channel of Del Cerro and the surrounding floodplain immediately after fire, which encourages desiccation of the riparian area and promotes the grass fire feedback cycle [19,28]. However, following the removal of the non-native vegetation, primarily the giant reed and palms, there was an increase in deposition or an increase in elevation in the secondary channels, suggesting that the function of the floodplain is being restored. In urban systems where the grass-fire cycle is of concern, the period between vegetation removal by fire and the regrowth of vegetation can be a critical time without an existing native plant ecosystem, where the presence of aggressive non-native vegetation can thrive and dominate the landscape. Management and removal of the invasive riparian vegetation can provide a buffer against these fire prone conditions by decreasing the fire fuel load and reintroducing native species that are not only resilient to fire events [52], but also offer important ecosystem services for flora and fauna.
Understanding the response of small urban stream reaches to the removal of invasive vegetation and canopy cover to mitigate abrupt ecosystem impacts are needed. We advocate that short- and long-term studies that collect information about the response to vegetation restoration in urban streams are needed to further improve modeling and prediction. Recognizing that there are limited quantitative field observations after the removal of Arundo donax, we suggest that the calibrated parameters presented in this study (Table 2) can be used as a starting point to guide modeling and prediction of hydrologic and hydraulic response to disturbance or vegetation restoration efforts in similar areas.
5. Conclusions
Given the widespread presence of non-native vegetation in urban and Mediterranean watersheds, it is important to evaluate the response of these sensitive ecosystems to activities to manage and restore native conditions. This study used field data to develop a 2D hydraulic model to simulate the impacts of canopy loss and vegetation disturbance on urban stream hydraulics. The significant loss of vegetation in the riparian zone affected the floodplain response and capacity for peak storm flows. We provide insight into the responses of small urban stream reaches to the removal of invasive vegetation and canopy cover. However, studies that provide observations about the long-term impacts of vegetation restoration are needed to capture the processes of these systems as they stabilize after disturbance and establish the response to a wider range of climate conditions that may impact stream hydrology and hydraulics. Given the limited quantitative field observations that exist after vegetation restoration, this study can be used to guide modeling and prediction of hydrologic and hydraulic response to disturbance or vegetation restoration efforts in areas where data may be unavailable.
Author Contributions
Conceptualization, T.K.E., A.M.K. and D.S.H.; methodology, T.K.E. and A.M.K.; formal analysis, T.K.E. and A.M.K.; investigation, T.K.E., A.M.K. and D.S.H.; resources, A.M.K. and D.S.H.; data curation, T.K.E.; writing—original draft preparation, T.K.E. and A.M.K.; writing—review and editing, T.K.E., A.M.K. and D.S.H.; visualization, T.K.E. and A.M.K.; supervision, A.M.K.; project administration, A.M.K.; funding acquisition, A.M.K. All authors have read and agreed to the published version of the manuscript.
Funding
This material is based upon work supported by the National Science Foundation CAREER Program under Grant No. (1848577) and by the San Diego River Conservancy under Grant No. (SDRG-P1-18-15).
Institutional Review Board Statement
Not applicable.
Informed Consent Statement
Not applicable.
Data Availability Statement
Data is contained within the article or upon request.
Acknowledgments
The authors would like to thank all the volunteers that have contributed to Alvarado field days and acknowledge the 2021–2022 team: M. Mueller, R. Becerra, S. Jorge, M. Espinoza, E. Andreano, G. Goncalves-Santana, and K. Tippett. Additionally, the authors thank the Soil Ecology and Restoration Group (SERG) and T. Zink for their contributions and support to this work.
Conflicts of Interest
The authors declare no conflict of interest. The funders had no role in the design of the study; in the collection, analyses, or interpretation of data; in the writing of the manuscript, or in the decision to publish the results.
Appendix A
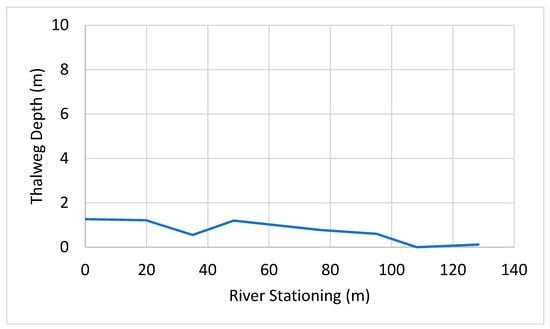
Figure A1.
Del Cerro longitudinal slope.
Figure A1.
Del Cerro longitudinal slope.
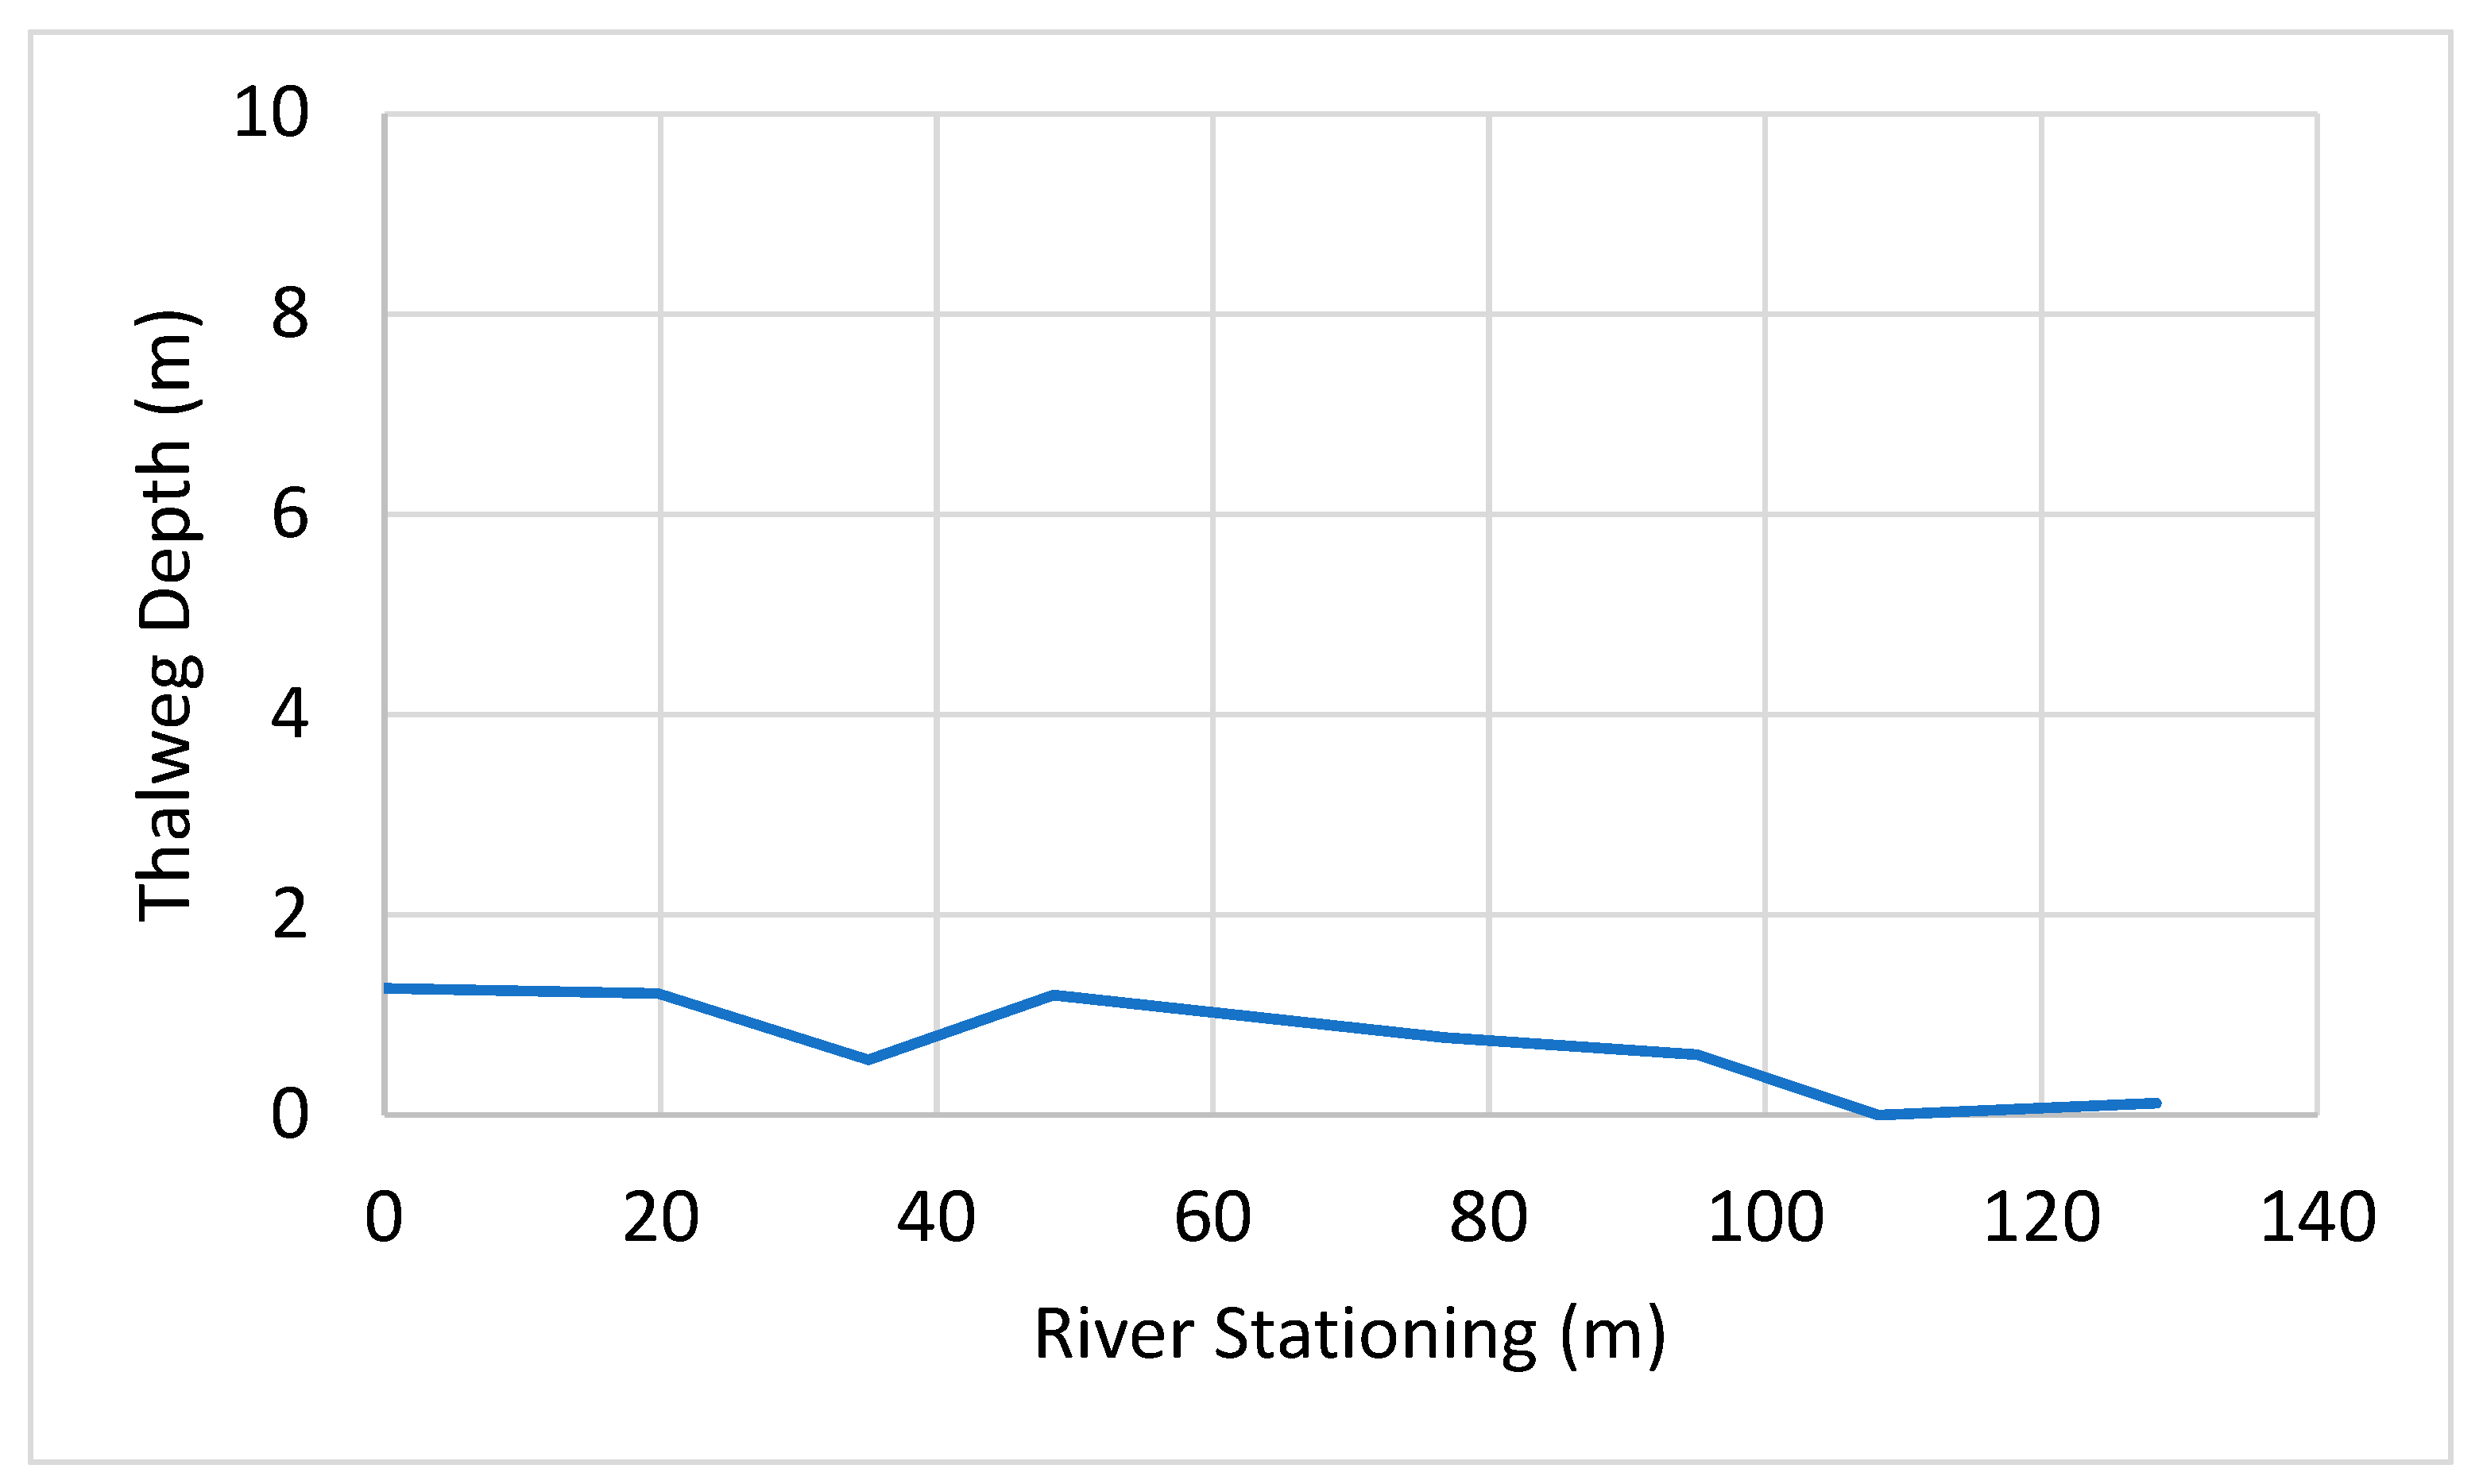

Figure A2.
Observed event-based streamflow for each simulated storm.
Figure A2.
Observed event-based streamflow for each simulated storm.
References
- Myers, N.; Mittermeier, R.A.; Mittermeier, C.G.; da Fonseca, G.A.B.; Kent, J. Biodiversity hotspots for conservation priorities. Nature 2000, 403, 853–858. [Google Scholar] [CrossRef] [PubMed]
- Beltrán, B.J.; Franklin, J.; Syphard, A.; Regan, H.M.; Flint, L.E.; Flint, A.L. Effects of climate change and urban development on the distribution and conservation of vegetation in a Mediterranean type ecosystem. Int. J. Geogr. Inf. Sci. 2013, 28, 1561–1589. [Google Scholar] [CrossRef]
- Sala, O.E.; Chapin, F.S.; Armesto, J.J.; Berlow, E.; Bloomfield, J.; Dirzo, R.; Huber-Sanwald, E.; Huenneke, L.F.; Jackson, R.B.; Kinzig, A.; et al. Global biodiversity scenarios for the year 2100. Science 2000, 287, 1770–1774. [Google Scholar] [CrossRef] [PubMed]
- Brown, G.W.; Krygier, J.T. Effects of clear-cutting on stream temperature. Water Resour. Res. 1970, 6, 1133–1139. [Google Scholar] [CrossRef]
- Beechie, T.; Imaki, H.; Greene, J.; Wade, A.; Wu, H.; Pess, G.; Roni, P.; Kimball, J.; Stanford, J.; Kiffney, P.; et al. Restoring salmon habitat for a changing climate. River Res. Appl. 2012, 29, 939–960. [Google Scholar] [CrossRef]
- Garner, G.; Malcolm, I.A.; Sadler, J.P.; Hannah, D.M. What causes cooling water temperature gradients in a forested stream reach? Hydrol. Earth Syst. Sci. 2014, 18, 5361–5376. [Google Scholar] [CrossRef]
- Anderson, J.W.; Beschta, R.L.; Boehne, P.L.; Bryson, D.; Gill, R.; Howes, S.; McIntosh, B.A.; Purser, M.D.; Rhodes, J.J.; Zakel, J. Comprehensive approach to restoring habitat conditions needed to protect threatened salmon species in a severely degraded river—The Upper Grande Ronde River Anadromous Fish Habitat Protection, Restoration and Monitoring Plan. Gen. Tech. Rep. RM 1993. [Google Scholar]
- Rogers, J.B.; Stein, E.D.; Beck, M.W.; Ambrose, R.F. The impact of climate change induced alterations of streamflow and stream temperature on the distribution of riparian species. PLoS ONE 2020, 15, e0242682. [Google Scholar] [CrossRef]
- Schoelynck, J.; de Groote, T.; Bal, K.; Vandenbruwaene, W.; Meire, P.; Temmerman, S. Self-organised patchiness and scale-dependent bio-geomorphic feedbacks in aquatic river vegetation. Ecography 2012, 35, 760–768. [Google Scholar] [CrossRef]
- Mathews, L.E.H.; Kinoshita, A.M. Urban Fire Severity and Vegetation Dynamics in Southern California. Remote Sens. 2020, 13, 19. [Google Scholar] [CrossRef]
- White, M.D.; Greer, K.A. The effects of watershed urbanization on the stream hydrology and riparian vegetation of Los Penasquitos Creek, California. Landsc. Urban Plan. 2006, 74, 125–138. [Google Scholar] [CrossRef]
- Lebreton, L.C.M.; van der Zwet, J.; Damsteeg, J.-W.; Slat, B.; Andrady, A.; Reisser, J. River plastic emissions to the world’s oceans. Nat. Commun. 2017, 8, 15611. [Google Scholar] [CrossRef]
- Gandara, M.L. Evaluating the Potential Impacts of Homelessness on the Water Quality and Riparian Habitat of the Santa Ana River; Oregon State University: Corvallis, OR, USA, 2020; pp. 18–43. [Google Scholar]
- Crouch, A. Culver City Residents near Ballona Creek Concerned about Fires at Homeless Encampments; NBC Los Angeles: Los Angeles, CA, USA, 2022. [Google Scholar]
- Giessow, J.; Casanova, J.; Leclerc, R.; MacArthur, R.; Fleming, G.; Giessow, J. Arundo Donax (Giant Reed): Distribution and Impact Report; California Invasive Plant Council (Cal-IPC): Berkeley, CA, USA, 2011; pp. 1–240. [Google Scholar]
- Kiss, T.; Nagy, J.; Fehérváry, I.; Vaszkó, C. (Mis) management of floodplain vegetation: The effect of invasive species on vegetation roughness and flood levels. Sci. Total Environ. 2019, 686, 931–945. [Google Scholar] [CrossRef]
- Douglas, I.; Alam, K.; Maghenda, M.; Mcdonnell, Y.; Mclean, L.; Campbell, J. Unjust waters: Climate change, flooding and the urban poor in Africa. Environ. Urban. 2008, 20, 187–205. [Google Scholar] [CrossRef]
- Stover, J.E.; Keller, E.A.; Dudley, T.L.; Langendoen, E.J. Fluvial geomorphology, root distribution, and tensile strength of the invasive giant reed, Arundo donax and its role on stream bank stability in the Santa Clara River, Southern California. Geosciences 2018, 8, 304. [Google Scholar] [CrossRef]
- Coffman, G.C. Factors Influencing Invasion of Giant reed (Arundo Donax) in Riparian Ecosystems of Mediterranean-Type Climate Regions; Diss. University of California: Los Angeles, CA, USA, 2007. [Google Scholar]
- Smith, D.; Queally, J.; Molina, G. 24 fires a day: Surge in flames at LA homeless encampments a growing crisis. Los Angeles Times, 12 May 2021. [Google Scholar]
- Cook, C.D.K. Aquatic Plant Book; SPB Academic Publishing: Amsterdam, The Netherlands, 1990. [Google Scholar]
- DiTomaso, J.M.; Healy, E.A. Aquatic and Riparian Weeds of the West; UCANR Publications: Ontario, CA, USA, 2003; Volume 3421. [Google Scholar]
- Perdue, R.E. Arundo donax—Source of musical reeds and industrial cellulose. Econ. Bot. 1958, 12, 368–404. [Google Scholar] [CrossRef]
- Coffman, G.C.; Ambrose, R.F.; Rundel, P.W. Wildfire promotes dominance of invasive giant reed (Arundo donax) in riparian ecosystems. Biol. Invasions 2010, 12, 2723–2734. [Google Scholar] [CrossRef]
- California Invasive Plant Council, Arundo donax Distribution and Impact Report. 2011. Available online: https://www.cal-ipc.org/wp-content/uploads/2017/11/Arundo_Distribution_Impact_Report_Cal-IPC_March-2011_small.pdf (accessed on 24 April 2022).
- Minnich, R.A. Chaparral fire history in San Diego County and adjacent northern Baja California: An evaluation of natural fire regimes and the effects of suppression management. In The California Chaparral: Paradigms Reexamined; Natural History Museum: Los Angeles, CA, USA, 1989; pp. 37–47. [Google Scholar]
- Brooks, M.L. Alien annual grasses and fire in the Mojave Desert. Madroño 1999, 46, 13–19. [Google Scholar]
- Iverson, M.E.; Jackson, N.E.; Frandsen, P.; Douthit, S. The impact of Arundo donax on water resources. In Proceedings of Arundo Donax Workshop; Jackson, N.E., Frandsen, P., Douthit, S., Eds.; UCANR: Ontario, CA, USA, 1993; Volume 19. [Google Scholar]
- Kinoshita, A.M.; Mladenov, N.; Lambert, J.; Zink, T. Restoration of Alvarado Creek Upper Reach 1; unpublished; San Diego State University: San Diego, CA, USA, 2022. [Google Scholar]
- Stromberg, J.C. Restoration of riparian vegetation in the south-western United States: Importance of flow regimes and fluvial dynamism. J. Arid. Environ. 2001, 49, 17–34. [Google Scholar] [CrossRef]
- Tabacchi, E.; Lambs, L.; Guilloy, H.; Planty-Tabacchi, A.-M.; Muller, E.; Décamps, H. Impacts of riparian vegetation on hydrological processes. Hydrol. Process. 2000, 14, 2959–2976. [Google Scholar] [CrossRef]
- Bren, L.J. Riparian zone, stream, and floodplain issues: A review. J. Hydrol. 1993, 150, 277–299. [Google Scholar] [CrossRef]
- Alkin, Q.; Kinoshita, A.M. A Case Study of Soil Moisture and Infiltration after an Urban Fire. Fire 2020, 3, 22. [Google Scholar] [CrossRef]
- Stromberg, J.C.; Beauchamp, V.B.; Dixon, M.D.; Lite, S.J.; Paradzick, C. Importance of low-flow and high-flow characteristics to restoration of riparian vegetation along rivers in arid south-western United States. Freshw. Biol. 2007, 52, 651–679. [Google Scholar] [CrossRef]
- Cortès, M.; Llasat, M.C.; Gilabert, J.; Llasat-Botija, M.; Turco, M.; Marcos, R.; Vide, J.P.M.; Falcón, L. Towards a better understanding of the evolution of the flood risk in Mediterranean urban areas: The case of Barcelona. Nat. Hazards 2017, 93, 39–60. [Google Scholar] [CrossRef]
- MESOWEST Station Interface. Available online: https://mesowest.utah.edu/cgi-bin/droman/meso_base_dyn.cgi?stn=D3640&unit=0&hours=24&time=GMT (accessed on 18 January 2022).
- US Department of Commerce, NOAA. PF Map: Contiguous Us, US Department of Commerce, National Oceanic and Atmospheric Administration, National Weather Service. Available online: https://hdsc.nws.noaa.gov/hdsc/pfds/pfds_map_cont.html (accessed on 7 November 2005).
- U.S. Geological Survey. 1 Meter Digital Elevation Models (DEMs)-USGS National Map 3DEP Downloadable Data Collection; U.S. Geological Survey: Reston, VA, USA, 2020. [Google Scholar]
- NLCD 2019 Land Cover (CONUS). Data | Multi-Resolution Land Characteristics (MRLC) Consortium. Available online: https://www.mrlc.gov/data?f%5B0%5D=category%3Aland+cover&f%5B1%5D=region%3Aconus (accessed on 20 November 2021).
- HEC-RAS Mapper User’s Manual-Version 6.1. Available online: https://www.hec.usace.army.mil/software/hec-ras/documentation/HEC-RAS_Mapper_User’s_Manual.pdf (accessed on 22 March 2022).
- Moriasi, D.N.; Zeckoski, R.W.; Arnold, J.G.; Baffaut, C.; Malone, R.W.; Daggupati, P.; Guzman, J.A.; Saraswat, D.; Yuan, Y.; Wilson, B.N.; et al. Hydrologic and water quality models: Key calibration and validation topics. Trans. ASABE 2015, 58, 1609–1618. [Google Scholar]
- David, A.; Schmalz, B. A systematic analysis of the interaction between rain-on-grid-simulations and spatial resolution in 2D hydrodynamic modeling. Water 2021, 13, 2346. [Google Scholar] [CrossRef]
- Janda-Timba, J. Individual Hydrologic & Hydraulic Assessment (IHHA) Report-Alvarado Channel (Upper Portion). Rick Eng. 2015. [Google Scholar]
- HEC-RAS Application Guide. Available online: https://www.hec.usace.army.mil/confluence/rasdocs/rasappguide/latest/mannings-n-calibration-example-24 (accessed on 15 April 2022).
- Berland, A.; Shiflett, S.A.; Shuster, W.D.; Garmestani, A.S.; Goddard, H.C.; Herrmann, D.L.; Hopton, M.E. The role of trees in urban stormwater management. Landsc. Urban Plan. 2017, 162, 167–177. [Google Scholar] [CrossRef]
- Rothacher, J. Does Harvest in West Slope Douglas-Fir Increase Peak Flow in Small Forest Streams? Pacific Northwest Forest and Range Experiment Station, US Department of Agriculture, Forest Service: Washington, DC, USA, 1973; Volume 163. [Google Scholar]
- Harr, R.D.; Harper, W.C.; Krygier, J.T.; Hsieh, F.S. Changes in storm hydrographs after road building and clear-cutting in the Oregon Coast Range. Water Resour. Res. 1975, 11, 436–444. [Google Scholar] [CrossRef]
- Tague, C.L.; Moritz, M.; Hanan, E. The changing water cycle: The eco-hydrologic impacts of forest density reduction in Mediterranean (seasonally dry) regions. WIREs Water 2019, 6, 1–11. [Google Scholar] [CrossRef]
- Jones, J.A. Hydrologic processes and peak discharge response to forest removal, regrowth, and roads in 10 small experimental basins, western Cascades, Oregon. Water Resour. Res. 2000, 36, 2621–2642. [Google Scholar] [CrossRef]
- Dan Moore, R.; Wondzell, S.M. Physical hydrology and the effects of forest harvesting in the Pacific Northwest: A review 1. JAWRA J. Am. Water Resour. Assoc. 2005, 41, 763–784. [Google Scholar] [CrossRef]
- Karr, J.R.; Schlosser, I.J. Water Resources and the Land-Water Interface: Water resources in agricultural watersheds can be improved by effective multidisciplinary planning. Science 1978, 201, 229–234. [Google Scholar] [CrossRef]
- Valdecantos, A.; Baeza, M.J.; Vallejo, V.R. Vegetation Management for Promoting Ecosystem Resilience in Fire-Prone Mediterranean Shrublands. Restor. Ecol. 2008. [Google Scholar] [CrossRef]
- Broadmeadow, S.; Nisbet, T.R. The effects of riparian forest management on the freshwater environment: A literature review of best management practice. Hydrol. Earth Syst. Sci. 2004, 8, 286–305. [Google Scholar] [CrossRef]
Publisher’s Note: MDPI stays neutral with regard to jurisdictional claims in published maps and institutional affiliations. |
© 2022 by the authors. Licensee MDPI, Basel, Switzerland. This article is an open access article distributed under the terms and conditions of the Creative Commons Attribution (CC BY) license (https://creativecommons.org/licenses/by/4.0/).