Growing Crops in Arid, Drought-Prone Environments: Adaptation and Mitigation
Abstract
:1. Introduction
2. Materials and Methods
2.1. Region of Study
2.2. Data Exploration and Interpretation
3. Results
3.1. Water Availability, Land Use and the Crop Mix
3.2. District’s Performance
3.2.1. Agronomical Performance: Crop Failures and Yields
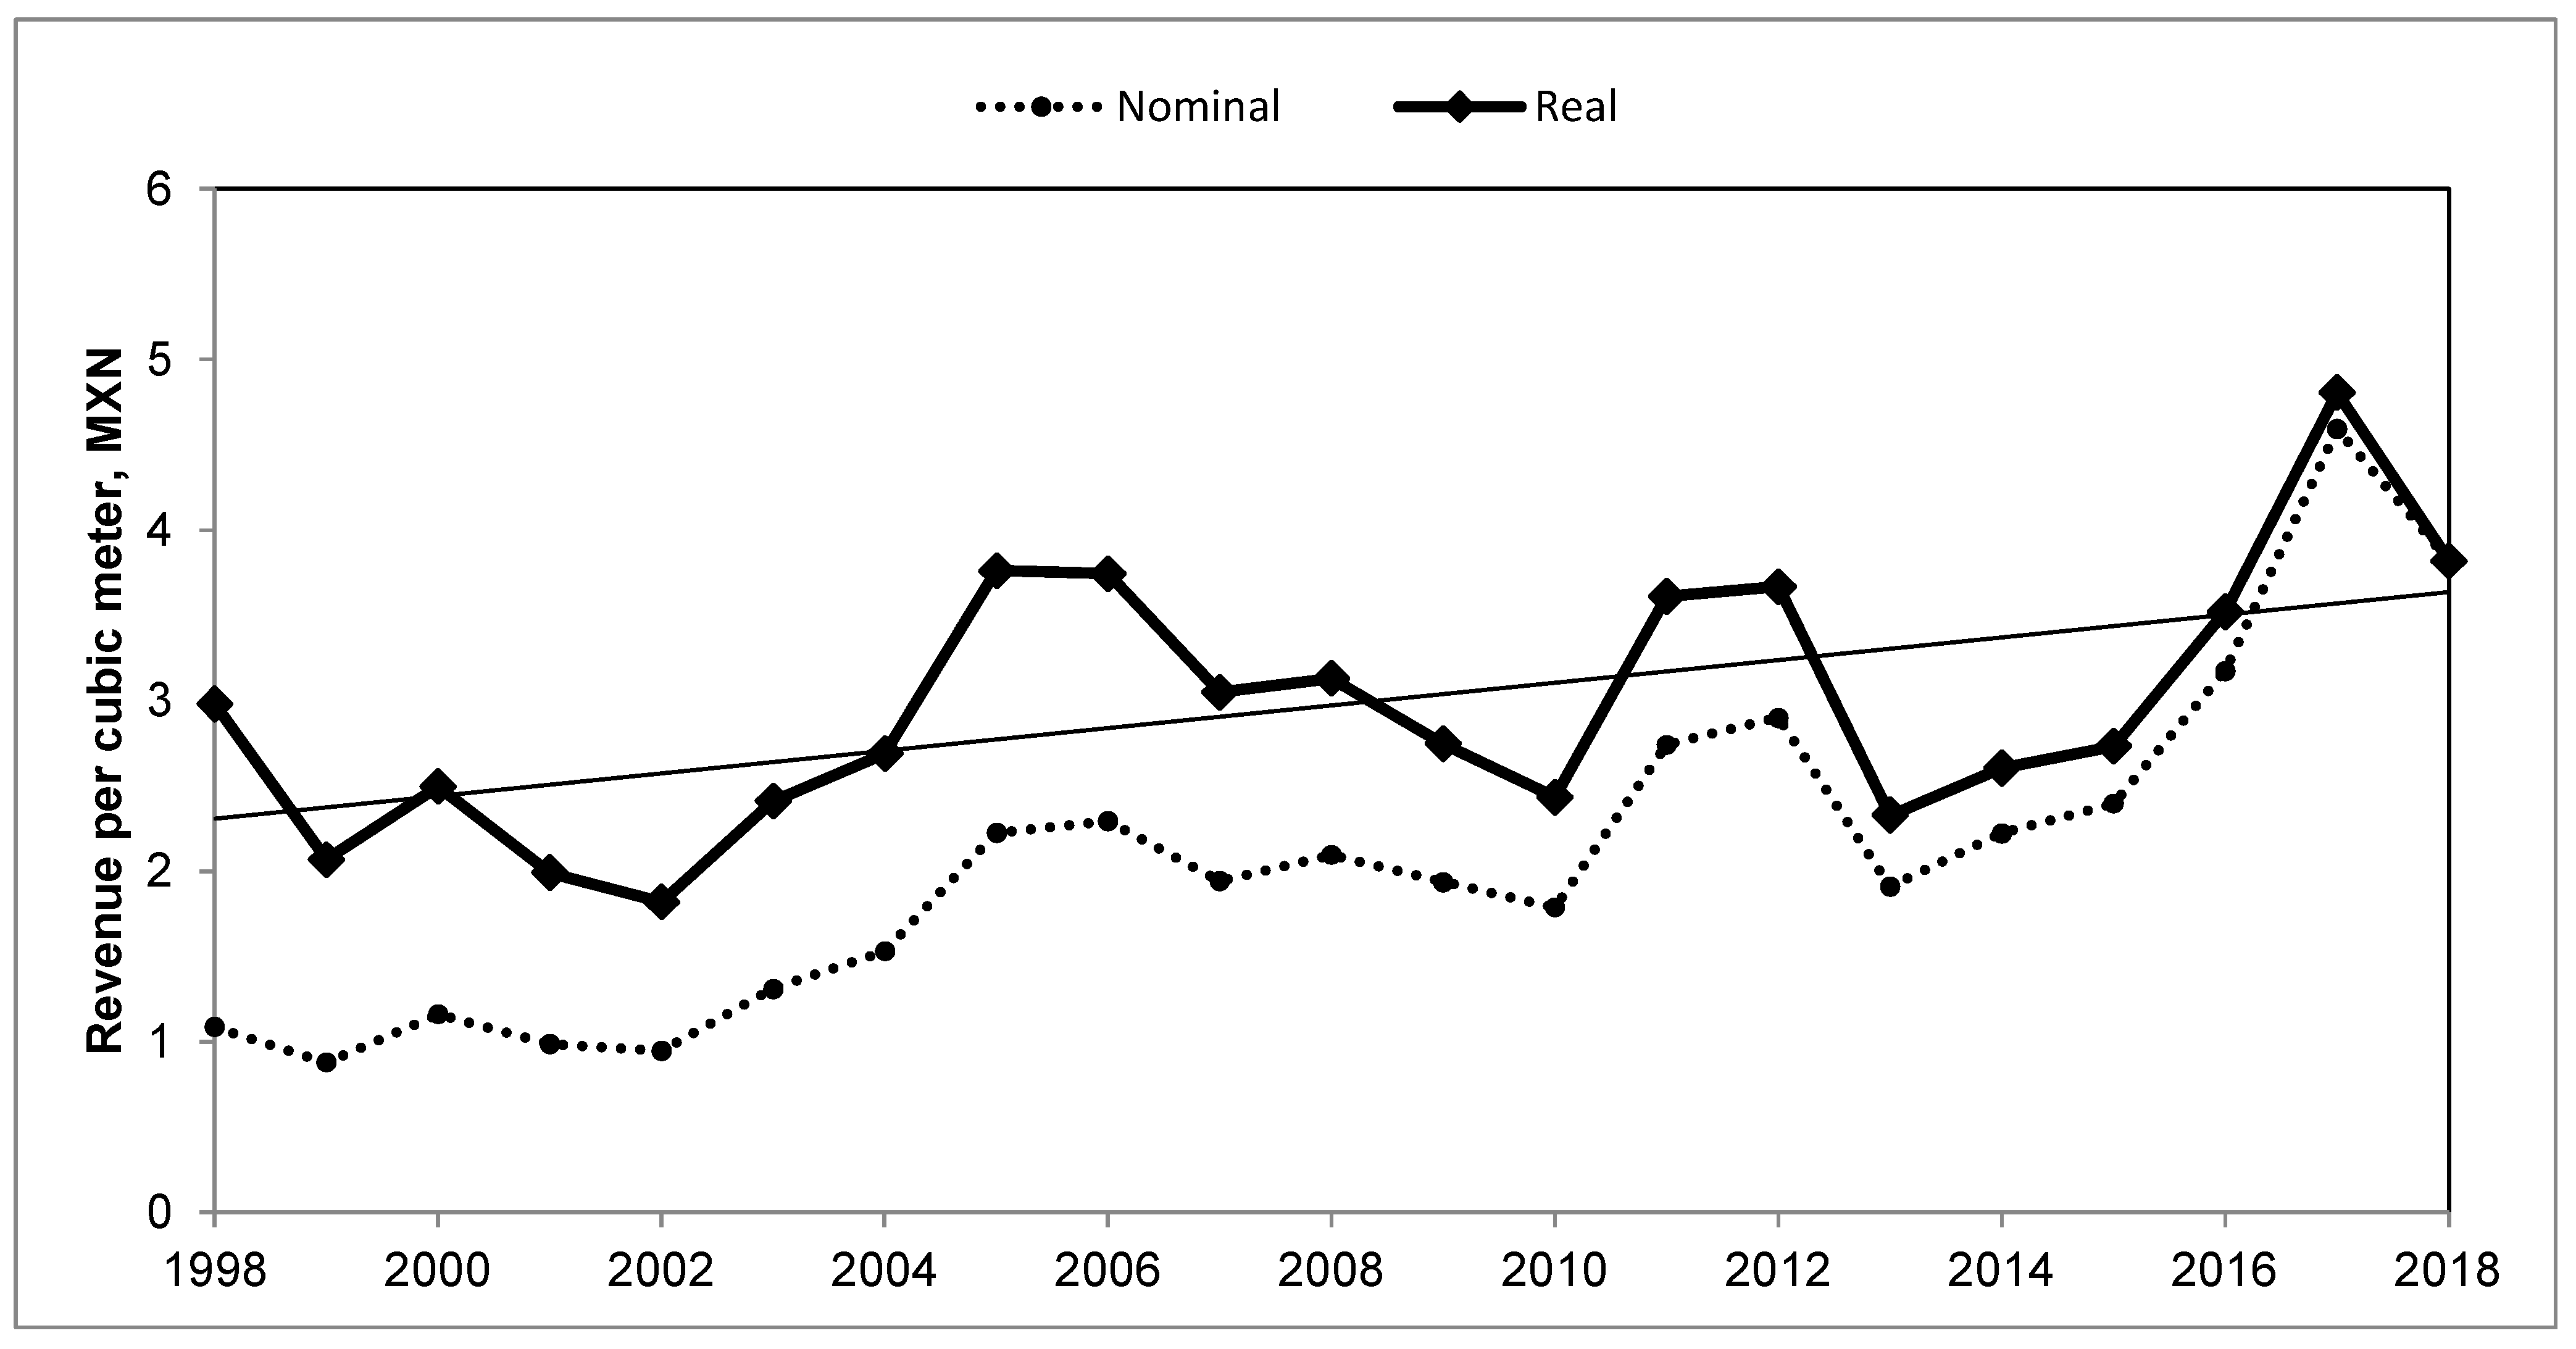
3.2.2. Economic Performance: Revenue per Hectare and Revenue per Unit of Water
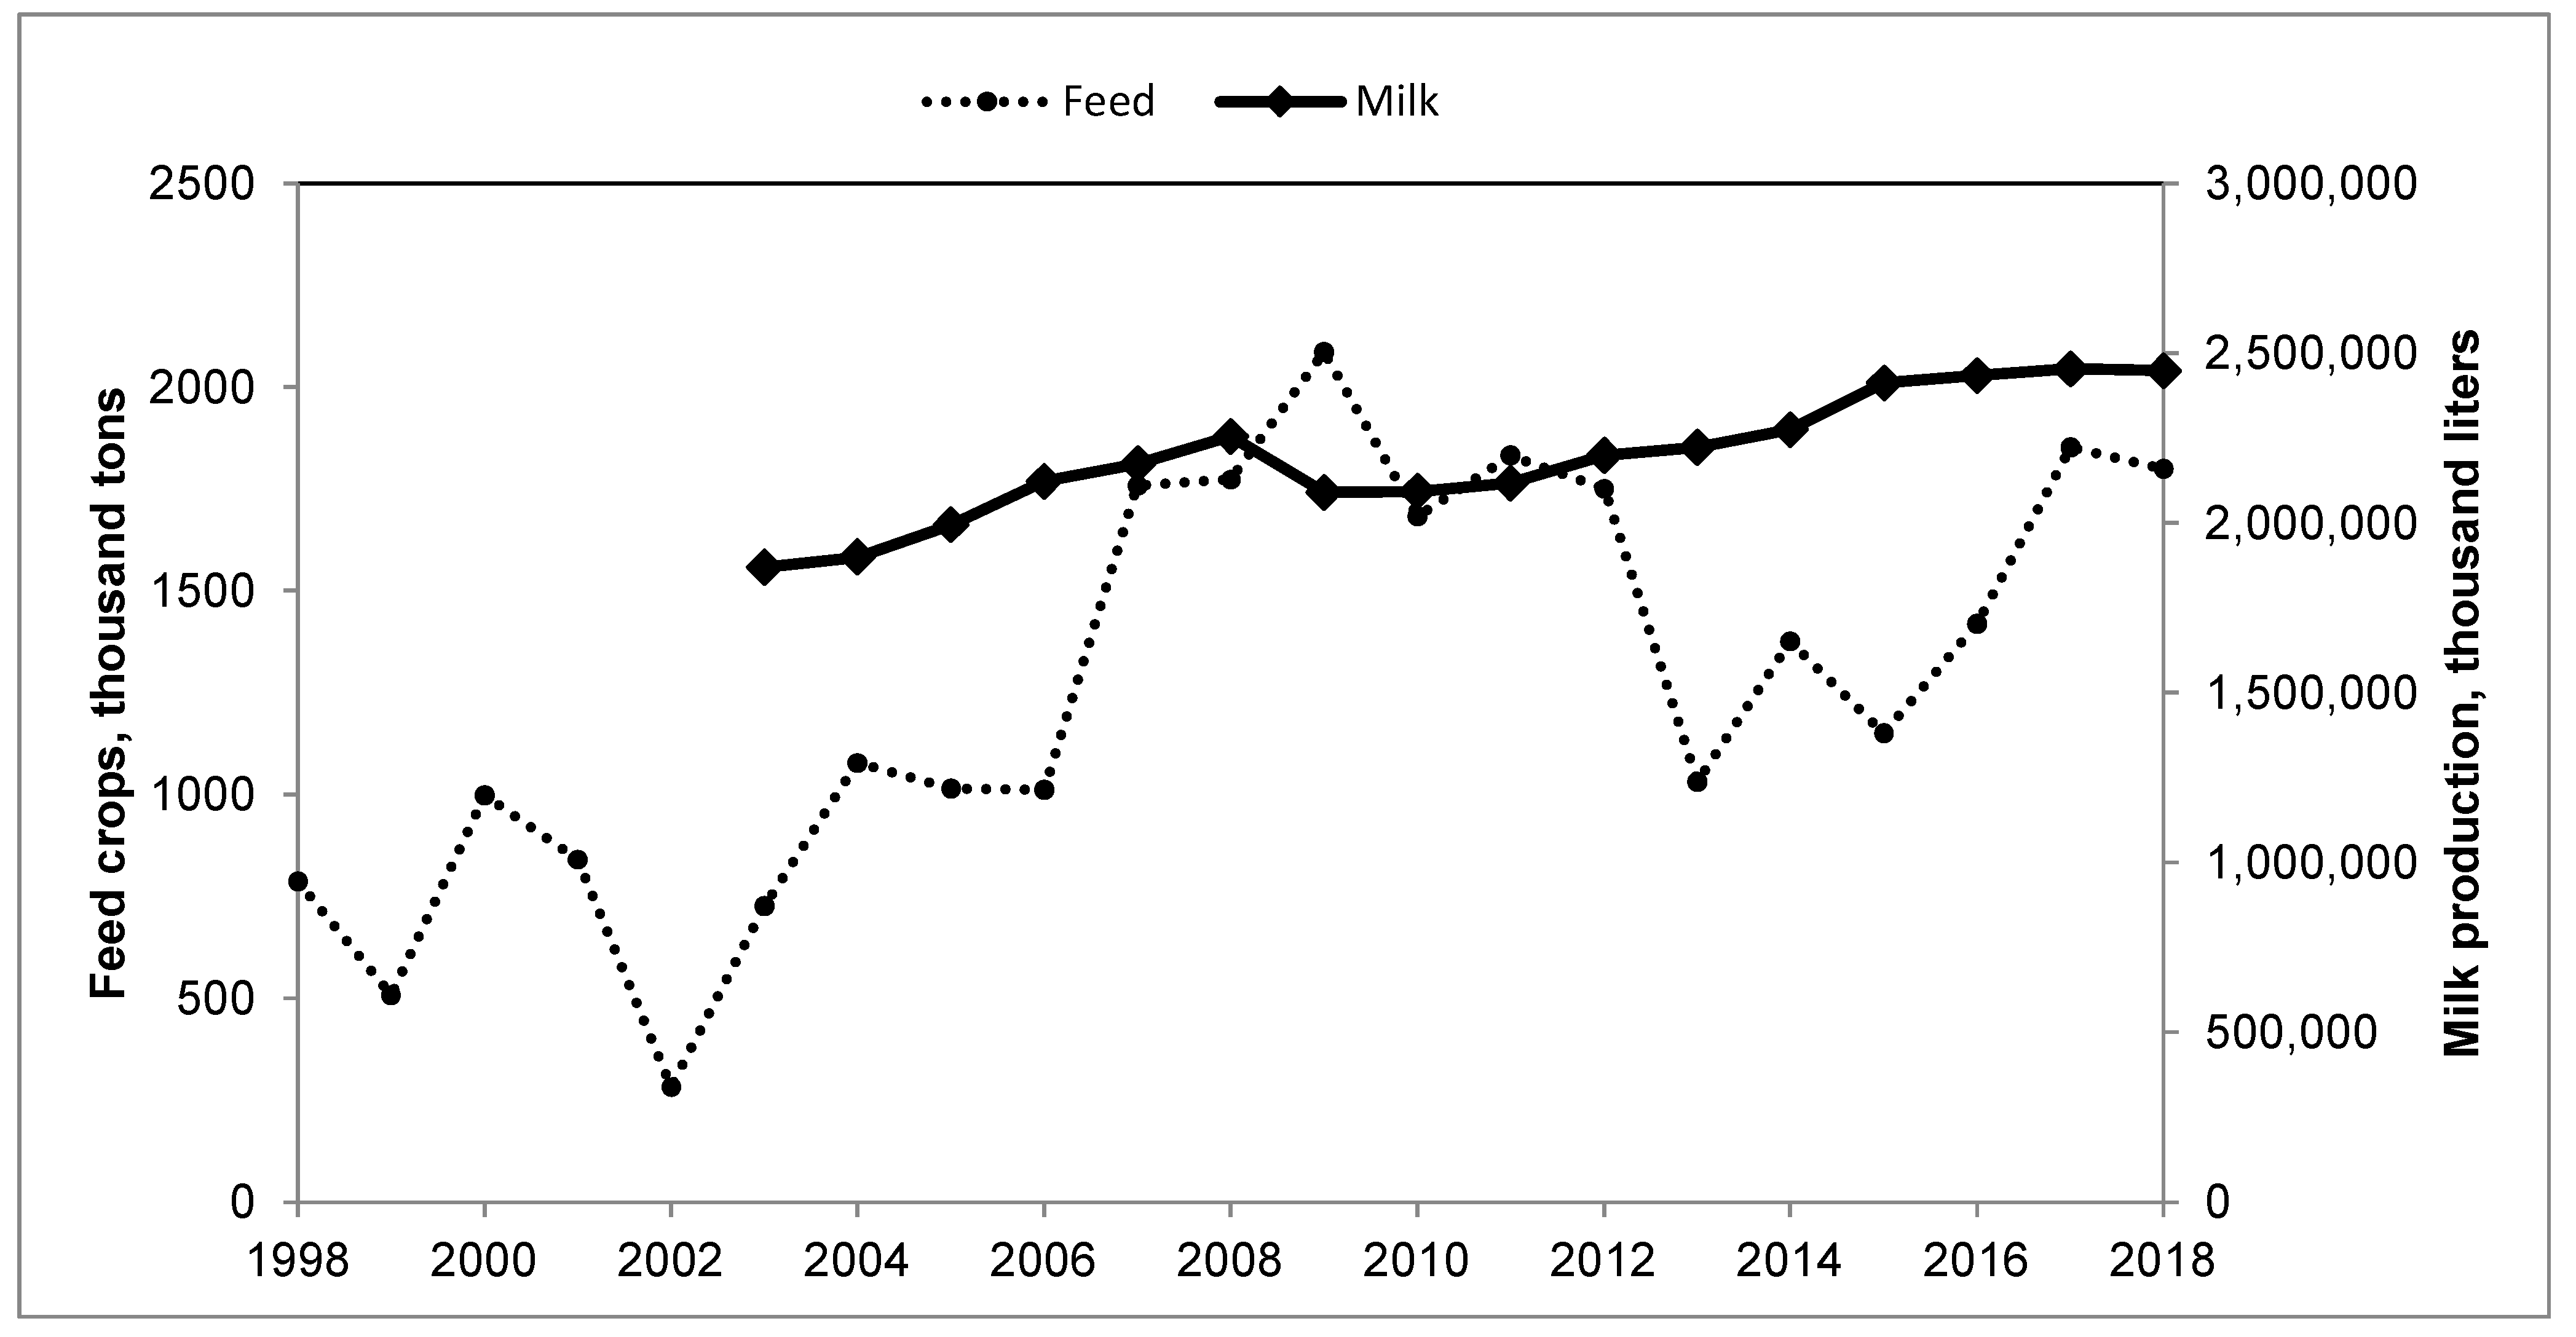
3.2.3. Impacts of Feed Output on the Regional Dairy and Meat Industries
4. Discussion and Conclusions
Author Contributions
Funding
Institutional Review Board Statement
Informed Consent Statement
Data Availability Statement
Acknowledgments
Conflicts of Interest
Appendix A. Data with Annotations
| A | B | C | D | E | F | G | H | I | |||||||||||||||||||||
| Water (Millions of m3) | Land (Hectares) | Irrigation (cm) | |||||||||||||||||||||||||||
| Reservoir | Distributed | Irrigated | Excess | Capacity | Seasonal | Perennial | |||||||||||||||||||||||
| 1998 | 1151.70 | 848.92 | 49,372 | 22,628 | 72,000 | 40,883 | 8489 | 171.9 | |||||||||||||||||||||
| 1999 | 594.80 | 326.62 | 21,028 | 50,972 | 72,000 | 14,679 | 6349 | 155.3 | |||||||||||||||||||||
| 2000 | 981.80 | 667.65 | 40,588 | 31,412 | 72,000 | 31,211 | 9377 | 164.5 | |||||||||||||||||||||
| 2001 | 844.60 | 624.00 | 32,639 | 39,361 | 72,000 | 23,241 | 9398 | 191.2 | |||||||||||||||||||||
| 2002 | 547.60 | 251.65 | 12,378 | 59,622 | 72,000 | 7593 | 4785 | 203.3 | |||||||||||||||||||||
| 2003 | 743.70 | 506.45 | 30,685 | 41,315 | 72,000 | 24,187 | 6498 | 165.0 | |||||||||||||||||||||
| 2004 | 1255.10 | 832.08 | 47,668 | 24,332 | 72,000 | 39,175 | 8493 | 174.6 | |||||||||||||||||||||
| 2005 | 1742.60 | 715.13 | 52,192 | 19,808 | 72,000 | 43,625 | 8567 | 137.0 | |||||||||||||||||||||
| 2006 | 1485.60 | 715.13 | 50,572 | 21,428 | 72,000 | 41,970 | 8602 | 141.4 | |||||||||||||||||||||
| 2007 | 2536.80 | 945.22 | 66,599 | 5401 | 72,000 | 56,568 | 10,031 | 141.9 | |||||||||||||||||||||
| 2008 | 2137.80 | 944.32 | 57,683 | 14,317 | 72,000 | 48,352 | 9331 | 163.7 | |||||||||||||||||||||
| 2009 | 3126.15 | 1023.76 | 69,820 | 2180 | 72,000 | 57,956 | 11,864 | 146.6 | |||||||||||||||||||||
| 2010 | 2925.66 | 1100.00 | 71,573 | 427 | 72,000 | 59,166 | 12,407 | 153.7 | |||||||||||||||||||||
| 2011 | 2955.93 | 1148.52 | 71,964 | 36 | 72,000 | 59,530 | 12,434 | 159.6 | |||||||||||||||||||||
| 2012 | 1819.60 | 956.55 | 57,654 | 14,346 | 72,000 | 45,822 | 11,832 | 165.9 | |||||||||||||||||||||
| 2013 | 1341.35 | 600.00 | 31,721 | 40,279 | 72,000 | 22,431 | 9289 | 189.1 | |||||||||||||||||||||
| 2014 | 1817.93 | 796.11 | 47,845 | 24,155 | 72,000 | 36,390 | 11,456 | 166.4 | |||||||||||||||||||||
| 2015 | 1795.14 | 793.23 | 48,386 | 23,614 | 72,000 | 36,804 | 11,582 | 163.9 | |||||||||||||||||||||
| 2016 | 1764.85 | 799.62 | 49,835 | 22,165 | 72,000 | 39,171 | 10,664 | 160.5 | |||||||||||||||||||||
| 2017 | 1764.85 | 1036.01 | 64,173 | 7827 | 72,000 | 52,826 | 11,347 | 161.4 | |||||||||||||||||||||
| 2018 | 2918.99 | 1049.51 | 65,612 | 6388 | 72,000 | 53,325 | 12,287 | 160.0 | |||||||||||||||||||||
| Key (by Column) | |||||||||||||||||||||||||||||
| A | Year of observation | ||||||||||||||||||||||||||||
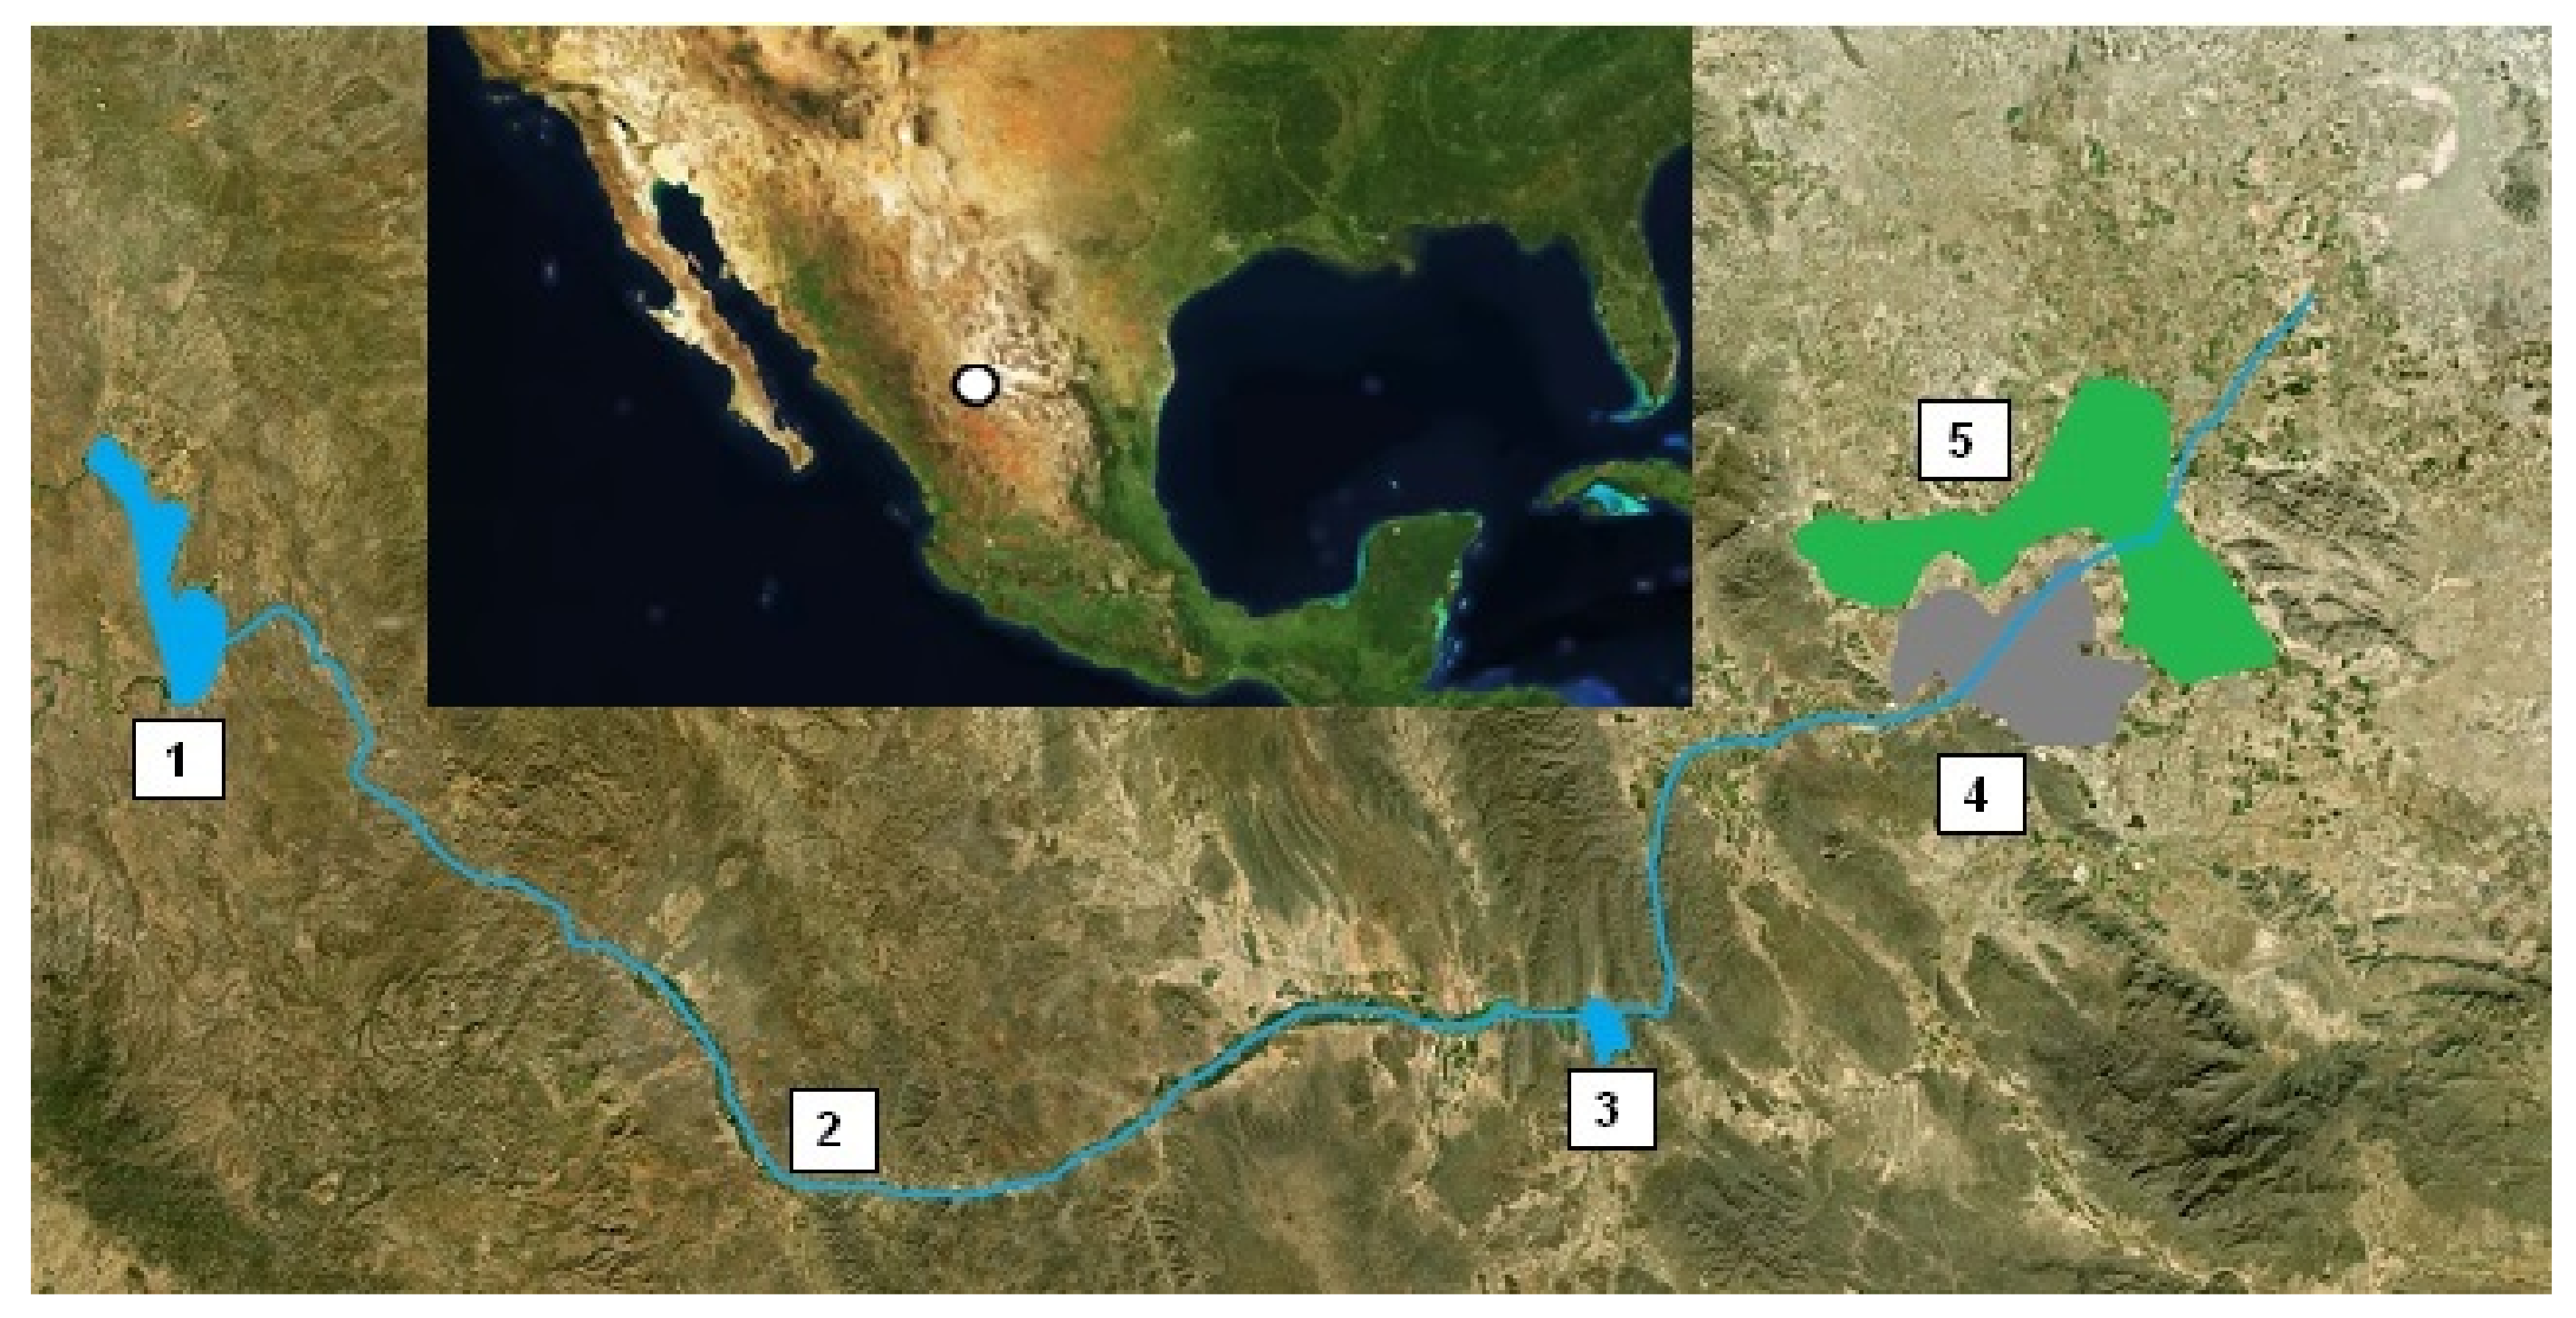
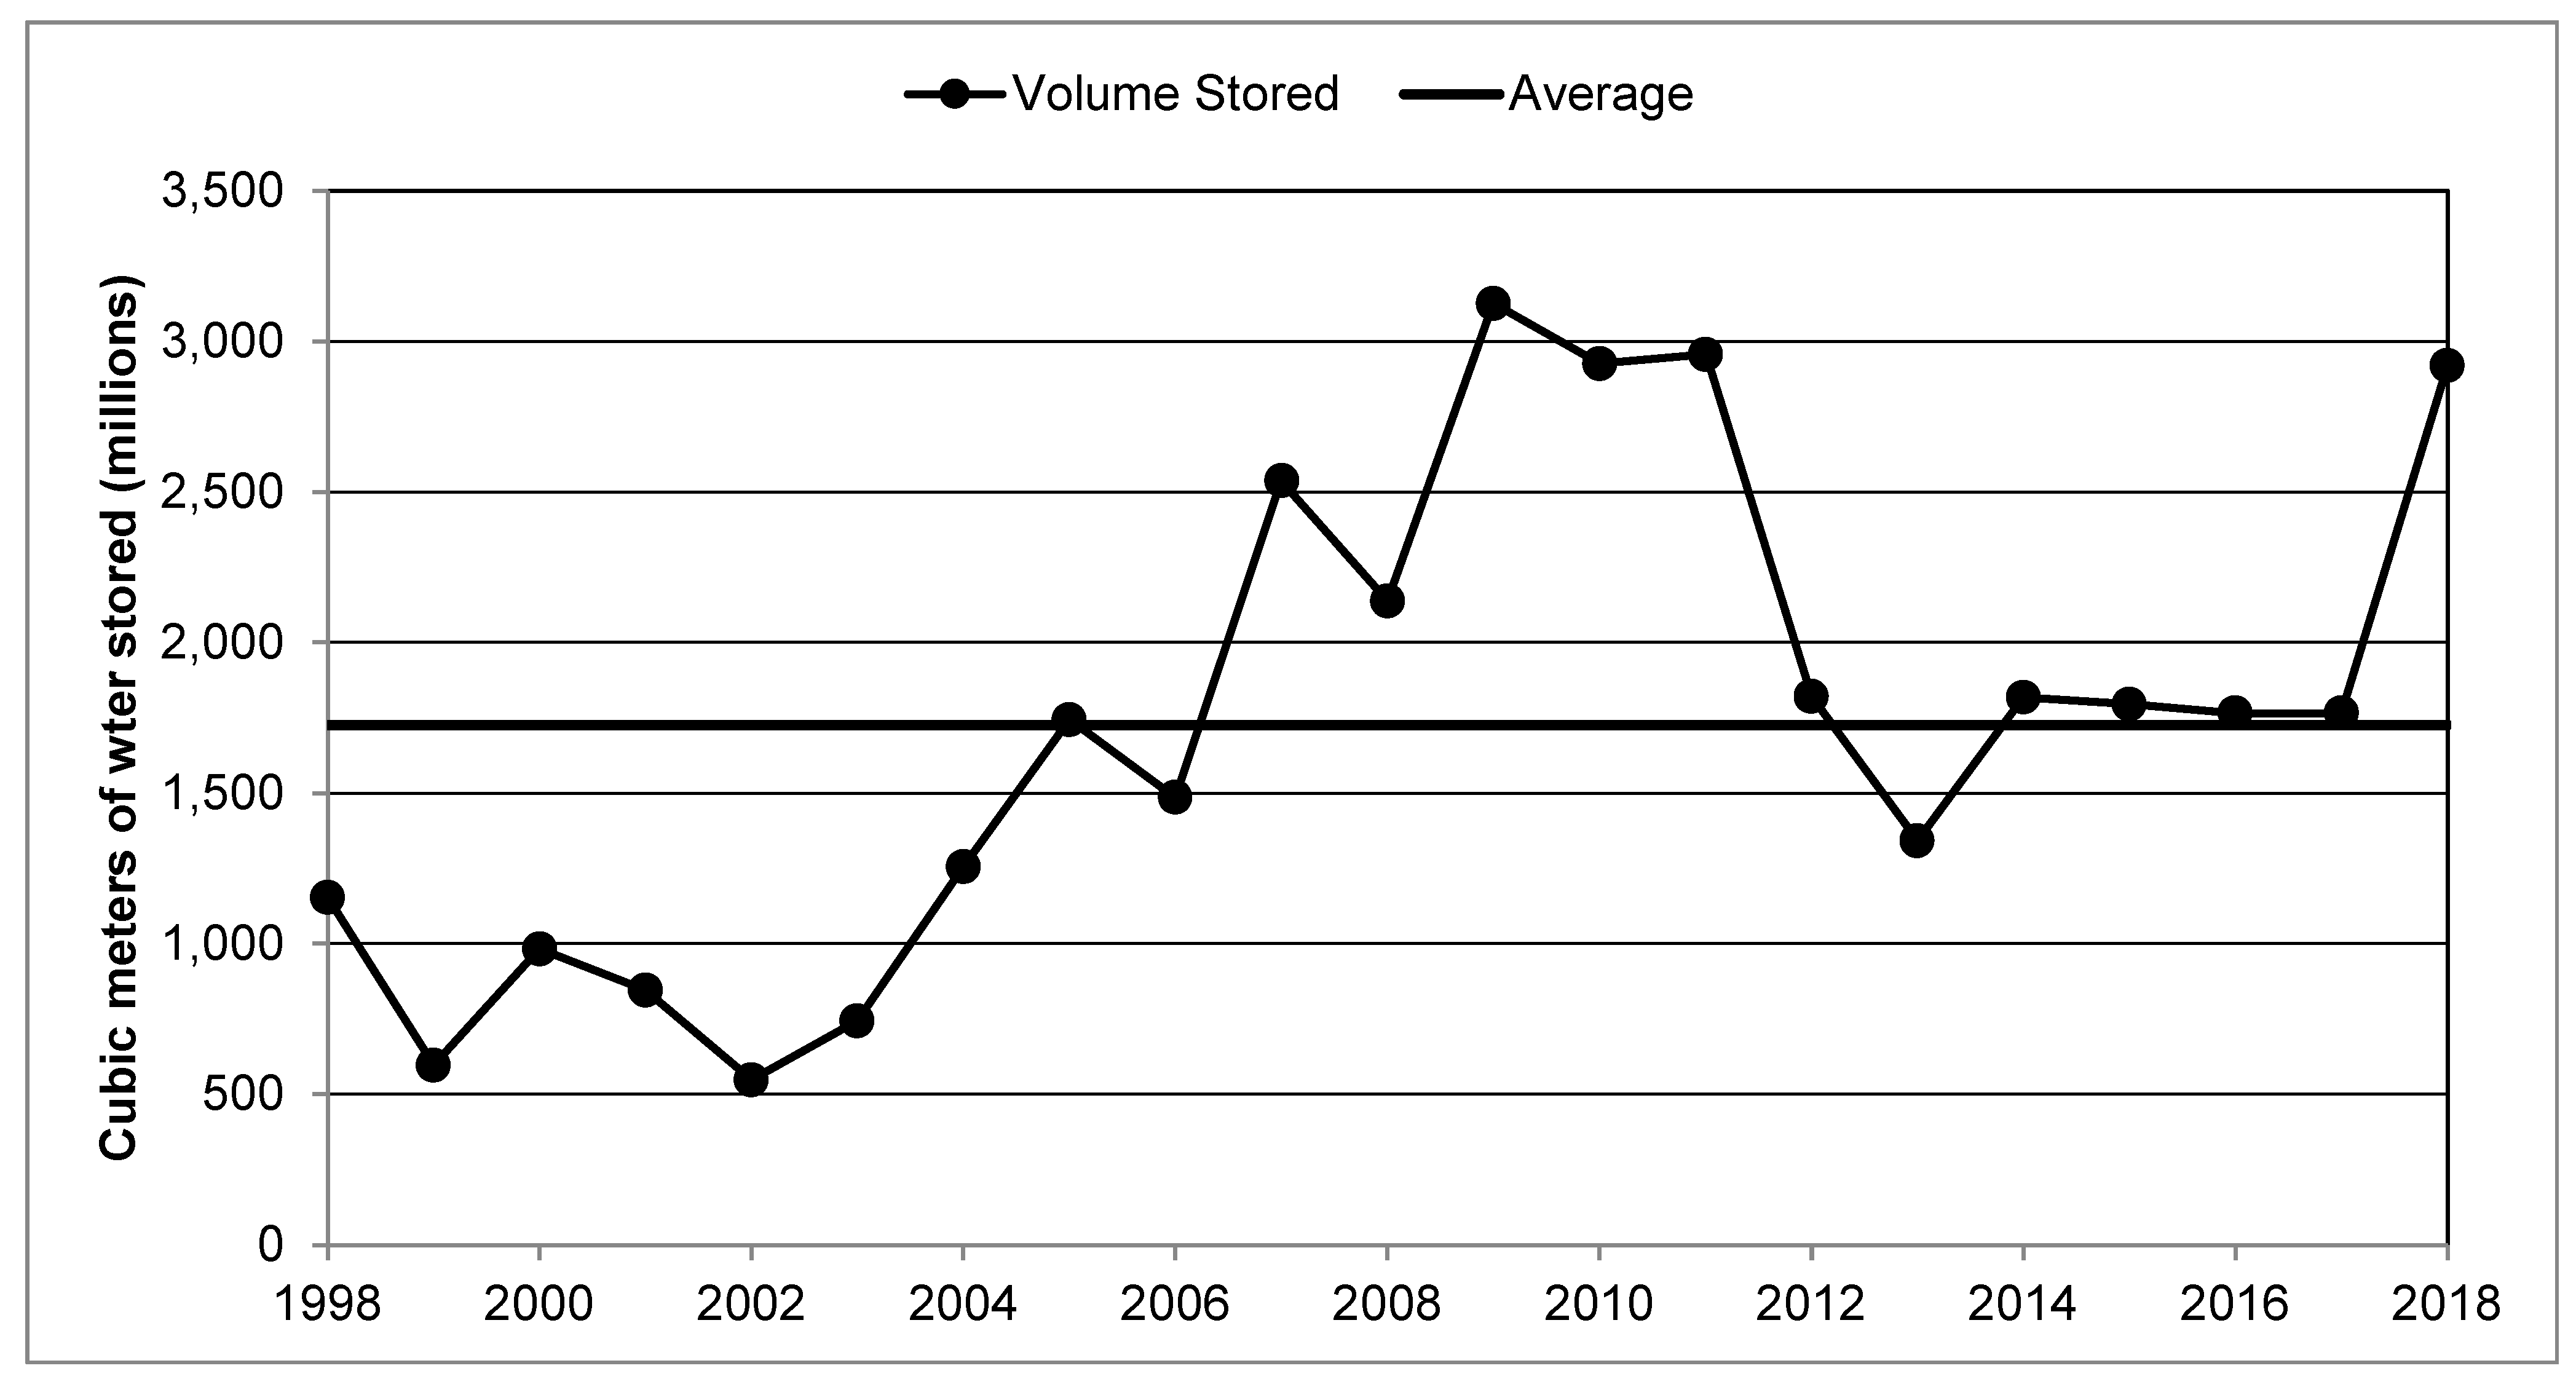
| B | Water stored at beginning of year, Lázaro Cárdenas dam/reservoir, million cubic meters (Figure 2) | ||||||||||||||||||||||||||||
| C | Water distributed to District 017, annually, million cubic meters (Figure 3) | ||||||||||||||||||||||||||||
| D,E,F | Surface of land irrigated, excess land (not cultivated), land capacity (maximum surface of irrigable land) (Figure 3) | ||||||||||||||||||||||||||||
| G | Surface of land irrigated, seasonal crops (Figure 4) | ||||||||||||||||||||||||||||
| H | Surface of land irrigated, seasonal crops (Figure 4) | ||||||||||||||||||||||||||||
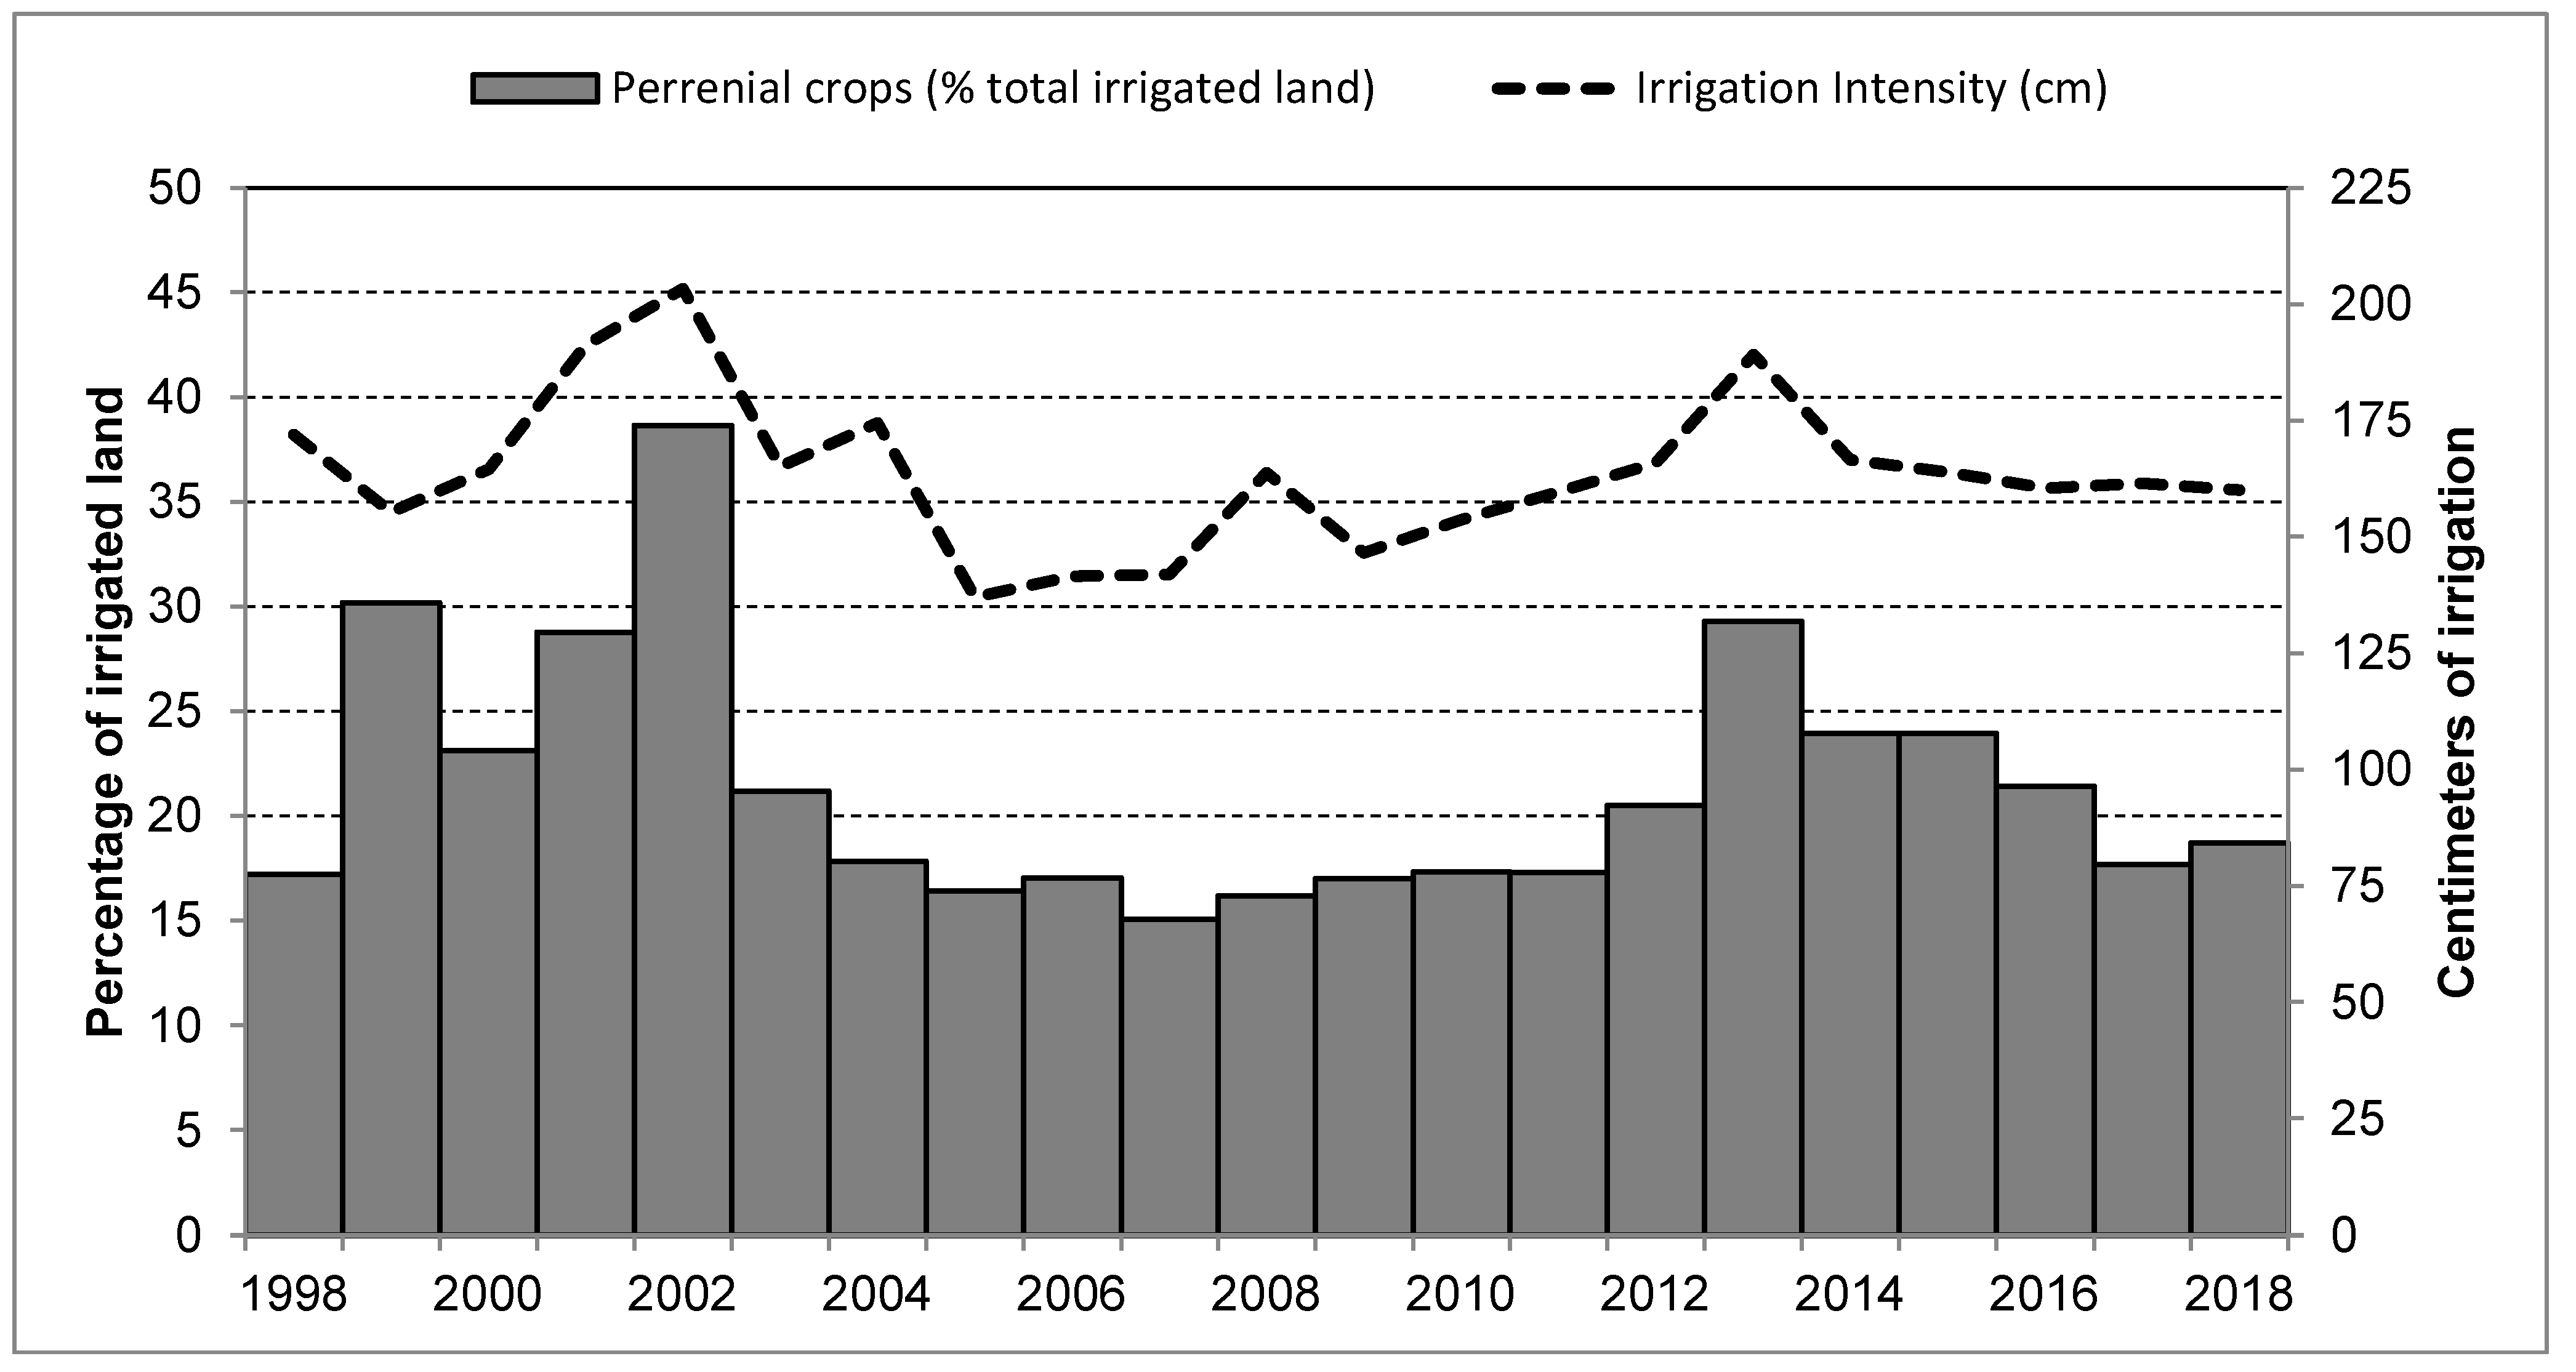
| I | Computed as: water distributed (Column C)/land irrigated (Column D), scaled in centimeters (Figure 5) | ||||||||||||||||||||||||||||
| J | K | L | M | N | O | P | Q | ||||||||||||||||||||||
| Perennial Crops (% Total Irrigated Land) | Yields (Tons per Hectare) | ||||||||||||||||||||||||||||
| Seasonal | Perennial | Cotton | Corn | Sorghum | Alfalfa | Walnut | |||||||||||||||||||||||
| 1998 | 17.2 | 30.56 | 27.18 | 5.20 | 42.99 | 47.40 | 55.29 | 2.13 | |||||||||||||||||||||
| 1999 | 30.2 | 31.82 | 29.01 | 5.16 | 45.00 | 47.40 | 55.16 | 1.58 | |||||||||||||||||||||
| 2000 | 23.1 | 32.11 | 26.55 | 5.06 | 43.64 | 45.19 | 51.00 | 1.87 | |||||||||||||||||||||
| 2001 | 28.8 | 25.11 | 29.97 | 5.01 | 42.43 | 31.40 | 54.90 | 1.44 | |||||||||||||||||||||
| 2002 | 38.7 | 32.16 | 28.12 | 5.11 | 46.42 | 51.49 | 47.71 | 1.93 | |||||||||||||||||||||
| 2003 | 21.2 | 35.84 | 30.77 | 4.94 | 45.83 | 50.61 | 53.38 | 1.78 | |||||||||||||||||||||
| 2004 | 17.8 | 32.80 | 33.08 | 5.52 | 47.14 | 53.03 | 50.63 | 1.42 | |||||||||||||||||||||
| 2005 | 16.4 | 27.22 | 32.54 | 4.96 | 44.44 | 47.47 | 53.77 | 1.78 | |||||||||||||||||||||
| 2006 | 17.0 | 26.36 | 24.57 | 2.41 | 44.06 | 50.18 | 47.15 | 0.84 | |||||||||||||||||||||
| 2007 | 15.1 | 35.01 | 23.26 | 4.77 | 44.90 | 57.79 | 39.18 | 1.63 | |||||||||||||||||||||
| 2008 | 16.2 | 34.24 | 33.46 | 4.87 | 51.20 | 50.05 | 58.62 | 1.94 | |||||||||||||||||||||
| 2009 | 17.0 | 26.51 | 44.73 | 4.92 | 35.40 | 44.10 | 73.95 | 2.01 | |||||||||||||||||||||
| 2010 | 17.3 | 21.18 | 38.28 | 5.02 | 44.94 | 46.70 | 70.00 | 1.80 | |||||||||||||||||||||
| 2011 | 17.3 | 20.69 | 38.37 | 5.02 | 45.09 | 46.57 | 70.00 | 1.80 | |||||||||||||||||||||
| 2012 | 20.5 | 26.16 | 24.30 | 4.90 | 45.07 | 48.23 | 44.86 | 2.11 | |||||||||||||||||||||
| 2013 | 29.3 | 29.47 | 19.28 | 4.40 | 45.00 | 55.24 | 36.40 | 2.12 | |||||||||||||||||||||
| 2014 | 23.9 | 30.36 | 17.09 | 4.30 | 38.36 | 51.77 | 28.68 | 1.60 | |||||||||||||||||||||
| 2015 | 23.9 | 21.80 | 47.56 | 3.09 | 43.58 | 48.96 | 76.33 | 1.71 | |||||||||||||||||||||
| 2016 | 21.4 | 24.00 | 42.90 | 4.30 | 45.70 | 42.80 | 63.10 | 1.80 | |||||||||||||||||||||
| 2017 | 17.7 | 20.10 | 44.10 | 3.50 | 41.30 | 50.80 | 69.00 | 1.10 | |||||||||||||||||||||
| 2018 | 18.7 | 13.70 | 48.30 | 4.00 | 36.70 | 41.70 | 69.00 | 1.50 | |||||||||||||||||||||
| Key (by Column) | |||||||||||||||||||||||||||||
| J | Percentage of irrigated land dedicated to perennial crops (Figure 5) | ||||||||||||||||||||||||||||
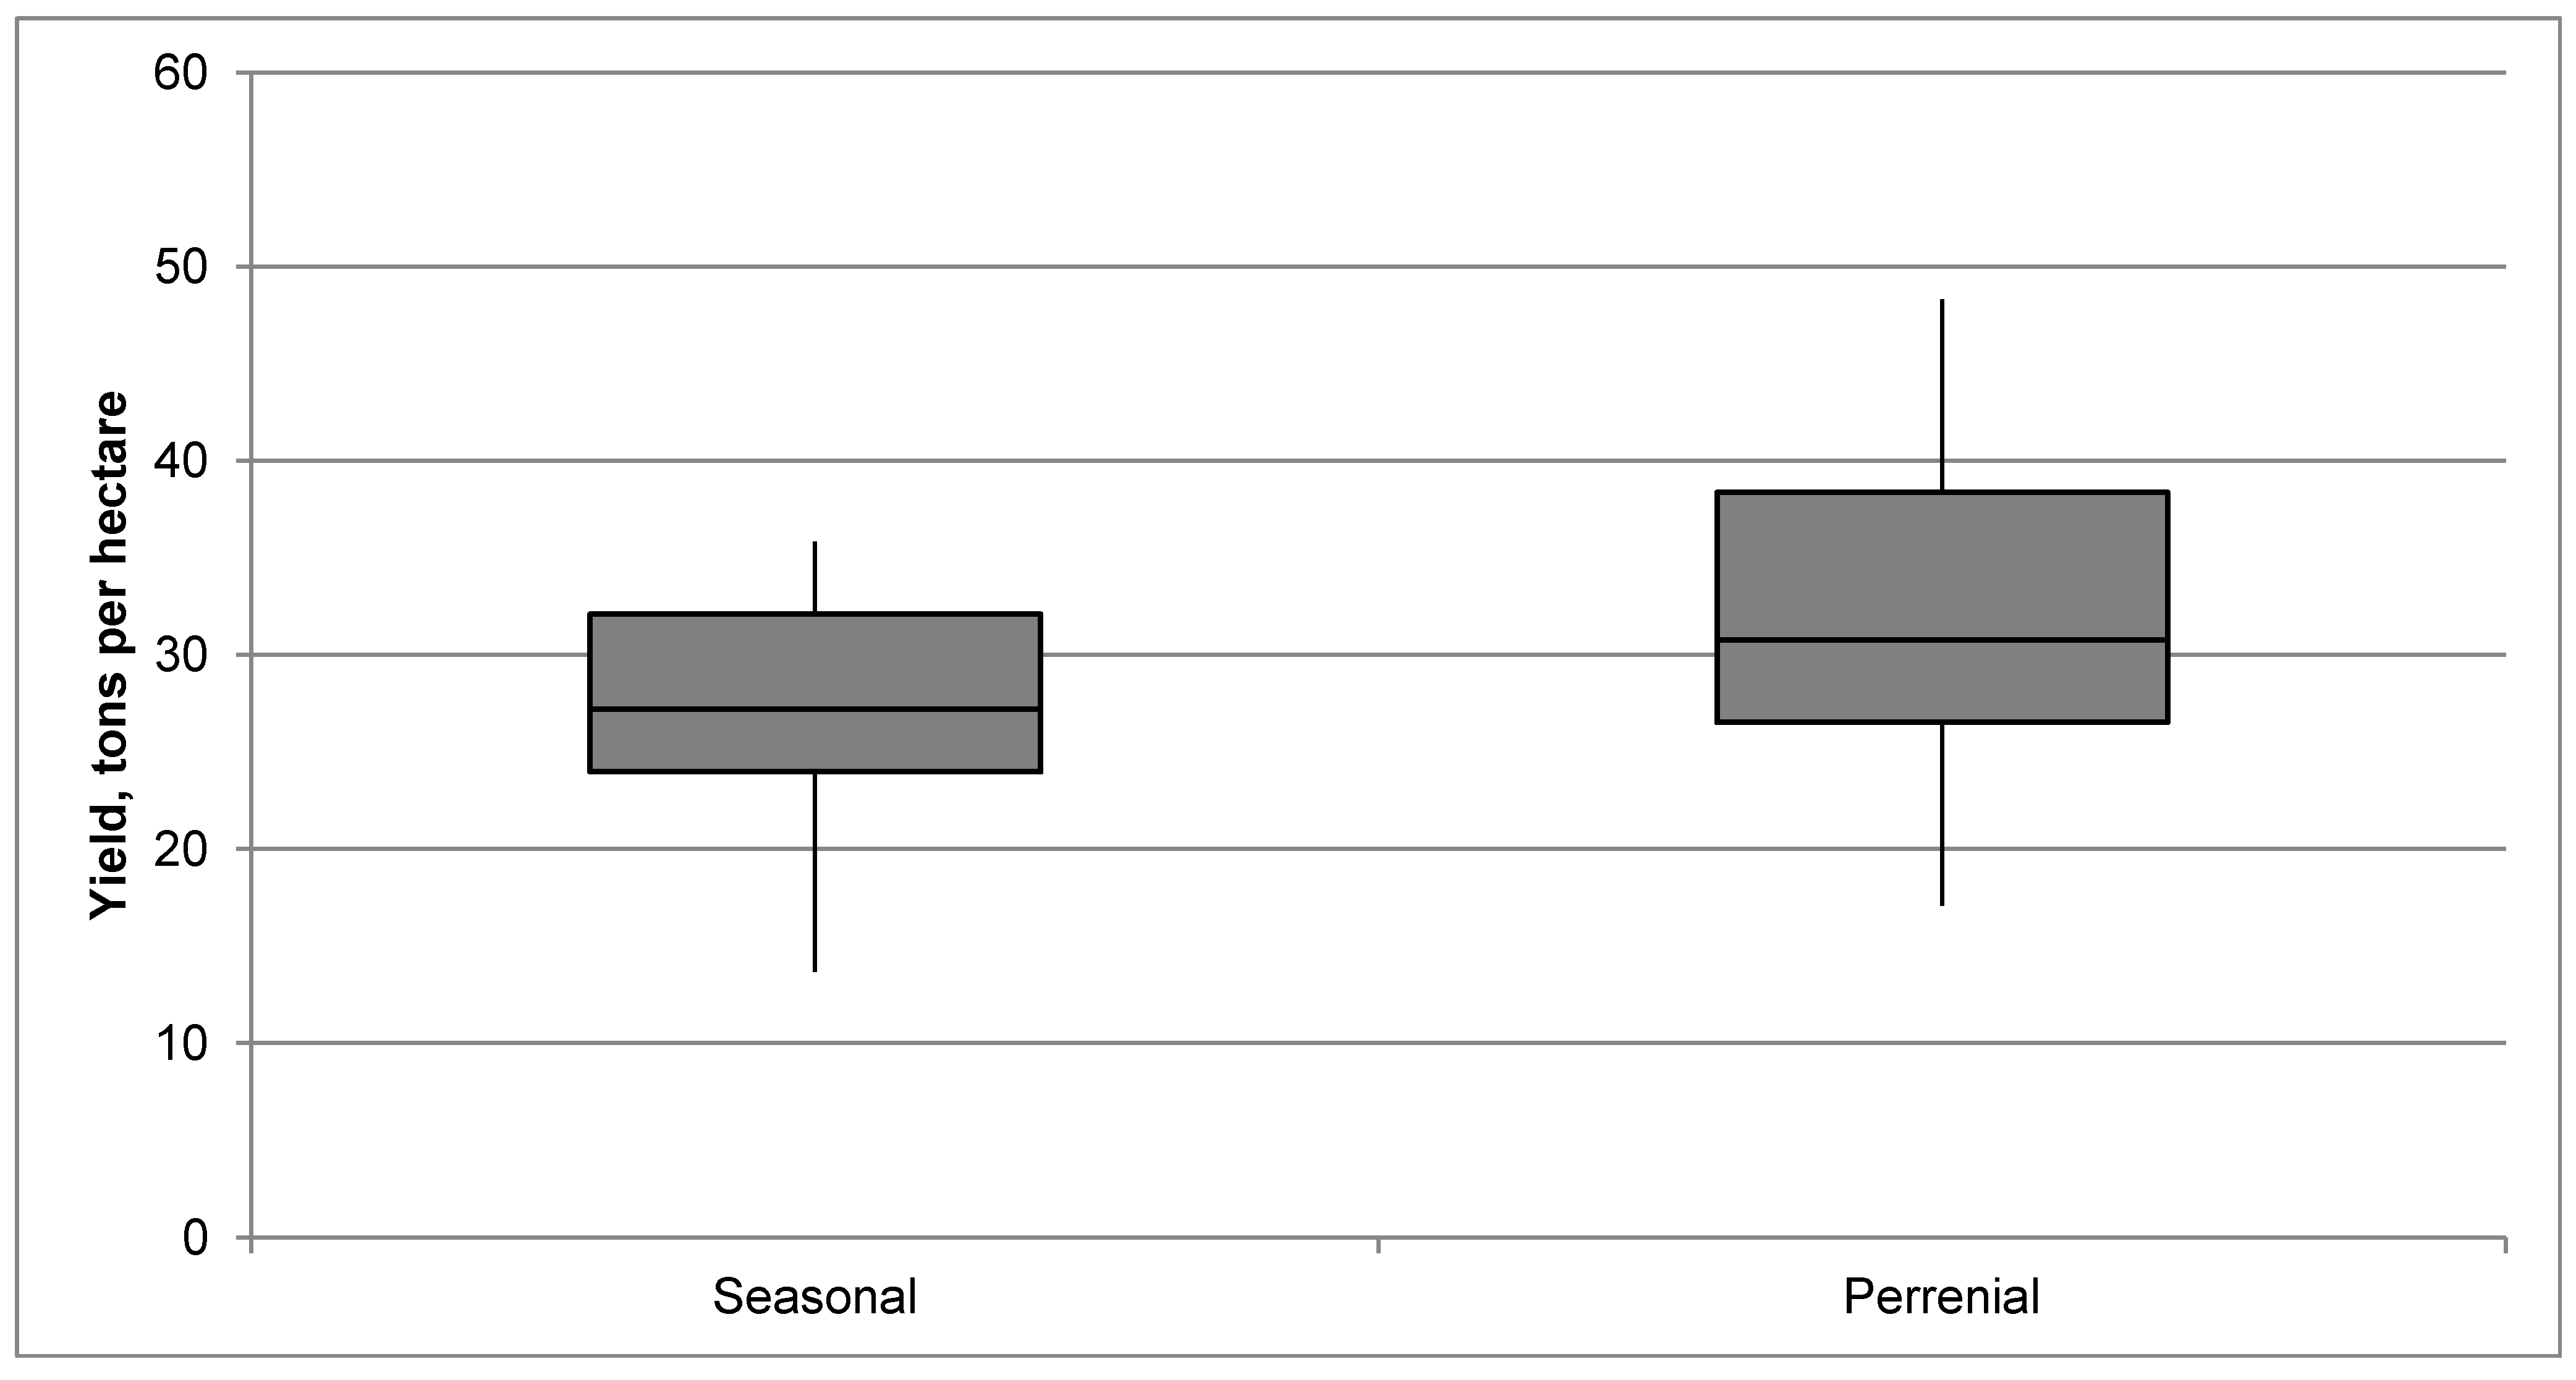
| K,L | Yield (tons of crop per hectare), for all seasonal and perennial crops, respectively (Figure 6) | ||||||||||||||||||||||||||||
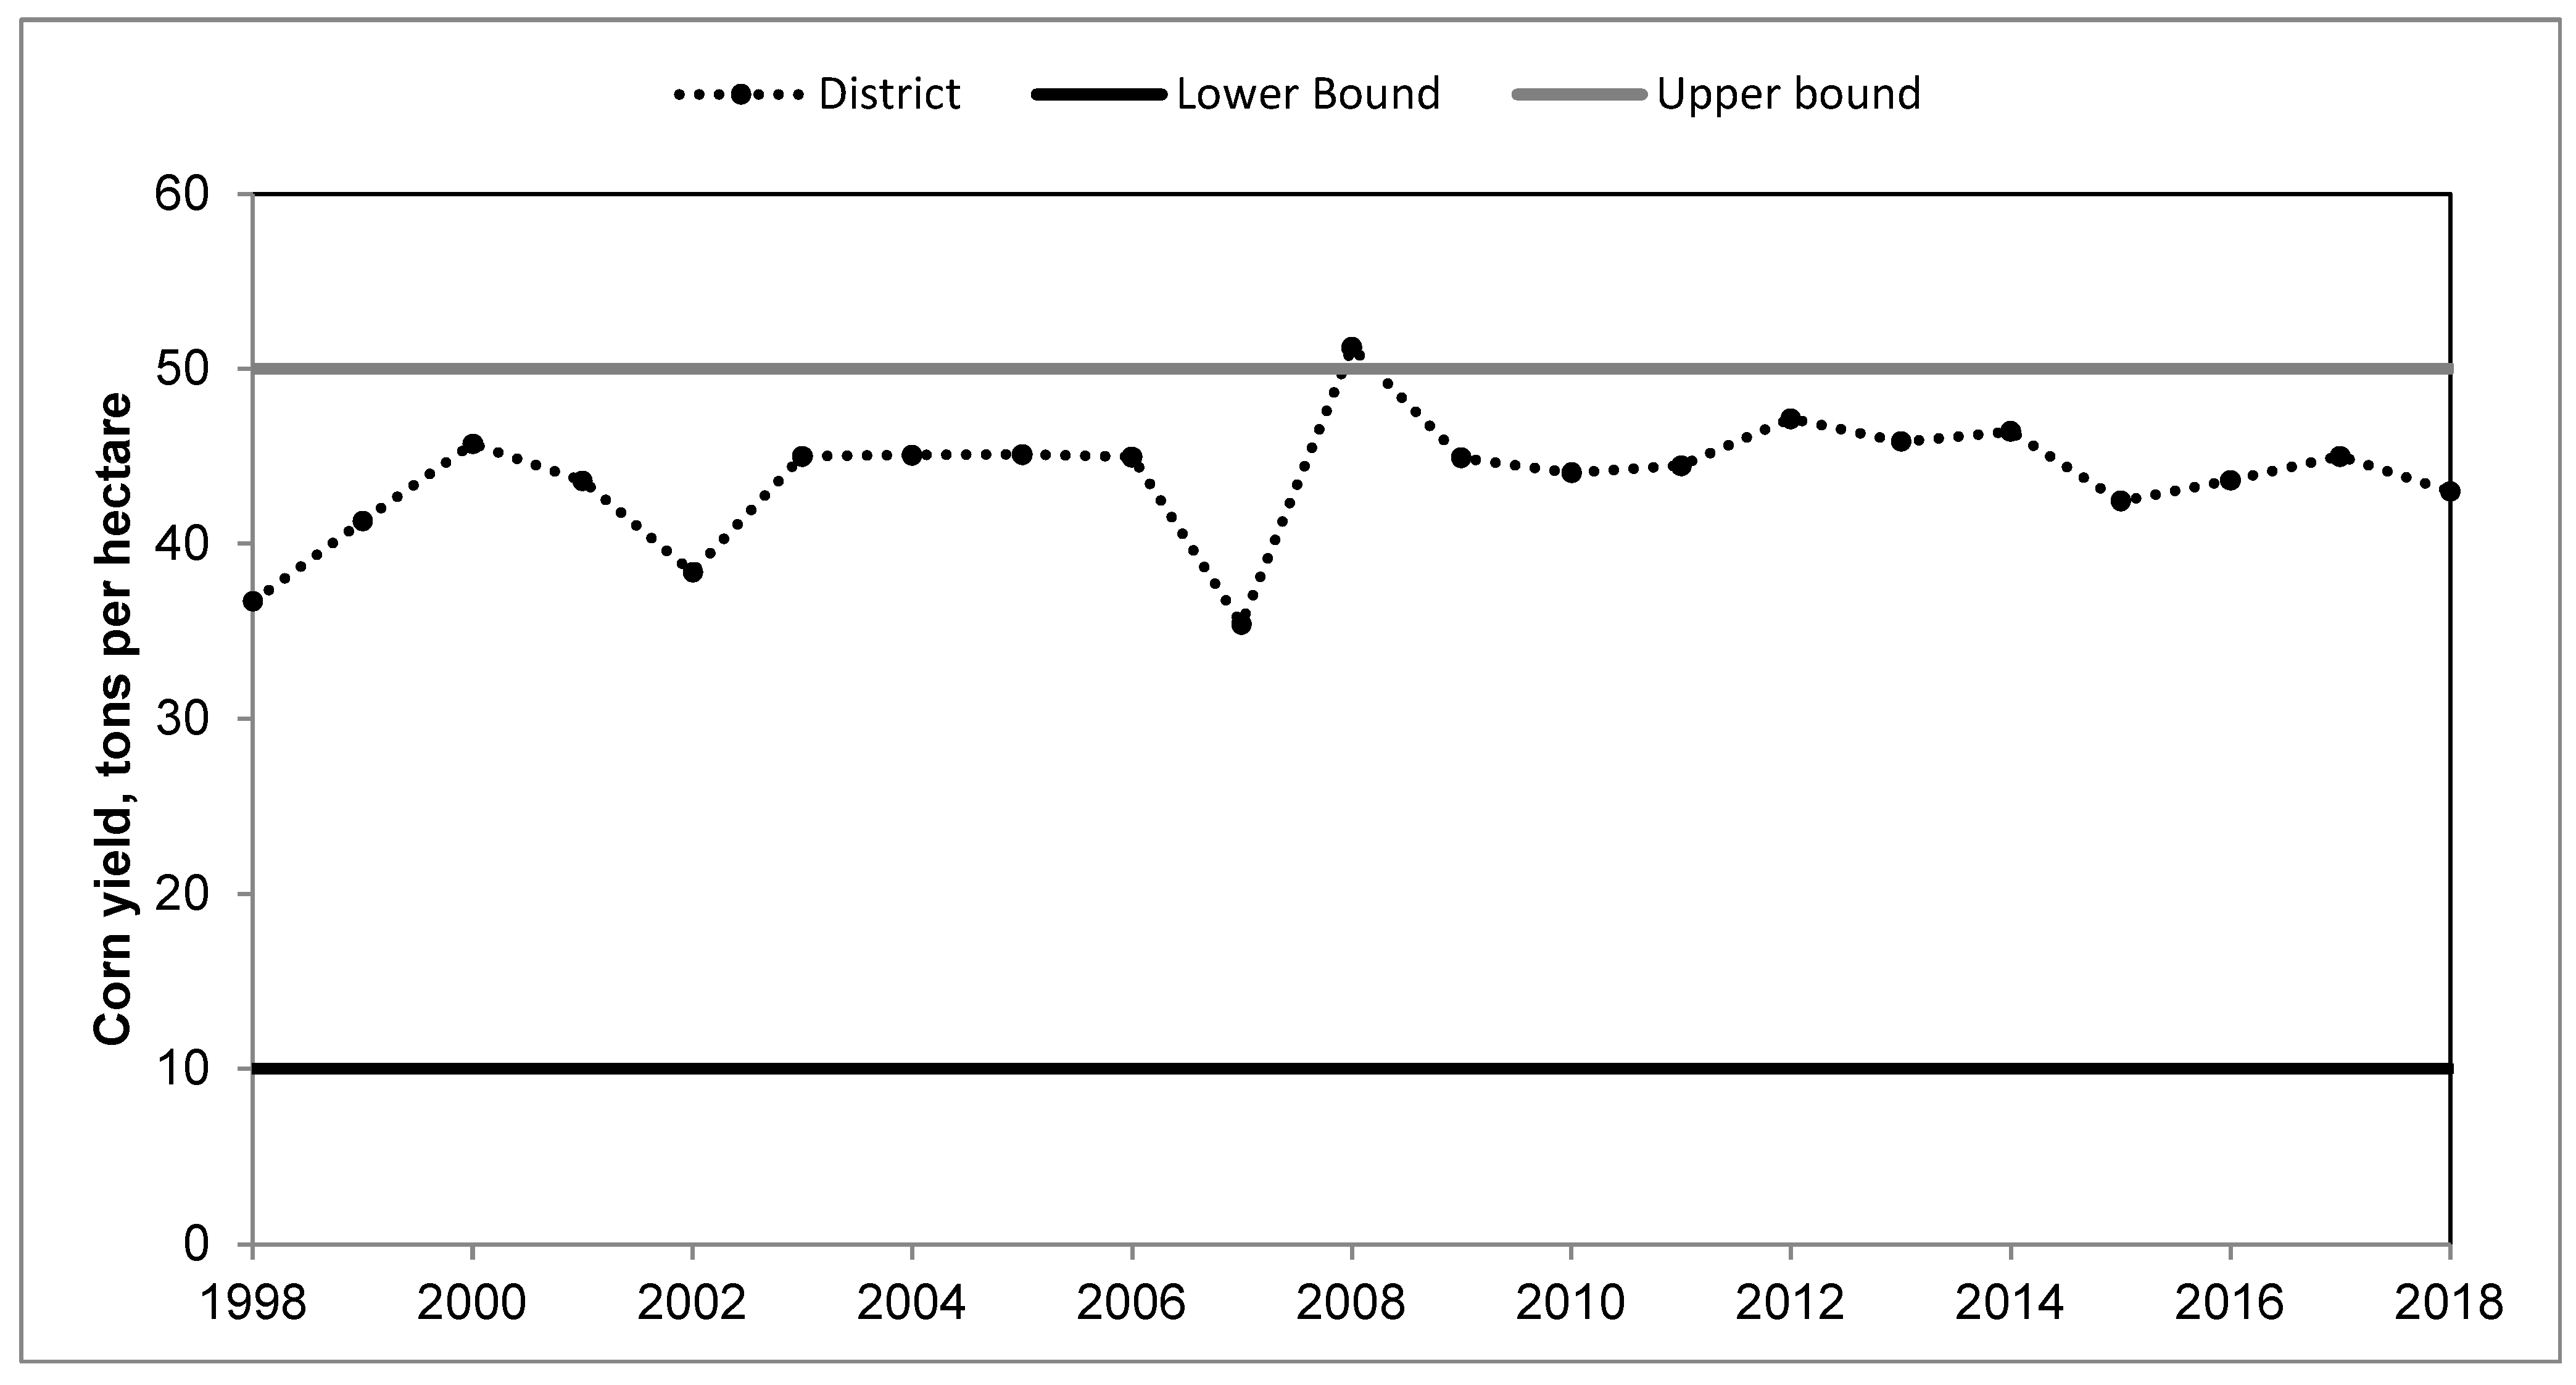
| M,N,O,P,Q | Yield (tons of crop per hectare), for the main seasonal crops (cotton, corn, sorghum) and main perennial crops (alfalfa, walnut) (Table 1; corn yields reported in Figure 9) | ||||||||||||||||||||||||||||
| R | S | T | U | V | W | X | Y | ||||||||||||||||||||||
| Prices (MXN per Ton of Crop) | Crop Failure (Hectares) | ||||||||||||||||||||||||||||
| Seasonal | Perennial | Cotton | Corn | Sorghum | Alfalfa | Walnut | |||||||||||||||||||||||
| 1998 | 1586 | 4268 | 13,802 | 800 | 750 | 795 | 85,000 | 549 | |||||||||||||||||||||
| 1999 | 2159 | 3427 | 11,147 | 780 | 2718 | 793 | 100,294 | 198 | |||||||||||||||||||||
| 2000 | 1237 | 3472 | 11,977 | 699 | 524 | 700 | 80,025 | 620 | |||||||||||||||||||||
| 2001 | 1243 | 2166 | 10,079 | 539 | 446 | 708 | 65,869 | 261 | |||||||||||||||||||||
| 2002 | 1013 | 1811 | 8965 | 502 | 424 | 704 | 38,486 | 91 | |||||||||||||||||||||
| 2003 | 861 | 1586 | 8903 | 616 | 483 | 853 | 29,718 | 144 | |||||||||||||||||||||
| 2004 | 1528 | 1218 | 9039 | 1697 | 521 | 711 | 33,874 | 64 | |||||||||||||||||||||
| 2005 | 1382 | 2253 | 11,748 | 508 | 468 | 722 | 68,948 | 0 | |||||||||||||||||||||
| 2006 | 851 | 2091 | 11,354 | 426 | 353 | 1039 | 56,407 | 0 | |||||||||||||||||||||
| 2007 | 725 | 1847 | 5260 | 339 | 392 | 950 | 30,158 | 0 | |||||||||||||||||||||
| 2008 | 914 | 1485 | 7412 | 485 | 408 | 657 | 32,762 | 0 | |||||||||||||||||||||
| 2009 | 819 | 1354 | 5990 | 474 | 352 | 802 | 31,008 | 0 | |||||||||||||||||||||
| 2010 | 1271 | 1547 | 6420 | 428 | 375 | 771 | 36,380 | 0 | |||||||||||||||||||||
| 2011 | 1226 | 1469 | 6000 | 400 | 350 | 750 | 34,000 | 20 | |||||||||||||||||||||
| 2012 | 835 | 2033 | 5444 | 250 | 328 | 808 | 30,579 | 0 | |||||||||||||||||||||
| 2013 | 453 | 2772 | 6050 | 200 | 150 | 1500 | 25,000 | 0 | |||||||||||||||||||||
| 2014 | 562 | 1350 | 4000 | 450 | 370 | 500 | 22,000 | 0 | |||||||||||||||||||||
| 2015 | 683 | 617 | 4200 | 250 | 300 | 250 | 20,000 | 0 | |||||||||||||||||||||
| 2016 | 649 | 768 | 5000 | 300 | 180 | 350 | 26,002 | 0 | |||||||||||||||||||||
| 2017 | 625 | 379 | 5000 | 250 | 200 | 160 | 22,000 | 0 | |||||||||||||||||||||
| 2018 | 1381 | 384 | 5000 | 900 | 600 | 190 | 20,003 | 0 | |||||||||||||||||||||
| Key (by Column) | |||||||||||||||||||||||||||||
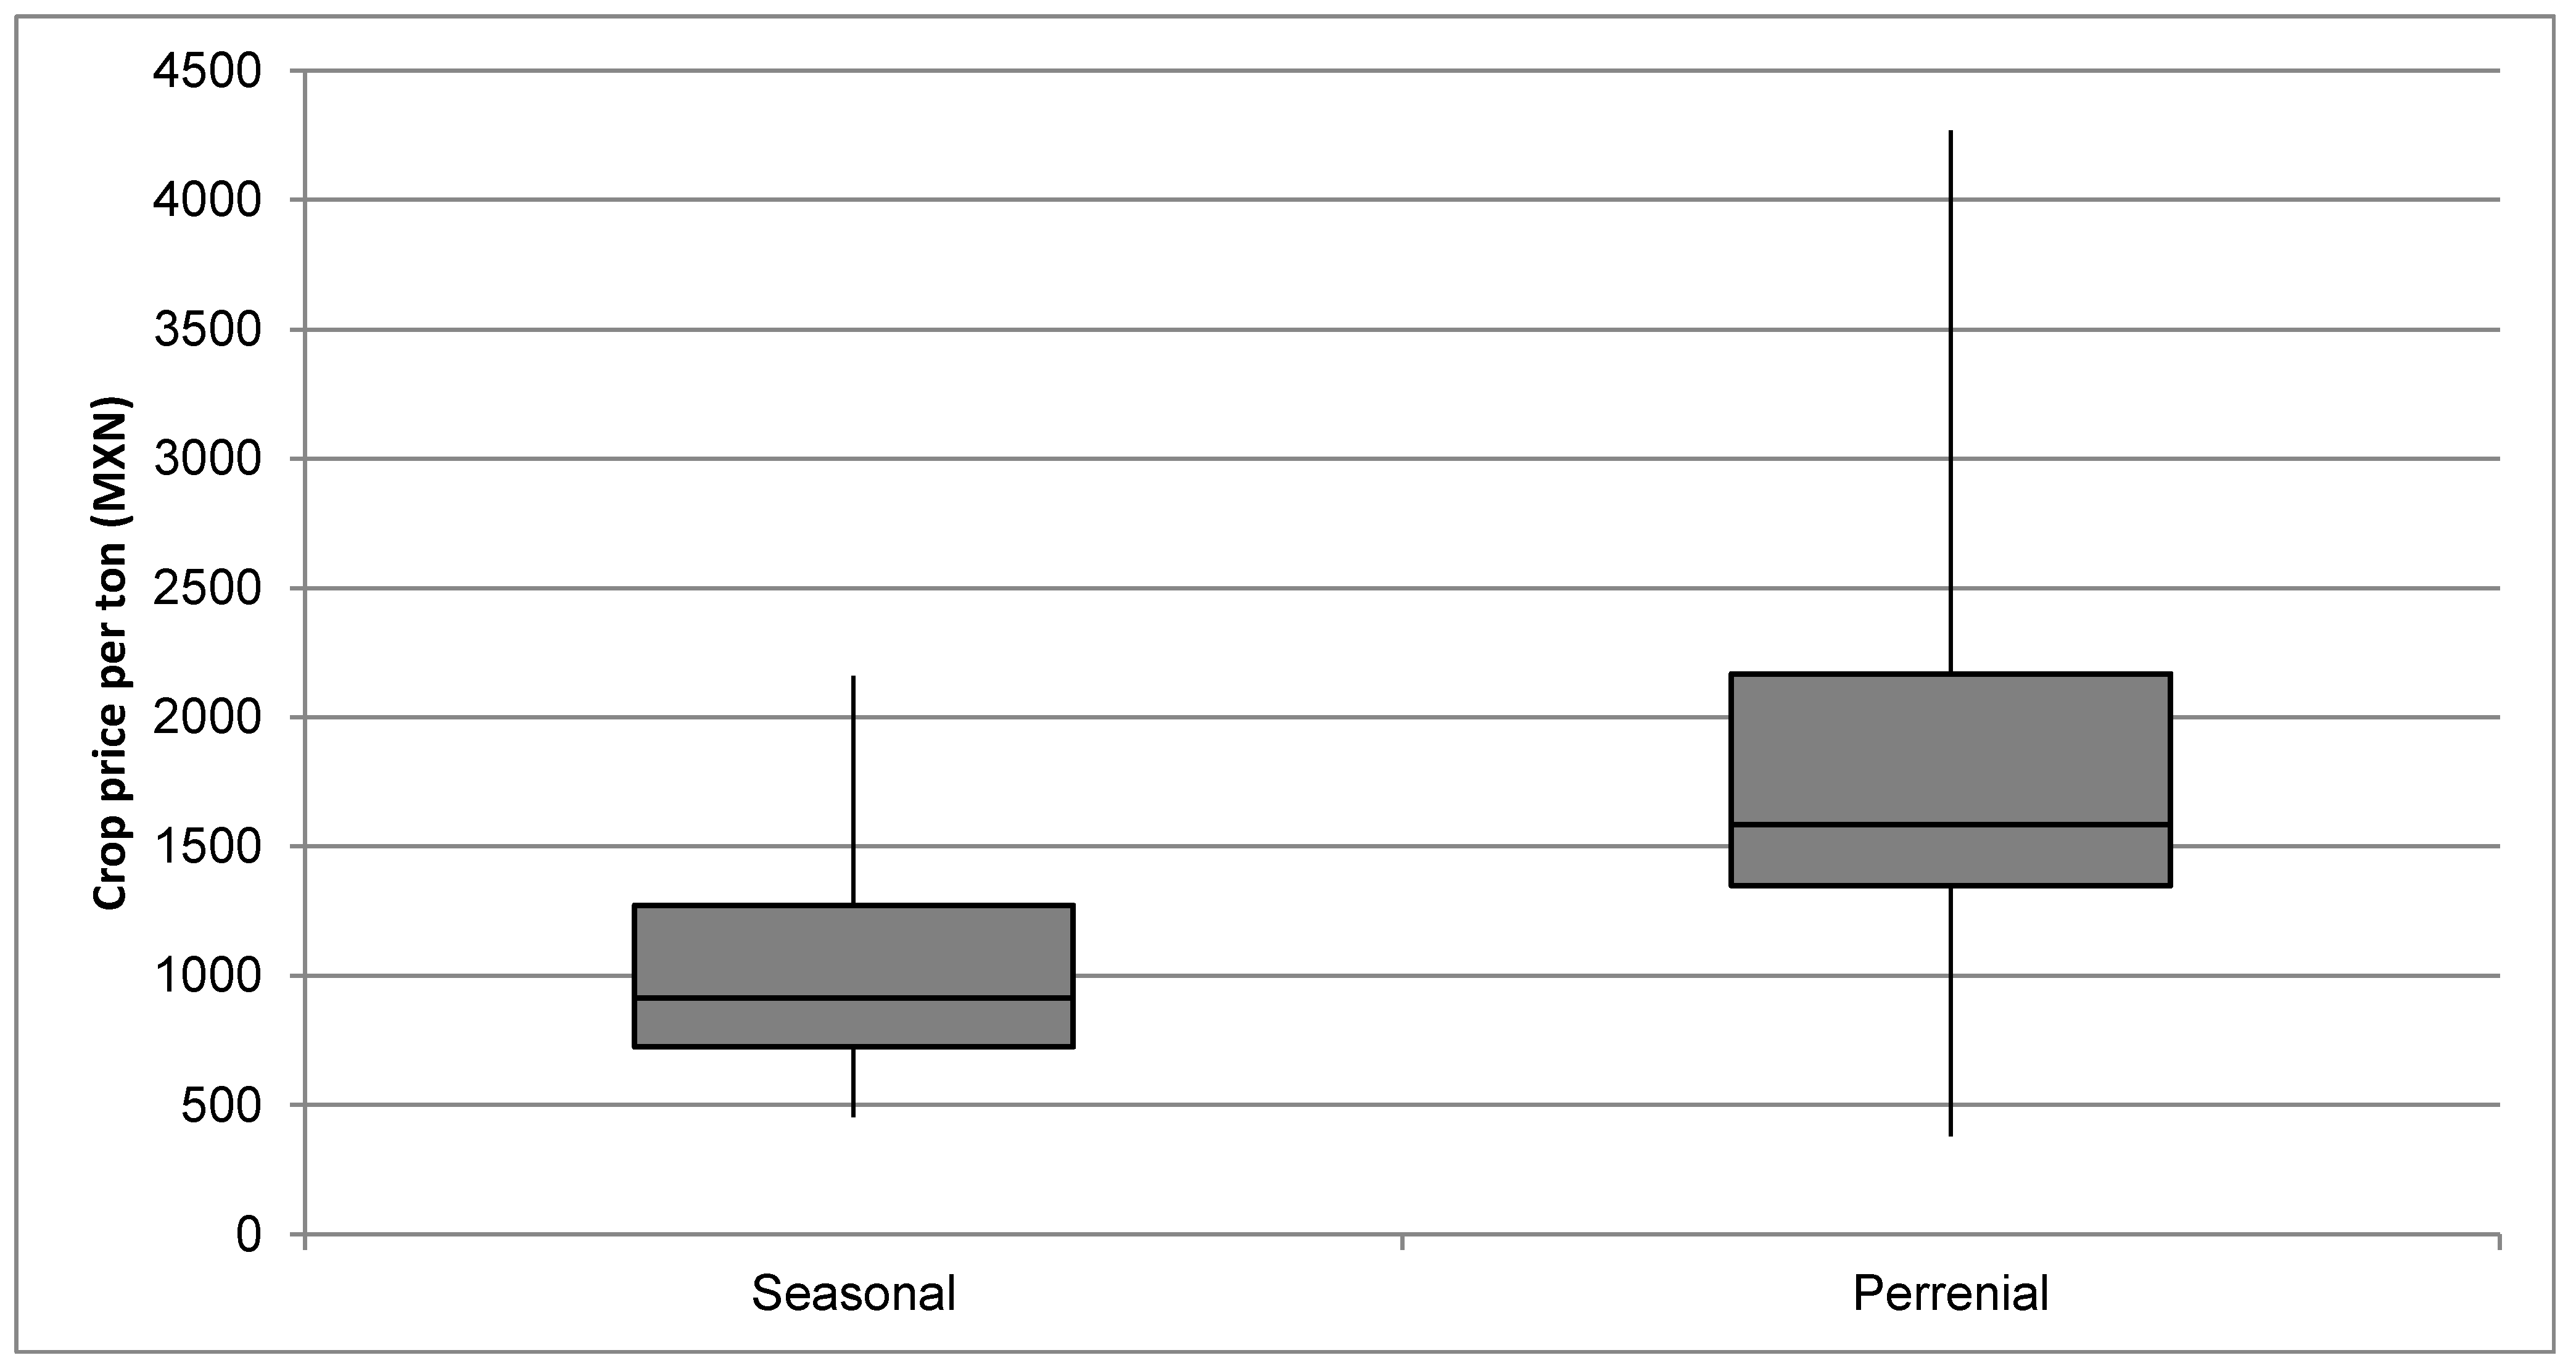
| R,S | Price (MXN per ton of crop), for all seasonal and perennial crops, respectively (Figure 7) | ||||||||||||||||||||||||||||
| T,U,V,W,X | Price (MXN per ton of crop), for the main seasonal crops (cotton, corn, sorghum) and main perennial crops (alfalfa, walnut) (Table 2) | ||||||||||||||||||||||||||||
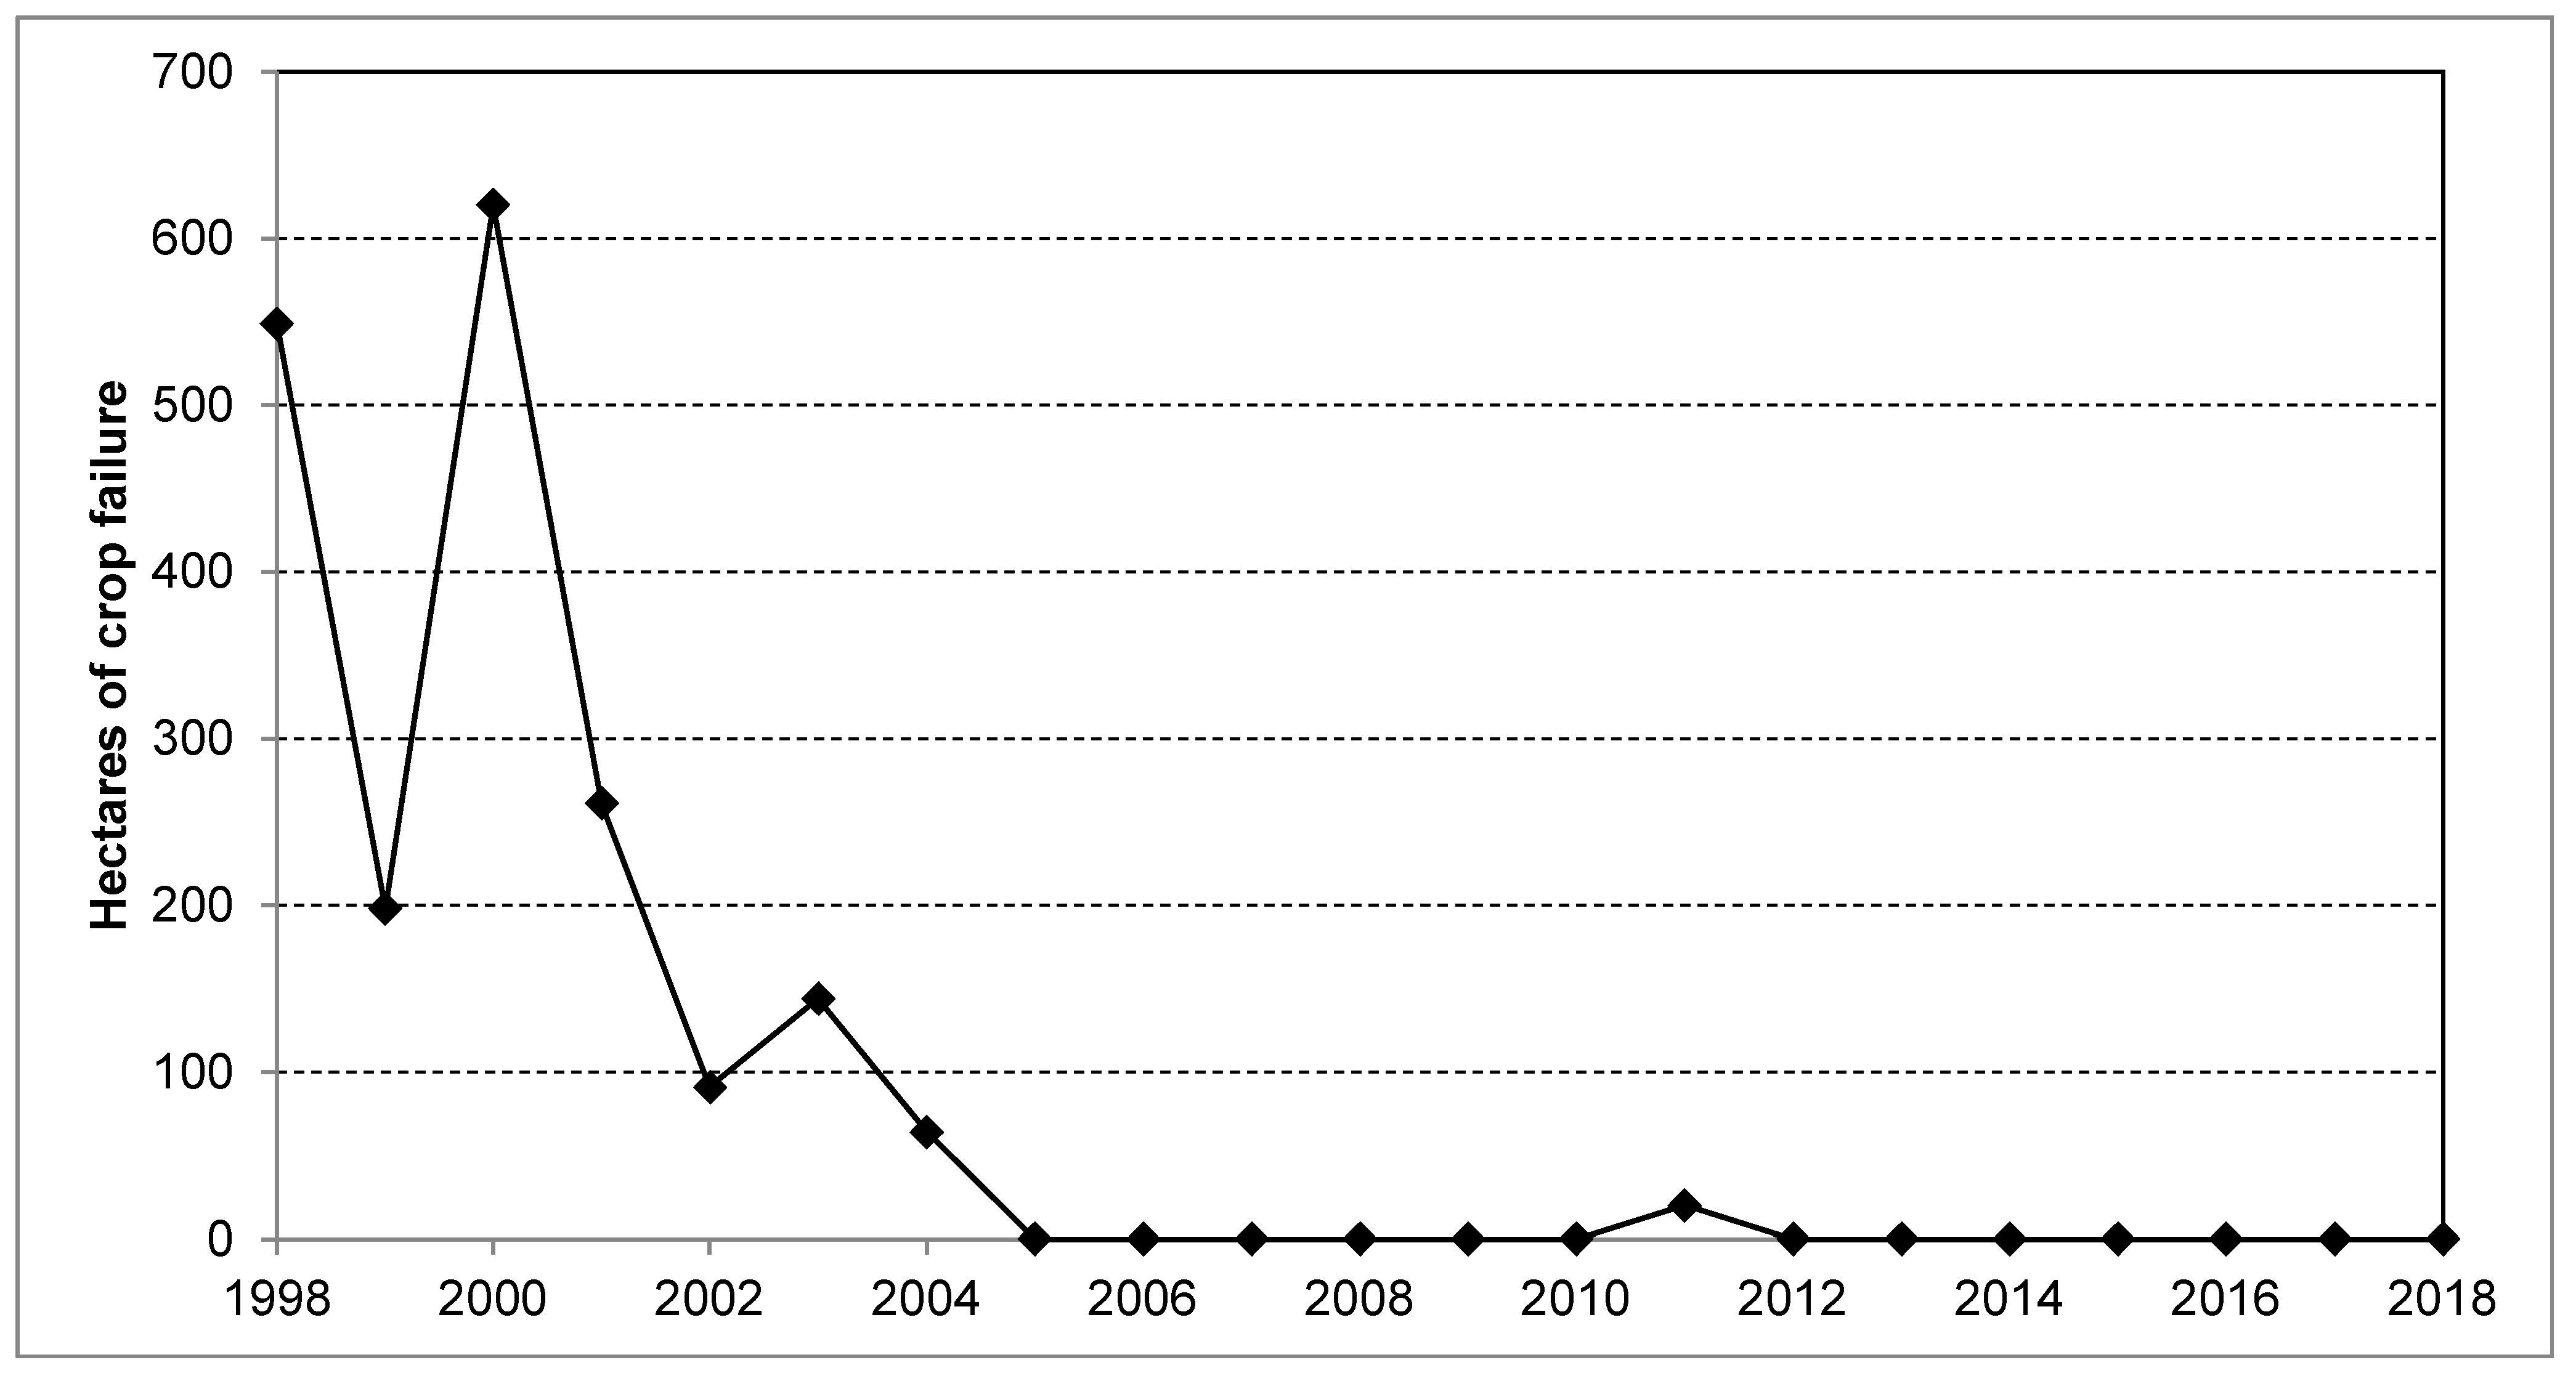
| Y | Surface affected by crop failure in hectares (Figure 8) | ||||||||||||||||||||||||||||
| Z | AA | AB | AC | AD | AE | AF | AG | ||||||||||||||||||||||
| Revenue per Hectare | Revenue per Cubic Meter | CPI | Feed Production (Tons) | Milk Production (Thousands of Liters) | Cattle (Heads) | ||||||||||||||||||||||||
| Nominal | Real | Nominal | Real | ||||||||||||||||||||||||||
| 1998 | 18.9 | 51.8 | 1.09 | 2.98 | 36.41 | 787,025 | |||||||||||||||||||||||
| 1999 | 13.8 | 32.4 | 0.88 | 2.07 | 42.45 | 507,756 | |||||||||||||||||||||||
| 2000 | 19.4 | 41.7 | 1.16 | 2.50 | 46.48 | 998,182 | |||||||||||||||||||||||
| 2001 | 19.0 | 38.4 | 0.98 | 1.99 | 49.43 | 841,016 | |||||||||||||||||||||||
| 2002 | 19.4 | 37.3 | 0.95 | 1.82 | 51.92 | 282,759 | |||||||||||||||||||||||
| 2003 | 21.7 | 40.0 | 1.31 | 2.41 | 54.28 | 727,723 | 1,870,186 | ||||||||||||||||||||||
| 2004 | 26.7 | 47.0 | 1.53 | 2.69 | 56.83 | 1,077,567 | 1,899,394 | ||||||||||||||||||||||
| 2005 | 30.5 | 51.6 | 2.22 | 3.76 | 59.09 | 1,015,054 | 1,995,463 | ||||||||||||||||||||||
| 2006 | 32.4 | 52.9 | 2.29 | 3.74 | 61.24 | 1,011,772 | 2,122,092 | ||||||||||||||||||||||
| 2007 | 27.6 | 43.3 | 1.94 | 3.05 | 63.67 | 1,757,661 | 2,173,483 | ||||||||||||||||||||||
| 2008 | 34.3 | 51.2 | 2.09 | 3.13 | 66.93 | 1,773,614 | 2,255,272 | ||||||||||||||||||||||
| 2009 | 28.4 | 40.3 | 1.94 | 2.75 | 70.48 | 2,086,224 | 2,090,707 | ||||||||||||||||||||||
| 2010 | 27.5 | 37.4 | 1.79 | 2.43 | 73.41 | 1,684,007 | 2,092,807 | ||||||||||||||||||||||
| 2011 | 43.8 | 57.7 | 2.74 | 3.61 | 75.91 | 1,832,022 | 2,117,562 | 561,276 | |||||||||||||||||||||
| 2012 | 48.1 | 60.9 | 2.90 | 3.67 | 79.03 | 1,750,660 | 2,198,846 | 575,205 | |||||||||||||||||||||
| 2013 | 36.1 | 44.0 | 1.91 | 2.33 | 82.04 | 1,031,960 | 2,222,040 | 577,859 | |||||||||||||||||||||
| 2014 | 37.0 | 43.3 | 2.22 | 2.60 | 85.33 | 1,375,422 | 2,274,475 | 598,196 | |||||||||||||||||||||
| 2015 | 39.3 | 44.8 | 2.40 | 2.73 | 87.65 | 1,151,192 | 2,412,329 | 749,580 | |||||||||||||||||||||
| 2016 | 50.9 | 56.5 | 3.17 | 3.52 | 90.13 | 1,419,949 | 2,433,821 | 778,844 | |||||||||||||||||||||
| 2017 | 74.1 | 77.6 | 4.59 | 4.80 | 95.57 | 1,852,341 | 2,453,770 | 829,938 | |||||||||||||||||||||
| 2018 | 61.1 | 61.1 | 3.82 | 3.82 | 100.00 | 1,800,374 | 2,448,598 | 838,062 | |||||||||||||||||||||
| 2019 | 855,355 | ||||||||||||||||||||||||||||
| 2020 | 917,023 | ||||||||||||||||||||||||||||
| Key (by Column) | |||||||||||||||||||||||||||||
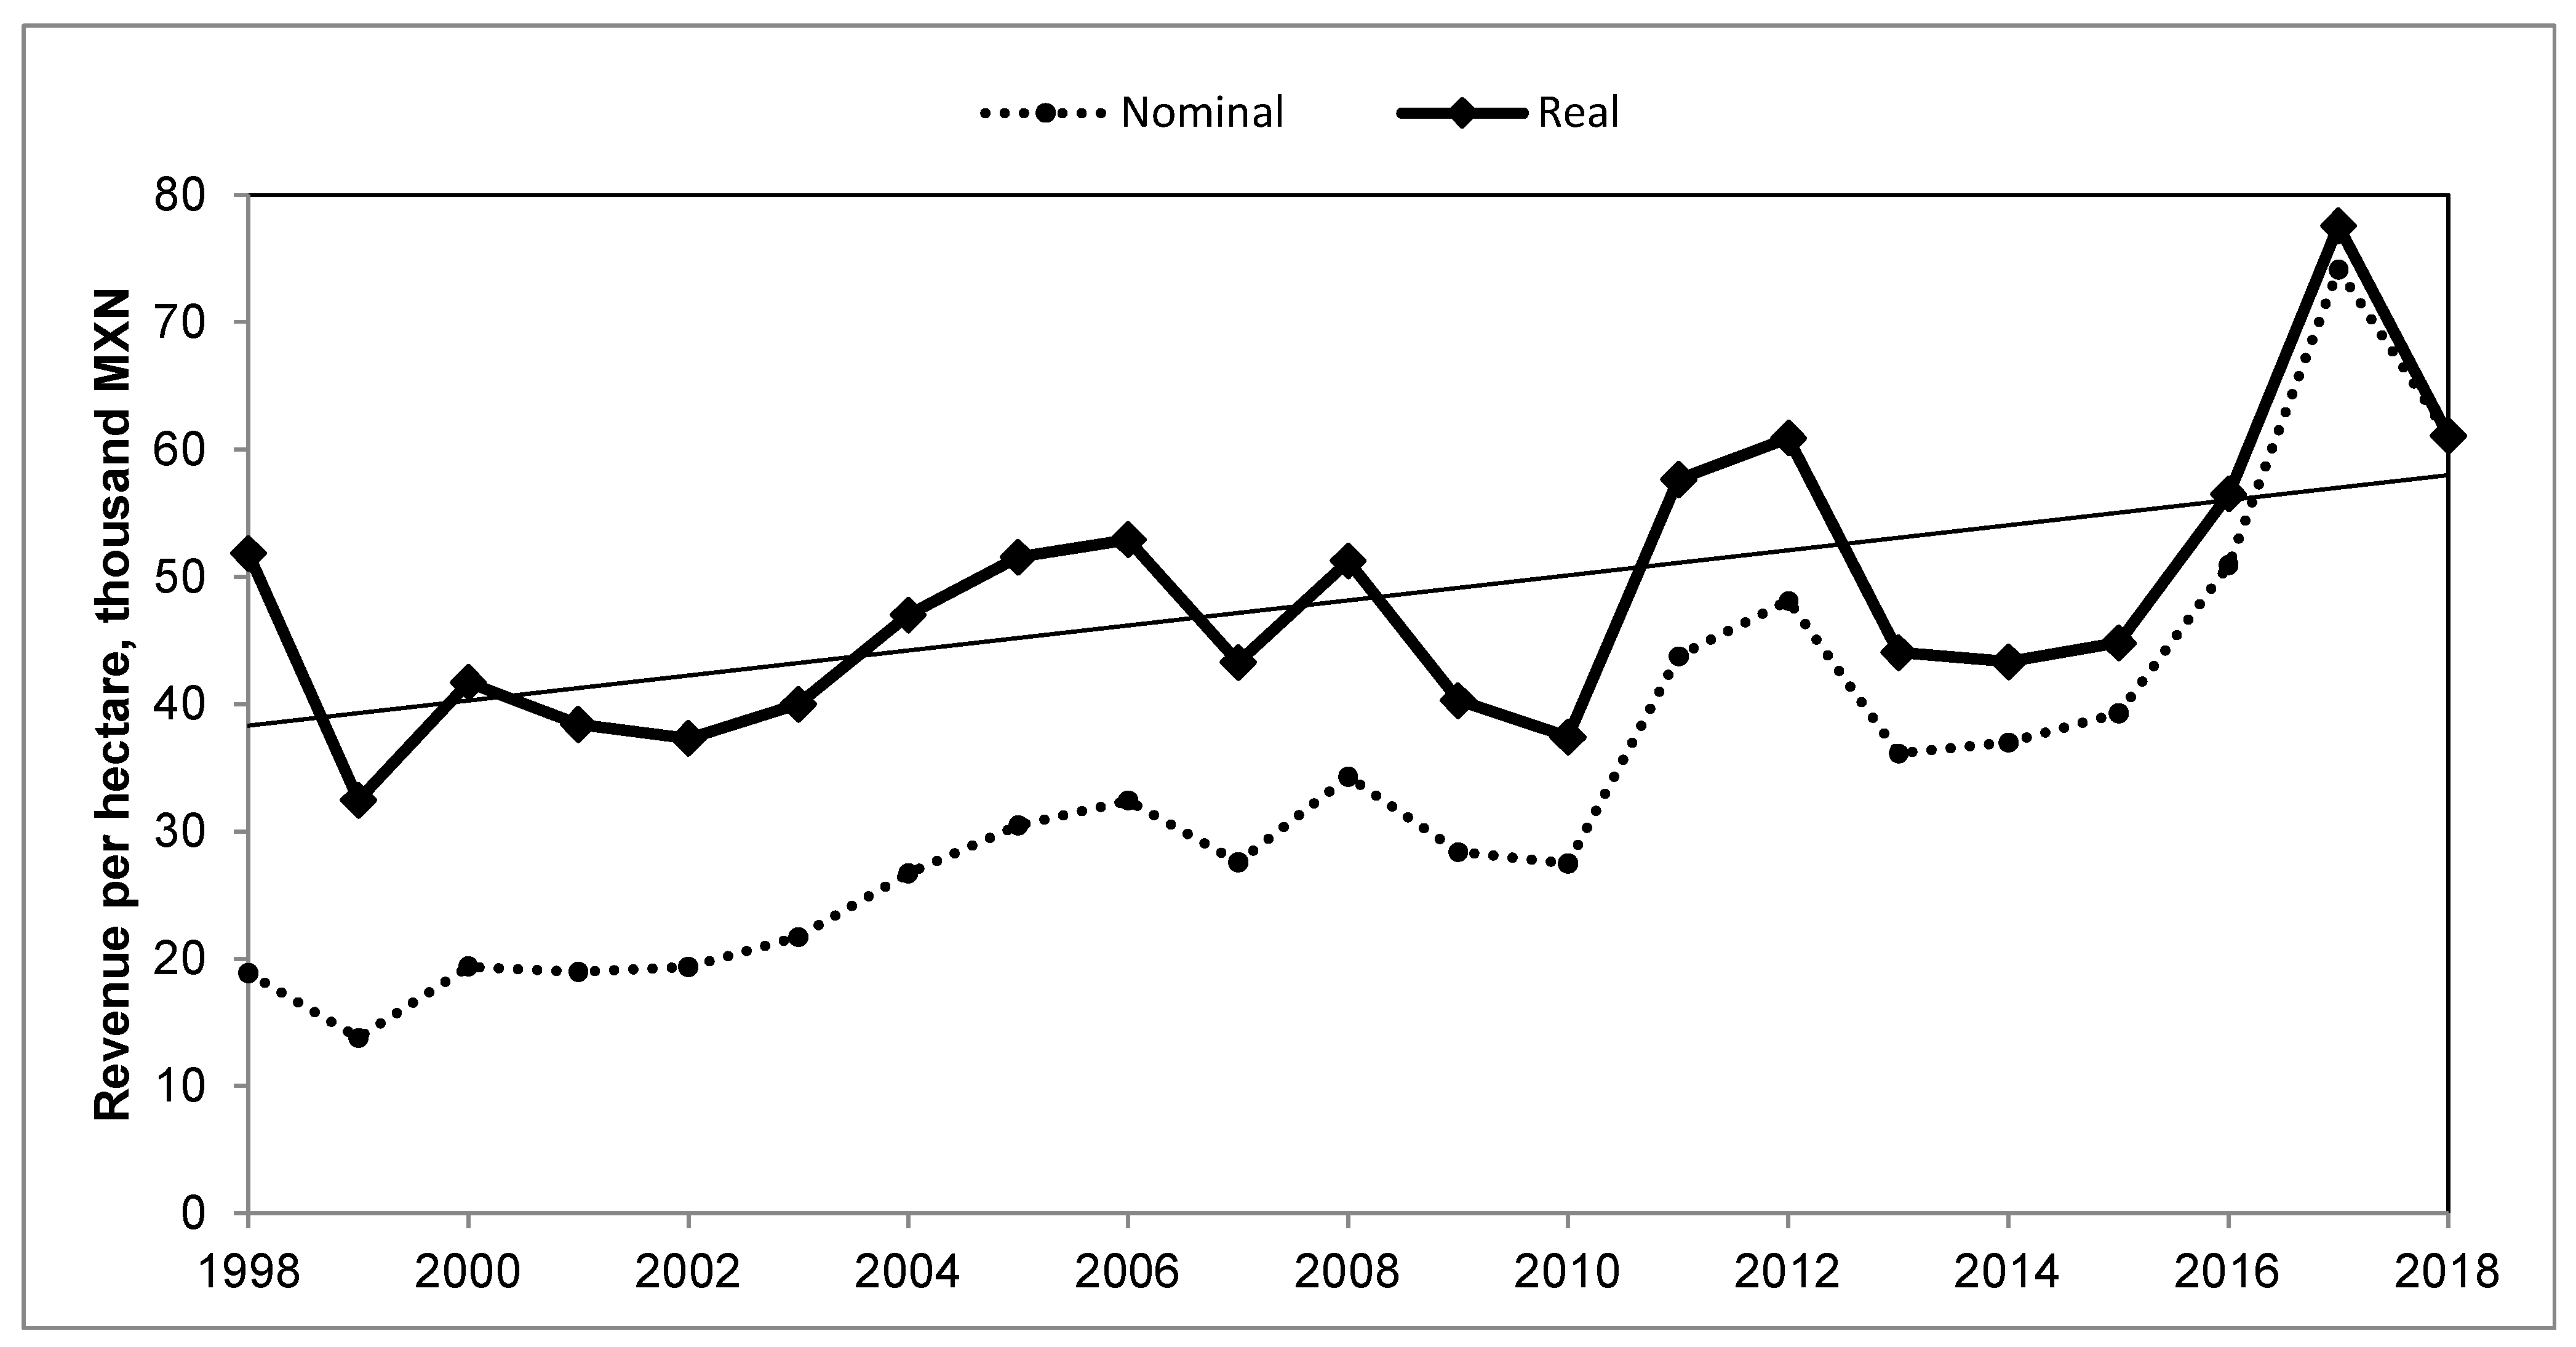
| Z,AA | Revenue per hectare, nominal and real, in thousands MXN (Figure 10) | ||||||||||||||||||||||||||||
| AB, AC | Revenue per cubic meter of water, nominal and real, in MXN (Figure 11) | ||||||||||||||||||||||||||||
| AD | Consumer Price Index, used to convert nominal revenue into real revenue, in 2018 values | ||||||||||||||||||||||||||||
| AE | District production of corn, sorghum and alfalfa, in tons (Figure 12) | ||||||||||||||||||||||||||||
| AF | Regional milk production, in thousands of liters (Figure 12) | ||||||||||||||||||||||||||||
| AG | Regional beef and dairy cattle, heads (data referred to in Section 3.2.3) | ||||||||||||||||||||||||||||
References
- Debaere, P.; Li, T. The effects of water markets: Evidence from the Rio Grande. Adv. Water Resour. 2020, 145, 103700. [Google Scholar] [CrossRef]
- Zegarra, E. Water Market and Coordination Failures: The Case of Limari Valley in Chile. Ph.D. Thesis, University of Wisconsin, Madison, WI, USA, 2002. [Google Scholar]
- Giannocarro, G.; Pedraza, V.; Berber, J. Analysis of Stakeholder Attitude towards Water Markets in Southern Spain. Water 2013, 5, 1517–1532. [Google Scholar] [CrossRef]
- D’Odorico, P.; Chiarellib, D.D.; Rosaa, L.; Binia, A.; Zilbermanc, D.; Rullib, M.C. The global value of water in agriculture. Proc. Natl. Acad. Sci. USA 2020, 117, 21985–21993. [Google Scholar] [CrossRef]
- Sisto, N.P. Environmental flows for rivers and economic compensation for irrigators. J. Environ. Manag. 2009, 90, 1236–1240. [Google Scholar] [CrossRef] [PubMed]
- Okazaki, M.; Lizumi, T.; Sakamoto, T.; Kotoku, M.; Sakurai, G.; Hijioka, Y.; Nishimori, M. Varying Benefits of Irrigation Expansion for Crop Production under a Changing Climate and Competitive Water Use Among Crops. Earth’s Future 2018, 6, 1207–1220. [Google Scholar] [CrossRef]
- Rosa, L.; Rulli, M.C.; Davis, K.F.; Chiarelli, D.D.; Passera, C.P.; D’Odorico, P. Closing the Yield Gap While Ensuring Water Sustainability. Environ. Res. Lett. 2018, 13, 104002. [Google Scholar] [CrossRef] [Green Version]
- Rosegrant, W.; Ringler, C.; McKinney, D.C.; Cai, X.; Keller, A.; Donoso, G. Integrated economic-hydrologic water modeling at the basin scale: The Maipo River Basin. Agric. Econ. 2000, 24, 33–46. [Google Scholar] [CrossRef]
- World Bank. World Development Indicators Database. Available online: http://data.worldbank.org/data-catalog/world-development-indicators (accessed on 14 July 2022).
- Ochoa-Noriega, C.A.; Aznar-Sánchez, J.A.; Velasco-Muñoz, J.F.; Álvarez-Bejar, A. The Use of Water in Agriculture in Mexico and Its Sustainable Management: A Bibliometric Review. Agronomy 2020, 10, 1957. [Google Scholar] [CrossRef]
- Esquivel-Arriaga, G.; Cerano-Paredes, J.; Sánchez-Cohen, I.; Velásquez-Valle, M.A.; Flores-López, F.; Bueno-Hurtado, P. Temporal analysis of droughts (1922–2016) in the upper Nazas River Basin using SPI and its relationship with ENSO. Tecnol. Cienc. Agua 2019, 10, 126–153. [Google Scholar] [CrossRef]
- Comisión Nacional del Agua, Sistema Nacional de Información del Agua. Presas Principales. Available online: http://sina.conagua.gob.mx/sina/tema.php?tema=presasPrincipales&n=nacional (accessed on 27 May 2022).
- Comisión Nacional del Agua, Subdirección General de Operación, Gerencia de Distritos y Unidades de Riego. Estadísticas Agrícolas de los Distritos de Riego. Available online: https://www.gob.mx/conagua/documentos/estadisticas-agricolas-de-los-distritos-de-riego (accessed on 27 May 2022).
- Heuzé, V.; Tran, G.; Edouard, N.; Lebas, F. Maize Green Forage. Feedipedia, a Programme by INRAE, CIRAD, AFZ and FAO. 2017. Available online: https://www.feedipedia.org/node/358 (accessed on 27 May 2022).
- INEGI Instituto Nacional de Estadística, Geografía e Informática. Banco de Información Económica, Índices de Precios. Available online: https://www.inegi.org.mx/sistemas/bie/ (accessed on 27 May 2022).
- Secretaría de Agricultura y Desarrollo Rural; Servicio de Información Agroalimentaria y Pesquera. Boletín de Leche. Available online: https://www.gob.mx/siap/documentos/boletin-de-leche?state=draft (accessed on 27 May 2022).
- Secretaría de Agricultura y Desarrollo Rural; Servicio de Información Agroalimentaria y Pesquera. Producción Ganadera. Available online: https://www.gob.mx/siap/acciones-y-programas/produccion-pecuaria (accessed on 27 May 2022).
- Cruz, A.; Levine, G. El Uso de Aguas Subterraneas en el Distrito de Riego 017, Region Lagunera, Mexico In Spanish. Mexico, D.F., Mexico: Colombo, Sri Lanka: International Water Management Institute (IWMI). Mexico Program xv, 1998. 27p. (IWMI Serie Latinoamericana 003). Available online: https://www.iwmi.cgiar.org/publications/other-publication-types/latin-american-series/ (accessed on 27 May 2022).
- Hernandez, M.F.; Alhers, R. Naturaleza y Extension del Mercado del Agua en el D.R.017 de la Comarca Lagunera, Mexico. In Spanish. Mexico, D.F., Mexico: International Water Management Institute (IWMI). Mexico Program xv, 1999. 63p. (IWMI Serie Latinoamericana 010). Available online: https://www.iwmi.cgiar.org/publications/other-publication-types/latin-american-series/ (accessed on 27 May 2022).


| Seasonal | Perennial | ||||
|---|---|---|---|---|---|
| Cotton | Corn | Sorghum | Alfalfa | Walnut | |
| Minimum | 2.41 | 35.40 | 31.40 | 28.68 | 0.84 |
| Median | 4.92 | 44.90 | 48.23 | 54.90 | 1.78 |
| Mean | 4.59 | 43.77 | 48.04 | 55.62 | 1.71 |
| Maximum | 5.52 | 51.20 | 57.79 | 76.33 | 2.13 |
| Seasonal | Perennial | ||||
|---|---|---|---|---|---|
| Cotton | Corn | Sorghum | Alfalfa | Walnut | |
| Minimum | 4000 | 200 | 150 | 160 | 20,000 |
| Median | 6420 | 474 | 392 | 722 | 32,762 |
| Mean | 7752 | 538 | 509 | 701 | 42,310 |
| Maximum | 13,802 | 1697 | 2718 | 1500 | 100,294 |
| Dependent Variable | Constant (t-Statistics) | Slope Coefficient (t-Statistics) | R2 (Adjusted) |
|---|---|---|---|
| Revenue per hectare (real) | 38.3 (10.27) | 0.958 (3.09) | 0.30 |
| Revenue per cubic meter (real) | 2.31 (8.55) | 0.0.67 (2.88) | 0.27 |
Publisher’s Note: MDPI stays neutral with regard to jurisdictional claims in published maps and institutional affiliations. |
© 2022 by the authors. Licensee MDPI, Basel, Switzerland. This article is an open access article distributed under the terms and conditions of the Creative Commons Attribution (CC BY) license (https://creativecommons.org/licenses/by/4.0/).
Share and Cite
Sisto, N.P.; Severinov, S.; Aboites Manrique, G. Growing Crops in Arid, Drought-Prone Environments: Adaptation and Mitigation. Hydrology 2022, 9, 129. https://doi.org/10.3390/hydrology9080129
Sisto NP, Severinov S, Aboites Manrique G. Growing Crops in Arid, Drought-Prone Environments: Adaptation and Mitigation. Hydrology. 2022; 9(8):129. https://doi.org/10.3390/hydrology9080129
Chicago/Turabian StyleSisto, Nicholas P., Sergei Severinov, and Gilberto Aboites Manrique. 2022. "Growing Crops in Arid, Drought-Prone Environments: Adaptation and Mitigation" Hydrology 9, no. 8: 129. https://doi.org/10.3390/hydrology9080129
APA StyleSisto, N. P., Severinov, S., & Aboites Manrique, G. (2022). Growing Crops in Arid, Drought-Prone Environments: Adaptation and Mitigation. Hydrology, 9(8), 129. https://doi.org/10.3390/hydrology9080129


