

Determining the Relationship between Mechanical Properties and Quantitative Magnetic Resonance Imaging of Joint Soft Tissues Using Patient-Specific Templates
 ,
,
Abstract
:1. Introduction
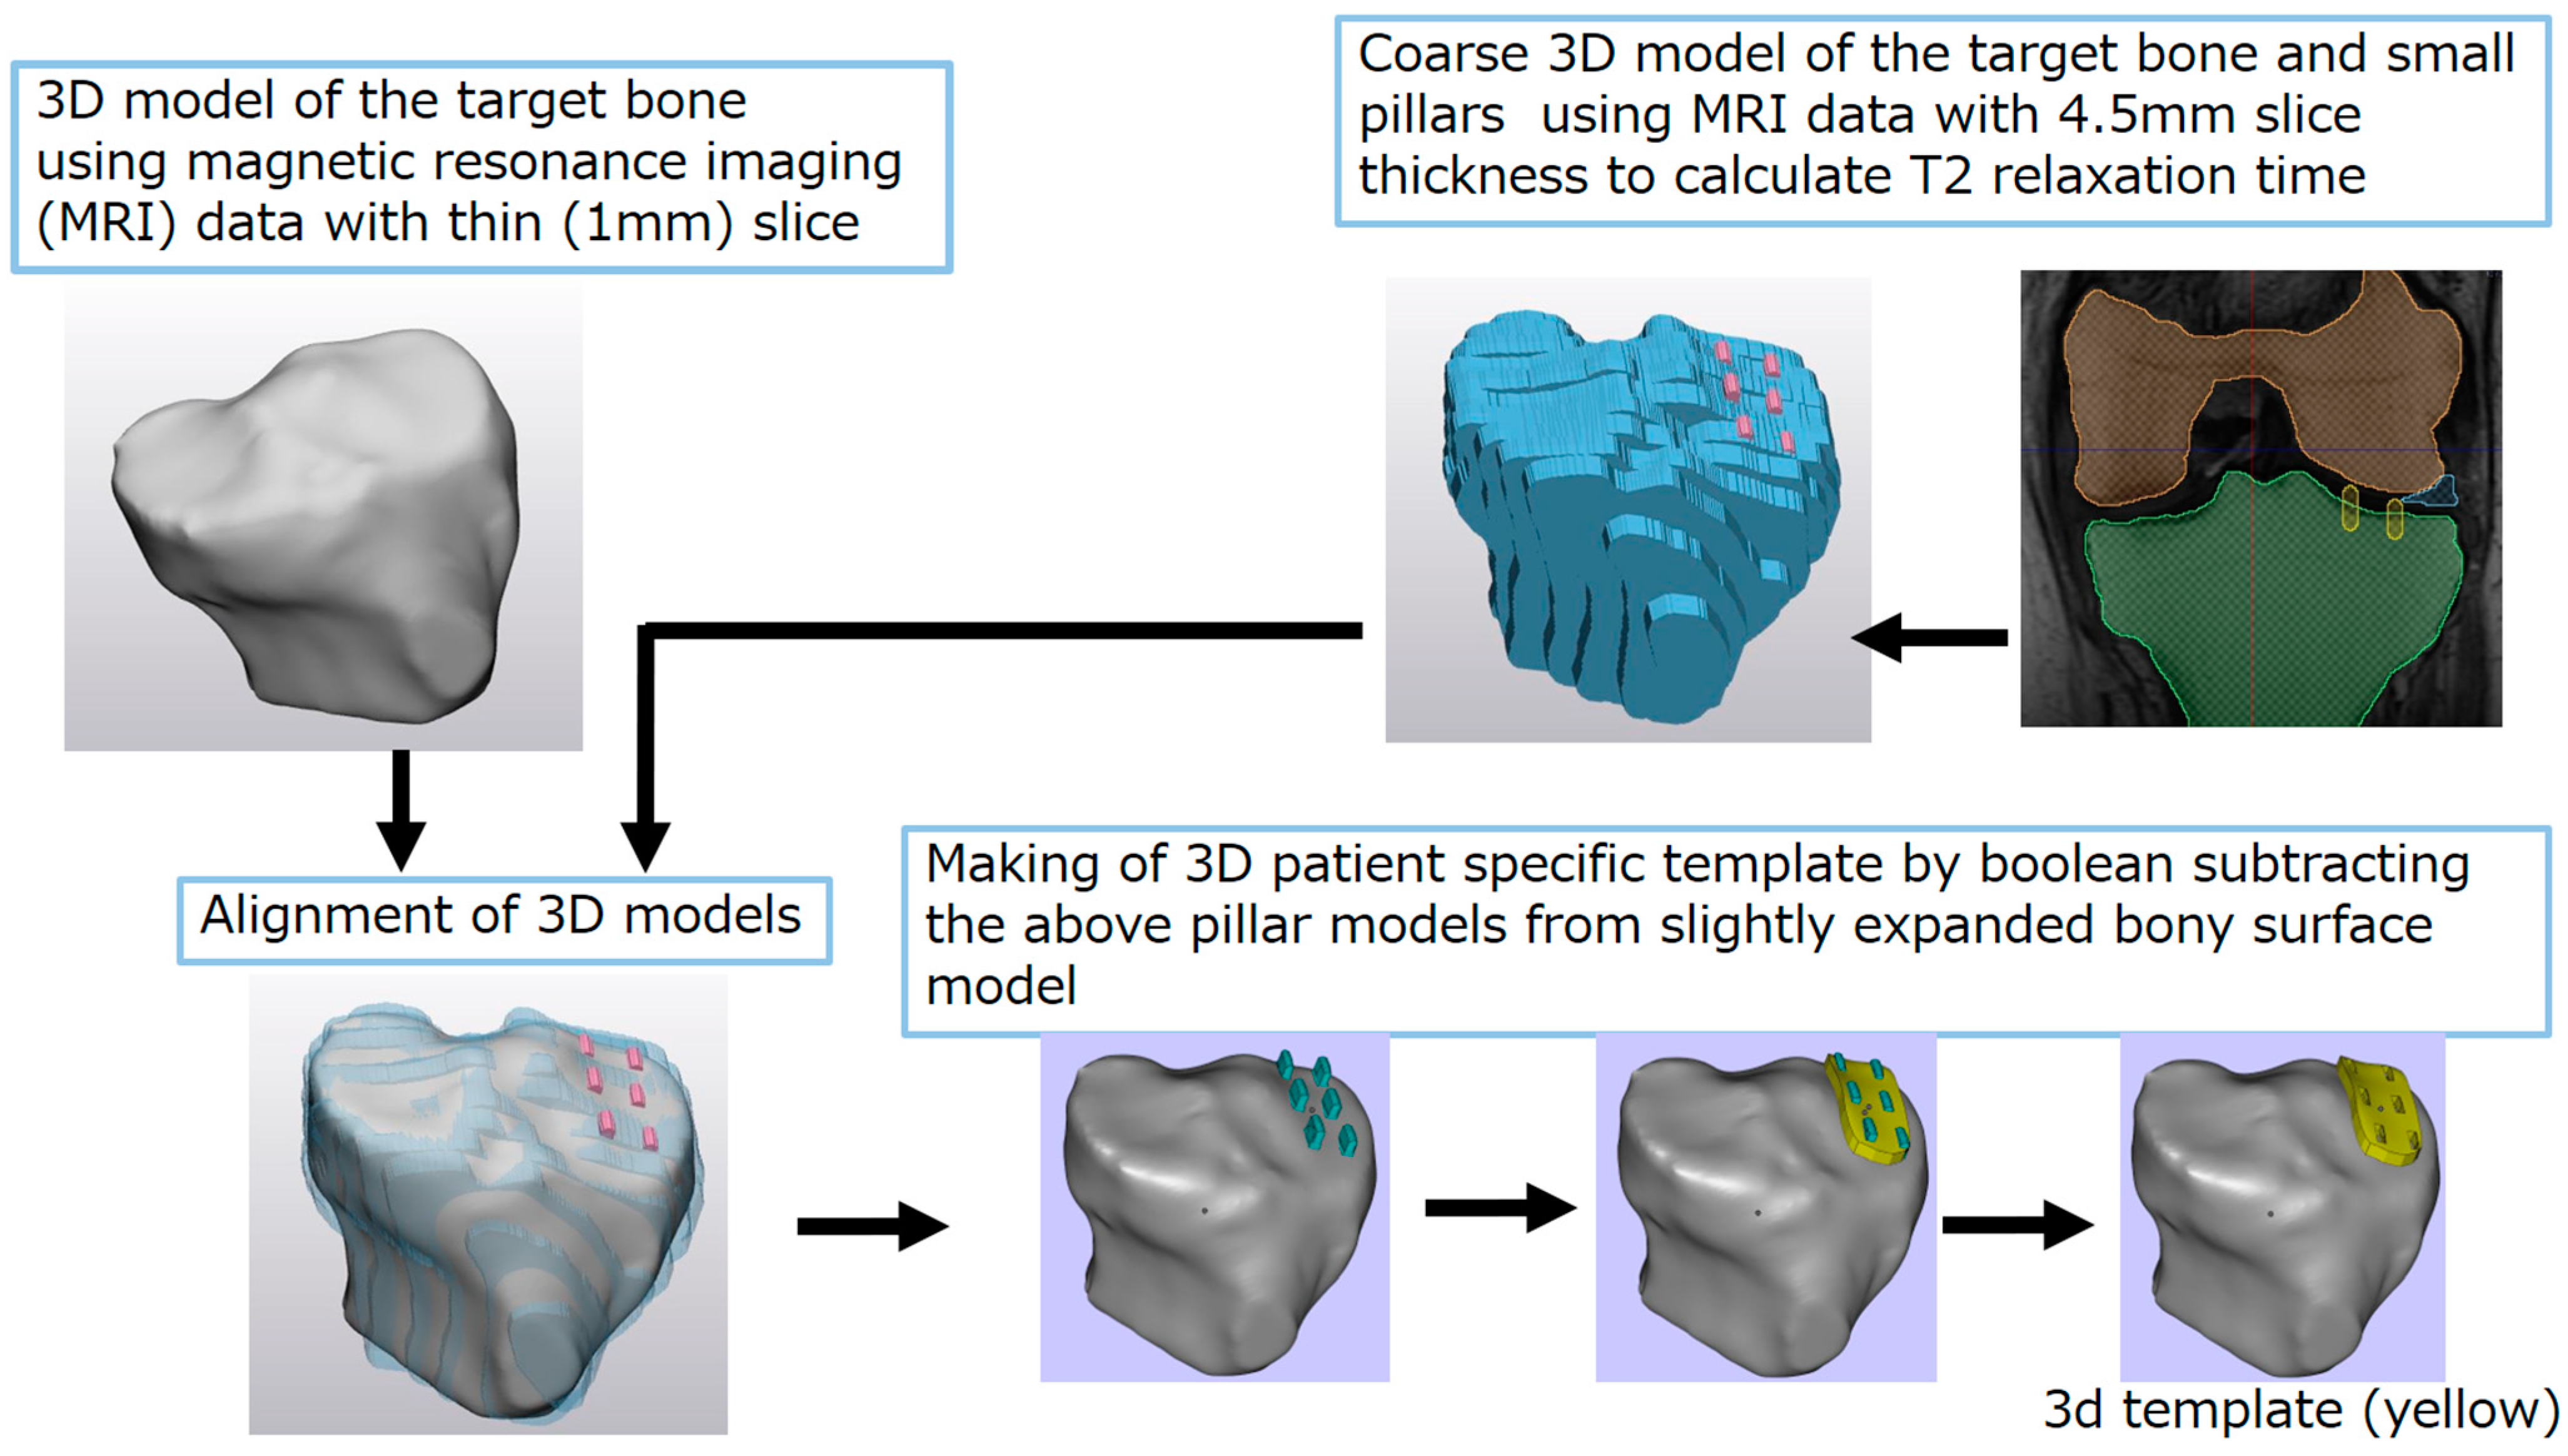
2. Methods
3. Results
4. Discussion
5. Conclusions
Author Contributions
Funding
Institutional Review Board Statement
Informed Consent Statement
Data Availability Statement
Acknowledgments
Conflicts of Interest
References
- Chan, D.D.; Neu, C.P. Probing articular cartilage damage and disease by quantitative magnetic resonance imaging. J. R. Soc. Interface 2013, 10, 20120608. [Google Scholar] [CrossRef]
- Bittersohl, B.; Hosalkar, H.S.; Miese, F.R.; Schibensky, J.; König, D.P.; Herten, M.; Antoch, G.; Krauspe, R.; Zilkens, C. Zonal T2* and T1 Gd assessment of knee joint cartilage in various histological grades of cartilage degeneration: An Observational in Vitro Study. BMJ Open 2015, 5, e006895. [Google Scholar] [CrossRef]
- Binks, D.A.; Hodgson, R.J.; Ries, M.E.; Foster, R.J.; Smye, S.W.; McGonagle, D.; Radjenovic, A. Quantitative parametric MRI of articular cartilage: A review of progress and open challenges. Br. J. Radiol. 2013, 86, 20120163. [Google Scholar] [CrossRef]
- Nieminen, M.T.; Töyräs, J.; Laasanen, M.S.; Silvennoinen, J.; Helminen, H.J.; Jurvelin, J.S. Prediction of biomechanical properties of articular cartilage with quantitative magnetic resonance imaging. J. Biomech. 2004, 37, 321–328. [Google Scholar] [CrossRef]
- Nykänen, O.; Sarin, J.K.; Ketola, J.H.; Leskinen, H.; Te Moller, N.C.R.; Tiitu, V.; Mancini, I.A.D.; Visser, J.; Brommer, H.; van Weeren, P.R.; et al. T2* and quantitative susceptibility mapping in an equine model of post-traumatic osteoarthritis: Assessment of mechanical and structural properties of articular cartilage. Osteoarthr. Cartil. 2019, 27, 1481–1490. [Google Scholar] [CrossRef]
- Svärd, T.; Lakovaara, M.; Pakarinen, H.; Haapea, M.; Kiviranta, I.; Lammentausta, E.; Jurvelin, J.; Tervonen, O.; Ojala, R.; Nieminen, M. Quantitative MRI of Human Cartilage In Vivo: Relationships with Arthroscopic Indentation Stiffness and Defect Severity. Cartilage 2016, 9, 46–54. [Google Scholar] [CrossRef]
- Hananouchi, T.; Chen, Y.; Jerban, S.; Teramoto, M.; Ma, Y.; Dorthe, E.W.; Chang, E.Y.; Du, J.; D’Lima, D.D. A Useful Combination of Quantitative Ultrashort Echo Time MR Imaging and a Probing Device for Biomechanical Evaluation of Articular Cartilage. Biosensors 2021, 11, 52. [Google Scholar] [CrossRef]
- Hananouchi, T.; Saito, M.; Koyama, T.; Sugano, N.; Yoshikawa, H. Tailor-made Surgical Guide Reduces Incidence of Outliers of Cup Placement. Clin. Orthop. Relat. Res. 2010, 468, 1088–1095. [Google Scholar] [CrossRef]
- Birnbaum, K.; Schkommodau, E.; Decker, N.; Prescher, A.; Klapper, U.; Radermacher, K. Computer-Assisted Orthopedic Surgery with Individual Templates and Comparison to Conventional Operation Method. Spine 2001, 26, 365–370. [Google Scholar] [CrossRef]
- Oka, K.; Moritomo, H.; Goto, A.; Sugamoto, K.; Yoshikawa, H.; Murase, T. Corrective Osteotomy for Malunited Intra-Articular Fracture of the Distal Radius Using a Custom-Made Surgical Guide Based on Three-Dimensional Computer Simulation: Case Report. J. Hand Surg. 2008, 33, 835–840. [Google Scholar] [CrossRef]
- Murase, T.; Oka, K.; Moritomo, H.; Goto, A.; Yoshikawa, H.; Sugamoto, K. Three-Dimensional Corrective Osteotomy of Malunited Fractures of the Upper Extremity with Use of a Computer Simulation System. J. Bone Jt. Surg. 2008, 90, 2375–2389. [Google Scholar] [CrossRef]
- Radermacher, K.; Portheine, F.; Anton, M.; Zimolong, A.; Kaspers, G.; Rau, G.; Staudte, H.-W. Computer Assisted Orthopaedic Surgery with Image Based Individual Templates. Clin. Orthop. Relat. Res. 1998, 354, 28–38. [Google Scholar] [CrossRef]
- Kellgren, J.H.; Lawrence, J.S. Radiological Assessment of Osteo-Arthrosis. Ann. Rheum. Dis. 1957, 16, 494–502. [Google Scholar] [CrossRef]
- Giudice, A.L.; Ronsivalle, V.; Gastaldi, G.; Leonardi, R. Assessment of the accuracy of imaging software for 3D rendering of the upper airway, usable in orthodontic and craniofacial clinical settings. Prog. Orthod. 2022, 23, 22. [Google Scholar] [CrossRef]
- Casero, R.; Burton, R.A.; Quinn, T.A.; Bollensdorff, C.; Hales, P.; Schneider, J.E.; Kohl, P.; Grau, V. Cardiac valve annulus manual segmentation using computer assisted visual feedback in three-dimensional image data. Annu. Int. Conf. IEEE Eng. Med. Biol. Soc. 2010, 2010, 738–741. [Google Scholar] [CrossRef]
- Messroghli, D.R.; Rudolph, A.; Abdel-Aty, H.; Wassmuth, R.; Kühne, T.; Dietz, R.; Schulz-Menger, J. An open-source software tool for the generation of relaxation time maps in magnetic resonance imaging. BMC Med. Imaging 2010, 10, 16. [Google Scholar] [CrossRef]
- Tang, W.; Jiang, H. Comparison of Static and Dynamic Navigation in Root End Resection Performed by Experienced and Inexperienced Operators: An In Vitro Study. J. Endod. 2022, 49, 294–300. [Google Scholar] [CrossRef]
- Wang, D.; Han, L.; Xu, G.; Zhang, W.; Li, H.; Xu, C.; Li, H.; Li, J.; Zhang, H.; Li, J. 3D Printing and Computer-Aided Design for Precision Osteotomy-Aided Modules in Bone Biomechanical Study. Int. J. Bioprinting 2022, 8, 607. [Google Scholar] [CrossRef]
- Maghami, E.; Homaei, E.; Farhangdoost, K.; Pow, E.H.N.; Matinlinna, J.P.; Tsoi, J.K.-H. Effect of preparation design for all-ceramic restoration on maxillary premolar: A 3D finite element study. J. Prosthodont. Res. 2018, 62, 436–442. [Google Scholar] [CrossRef]
- Shaheen, E.; Sun, Y.; Jacobs, R.; Politis, C. Three-dimensional printed final occlusal splint for orthognathic surgery: Design and validation. Int. J. Oral Maxillofac. Surg. 2016, 46, 67–71. [Google Scholar] [CrossRef]
- Hananouchi, T.; Yamamoto, K.; Ando, W.; Fudo, K.; Ohzono, K. The intraoperative gap difference (flexion gap minus extension gap) is altered by insertion of the trial femoral component. Knee 2011, 19, 601–605. [Google Scholar] [CrossRef] [PubMed]
- Hananouchi, T.; Takao, M.; Nishii, T.; Miki, H.; Iwana, D.; Yoshikawa, H.; Sugano, N. Comparison of navigation accuracy in THA between the mini-anterior and -posterior approaches. Int. J. Med Robot. Comput. Assist. Surg. 2008, 5, 20–25. [Google Scholar] [CrossRef] [PubMed]
- Hananouchi, T. A Probing Device for Quantitatively Measuring the Mechanical Properties of Soft Tissues during Arthroscopy. J. Vis. Exp. 2020, 159, e60722. [Google Scholar]
- Brittberg, M.; Winalski, C.S. Evaluation of cartilage injuries and repair. J. Bone Jt. Surg. 2003, 85 (Suppl. 2), 58–69. [Google Scholar] [CrossRef] [PubMed]
- Domayer, S.; Kutscha-Lissberg, F.; Welsch, G.; Dorotka, R.; Nehrer, S.; Gäbler, C.; Mamisch, T.; Trattnig, S. T2 mapping in the knee after microfracture at 3.0T: Correlation of global T2 values and clinical outcome—Preliminary results. Osteoarthr. Cartil. 2008, 16, 903–908. [Google Scholar] [CrossRef]
- Welsch, G.; Trattnig, S.; Domayer, S.; Marlovits, S.; White, L.; Mamisch, T. Multimodal approach in the use of clinical scoring, morphological MRI and biochemical T2-mapping and diffusion-weighted imaging in their ability to assess differences between cartilage repair tissue after microfracture therapy and matrix-associated autologous chondrocyte transplantation: A pilot study. Osteoarthr. Cartil. 2009, 17, 1219–1227. [Google Scholar] [CrossRef]
- Janacova, V.; Szomolanyi, P.; Kirner, A.; Trattnig, S.; Juras, V. Adjacent cartilage tissue structure after successful transplantation: A quantitative MRI study using T2 mapping and texture analysis. Eur. Radiol. 2022, 32, 8364–8375. [Google Scholar] [CrossRef]
- Dai, X.; Fang, J.; Wang, S.; Luo, J.; Xiong, Y.; Zhang, M.; Zhu, S.; Yu, X. Short- to Midterm Clinical and Radiological Outcomes After Matrix-Associated Autologous Chondrocyte Implantation for Chondral Defects in Knees. Orthop. J. Sports Med. 2021, 9, 2325967120982139. [Google Scholar] [CrossRef]
- Hananouchi, T. Sagittal gap balancing with the concept of a single radius femoral component in posterior cruciate sacrificing total knee arthroplasty with patient-specific instrumentation. Int. Orthop. 2014, 39, 659–665. [Google Scholar] [CrossRef]
- Gan, Y.; Zhuang, J.; Jiang, W.; Sun, W.; Zhang, Y. Application of Personalized Navigation Templates to Oxford Single Condylar Replacement in a Chinese Population. J. Knee Surg. 2020, 34, 1155–1161. [Google Scholar] [CrossRef]
- Morsy, A.M.; Elbana, E.G.; Mostafa, A.G.; Edward, M.A.; Hafez, M.A. Comparison of Functional Outcome of Total and Unicompartmental Knee Arthroplasty Using Computer-Assisted Patient-Specific Templating. Adv. Orthop. 2021, 2021, 5524713. [Google Scholar] [CrossRef] [PubMed]


| Grade II | Grade III | Grade II & III | |
|---|---|---|---|
| Femur | −0.39 | −0.054 | −0.2 |
| Tibia | −0.54 | −0.026 | −0.16 |
| Femur & Tibia | −0.46 | −0.073 | −0.24 |
Disclaimer/Publisher’s Note: The statements, opinions and data contained in all publications are solely those of the individual author(s) and contributor(s) and not of MDPI and/or the editor(s). MDPI and/or the editor(s) disclaim responsibility for any injury to people or property resulting from any ideas, methods, instructions or products referred to in the content. |
© 2023 by the authors. Licensee MDPI, Basel, Switzerland. This article is an open access article distributed under the terms and conditions of the Creative Commons Attribution (CC BY) license (https://creativecommons.org/licenses/by/4.0/).
Share and Cite
Hananouchi, T.; Satake, S.; Sakao, K.; Katsuda, H.; Shimada, N.; Dorthe, E.W.; D’Lima, D.D. Determining the Relationship between Mechanical Properties and Quantitative Magnetic Resonance Imaging of Joint Soft Tissues Using Patient-Specific Templates. Bioengineering 2023, 10, 1050. https://doi.org/10.3390/bioengineering10091050
Hananouchi T, Satake S, Sakao K, Katsuda H, Shimada N, Dorthe EW, D’Lima DD. Determining the Relationship between Mechanical Properties and Quantitative Magnetic Resonance Imaging of Joint Soft Tissues Using Patient-Specific Templates. Bioengineering. 2023; 10(9):1050. https://doi.org/10.3390/bioengineering10091050
Chicago/Turabian StyleHananouchi, Takehito, Shinji Satake, Kei Sakao, Hiroshi Katsuda, Nagakazu Shimada, Erik W. Dorthe, and Darryl D. D’Lima. 2023. "Determining the Relationship between Mechanical Properties and Quantitative Magnetic Resonance Imaging of Joint Soft Tissues Using Patient-Specific Templates" Bioengineering 10, no. 9: 1050. https://doi.org/10.3390/bioengineering10091050