Abstract
Critical care physicians are commonly faced with patients exhibiting atrial fibrillation (AF), a cardiac arrhythmia with multifaceted origins. Recent investigations shed light on the heterogeneity among AF patients by uncovering unique AF phenotypes, characterized by differing treatment strategies and clinical outcomes. In this retrospective study encompassing 9401 AF patients in an intensive care cohort, we sought to identify differences in average treatment effects (ATEs) across different patient groups. We extract data from the MIMIC-III database, use hierarchical agglomerative clustering to identify patients’ phenotypes, and assign them to treatment groups based on their initial drug administration during AF episodes. The treatment options examined included beta blockers (BBs), potassium channel blockers (PCBs), calcium channel blockers (CCBs), and magnesium sulfate (MgS). Utilizing multiple imputation and inverse probability of treatment weighting, we estimate ATEs related to rhythm control, rate control, and mortality, approximated as hourly and daily rates (%/h, %/d). Our analysis unveiled four distinctive AF phenotypes: (1) postoperative hypertensive, (2) non-cardiovascular mutlimorbid, (3) cardiovascular multimorbid, and (4) valvulopathy atrial dilation. PCBs showed the highest cardioversion rates across phenotypes, ranging from 11.6%/h (9.35–13.3) to 7.69%/h (5.80–9.22). While CCBs demonstrated the highest effectiveness in controlling ventricular rates within the overall patient cohort, PCBs and MgS outperformed them in specific phenotypes. PCBs exhibited the most favorable mortality outcomes overall, except for the non-cardiovascular multimorbid cluster, where BBs displayed a lower mortality rate of 1.33%/d [1.04–1.93] compared to PCBs’ 1.68%/d [1.10–2.24]. The results of this study underscore the significant diversity in ATEs among individuals with AF and suggest that phenotype-based classification could be a valuable tool for physicians, providing personalized insights to inform clinical decision making.
1. Introduction
Atrial fibrillation (AF) is the most prevalent cardiac arrhythmia, affecting more than 33 million patients worldwide [1]. It is commonly encountered in critically ill patients, with incidences ranging from 4.5% to 15% in intensive care units (ICUs) [2], where it is associated with higher healthcare costs, prolonged hospitalization duration, increased risk of thromboembolism, and increased mortality [3,4].
AF is a heterogeneous disease with diverse causes and mechanisms. It may be driven by cardiac and non-cardiac comorbidities, such as pulmonary, metabolic, and endocrine disorders, genetic factors, or inflammatory states [5,6]. The abundance of pathophysiological processes driving AF has led to the realization that AF is a complex arrhythmia with significant inter-patient heterogeneity [7]. To address this heterogeneity, data-driven methods such as cluster analysis have been applied to AF cohorts, identifying clinically relevant AF phenotypes with different treatment patterns and outcomes.
Hemodynamic compromise resulting from AF often makes an urgent conversion to sinus rhythm necessary in critically ill patients. In hemodynamically stable patients, AF is often observed until it terminates spontaneously, or the ventricular rate is controlled to avoid potential adverse effects associated with cardioverting antiarrhythmic drugs. Such adverse effects include thyroid disorders, hypotension, pulmonary fibrosis, and proarrhythmic effects, with some antiarrhythmics being associated higher mortality than others [8].
Within the ICU, the management of AF is mostly limited to pharmacological treatments [5,9]. Beta blockers, magnesium sulphate, and calcium channel blockers are primarily aimed at reducing the ventricular rate, by means of reducing atrioventricular node conduction. Potassium channel blockers are used to restore and maintain sinus rhythm by prolonging atrial refractory periods, thereby preventing re-entrant activity. For a comprehensive overview of the mechanisms of AF, and the molecular mechanisms of antiarrhythmic drugs, we refer the reader to [10].
The wide spectrum of treatment options coupled with a heterogeneous patient population makes treatment selection a complex endeavor. As a result, strong evidence for the optimal treatment strategy is missing [9], and AF treatment in ICUs varies across clinical institutions. Nonetheless, treatment strategies with antiarrhythmic drugs have been shown to impact patient outcomes in the short as well as the long term [11,12]. A recent multi-center survey on treatment preferences among physicians revealed a lack of consensus on whether to choose a rate control or a rhythm control strategy, a lack of consensus in the choice of antiarrhythmic agent, and a disregard for patients’ underlying pathophysiological presentation in treatment selection in 75% of respondents [13]. Even though some tendencies for treatment selection exist, they are often derived from outpatient guidelines, and are not directly applicable to ICU populations due to different AF mechanisms, risks, and effectiveness of treatments [14,15].
Previous studies have employed cluster analysis to identify and characterize different AF phenotypes in community cohorts. The first such application was performed by Inohara et al. [16], who identified four recognizable phenotypes based on 60 clinical variables. The authors observed significant differences in the use of pharmacological treatments, and rates of major adverse cardiovascular or neurological events, new-onset heart failure, hospitalization, major bleeding, and mortality. Further studies [17,18,19,20,21] incorporated different clinical variables and identified varying numbers of clusters, reporting inter-cluster differences in clinical outcomes. A recurring conclusion of previous works was that cluster analysis was able to identify clinically meaningful phenotypes, which may potentially guide treatment decisions and improve patient outcomes.
We further explore the applicability of cluster analysis and phenotype classification in AF management by assessing its ability to identify clusters with varying average treatment effects (ATEs). Hierarchical agglomerative clustering is employed to identify distinct AF phenotypes in an intensive care cohort. Phenotypes’ properties are described, and the efficacy of pharmacological interventions is evaluated, demonstrating differences in ATEs on rhythm control, rate control, as well as in-hospital mortality.
2. Materials and Methods
2.1. Data
This study performs a retrospective analysis of a large single-center intensive care database, the Medical Information Mart for Intensive Care (MIMIC-III) [22]. The MIMIC-III database contains electronic health records from 55,423 distinct ICU admissions of 46,520 patients in the critical care units of the Beth Israel Deaconess Medical Center in the years from 2001 to 2012. The data include vital signs, medications, laboratory measurements, periodically charted observations, medical procedures, diagnoses, and free-text clinical notes.
2.2. Cohort Definition
We include patients at least 18 years of age with a diagnostic code indicating AF (ICD-9-CM: 427.31). For patients who exhibited more than one ICU admission, only the first admission with an AF diagnosis is considered. Patients with an ICU stay shorter than 24 h or age below 18 years are excluded from the analysis.
2.3. Variables
Patients are described using 34 clinical variables which include comorbidities, laboratory measurements, observations, and medical history. The clinical variables were gathered based on a systematic literature review, in which clinical variables predictive of patient outcomes were identified. The employed database was screened for the presence of the variables identified in the systematic review, resulting in the 34 clinical variables presented in Table A1. Within the scope of this study, we use the earliest available record for each variable, if more than one value is available. Continuous variables are transformed into z-scores for analysis.
2.4. Outcomes
The primary outcomes are (i) conversion to sinus rhythm, and (ii) achievement of rate control, defined as a heart rate < 100 beats per minute [23]. In MIMIC-III patients, heart rates and heart rhythms were recorded by nurses at regular intervals, and have previously been shown to be accurate and precise to within 1 h [24]. It is assumed that a registered rhythm is maintained until a different rhythm is recorded. The secondary outcome is in-hospital mortality. The primary outcomes are censored at 24 h, and the secondary outcome is censored at 30 days [11]. For all outcomes, we consider the time from the first treatment administration until the corresponding outcome is observed.
2.5. Treatment Groups
The MIMIC-III database is transformed into the Observational Medical Outcomes Partnership (OMOP) Common Data Model (CDM) [25] using the code provided by [26] to identify patient exposures to different pharmaceutical agents. Treatments are captured based on the ingredients in administered drugs, which are accompanied by the timestamp indicating when the treatment was initiated. Within the scope of this study, four treatment groups are defined based on classes 2–4 of the Vaughan Williams classification [27]—beta blockers (BBs), potassium channel blockers (PCBs), and calcium channel blockers (CCBs), as well as magnesium sulphate (MgS). The treatment groups with the corresponding drug ingredients are shown in Table 1. For the outcomes conversion to sinus rhythm and in-hospital mortality, treatment group assignment is determined based on the first observed drug exposure during an AF episode, while for the rate control, it is determined based on the first observed drug exposure during an AF episode with a rapid ventricular response (>100 beats per minute).

Table 1.
Treatment groups and their corresponding drug ingredients.
2.6. Multiple Imputation
We handled missing data through multiple imputation [28]. To achieve this, linear regression models were utilized to generate imputed datasets. This process involved resampling the original dataset with replacement, leading to the creation of 60 bootstrapped datasets. To fit linear regression models to these bootstrapped datasets, we employed chained equations [29], a technique that effectively accounts for the interrelationships among descriptive variables. Subsequently, the original dataset underwent repeated imputation using these models, resulting in a total of 60 imputed datasets. With a fraction of missing information amounting to 7.42%, the number of imputed datasets adheres to Bodner’s rule [30].
2.7. Inverse Probability of Treatment Weighting
Given the nature of our retrospective cohort analysis, it is important to consider that patients may have received treatments in a non-randomized manner, based on their specific pathophysiological presentations. Failing to account for this selection bias during the evaluation of treatment effects could lead to biased treatment effects [31].
To address the influence of confounding variables, we utilize a statistical method called inverse probability of treatment weighting (IPTW), implemented through the Twang toolkit [32]. Within each imputed dataset, we compute the likelihood of patients being allocated to their specific treatment categories based on their descriptive attributes, employing gradient boosted logistic regression models. This methodology allows us to quantify the likelihood of patients receiving a specific treatment based on their individual characteristics. The inverse of this likelihood score for each patient serves as a weighting factor in subsequent analyses to mitigate the impact of confounding variables.
We evaluate the balance of covariates across treatment groups by computing the maximum absolute pairwise standardized mean differences. This measure allowed us to assess the degree of covariate imbalance between the treatment groups, with smaller differences indicating improved balance.
The hyperparameters employed for the IPTW method were determined empirically, taking into consideration the total computation time and obtained covariate balance.
2.8. Cluster Analysis
Patient phenotypes are identified using hierarchical agglomerative clustering. We use a complete linkage criterion for agglomeration, and Gower’s distance metric [33] to account for the combination of continuous and categorical covariates. Pairwise distances are computed for each imputed dataset, and averaged to a single distance matrix, which is used in the clustering algorithm. The number of clusters is defined in a compromise between resolution and clinical explainability. The number of clusters is manually chosen such that recognizable patient groups are apparent, blinded to treatments and outcomes. Patient characteristics are compared among the different clusters, and statistical differences are assessed using the Kruskal–Wallis test. Patient covariates are described in terms of their medians and interquartile ranges (IQRs) for continuous covariates, while categorical covariates are reported as counts and percentages. Each cluster is described in terms of its most prominent properties to provide an intuitive characterization.
2.9. Statistical Analysis
The key component of the statistical analysis is the estimation of ATEs. Different approaches may be taken to analyze and present such data, such as univariate and multivariate Cox analyses and multiparametric and exponential survival models [34]. To provide the highest degree of interpretability, we approximate ATEs using weighted exponential survival models with weights obtained from IPTW.
The survival models are fitted to each imputed dataset 100 times, utilizing Bayesian bootstrapping as proposed by Rubin [35]. This process results in a total of 6000 event rate estimates for each ATE. The estimates of constant event rates are subsequently presented as probability distributions. We report both the mode and the 95% highest density intervals of these distributions.
ATEs are computed for the complete cohort and for individual clusters. This allows us to examine the effects of the treatment both overall and within specific clusters. We assess differences in ATEs using Bayes factors (BFs) [36] to provide a quantifiable uncertainty estimate in the effects of different treatments.
Our results are reported as hourly rates (%/h) for the primary outcomes, and as daily rates (%/d) for the secondary outcome. This allows for a clear and direct comparison of the effects of different treatments over time.
- All statistical analyses were performed using Python 3.7 and R Core v4.1.2. A secondary analysis using the KMeans algorithm can be found in Section S1 of the Supplementary Material.
3. Results
Of the 46,520 patients in the database, 10,277 have a diagnostic code indicating AF. After excluding patients with age below 18 years and a hospital stay shorter than 24 h, a total of 9401 patients were included in the analysis. The cohort characteristics are shown in Table 2. The percentages of missing values for each characteristic are shown in Table A1 in Appendix A. Patients were followed for an average of 11.3 days (IQR, 5.29–13.9), and were either discharged after 5.28 days (IQR, 10.2–12.0), or expired after 5.35 days (IQR, 12.4–15.9). The share of in-hospital mortality was 49.7%.
Table 2.
Cohort characteristics.
3.1. Patient Clusters
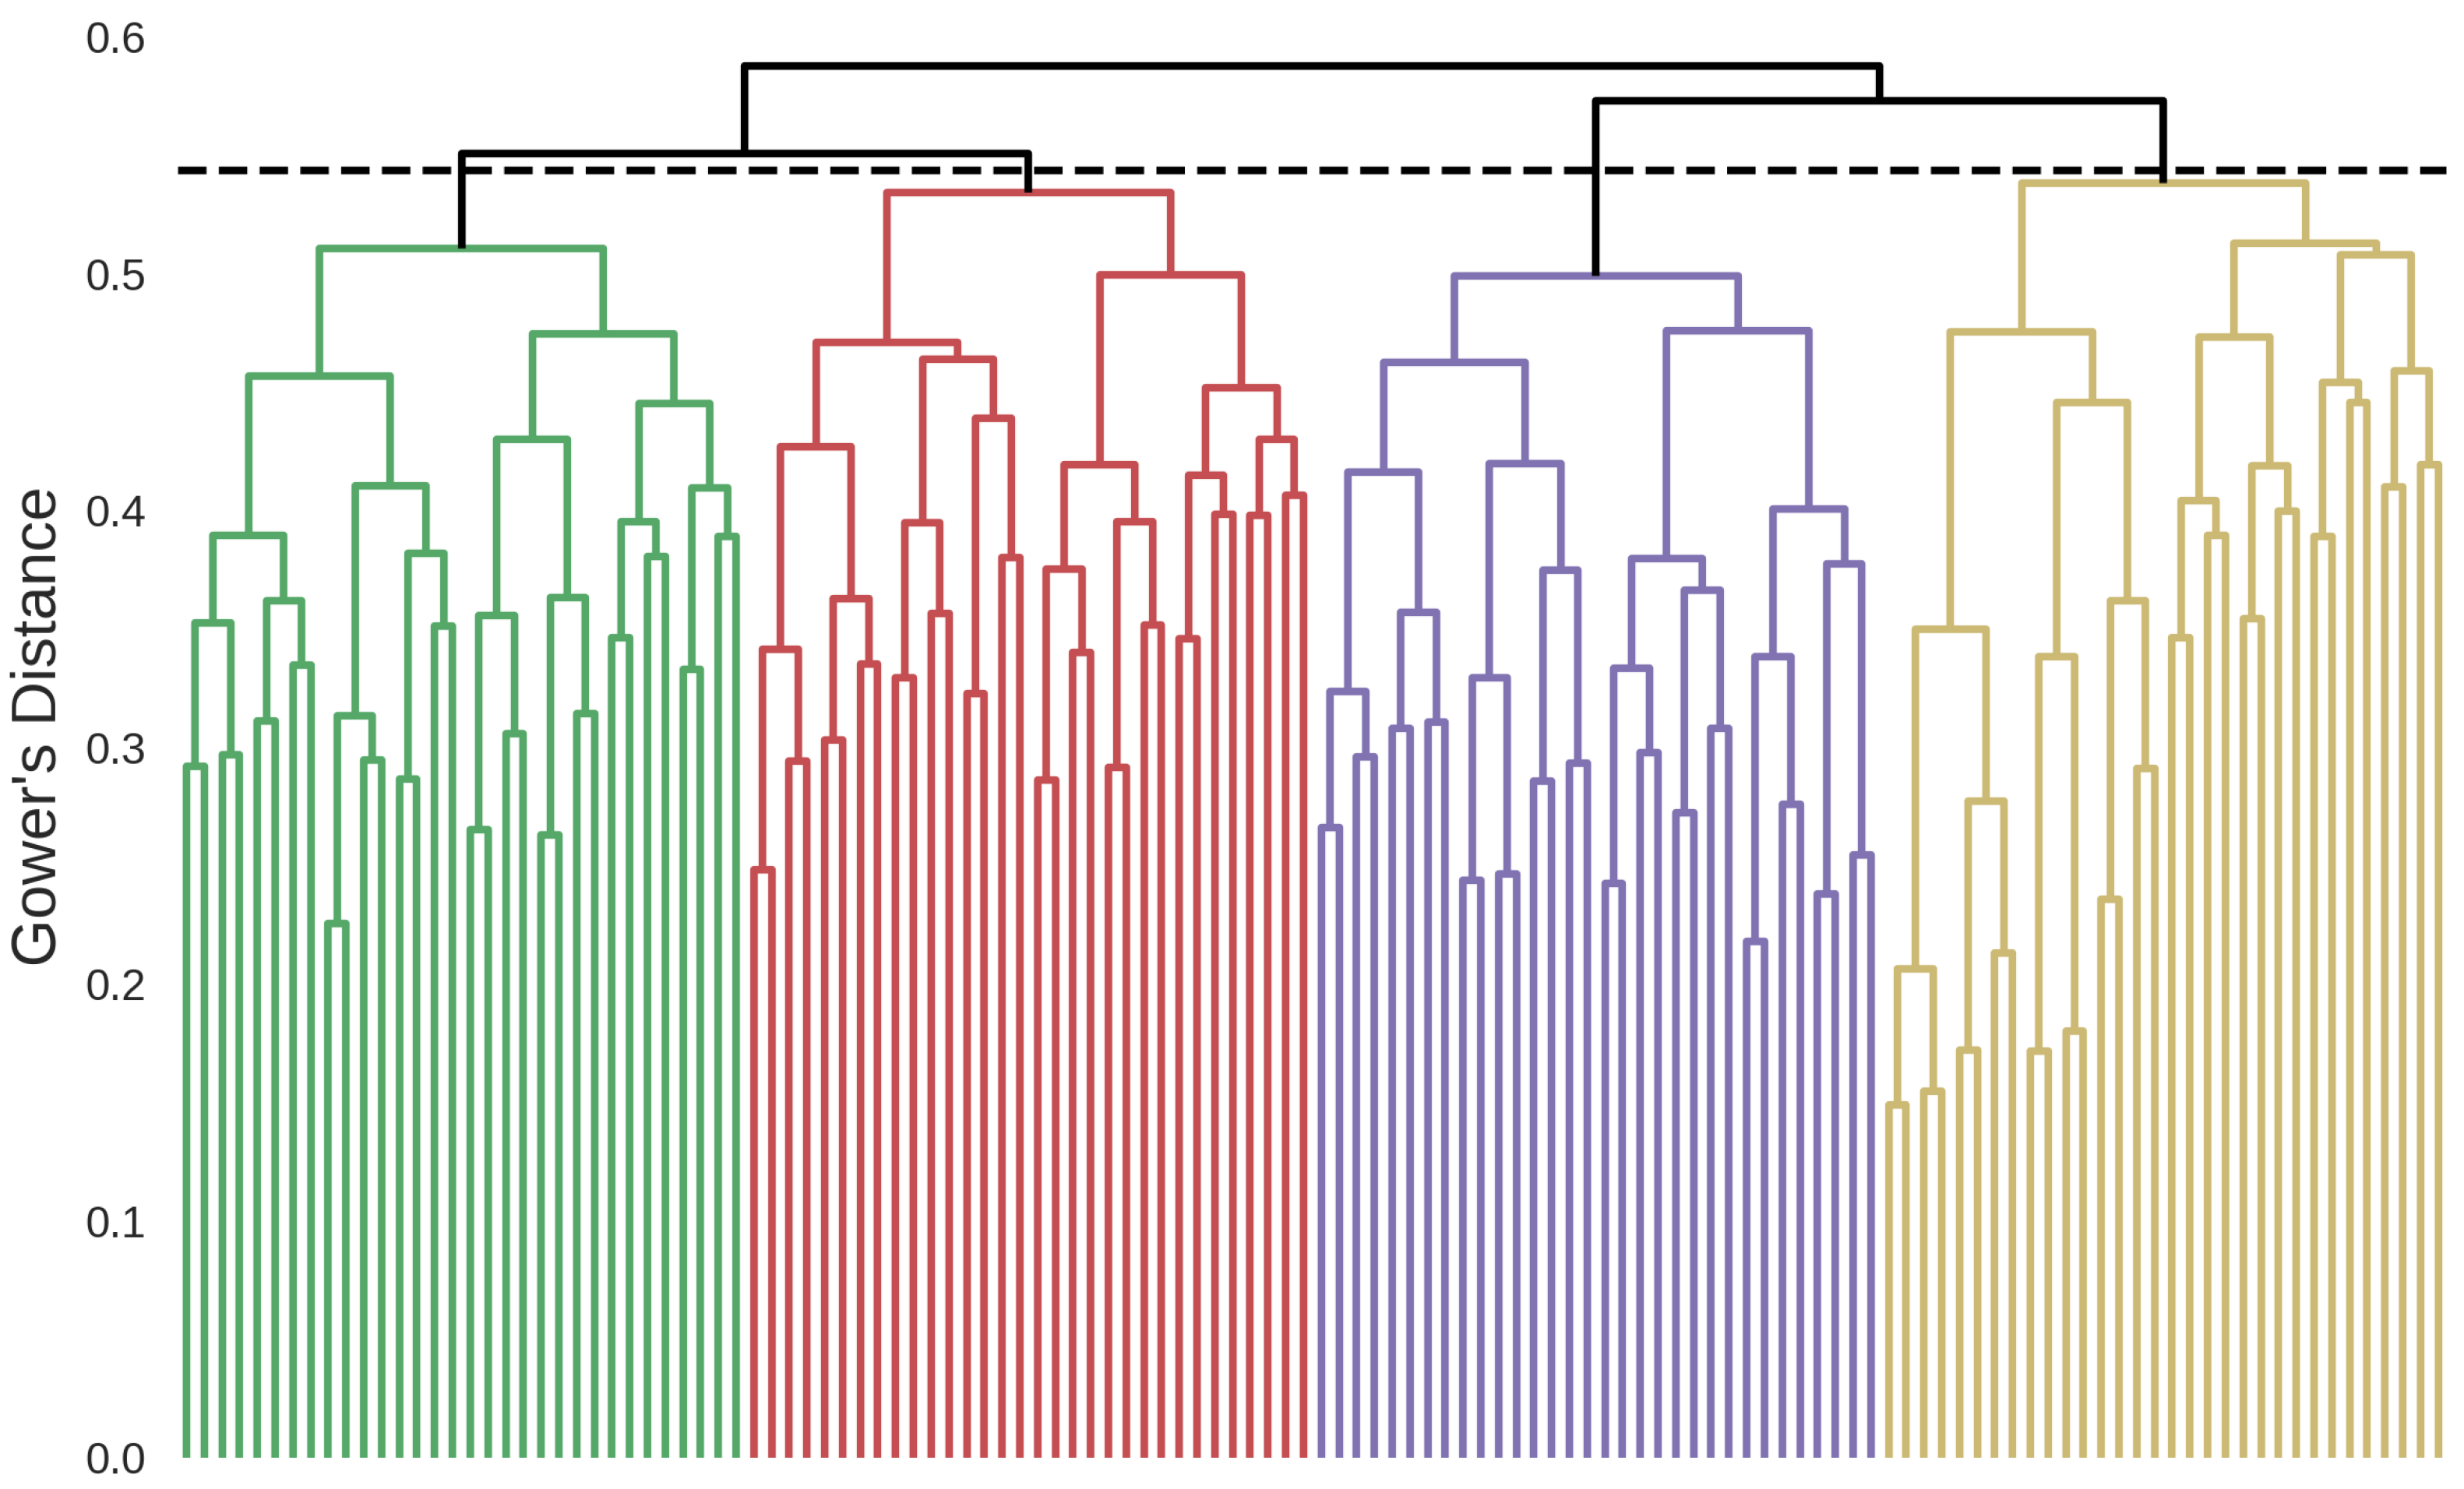
A total of four clusters were identified based on the hierarchical clustering dendrogram presented in Figure 1. The clinical variables of the identified phenotypes are shown in Table A2 in Appendix A. The dominant characteristics of the identified patient clusters are as follows.

Figure 1.
Hierarchical clustering dendrogram showing the four identified clusters. Green: Postoperative Hypertensive, red: Non-Cardiovascular Multimorbid, purple: Cardiovascular Multimorbid, yellow: Valvulopathy Atrial Dilation. The dashed horizontal line represents the stopping criterion used for the final cluster definition.
- Cluster 1: Postoperative Hypertensive (n = 2963)Patients in this cluster have the highest rate of postoperative conditions (74.2%) and hypertension (64.3%). This cluster has the highest share of male patients (72.1%), and the highest rate of coronary artery atherosclerosis (65.5%). Notably, patients in this cluster are the youngest (median age, 73.3; IQR, 65.1–80.5), have the lowest heart rates (median, 83.5; IQR, 75.0–90.1), and the lowest rate of arrhythmia history (12.8%).
- Cluster 2: Non-Cardiovascular Multimorbid (n = 3546)This cluster is characterized by the highest rate of chronic obstructive pulmonary disease (COPD) (16.6%) and diabetes (25.8%), while also having a high rate of renal insufficiency (43.9%). Patients in this cluster have the lowest rate of left and right atrial dilation (17.9%, 6.49%), coronary artery atherosclerosis (18.3%), and valvulopathies (12.6%) while having the highest rate of arrhythmia history (26.3%).
- Cluster 3: Cardiovascular Multimorbid (n = 557)Patients in this cluster are the oldest (median age, 78.1; IQR, 69.2–85.4) and have the highest rate of heart failure (85.5%). They have the highest rate of left and right atrial dilation (94.3%, 78.8%), thyroid disorders (16.0%), myocardial infarction (19.0%), renal insufficiency (54.6%), respiratory failure (40.2%), sepsis (30.9%), and obstructive sleep apnea (7.36%). Even though patients in this cluster have a high rate of comorbidities, they have the lowest rate of hypertension (27.1%).
- Cluster 4: Valvulopathy Atrial Dilation (n = 2335)This cluster is characterized by the highest rate of valvulopathies (45.2%) and a high rate of left and right atrial dilation (91.0%, 76.0%). Patients in this cluster further have the highest rates of cor pulmonale (14.3%) and a high rate of COPD (16.0%).
3.2. Treatment Effects
IPTW resulted in well-matched covariates between treatment groups within all outcomes. Variable means and maximum absolute pairwise standardized mean differences for treatment groups are shown in Supplementary Tables S2 and S3. The complete list of treatment effects is available in Supplementary Tables S4–S6.
3.2.1. Rhythm Control
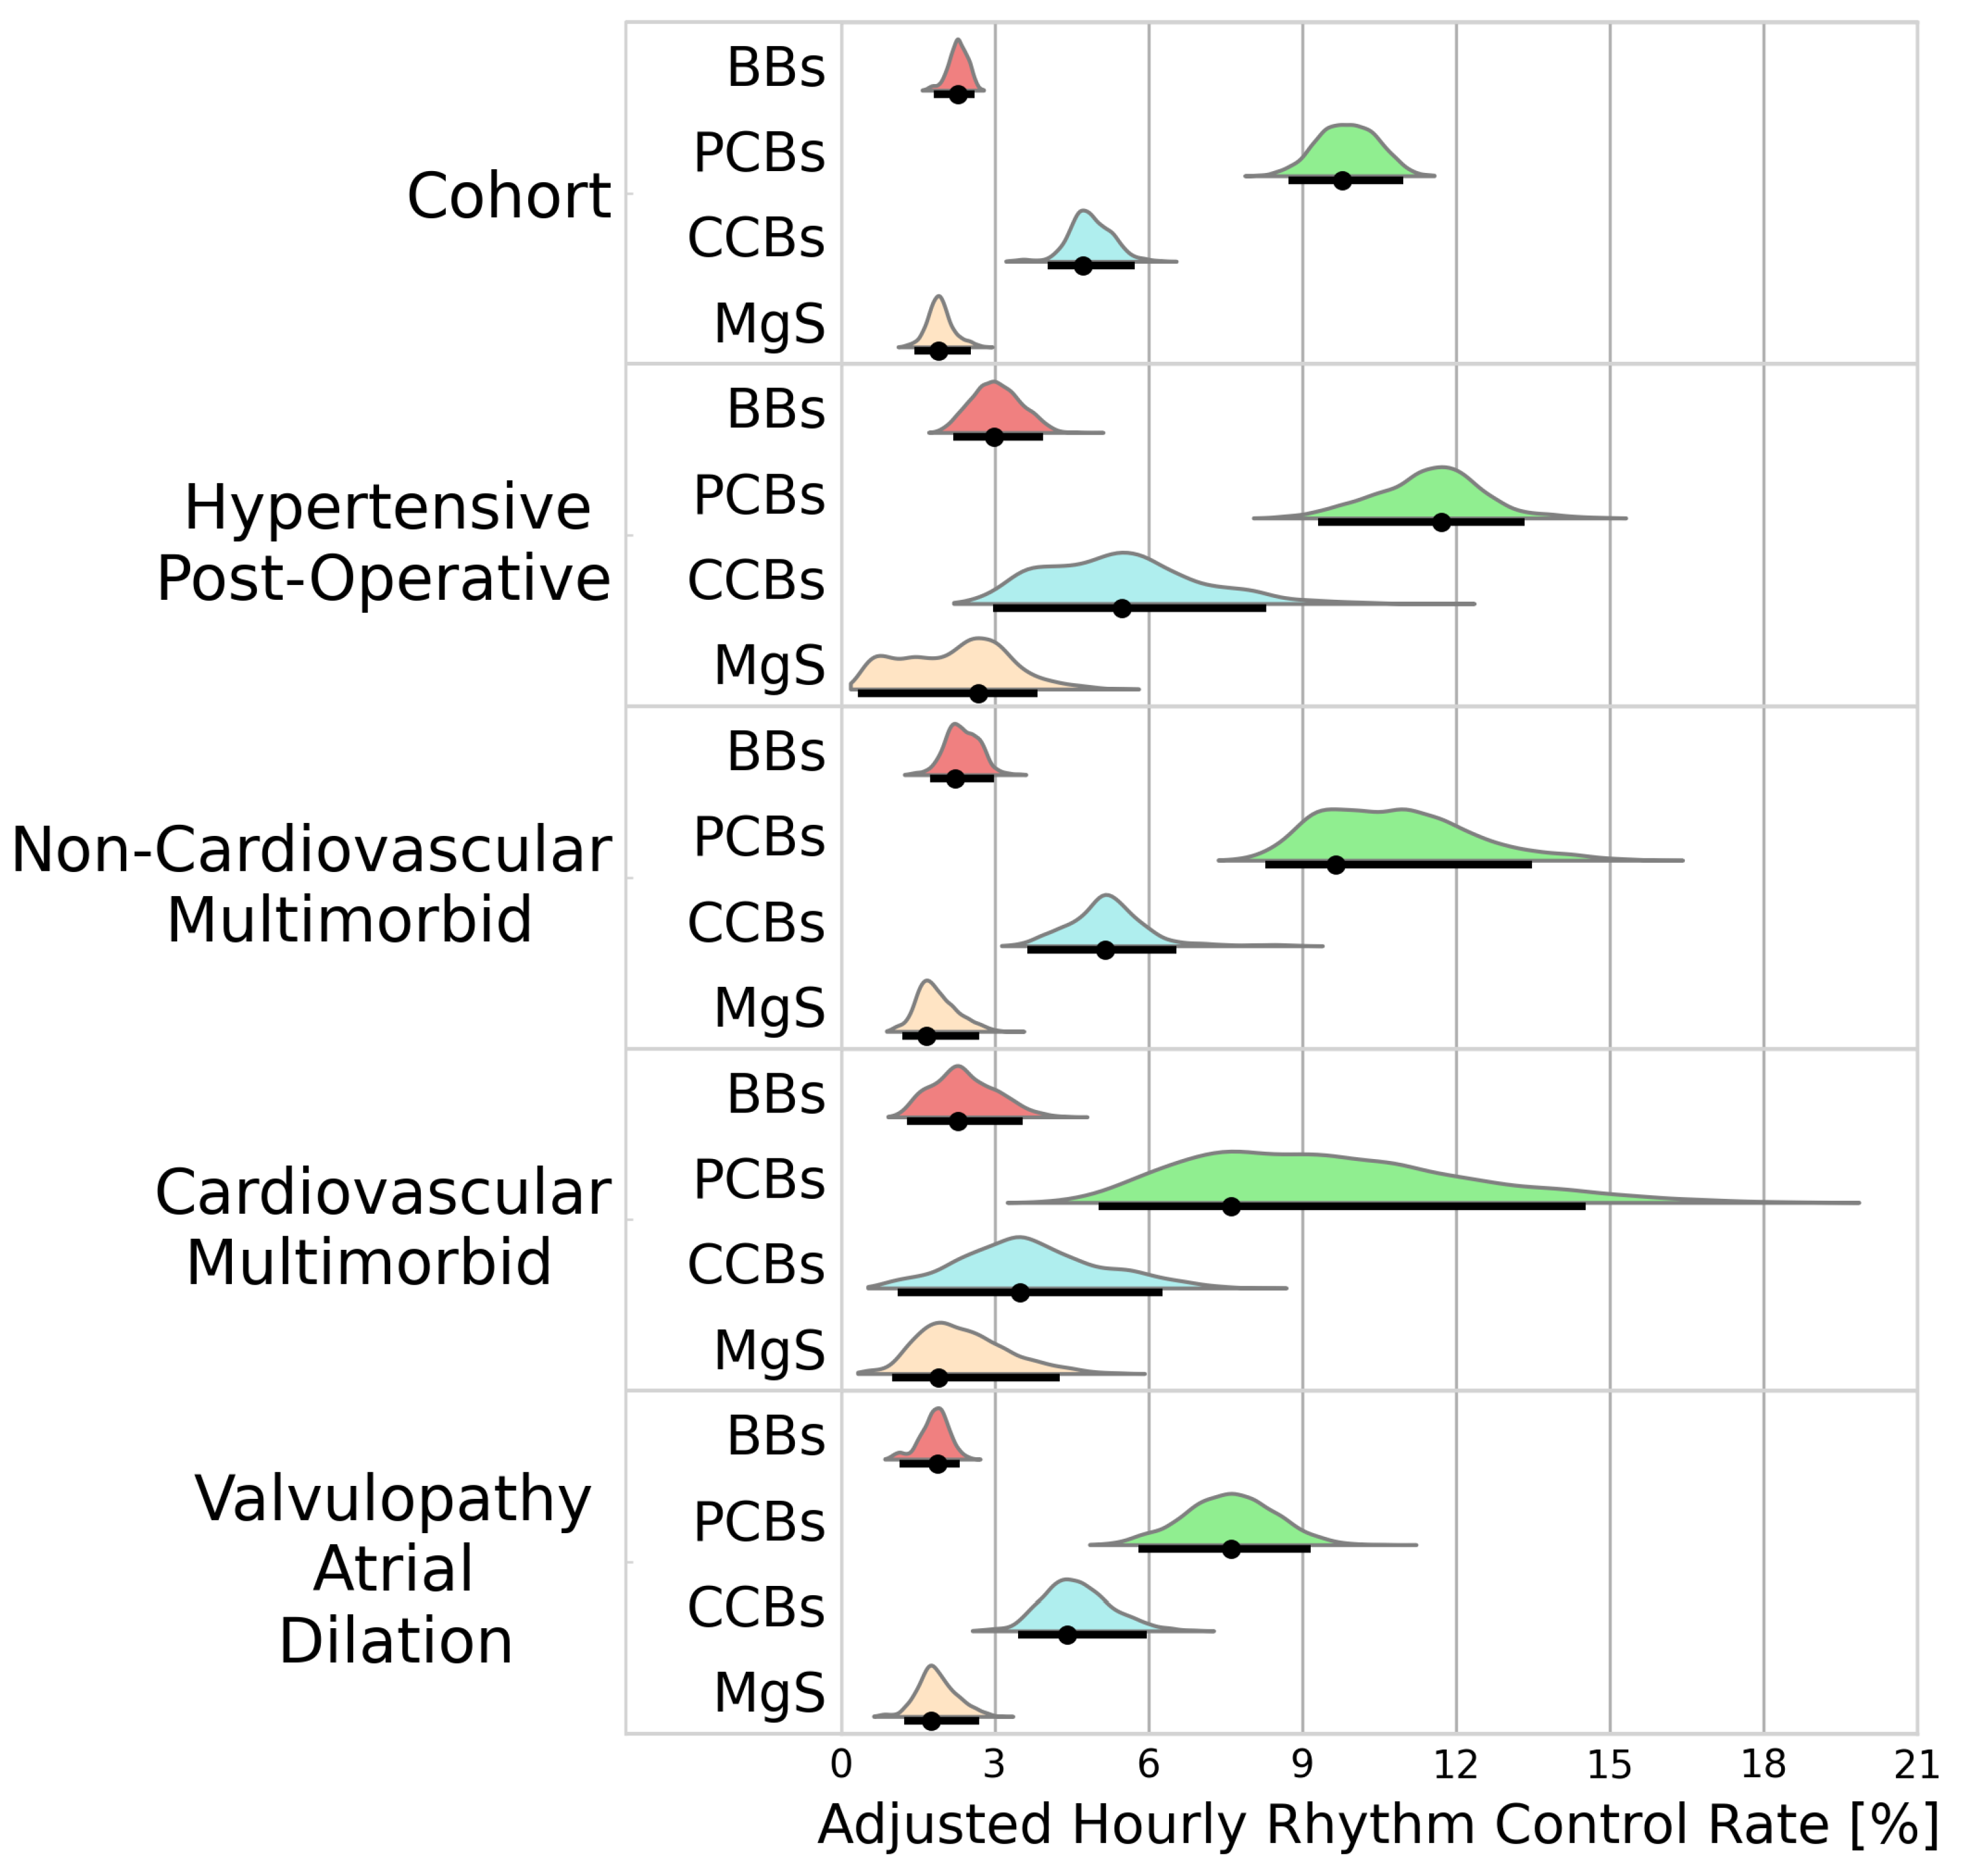
A total of 4116 patients received a treatment during an AF episode. BBs, PCBs, CCBs, and MgS were administered to 1277, 1388, 830, and 502 patients, respectively. Figure 2 portrays the adjusted hourly rhythm control rates for the cohort analysis and the individual clusters. Rhythm control was best achieved using PCBs (9.78%/h [8.74–11.0]), followed by CCBs (4.73%/h [4.04–5.74]). Inferior rhythm control was observed in patients receiving BBs (2.28%/h [1.81–2.61]) and MgS (1.90%/h [1.44–2.54]).
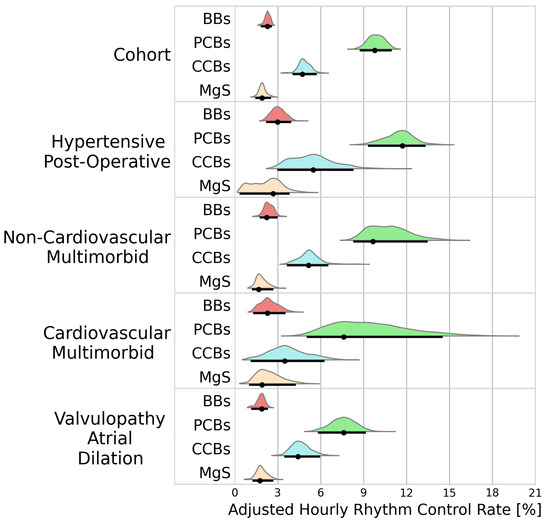
Figure 2.
Probability distributions of adjusted hourly rhythm control rates. Black dots represent the distribution modes. Black lines represent the 95% highest density intervals. BBs—beta blockers; PCBs—potassium channel blockers; CCBs—calcium channel blockers; MgS—magnesium sulphate.
Within the identified clusters, PCBs maintained superiority, but its efficacy varied considerably with higher conversion rate in patients in the hypertensive postoperative cluster than in patients in the valvulopathy atrial dilation cluster (11.6%/h [9.35–13.3] vs. 7.69%/h [5.80–9.22], BF > 100).
3.2.2. Rate Control
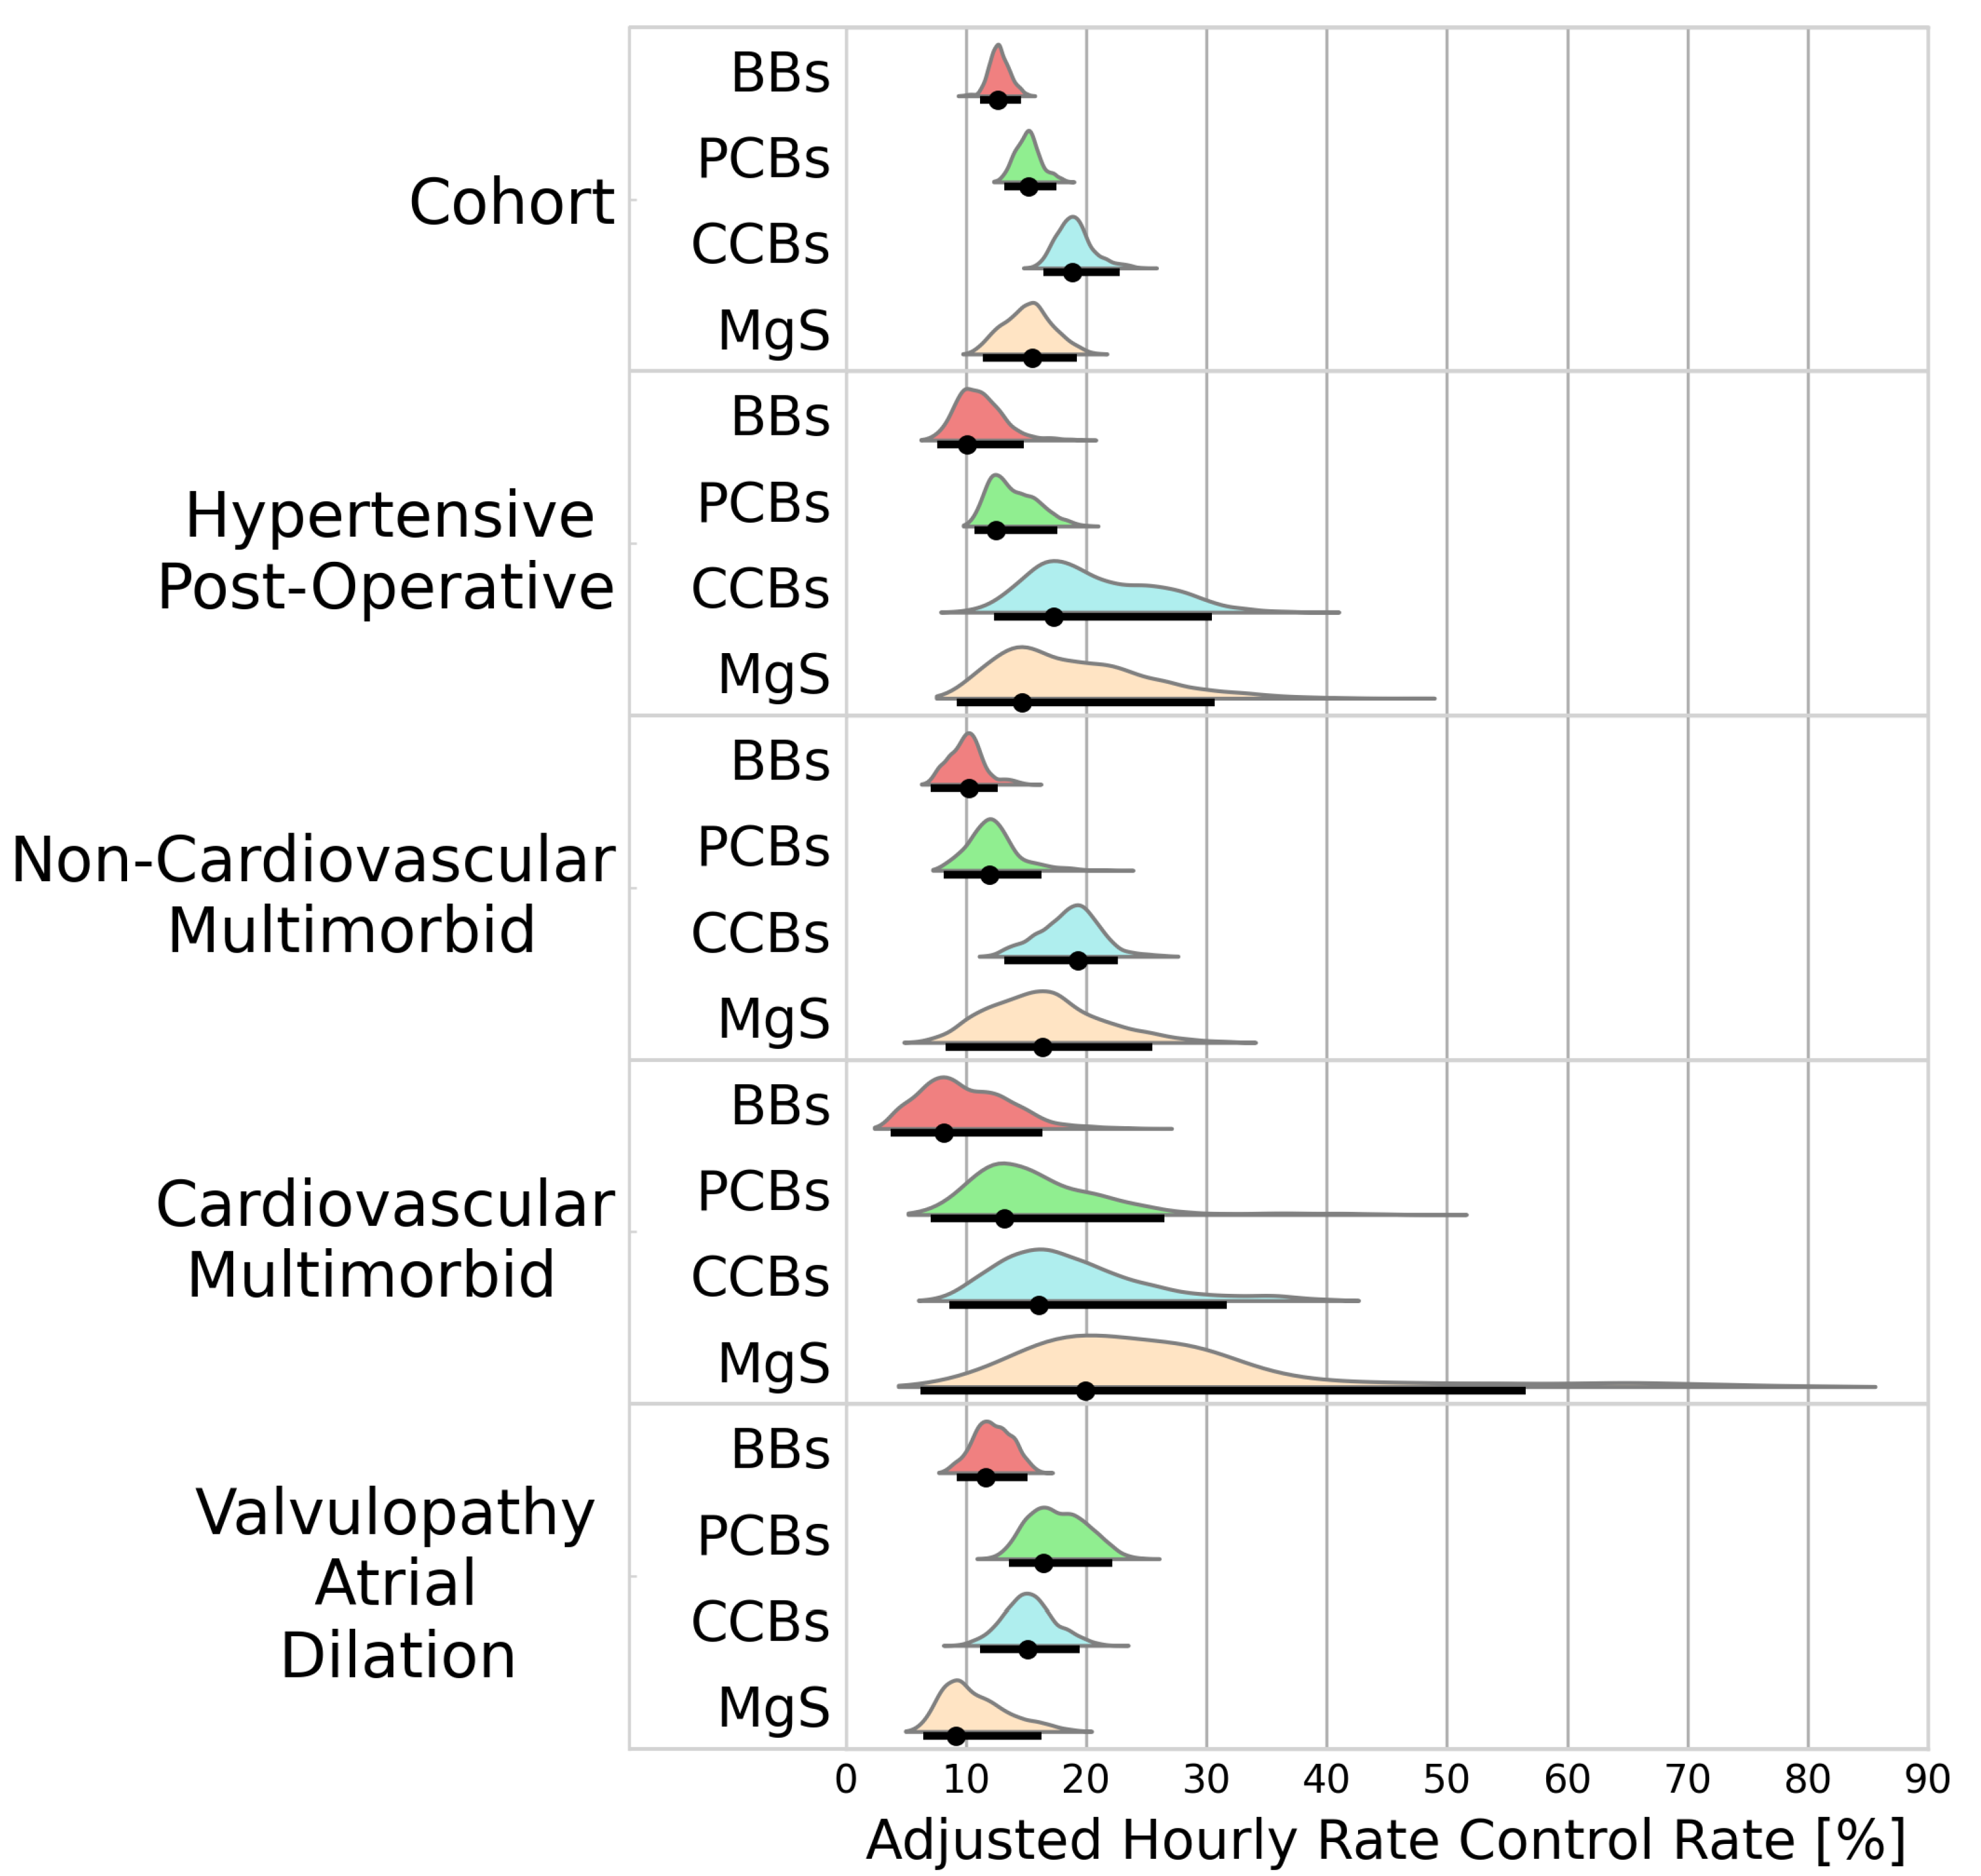
A total of 2333 patients received a treatment during an AF episode with rapid ventricular response. BBs, PCBs, CCBs, and MgS were administered to 566, 966, 644, and 157 patients, respectively. Rate control was best achieved using CCBs (18.8%/h [16.4–22.8]) followed by MgS (15.6%/h [11.4–19.2). Inferior rate control was observed for patients receiving PCBs and BBs (15.2%/h [13.2–17.5], 15.6%/h [11.4–19.2]). Figure 3 portrays the adjusted hourly rates for HR reduction below 100 bpm.
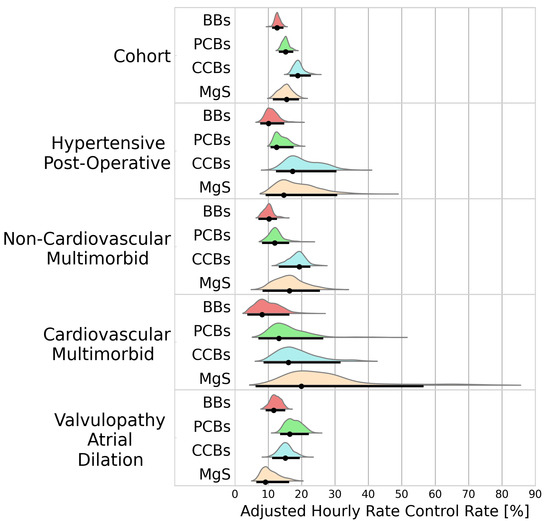
Figure 3.
Probability distributions of adjusted hourly rate control rates. Black dots represent the distribution modes. Black lines represent the 95% highest density intervals. BBs—beta blockers; PCBs—potassium channel blockers; CCBs—calcium channel blockers; MgS—magnesium sulphate.
The superiority of CCBs observed in the cohort analysis was not maintained among all clusters. Even though CCBs showed a higher efficacy at controlling ventricular rate than MgS in the entire cohort (BF = 14.8), the opposite was observed in the cardiovascular multimorbid cluster (18.3%/h [11.2–32.6] vs. 19.9%/h [7.92–57.5], BF = 0.40). Similarly, while CCBs outperformed PCBs in the cohort analysis (BF = 68.6), PCBs appeared to have a higher efficacy than CCBs in the valvulopathy atrial dilation cluster (18.2%/h [14.9–23.6] vs. 16.7%/h [12.6–20.9], BF = 3.26). While MgS showed superiority to BBs in the entire cohort analysis (BF = 5.83), the opposite was observed in the valvulopathy atrial dilation cluster (BF = 0.42).
3.2.3. Mortality
In-hospital mortality differed across treatment groups, with the highest mortality being observed in patients receiving MgS (1.45%/d [1.07–1.99]), followed by CCBs and BBs (1.40%/d [1.04–1.88], 1.28%/d [1.00–1.51]). The lowest mortality was observed for PCBs (0.95%/d [0.78–1.18]). Figure 4 presents the adjusted daily mortality rates for the cohort analysis, and the individual clusters.
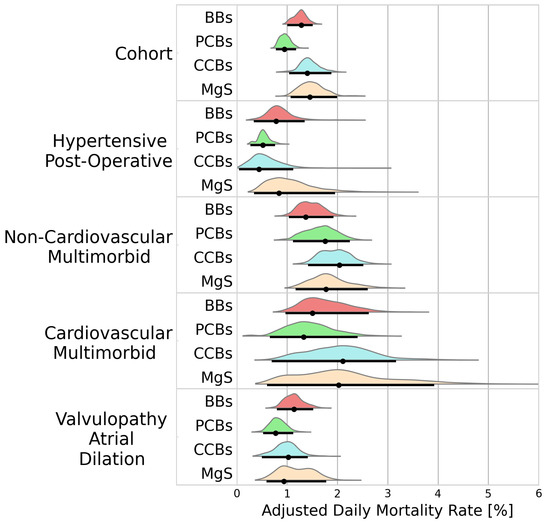
Figure 4.
Probability distributions of adjusted daily mortality rates. Black dots represent the distribution modes. Black lines represent the 95% highest density intervals. BBs—beta blockers; PCBs—potassium channel blockers; CCBs—calcium channel blockers; MgS—magnesium sulphate.
The mortality rates varied across the identified clusters. While PCBs were associated with the lowest mortality rates in the cohort analysis, this did not hold true within the hypertensive post-operative cluster, where mortality rates with PCBs were comparable to CCBs (0.52%/d [0.28–0.76] vs. 0.44%/d [0.05–1.15], BF = 1.02). In the non-cardiovascular multimorbid cluster, PCBs were associated with a higher mortality rate than BBs (1.68%/d [1.10–2.24] vs. 1.33%/d [1.04–1.93], BF = 2.23).
The results of the secondary analysis can be found in the supplementary material, and include: The cluster characteristics of the secondary analysis (Table S1), and probability distributions of adjusted treatment effects for the obtained clusters (Figures S1–S3).
4. Discussion
This study investigated clustering-derived AF phenotypes and their treatment effects in an ICU cohort. The main findings of the study are as follows. (i) The heterogeneity in the AF population, previously reported in community cohorts, can also be observed in the analyzed ICU population. (ii) ATEs differ between phenotypes and are often different from those observed when the treatment effect is averaged across the entire population.
In accordance with previous cluster analyses of AF populations, the analysis of the ICU cohort revealed recognizable patient groups, for example, the postoperative hypertensive cluster, which was characterized by young age and predominantly male patients. With postoperative conditions being known for triggering AF by means of causing inflammatory states, patients in this cluster had the lowest rates of arrhythmia history, and, thus, the highest proportion of new-onset AF.
Previous studies have utilized cluster analysis to explore the differences in treatment patterns and clinical outcomes in AF cohorts. Our work expands on this research by demonstrating that AF phenotypes derived from cluster analysis also exhibit heterogeneity in terms of ATEs. This finding is consistent with previous studies that have criticized the reporting of overall mean effects in clinical research, as such an approach may overlook important treatment effects that are specific to certain patient subgroups [37]. The observed heterogeneity in ATEs in this study carries major significance for clinical research. ATEs are commonly derived from the analysis of entire cohorts and heterogeneous treatment effects go unnoticed. For example, a previous study reported benefits in mortality of BBs versus CCBs [38], which we can confirm when analyzing the ATE for the complete cohort, but we find evidence of the opposite effect within two of the identified clusters. Similarly, we can confirm previous results showing that CCBs outperform PCBs in controlling ventricular rate [39] when considering the ATE on the entire cohort. Evaluating individual phenotypes, however, reveals evidence for the opposite effect for patients with valvulopathies and dilated atria. The identification of AF phenotypes may provide insight for further study design, and provide a method to evaluate heterogeneous cohorts such that heterogeneous treatment effects are not overlooked.
While heterogeneities in ATEs were observed among the identified phenotypes, several relationships did not appear as would be expected. Several contraindications of the investigated treatments are known, such as CCBs being contraindicated in patients with systolic heart failure, and amiodarone (PCB) in patients with thyroid disorders. Ideally, one would expect clusters characterized by such contraindications to emerge, and the expected ATEs to be reflected in the results. To what extent such clusters may emerge when a more fine-grained clustering is performed must be evaluated. Given our analysis does not reveal these existing treatment effects, it must be understood that we do not propose a formal classification.
Nonetheless, the presented results may have major clinical implications. A recent survey has shown that 75% of clinical decision-makers treating AF in the ICU would not change their intervention strategy depending on an underlying pathophysiological condition [13]. Our results underline the necessity of considering the pathophysiological presentation of patients during treatment selection, to maximize treatment utility and to minimize risk. Overlooking the heterogeneity in AF patients may result in inadequate treatment and lead to suboptimal patient outcomes.
Numerous studies [16,18,19,20,21] have suggested that a phenotype-driven approach for the management of AF may improve patient outcomes by either providing insights that drive further research, or by guiding treatment directly. However, some studies have reported conflicting results, such as phenotypes with high rates of anticoagulation being associated with increased incidence of ischemic events [16,18]. We have therefore provided ATEs in this work to further expand the idea of a phenotype classification for AF management. Such an approach can help quantify treatment effects for specific patient phenotypes, which can aid in selecting appropriate treatments to maximize desired effects while minimizing the probability of adverse outcomes. However, in order to implement such a quantification approach, additional studies are needed to validate our findings in prospective multi-center cohorts and determine the extent to which the results can be generalized beyond the specific cohort used in our study.
Limitations
The results of this study should be interpreted within the context of several limitations. First, the database used does not provide adequate temporal resolution for procedural and diagnostic codes, which are generated when a patient is discharged. It must therefore be understood that the obtained results inevitably suffer from look-ahead bias. Second, the selection of descriptive variables has profound impact on the results of cluster analysis. While care was taken to select relevant variables, candidate variables had to be removed due to data sparsity or were completely unavailable in the database. The inclusion of further variables may impact the results and reduce residual confounding. Third, the present study defined treatment groups according to the first treatment received during an AF episode. In practice, treatments may be administered in combinations, or incrementally escalated until the desired effect is achieved. Further, we have only considered a limited number of treatments due to relatively infrequent use of alternative antiarrhythmic drugs. A more extensive dataset may provide insights into the treatment effects of further antiarrhythmic agents. Fourth, while the employed unsupervised clustering algorithm has previously been shown to identify clinically relevant patient phenotypes, our approach of deciding the number of clusters was primarily based on investigator discretion. A common practice in unsupervised clustering would be the identification of the optimal number of clusters using a clustering metric, such as the silhouette score or the Calinski–Harabasz index. Such approaches have, however, not shown any usable results in our dataset, indicating a lack of structure in the covariate space. Other studies [40,41] have proposed semi-supervised cluster analysis to determine the appropriate number of clusters. Such methods form clusters that correlate with outcomes, identifying patient phenotypes with increased clinical significance. Finally, while the obtained results show significant differences in treatment effects, the obtained distributions were often too wide to give conclusive results. The use of a larger dataset may allow for more discriminatory results.
5. Conclusions
Cluster analysis of the employed ICU cohort identified four recognizable AF phenotypes defined by unique characteristics. Phenotypes showed different treatment effects, highlighting the heterogeneity of AF patients in critical care settings. Our results support the idea of a phenotype classification approach to support clinical decision making by quantifying treatment effects of individual patients and provide a basis for the design of further studies. Future works should consider the application of semi-supervised clustering methods to emphasize cohesive treatment effects in the formation of clusters, thereby maximizing their clinical significance.
Supplementary Materials
The following supporting information can be downloaded at: https://www.mdpi.com/article/10.3390/bioengineering11030199/s1, Table S1: Characteristics of the cohort, and the identified clusters of the secondary analysis. Table S2: Covariate means before and after inverse probability treatment weighting for rhythm control and mortality. Table S3: Covariate means before and after inverse probability treatment weighting for rate control. Table S4: Average treatment effects for the entire cohort and phenotypes-rhythm control. Table S5: Average treatment effects for the entire cohort and phenotypes-rate control. Table S6: Average treatment effects for the entire cohort and phenotypes-in-hospital mortality. Figure S1: Probability distributions of adjusted hourly rhythm control rates of the secondary analysis. Figure S2: Probability distributions of adjusted hourly rate control rates of the secondary analysis. Figure S3: Probability distributions of adjusted daily mortality rates of the secondary analysis.
Author Contributions
Conceptualization, A.L. and A.M.-M.; methodology, A.L. and A.M.-M.; software, A.L.; validation, A.L.; formal analysis, A.L.; investigation, A.L.; data curation, A.L.; writing—original draft preparation, A.L.; writing—review and editing, A.M.-M.; supervision, A.M.-M. All authors have read and agreed to the published version of the manuscript.
Funding
This project has received funding from the European Union’s Horizon 2020 research and innovation programme under the Marie Sklodowska-Curie grant agreement No 860974. This publication reflects only the authors’ view, and the funding agencies are not responsible for any use that may be made of the information it contains.
Institutional Review Board Statement
The MIMIC-III database used in the present study was approved by the Institutional Review Board of the Massachusetts Institute of Technology and does not contain protected health information.
Informed Consent Statement
Not applicable.
Data Availability Statement
The data used in this study are openly available, and can be found in the PhysioNet archive [42].
Conflicts of Interest
The authors declare no conflicts of interest.
Abbreviations
The following abbreviations are used in this manuscript:
| AF | Atrial fibrillation |
| ATE | Average treatment effect |
| BB | Beta blocker |
| BF | Bayes factor |
| CCB | Calcium channel blocker |
| COPD | Chronic obstructive pulmonary disease |
| HDI | Highest density interval |
| ICU | Intensive care unit |
| IQR | Interquartile range |
| MgS | Magnesium sulphate |
| NOAF | New onset atrial fibrillation |
| OSA | Obstructive sleep apnoe |
| PCB | Potassium channel blocker |
Appendix A
Table A1.
Percentage of data missing and source for each patient characteristic. Source codes are SNOMED unless stated otherwise.
Table A1.
Percentage of data missing and source for each patient characteristic. Source codes are SNOMED unless stated otherwise.
| Category | Characteristic | Missing (%) | Standard Name | Source Code |
|---|---|---|---|---|
| Medical History | Anemia | 0.00 | Anemia | 271737000 |
| Arrhythmia history | 0.00 | Arrhythmia history | MIMIC ITEMID: 225811 | |
| Collagen disease | 0.00 | Systemic lupus erythematosus | 55464009 | |
| Polymyalgia rheumatica | 65323003 | |||
| Sjögren’s syndrome | 83901003 | |||
| 81573002 | 81573002 | |||
| COPD | 0.00 | Chronic obstructive lung disease | 13645005 | |
| Cor pulmonale | 0.00 | Acute cor pulmonale | 49584005 | |
| Chronic pulmonary heart disease | 87837008 | |||
| Pulmonary arterial hypertension | 11399002 | |||
| Coronary artery atherosclerosis | 0.00 | Coronary arteriosclerosis | 53741008 | |
| Diabetes | 0.00 | Type 1 diabetes mellitus | 46635009 | |
| Type 2 diabetes mellitus | 44054006 | |||
| Diabetes insipidus | 15771004 | |||
| Diabetes mellitus | 73211009 | |||
| Type 2 diabetes mellitus without complication | 313436004 | |||
| Nephrogenic diabetes insipidus | 111395007 | |||
| Diabetic ketoacidosis | 420422005 | |||
| Medical History | Heart failure | 0.00 | Congestive rheumatic heart failure | 82523003 |
| Acute systolic heart failure | 443254009 | |||
| Diastolic heart failure | 418304008 | |||
| Congestive heart failure | 42343007 | |||
| Chronic diastolic heart failure | 441530006 | |||
| Acute diastolic heart failure | 443343001 | |||
| Heart failure | 84114007 | |||
| Systolic heart failure | 417996009 | |||
| Acute on chronic systolic heart failure | 443253003 | |||
| Acute on chronic diastolic heart failure | 443344007 | |||
| Chronic systolic heart failure | 441481004 | |||
| Acute combined systolic and diastolic heart failure | 153931000119109 | |||
| Acute on chronic combined systolic and diastolic heart failure | 153951000119103 | |||
| Chronic combined systolic and diastolic heart failure | 153941000119100 | |||
| Hypertension | 0.00 | 59621000 | ||
| Myocardial infarction | 0.00 | Acute subendocardial infarction | 70422006 | |
| Myocardial infarction | 22298006 | |||
| OSA | 0.00 | Obstructive sleep apnea syndrome | 78275009 | |
| Post-operative condition | 0.00 | Percutaneous transluminal coronary angioplasty [PTCA] | OMOP:2000064 | |
| Insertion of non-drug-eluting coronary artery stent(s) | OMOP:2001505 | |||
| Angioplasty of other non-coronary vessel(s) | OMOP:2002222 | |||
| Multiple vessel percutaneous transluminal coronary angioplasty [PTCA] or coronary atherectomy performed during the same operation, with or without mention of thrombolytic agent | OMOP:2001504 | |||
| Open and other replacement of aortic valve | OMOP:2001450 | |||
| (Aorto)coronary bypass of four or more coronary arteries | OMOP:2001513 | |||
| Open heart valvuloplasty of mitral valve without replacement | OMOP:2001444 | |||
| (Aorto)coronary bypass of two coronary arteries | OMOP:2001511 | |||
| Open and other replacement of mitral valve with tissue graft | OMOP:2001451 | |||
| Open and other replacement of mitral valve | OMOP:2001452 | |||
| Insertion of drug-eluting coronary artery stent(s) | OMOP:2001506 | |||
| Extracorporeal circulation auxiliary to open heart surgery | OMOP:2002243 | |||
| Open and other replacement of aortic valve with tissue graft | OMOP:2001449 | |||
| Pericardiotomy | OMOP:2001533 | |||
| (Aorto)coronary bypass of three coronary arteries | OMOP:2001512 | |||
| (Aorto)coronary bypass of one coronary artery | OMOP:2001510 | |||
| Medical History | Renal insufficiency | 0.00 | Renal failure syndrome | 42399005 |
| Chronic kidney disease | 709044004 | |||
| Acute renal failure syndrome | 14669001 | |||
| Chronic kidney disease stage 1 | 431855005 | |||
| Chronic kidney disease stage 2 | 431856006 | |||
| Chronic kidney disease stage 3 | 433144002 | |||
| Chronic kidney disease stage 4 | 431857002 | |||
| Chronic kidney disease stage 5 | 433146000 | |||
| Benign hypertensive renal disease with renal failure | 698591006 | |||
| End-stage renal disease | 46177005 | |||
| Chronic kidney disease stage 5 due to hypertension | 129161000119100 | |||
| Respiratory failure | 0.0 0 | Acute respiratory failure | 65710008 | |
| Rheumatism | 0.00 | Rheumatic aortic stenosis | 72011007 | |
| Rheumatic mitral regurgitation | 31085000 | |||
| Rheumatic aortic stenosis with insufficiency | 17759006 | |||
| Congestive rheumatic heart failure | 82523003 | |||
| Rheumatic disease of aortic valve | 12023003 | |||
| Rheumatoid arthritis | 69896004 | |||
| Rheumatic heart disease | 23685000 | |||
| Rheumatic disease of pulmonary valve | 18687009 | |||
| Rheumatic aortic regurgitation | 78031003 | |||
| Sepsis | 0.00 | Sepsis | 91302008 | |
| Septic shock | 76571007 | |||
| Severe sepsis | 1036671000000106 | |||
| Thyroid disorder | 0.00 | Primary malignant neoplasm of thyroid gland | 94098005 | |
| Congenital hypothyroidism | 190268003 | |||
| Thyrotoxic crisis | 29028009 | |||
| Benign neoplasm of thyroid gland | 92439006 | |||
| Acquired hypothyroidism | 111566002 | |||
| Disorder of thyroid gland | 14304000 | |||
| Medical History | Valvulopathy | 0.00 | Mitral valve regurgitation | 48724000 |
| Mitral and aortic incompetence | 194736003 | |||
| Ebstein’s anomaly | 204357006 | |||
| Subaortic stenosis | 204368006 | |||
| Mitral valve stenosis | 79619009 | |||
| Trauma and postoperative pulmonary insufficiency | 266370006 | |||
| Rheumatic aortic stenosis | 72011007 | |||
| Mitral stenosis and aortic insufficiency | 194734000 | |||
| Mitral and aortic stenosis | 194733006 | |||
| Rheumatic mitral regurgitation | 31085000 | |||
| Rheumatic aortic stenosis with regurgitation | 17759006 | |||
| Aortic valve disorder | 8722008 | |||
| Aortic valve regurgitation | 60234000 | |||
| Tricuspid valve disorder | 20721001 | |||
| Mitral insufficiency and aortic stenosis | 194735004 | |||
| Mitral valve disorder | 11851006 | |||
| Aortic valve stenosis | 60573004 | |||
| Rheumatic disease of aortic valve | 12023003 | |||
| Rheumatic aortic regurgitation | 78031003 | |||
| Mitral stenosis with insufficiency | 194726006 | |||
| Laboratory Measurement | Erythrocyte count [#/µm] | 0.97 | Erythrocytes [#/volume] in Blood by Automated count | LOINC:789-8 |
| Erythrocyte distribution width [ratio] | 0.98 | Erythrocyte distribution width [Ratio] by Automated count | LOINC:788-0 | |
| Hemoglobin [g/dL] | 0.88 | Hemoglobin [Mass/volume] in Blood | LOINC:718-7 | |
| Leukocyte count | 0.96 | Leukocytes [#/volume] in Blood by Manual count | LOINC:804-5 | |
| Platelet count | 0.93 | Platelets [#/volume] in Blood by Manual count | LOINC:778-1 | |
| Platelets [#/volume] in Blood by Automated count | LOINC:777-3 | |||
| Prothrombin time | 1.80 | Prothrombin time (PT) | LOINC:5902-2 | |
| Serum calcium [mg/dL] | 5.07 | Calcium [Mass/volume] in Serum or Plasma | LOINC:17861-6 | |
| Serum creatinine [mg/dL] | 0.87 | Creatinine [Mass/volume] in Serum or Plasma | LOINC:2160-0 | |
| Serum magnesium [mg/dL] | 1.40 | Magnesium [Moles/volume] in Serum or Plasma | LOINC:2601-3 | |
| Serum potassium [mmol/L] | 1.03 | Potassium [Moles/volume] in Serum or Plasma | LOINC:2823-3 | |
| Serum sodium [mmol/L] | 1.04 | Sodium [Moles/volume] in Serum or Plasma | LOINC:2951-2 | |
| Observation | Heart Rate [BPM] | 2.34 | Heart rate | LOINC:8867-4 |
| Left Atrial Dilation | 0.00 | - | String matching from clinical notes | |
| Right Atrial Dilation | 0.00 | - | String matching from clinical notes | |
| Demographic | Age | 0.00 | - | - |
| Male sex | 0.00 | “MALE”/”FEMALE” | OMOP:8507 OMOP:8532 |
Table A2.
Characteristics of the cohort, and the identified clusters.
Table A2.
Characteristics of the cohort, and the identified clusters.
| Category | Variable | Entire Cohort (n = 9401) | Cluster 1 (n = 2963) | Cluster 2 (n = 3546) | Cluster 3 (n = 557) | Cluster 4 (n = 2335) | p-Value (among Clusters) |
|---|---|---|---|---|---|---|---|
| Medical History | Anemia | 1127 (11.99) | 390 (13.16) | 369 (10.41) | 70 (12.57) | 298 (12.76) | <0.001 |
| Arrhythmia History | 1959 (20.8) | 380 (12.8) | 932 (26.3) | 113 (20.3) | 534 (22.9) | <0.001 | |
| Collagen disease | 115 (1.22) | 24 (0.81) | 58 (1.64) | 11 (1.97) | 22 (0.94) | <0.001 | |
| COPD | 1256 (13.4) | 226 (7.63) | 588 (16.6) | 68 (12.2) | 374 (16.0) | <0.001 | |
| Cor pulmonale | 754 (8.02) | 179 (6.04) | 164 (4.62) | 77 (13.8) | 334 (14.3) | <0.001 | |
| Coronary artery atherosclerosis | 3461 (36.8) | 1941 (65.5) | 650 (18.3) | 223 (40.0) | 647 (27.7) | <0.001 | |
| Diabetes | 2147 (22.8) | 677 (22.9) | 915 (25.8) | 101 (18.1) | 454 (19.4) | <0.001 | |
| Heart failure | 4128 (43.9) | 851 (28.7) | 1441 (40.6) | 476 (85.5) | 1360 (58.2) | <0.001 | |
| Hypertension | 4562 (48.5) | 1924 (64.9) | 1401 (39.5) | 151 (27.1) | 1085 (46.5) | <0.001 | |
| Myocardial infarction | 933 (9.92) | 403 (13.6) | 167 (4.71) | 106 (19.0) | 257 (11.0) | <0.001 | |
| OSA | 403 (4.29) | 130 (4.39) | 126 (3.55) | 41 (7.36) | 106 (4.54) | <0.001 | |
| Post-operative condition | 3250 (34.6) | 2198 (74.2) | 215 (6.06) | 92 (16.5) | 745 (31.9) | <0.001 | |
| Renal insufficiency | 3261 (34.7) | 519 (17.5) | 1555 (43.9) | 304 (54.6) | 883 (37.8) | <0.001 | |
| Respiratory failure | 1450 (15.4) | 118 (3.98) | 819 (23.1) | 224 (40.2) | 289 (12.4) | <0.001 | |
| Rheumatism | 403 (4.29) | 126 (4.25) | 82 (2.31) | 33 (5.92) | 162 (6.94) | <0.001 | |
| Sepsis | 1144 (12.2) | 56 (1.89) | 651 (18.4) | 172 (30.9) | 265 (11.4) | <0.001 | |
| Thyroid disorder | 1051 (11.2) | 246 (8.30) | 398 (11.2) | 89 (16.0) | 318 (13.6) | <0.001 | |
| Valvulopathy | 2865 (30.5) | 1230 (41.5) | 446 (12.6) | 133 (23.9) | 1056 (45.2) | <0.001 | |
| Laboratory Measurement | Erythrocyte count [#/m] | 3.88 (3.38–4.37) | 3.88 (3.32–4.39) | 3.86 (3.39–4.35) | 3.82 (3.31–4.23) | 3.91 (3.44–4.39) | <0.001 |
| Erythrocyte distribution width [ratio] | 14.4 (13.5–15.7) | 13.9 (13.2–14.7) | 14.7 (13.7–16.2) | 15.1 (13.9–16.8) | 14.5 (13.7–15.9) | <0.001 | |
| Hemoglobin [g/dL] | 12.1 (10.6–13.4) | 12.6 (11.3–13.8) | 11.7 (10.2–13.2) | 11.5 (10.1–12.8) | 12.0 (10.6–13.4) | <0.001 | |
| Leukocyte count [#/nL] | 10.0 (7.30–13.7) | 9.4 (7.10–12.6) | 10.6 (7.50–14.6) | 10.6 (7.60–14.7) | 9.90 (7.10–13.4) | <0.001 | |
| Platelet count [#/nL] | 215 (163–279) | 197 (153–249) | 230 (171–299) | 212 (163–285) | 222 (167–286) | <0.001 | |
| Prothrombin time [s] | 14.5 (13.1–18.1) | 14.1 (13.0–16.0) | 14.7 (13.1–20.2) | 15.2 (13.4–20.7) | 14.6 (13.2–19.0) | <0.001 | |
| Serum calcium [mg/dL] | 8.60 (8.10–9.10) | 8.6 (8.20–9.00) | 8.60 (8.10–9.00) | 8.60 (8.10–9.10) | 8.70 (8.20–9.10) | <0.001 | |
| Serum creatinine [mg/dL] | 1.10 (0.80–1.50) | 1.00 (0.80–1.20) | 1.10 (0.80–1.70) | 1.30 (0.90–1.90) | 1.10 (0.90–1.50) | <0.001 | |
| Serum magnesium [mg/dL] | 2.00 (1.80–2.20) | 2.00 (1.80–2.30) | 1.90 (1.70–2.20) | 2.00 (1.80–2.30) | 2.00 (1.80–2.20) | <0.001 | |
| Serum potassium [mmol/L] | 4.20 (3.90–4.70) | 4.20 (3.90–4.60) | 4.20 (3.80–4.70) | 4.30 (3.80–4.80) | 4.20 (3.90–4.70) | <0.001 | |
| Serum sodium [mmol/L] | 139 (136–141) | 139 (137–141) | 139 (136–141) | 139 (136–141) | 139 (136–141) | <0.001 | |
| Observation | Heart Rate [BPM] | 85.5 (75.0–98.0) | 83.5 (75.0–91.0) | 87.8 (74.0–103) | 87.0 (74.0–104) | 86.0 (74.0–99.0) | <0.001 |
| Left Atrial Dilation | 4183 (44.5) | 898 (30.3) | 636 (17.9) | 525 (94.3) | 2124 (91.0) | <0.001 | |
| Right Atrial Dilation | 2813 (29.9) | 371 (12.5) | 230 (6.49) | 439 (78.8) | 1773 (75.9) | <0.001 | |
| Demographic | Age [years] | 76.5 (67.3–83.6) | 73.3 (65.1–80.5) | 78.0 (68.7–85.1) | 78.1 (69.2–85.4) | 77.8 (68.9–84.3) | <0.001 |
| Male sex | 5364 (57.1) | 2136 (72.1) | 1671 (47.1) | 277 (49.7) | 1280 (54.8) | <0.001 |
References
- Chugh, S.S.; Havmoeller, R.; Narayanan, K.; Singh, D.; Rienstra, M.; Benjamin, E.J.; Gillum, R.F.; Kim, Y.H.; McAnulty, J.H.; Zheng, Z.J.; et al. Worldwide Epidemiology of Atrial Fibrillation. Circulation 2014, 129, 837–847. [Google Scholar] [CrossRef]
- Yoshida, T.; Fujii, T.; Uchino, S.; Takinami, M. Epidemiology, prevention, and treatment of new-onset atrial fibrillation in critically ill: A systematic review. J. Intensive Care 2015, 3, 19. [Google Scholar] [CrossRef] [PubMed]
- Clayton, B.; Ball, S.; Read, J.; Waddy, S. Risk of thromboembolism in patients developing critical illness-associated atrial fibrillation. Clin. Med. 2018, 18, 282–287. [Google Scholar] [CrossRef] [PubMed]
- Shaver, C.M.; Chen, W.; Janz, D.R.; May, A.K.; Darbar, D.; Bernard, G.R.; Bastarache, J.A.; Ware, L.B. Atrial Fibrillation Is an Independent Predictor of Mortality in Critically Ill Patients*. Crit. Care Med. 2015, 43, 2104–2111. [Google Scholar] [CrossRef] [PubMed]
- Brugada, R.; Tapscott, T.; Czernuszewicz, G.Z.; Marian, A.; Iglesias, A.; Mont, L.; Brugada, J.; Girona, J.; Domingo, A.; Bachinski, L.L.; et al. Identification of a Genetic Locus for Familial Atrial Fibrillation. N. Engl. J. Med. 1997, 336, 905–911. [Google Scholar] [CrossRef] [PubMed]
- Kannel, W.; Wolf, P.; Benjamin, E.; Levy, D. Prevalence, incidence, prognosis, and predisposing conditions for atrial fibrillation: Population-based estimates 11Reprints are not available. Am. J. Cardiol. 1998, 82, 2N–9N. [Google Scholar] [CrossRef] [PubMed]
- Wijesurendra, R.S.; Casadei, B. Mechanisms of atrial fibrillation. Heart 2019, 105, 1860–1867. [Google Scholar] [CrossRef] [PubMed]
- Bosch, N.A.; Cimini, J.; Walkey, A.J. Atrial Fibrillation in the ICU. Chest 2018, 154, 1424–1434. [Google Scholar] [CrossRef] [PubMed]
- Wetterslev, M.; Haase, N.; Hassager, C.; Belley-Cote, E.P.; McIntyre, W.F.; An, Y.; Shen, J.; Cavalcanti, A.B.; Zampieri, F.G.; Guimaraes, H.P.; et al. New-onset atrial fibrillation in adult critically ill patients: A scoping review. Intensive Care Med. 2019, 45, 928–938. [Google Scholar] [CrossRef]
- Calvo, D.; Filgueiras-Rama, D.; Jalife, J. Mechanisms and Drug Development in Atrial Fibrillation. Pharmacol. Rev. 2018, 70, 505–525. [Google Scholar] [CrossRef]
- Bedford, J.P.; Johnson, A.; Redfern, O.; Gerry, S.; Doidge, J.; Harrison, D.; Rajappan, K.; Rowan, K.; Young, J.D.; Mouncey, P.; et al. Comparative effectiveness of common treatments for new-onset atrial fibrillation within the ICU: Accounting for physiological status. J. Crit. Care 2022, 67, 149–156. [Google Scholar] [CrossRef]
- Goette, A.; Borof, K.; Breithardt, G.; Camm, A.J.; Crijns, H.J.; Kuck, K.H.; Wegscheider, K.; Kirchhof, P.; on behalf of the EAST-AFNET 4 Investigators. Presenting Pattern of Atrial Fibrillation and Outcomes of Early Rhythm Control Therapy. J. Am. Coll. Cardiol. 2022, 80, 283–295. [Google Scholar] [CrossRef]
- Wetterslev, M.; Møller, M.H.; Granholm, A.; Hassager, C.; Haase, N.; Aslam, T.N.; Shen, J.; Young, P.J.; Aneman, A.; Hästbacka, J.; et al. Management of acute atrial fibrillation in the intensive care unit: An international survey. Acta Anaesthesiol. Scand. 2022, 66, 375–385. [Google Scholar] [CrossRef]
- Moskowitz, A.; Chen, K.P.; Cooper, A.Z.; Chahin, A.; Ghassemi, M.M.; Celi, L.A. Management of Atrial Fibrillation with Rapid Ventricular Response in the Intensive Care Unit. Shock 2017, 48, 436–440. [Google Scholar] [CrossRef]
- Walkey, A.J.; Hogarth, D.K.; Lip, G.Y. Optimizing Atrial Fibrillation Management. Chest 2015, 148, 859–864. [Google Scholar] [CrossRef] [PubMed]
- Inohara, T.; Shrader, P.; Pieper, K.; Blanco, R.G.; Thomas, L.; Singer, D.E.; Freeman, J.V.; Allen, L.A.; Fonarow, G.C.; Gersh, B.; et al. Association of of Atrial Fibrillation Clinical Phenotypes With Treatment Patterns and Outcomes. JAMA Cardiol. 2018, 3, 54. [Google Scholar] [CrossRef] [PubMed]
- Inohara, T.; Piccini, J.P.; Mahaffey, K.W.; Kimura, T.; Katsumata, Y.; Tanimoto, K.; Inagawa, K.; Ikemura, N.; Ueda, I.; Fukuda, K.; et al. A Cluster Analysis of the Japanese Multicenter Outpatient Registry of Patients with Atrial Fibrillation. Am. J. Cardiol. 2019, 124, 871–878. [Google Scholar] [CrossRef] [PubMed]
- Pastori, D.; Antonucci, E.; Milanese, A.; Menichelli, D.; Palareti, G.; Farcomeni, A.; Pignatelli, P. Clinical Phenotypes of Atrial Fibrillation and Mortality Risk—A Cluster Analysis from the Nationwide Italian START Registry. J. Pers. Med. 2022, 12, 785. [Google Scholar] [CrossRef] [PubMed]
- Suzuki, S.; Yamashita, T.; Otsuka, T.; Arita, T.; Yagi, N.; Kishi, M.; Semba, H.; Kano, H.; Matsuno, S.; Kato, Y.; et al. Identifying risk patterns in older adults with atrial fibrillation by hierarchical cluster analysis: A retrospective approach based on the risk probability for clinical events. IJC Heart Vasc. 2021, 37, 100883. [Google Scholar] [CrossRef] [PubMed]
- Vitolo, M.; Proietti, M.; Shantsila, A.; Boriani, G.; Lip, G.Y.H. Clinical Phenotype Classification of Atrial Fibrillation Patients Using Cluster Analysis and Associations with Trial-Adjudicated Outcomes. Biomedicines 2021, 9, 843. [Google Scholar] [CrossRef]
- Watanabe, E.; Inoue, H.; Atarashi, H.; Okumura, K.; Yamashita, T.; Kodani, E.; Kiyono, K.; Origasa, H. Clinical phenotypes of patients with non-valvular atrial fibrillation as defined by a cluster analysis: A report from the J-RHYTHM registry. IJC Heart Vasc. 2021, 37, 100885. [Google Scholar] [CrossRef]
- Johnson, A.E.; Pollard, T.J.; Shen, L.; Lehman, L.-w.H.; Feng, M.; Ghassemi, M.; Moody, B.; Szolovits, P.; Celi, L.A.; Mark, R.G. MIMIC-III, a freely accessible critical care database. Sci. Data 2016, 3, 160035. [Google Scholar] [CrossRef] [PubMed]
- Fromm, C.; Suau, S.J.; Cohen, V.; Likourezos, A.; Jellinek-Cohen, S.; Rose, J.; Marshall, J. Diltiazem vs. Metoprolol in the Management of Atrial Fibrillation or Flutter with Rapid Ventricular Rate in the Emergency Department. J. Emerg. Med. 2015, 49, 175–182. [Google Scholar] [CrossRef]
- Ding, E.Y.; Albuquerque, D.; Winter, M.; Binici, S.; Piche, J.; Bashar, S.K.; Chon, K.; Walkey, A.J.; McManus, D.D. Novel Method of Atrial Fibrillation Case Identification and Burden Estimation Using the MIMIC-III Electronic Health Data Set. J. Intensive Care Med. 2019, 34, 851–857. [Google Scholar] [CrossRef]
- Reisinger, S.J.; Ryan, P.B.; O’Hara, D.J.; Powell, G.E.; Painter, J.L.; Pattishall, E.N.; Morris, J.A. Development and evaluation of a common data model enabling active drug safety surveillance using disparate healthcare databases. J. Am. Med. Inform. Assoc. 2010, 17, 652–662. [Google Scholar] [CrossRef]
- Paris, N.; Lamer, A.; Parrot, A. Transformation and Evaluation of the MIMIC Database in the OMOP Common Data Model: Development and Usability Study. JMIR Med. Inform. 2021, 9, e30970. [Google Scholar] [CrossRef]
- Williams, E.M.V. A Classification of Antiarrhythmic Actions Reassessed After a Decade of New Drugs. J. Clin. Pharmacol. 1984, 24, 129–147. [Google Scholar] [CrossRef] [PubMed]
- Rubin, D. Multiple Imputation for Nonresponse in Surveys; John Wiley & Sons, Inc.: Hoboken, NJ, USA, 1987. [Google Scholar] [CrossRef]
- van Buuren, S.; Groothuis-Oudshoorn, K. mice: Multivariate Imputation by Chained Equations in R. J. Stat. Softw. 2011, 45, 1–67. [Google Scholar] [CrossRef]
- Bodner, T.E. What Improves with Increased Missing Data Imputations? Struct. Equ. Model. A Multidiscip. J. 2008, 15, 651–675. [Google Scholar] [CrossRef]
- Rosenbaum, P.R.; Rubin, D.B. The central role of the propensity score in observational studies for causal effects. Biometrika 1983, 70, 41–55. [Google Scholar] [CrossRef]
- Ridgeway, G.; Mccaffrey, D.; Morral, A.; Burgette, L.; Griffin, B.A. Twang: Toolkit for Weighting and Analysis of Nonequivalent Groups. R Package Version 1.0–1. R Foundation for Statistical Computing. 2006. Available online: http://www.cran.r-project.org (accessed on 22 July 2022).
- Gower, J.C. A General Coefficient of Similarity and Some of Its Properties. Biometrics 1971, 27, 857. [Google Scholar] [CrossRef]
- Gail, M.H.; Byar, D.P. Variance Calculations for Direct Adjusted Survival Curves, with Applications to Testing for No Treatment Effect. Biom. J. 1986, 28, 587–599. [Google Scholar] [CrossRef]
- Rubin, D.B. The Bayesian Bootstrap. Ann. Stat. 1981, 9, 130–134. [Google Scholar] [CrossRef]
- Kass, R.E.; Raftery, A.E. Bayes Factors. J. Am. Stat. Assoc. 1995, 90, 773–795. [Google Scholar] [CrossRef]
- Iwashyna, T.J.; Burke, J.F.; Sussman, J.B.; Prescott, H.C.; Hayward, R.A.; Angus, D.C. Implications of Heterogeneity of Treatment Effect for Reporting and Analysis of Randomized Trials in Critical Care. Am. J. Respir. Crit. Care Med. 2015, 192, 1045–1051. [Google Scholar] [CrossRef] [PubMed]
- Walkey, A.J.; Evans, S.R.; Winter, M.R.; Benjamin, E.J. Practice Patterns and Outcomes of Treatments for Atrial Fibrillation During Sepsis. Chest 2016, 149, 74–83. [Google Scholar] [CrossRef]
- Siu, C.W.; Lau, C.P.; Lee, W.L.; Lam, K.F.; Tse, H.F. Intravenous diltiazem is superior to intravenous amiodarone or digoxin for achieving ventricular rate control in patients with acute uncomplicated atrial fibrillation. Crit. Care Med. 2009, 37, 2174–2179. [Google Scholar] [CrossRef]
- Bair, E.; Tibshirani, R. Semi-Supervised Methods to Predict Patient Survival from Gene Expression Data. PLoS Biol. 2004, 2, e108. [Google Scholar] [CrossRef]
- Gaynor, S.; Bair, E. Identification of biologically relevant subtypes via preweighted sparse clustering. arXiv 2013, arXiv:abs/1304.3760. [Google Scholar]
- Johnson, A.; Pollard, T.; Mark, R. MIMIC-III Clinical Database (Version 1.4). 2016. Available online: https://physionet.org/content/mimiciii/1.4/ (accessed on 29 November 2021).

Disclaimer/Publisher’s Note: The statements, opinions and data contained in all publications are solely those of the individual author(s) and contributor(s) and not of MDPI and/or the editor(s). MDPI and/or the editor(s) disclaim responsibility for any injury to people or property resulting from any ideas, methods, instructions or products referred to in the content. |
© 2024 by the authors. Licensee MDPI, Basel, Switzerland. This article is an open access article distributed under the terms and conditions of the Creative Commons Attribution (CC BY) license (https://creativecommons.org/licenses/by/4.0/).