
Visualization of Cerebrospinal Fluid Outflow and Egress along the Nerve Roots of the Lumbar Spine

 , , ,
, , ,
Abstract

1. Background
2. Methods
2.1. Experimental Design
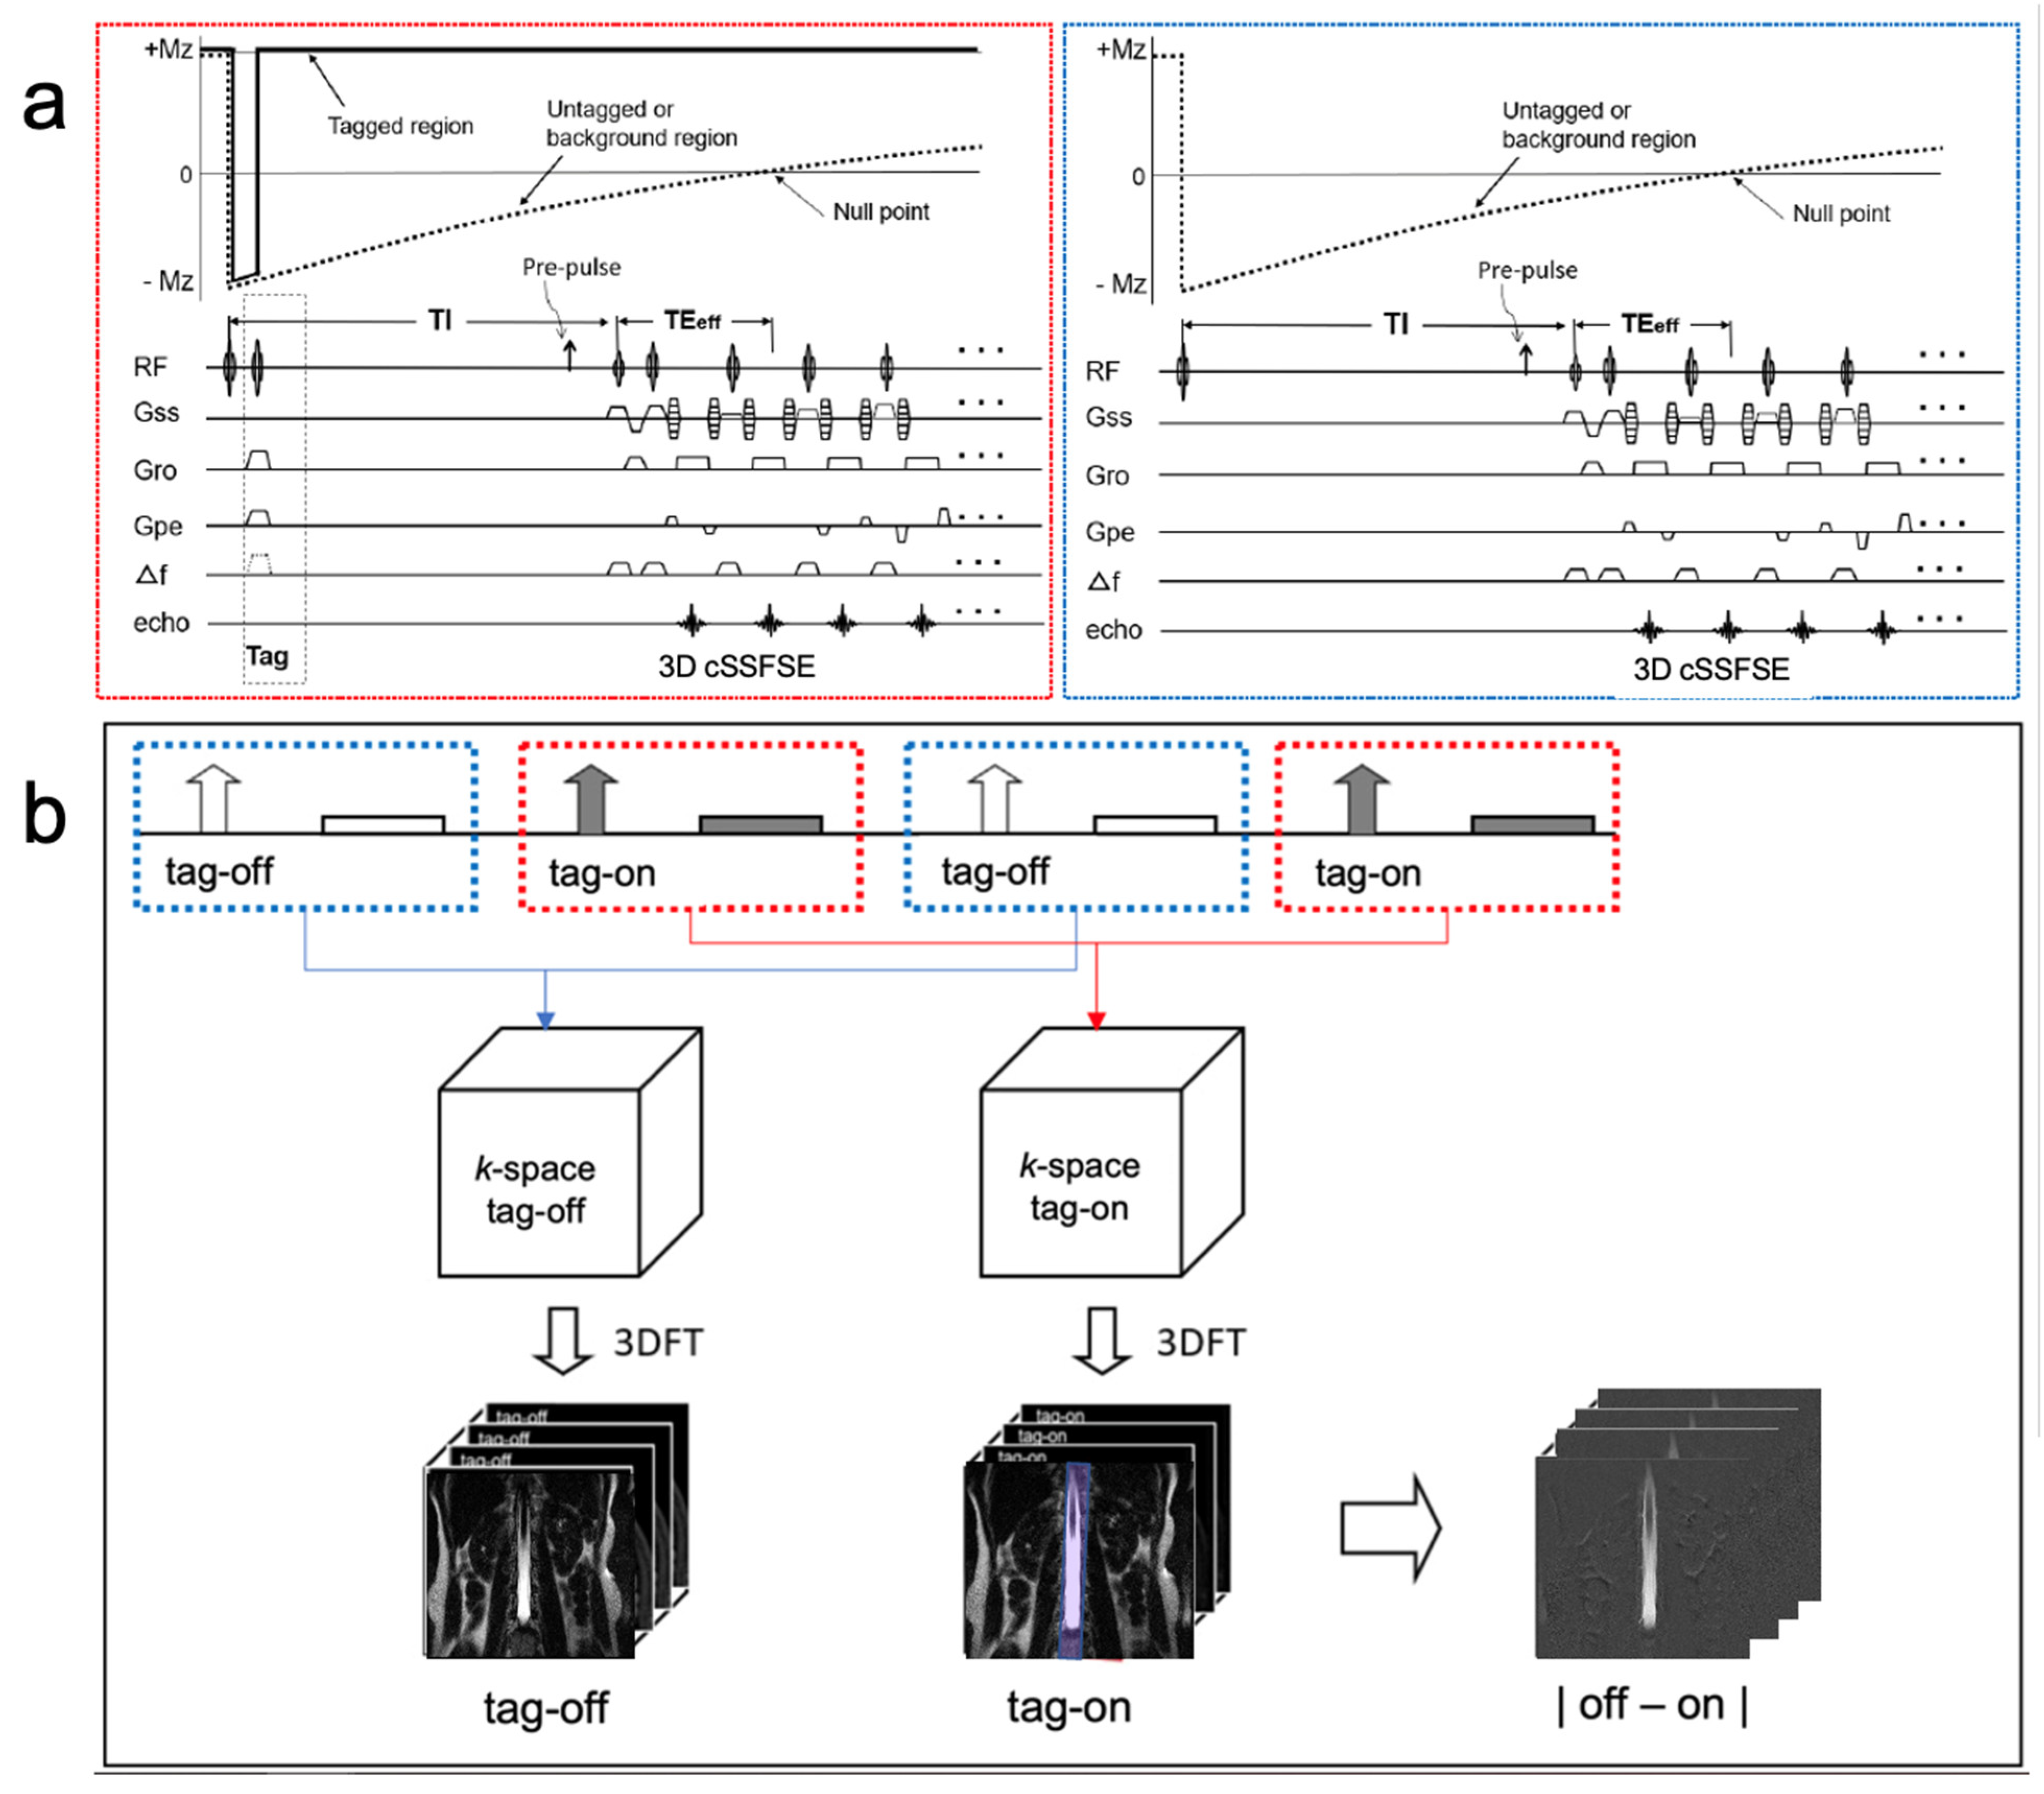
2.2. MR Protocol
2.3. Statistical Analysis
3. Results
4. Discussion
Supplementary Materials
Author Contributions
Funding
Institutional Review Board Statement
Informed Consent Statement
Data Availability Statement
Conflicts of Interest
References
- Nitz, W.R.; Bradley, W.G., Jr.; Watanabe, A.S.; Lee, R.R.; Burgoyne, B.; O’Sullivan, R.M.; Herbst, M.D. Flow dynamics of cerebrospinal fluid: Assessment with phase-contrast velocity MR imaging performed with retrospective cardiac gating. Radiology 1992, 183, 395–405. [Google Scholar] [CrossRef] [PubMed]
- Enzmann, D.R.; Pelc, N.J. Brain motion: Measurement with phase-contrast MR imaging. Radiology 1992, 185, 653–660. [Google Scholar] [CrossRef] [PubMed]
- Lokossou, A.; Metanbou, S.; Gondry-Jouet, C.; Balédent, O. Extracranial versus intracranial hydro-hemodynamics during aging: A PC-MRI pilot cross-sectional study. Fluids Barriers CNS 2020, 17, 1. [Google Scholar] [CrossRef]
- Yamada, S.; Miyazaki, M.; Kanazawa, H.; Higashi, M.; Morohoshi, Y.; Bulml, S.; McComb, J.G. MRI visualization of cerebrospinal fluid movement with spin labeling: Preliminary results in normal and pathophysiological conditions. Radiology 2008, 249, 644–652. [Google Scholar] [CrossRef] [PubMed]
- Yamada, S.; Miyazaki, M.; Yamashita, Y.; Ouyang, C.; Yui, M.; Nakahashi, M.; Shimizu, S.; Aoki, I.; Morohoshi, Y.; McComb, J.G. Influence of respiration on cerebrospinal fluid movement using magnetic resonance spin labeling. Fluids Barriers CNS 2013, 10, 36. [Google Scholar] [CrossRef] [PubMed]
- Yamada, S.; Tsuchiya, K.; Bradley, W.G.; Law, M.; Winkler, M.L.; Borzage, M.T.; Miyazaki, M.; Kelly, E.J.; McComb, J.G. Current and emerging MR Imaging techniques for the diagnosis and management of CSF flow disorders: A review of Phase-Contrast and Time–Spatial Labeling Inversion Pulse. ANJR 2014, 35, 406–413. [Google Scholar] [CrossRef] [PubMed]
- Brinker, T.; Stopa, E.; Morrison, J.; Klinge, P. A new look at cerebrospinal fluid circulation. Fluids Barriers CNS 2014, 11, 10. [Google Scholar] [CrossRef] [PubMed]
- Whedon, J.M.; Glassey, D. Cerebrospinal fluid stasis and its clinical significance. Altern. Ther. Health Med. 2009, 15, 54–60. [Google Scholar]
- Khasawneh, A.; Garling, R.; Harris, C. Cerebrospinal fluid circulation: What do we know and how do we know it? Brain Circ. 2018, 4, 14. [Google Scholar]
- Saunders, N.R.; Dziegielewska, K.M.; Fame, R.M.; Lehtinen, M.K.; Liddelow, S.A. The choroid plexus: A missing link in our understanding of brain development and function. Physiol. Rev. 2023, 103, 919–956. [Google Scholar] [CrossRef]
- Greitz, D.; Franck, A.; Nordell, B. On the pulsatile nature of intracranial and spinal CSF-circulation demonstrated by MR imaging. Acta Radiol. 1993, 34, 321–328. [Google Scholar] [CrossRef]
- Wolpow, E.R.; Schaumburg, H.H. Structure of the human arachnoid granulation. J. Neurosurg. 1972, 37, 724–727. [Google Scholar] [CrossRef]
- Coenen, W.; Gutiérrez-Montes, C.; Sincomb, S.; Criado-Hidalgo, E.; Wei, K.; King, K.; Haughton, V.; Martínez-Bazán, C.; Sánchez, A.L.; Lasheras, J.C. Subject-Specific Studies of CSF Bulk Flow Patterns in the Spinal Canal: Implications for the Dispersion of Solute Particles in Intrathecal Drug Delivery. AJNR Am. J. Neuroradiol. 2019, 40, 1242–1249. [Google Scholar] [CrossRef]
- Malis, V.; Bae, W.C.; Yamamoto, A.; McEvoy, L.K.; McDonald, M.A.; Miyazaki, M. Age-related decline of intrinsic cerebrospinal fluid outflow in healthy humans detected by non-contrast spin-labeling MR imaging. Magn. Reson. Med. Sci. 2024, 23, 66–79. [Google Scholar] [CrossRef] [PubMed]
- Miyazaki, M.; Malis, V.; Kungsamutr, Y.A.; McDonald, M.A.; McEvoy, L.K.; Bae, W. Physical exercise alters egress pathways of intrinsic CSF outflow in humans assessed by spin-labeling MRI. Magn. Reason. Med. Sci. 2024, 23, 171–183. [Google Scholar] [CrossRef] [PubMed]
- Gouveia-Freitas, K.; Bastos-Leite, A.J. Perivascular spaces and brain waste clearance systems: Relevance for neurodegenerative and cerebrovascular pathology. Neuroradiology 2021, 63, 1581–1597. [Google Scholar] [CrossRef] [PubMed]
- Thomas, J.H. Fluid dynamics of cerebrospinal fluid flow in perivascular spaces. J. R. Soc. Interface 2019, 16, 20190572. [Google Scholar] [CrossRef] [PubMed]
- Louveau, A.; Da Mesquita, S.; Kipnis, J. Lymphatics in neurological disorders: A neuro-lympho-vascular component of multiple sclerosis and Alzheimer’s disease. Neuron 2016, 91, 957–973. [Google Scholar] [CrossRef] [PubMed]
- Proulx, S.T. Cerebrospinal fluid outflow: A review of the historical and contemporary evidence for arachnoid villi, perineural routes, and dural lymphatics. Cell. Mol. Life Sci. 2021, 78, 2429–2457. [Google Scholar] [CrossRef]
- Bechter, K.; Schmitz, B. Cerebrospinal fluid outflow along lumbar nerves and possible relevance for pain research: Case report and review. Croat Med. J. 2014, 55, 399–404. [Google Scholar] [CrossRef]
- Ota, H.; Morita, Y.; Vucevic, D.; Higuchi, T.; Takagi, H.; Kutsuna, H.; Yamashita, Y.; Kim, P.; Miyazaki, M. Motion-robust coronary MRA using centric ky-kz trajectory and high-resolution deep learning reconstruction. Magn Reson. Mater. Phys. Biol. Med. 2024, 1–13. [Google Scholar] [CrossRef]
- Chen, J.J.; Pike, G.B. Human whole blood T2 relaxometry at 3T. Magn Reason. Med. 2009, 61, 249–254. [Google Scholar] [CrossRef] [PubMed]
- Liu, P.; Chalak, L.; Krishnamurthy, L.C.; Mir, I.; Peng, S.L.; Huang, H.; Lu, H. T1 and T2 values of human neonatal blood at 3T: Dependence on hematocrit, oxygenation and temperature. MRM 2016, 75, 1730–1735. [Google Scholar] [CrossRef] [PubMed]
- Rodríguez-Soto, A.E.; Abdulmalik, O.; Langham, M.C.; Schwartz, N.; Lee, H.; Wehrli, F.W. T2-prepared balanced steady-state free precession (bSSFP) for quantifying whole-blood oxygen saturation at 1.5T. Magn Reson. Med. 2017, 79, 1893–1900. [Google Scholar] [CrossRef] [PubMed]
- Chan, A.A.; Nelson, A.J. Simplified gamma-variate fitting of perfusion curves. In Proceedings of the 2004 2nd IEEE International Symposium on Biomedical Imaging: Nano to Macro (IEEE Cat No. 04EX821), Arlington, VA, USA, 15–18 April 2004; Volume 2, pp. 1067–1070. [Google Scholar]
- Gutiérrez-Montes, C.; Coenen, W.; Vidorreta, M.; Sincomb, S.; Martínez-Bazán, C.; Sánchez, A.L.; Haughton, V. Effect of Normal Breathing on the Movement of CSF in the Spinal Subarachnoid Space. AJNR Am. J. Neuroradiol. 2022, 43, 1369–1374. [Google Scholar] [CrossRef] [PubMed]
- Rammohan, K.W. Cerebrospinal fluid in multiple sclerosis. Ann. Indian Acad. Neurol. 2009, 12, 246–253. [Google Scholar] [CrossRef]
- Engelhardt, B.; Vajkoczy, P.; Weller, R.O. The movers and shapers in immune privilege of the CNS. Nat. Immunol. 2018, 19, 264–271. [Google Scholar] [CrossRef]


| Parameter | Units | T2 FLAIR | 3D SSFSE | 3D Spin Labeling |
|---|---|---|---|---|
| Field of view | [mm] | 350 × 250 × 48 | 350 × 250 × 52 | 350 × 250 × 64 |
| Image matrix | 288 × 256 × 16 | 320 × 256 × 52 | 368 × 368 × 16 | |
| No. of slices | 16 | 26 | 16 | |
| Slice thickness | [mm] | 3 | 2 | 4 |
| Acquired resolution: (PE) × (RO) × (SE) | [mm] | 1.21 × 0.97 × 3.0 | 1.09 × 0.97 × 2.0 | 0.95 × 0.68 × 4.0 |
| Interpolated resolution: (PE) × (RO) × (SE) | [mm] | N/A | 0.54 × 0.48 × 1.0 | 0.47 × 0.34 × 2.0 |
| Repetition time | [ms] | 10,000 | 4000 | ~10,000 |
| Effective echo time | [ms] | 92 | 117 | 300 |
| Echo train spacing | [ms] | 11.5 | 6.5 | 5 |
| Flip/refocusing angles | [degrees] | 90/170 | 90/140 | 90/160 |
| Averages | 1 | 1 | 1 | |
| Parallel reduction factor | 2.4 | 3 | 3 | |
| Acquisition time | 1 min 50 s | 2 min | 1 min 34 s (for each TI) |
| ROI | PH % | TTP [s] |
|---|---|---|
| 1 (L1 medial) | 17.65 ± 7.7 | 1.03 ± 0.64 |
| 2 (L1 distal) | 14.46 ± 12.06 | 1.55 ± 0.68 |
| 3 (L2 medial) | 10.1 ± 2.03 | 0.98 ± 0.62 |
| 4 (L2 distal) | 17.79 ± 8.29 | 1.67 ± 0.74 |
| 5 (L3 medial) | 13.88 ± 6.25 | 1.09 ± 0.83 |
| 6 (L3 distal) | 17.92 ± 7.57 | 1.64 ± 0.51 |
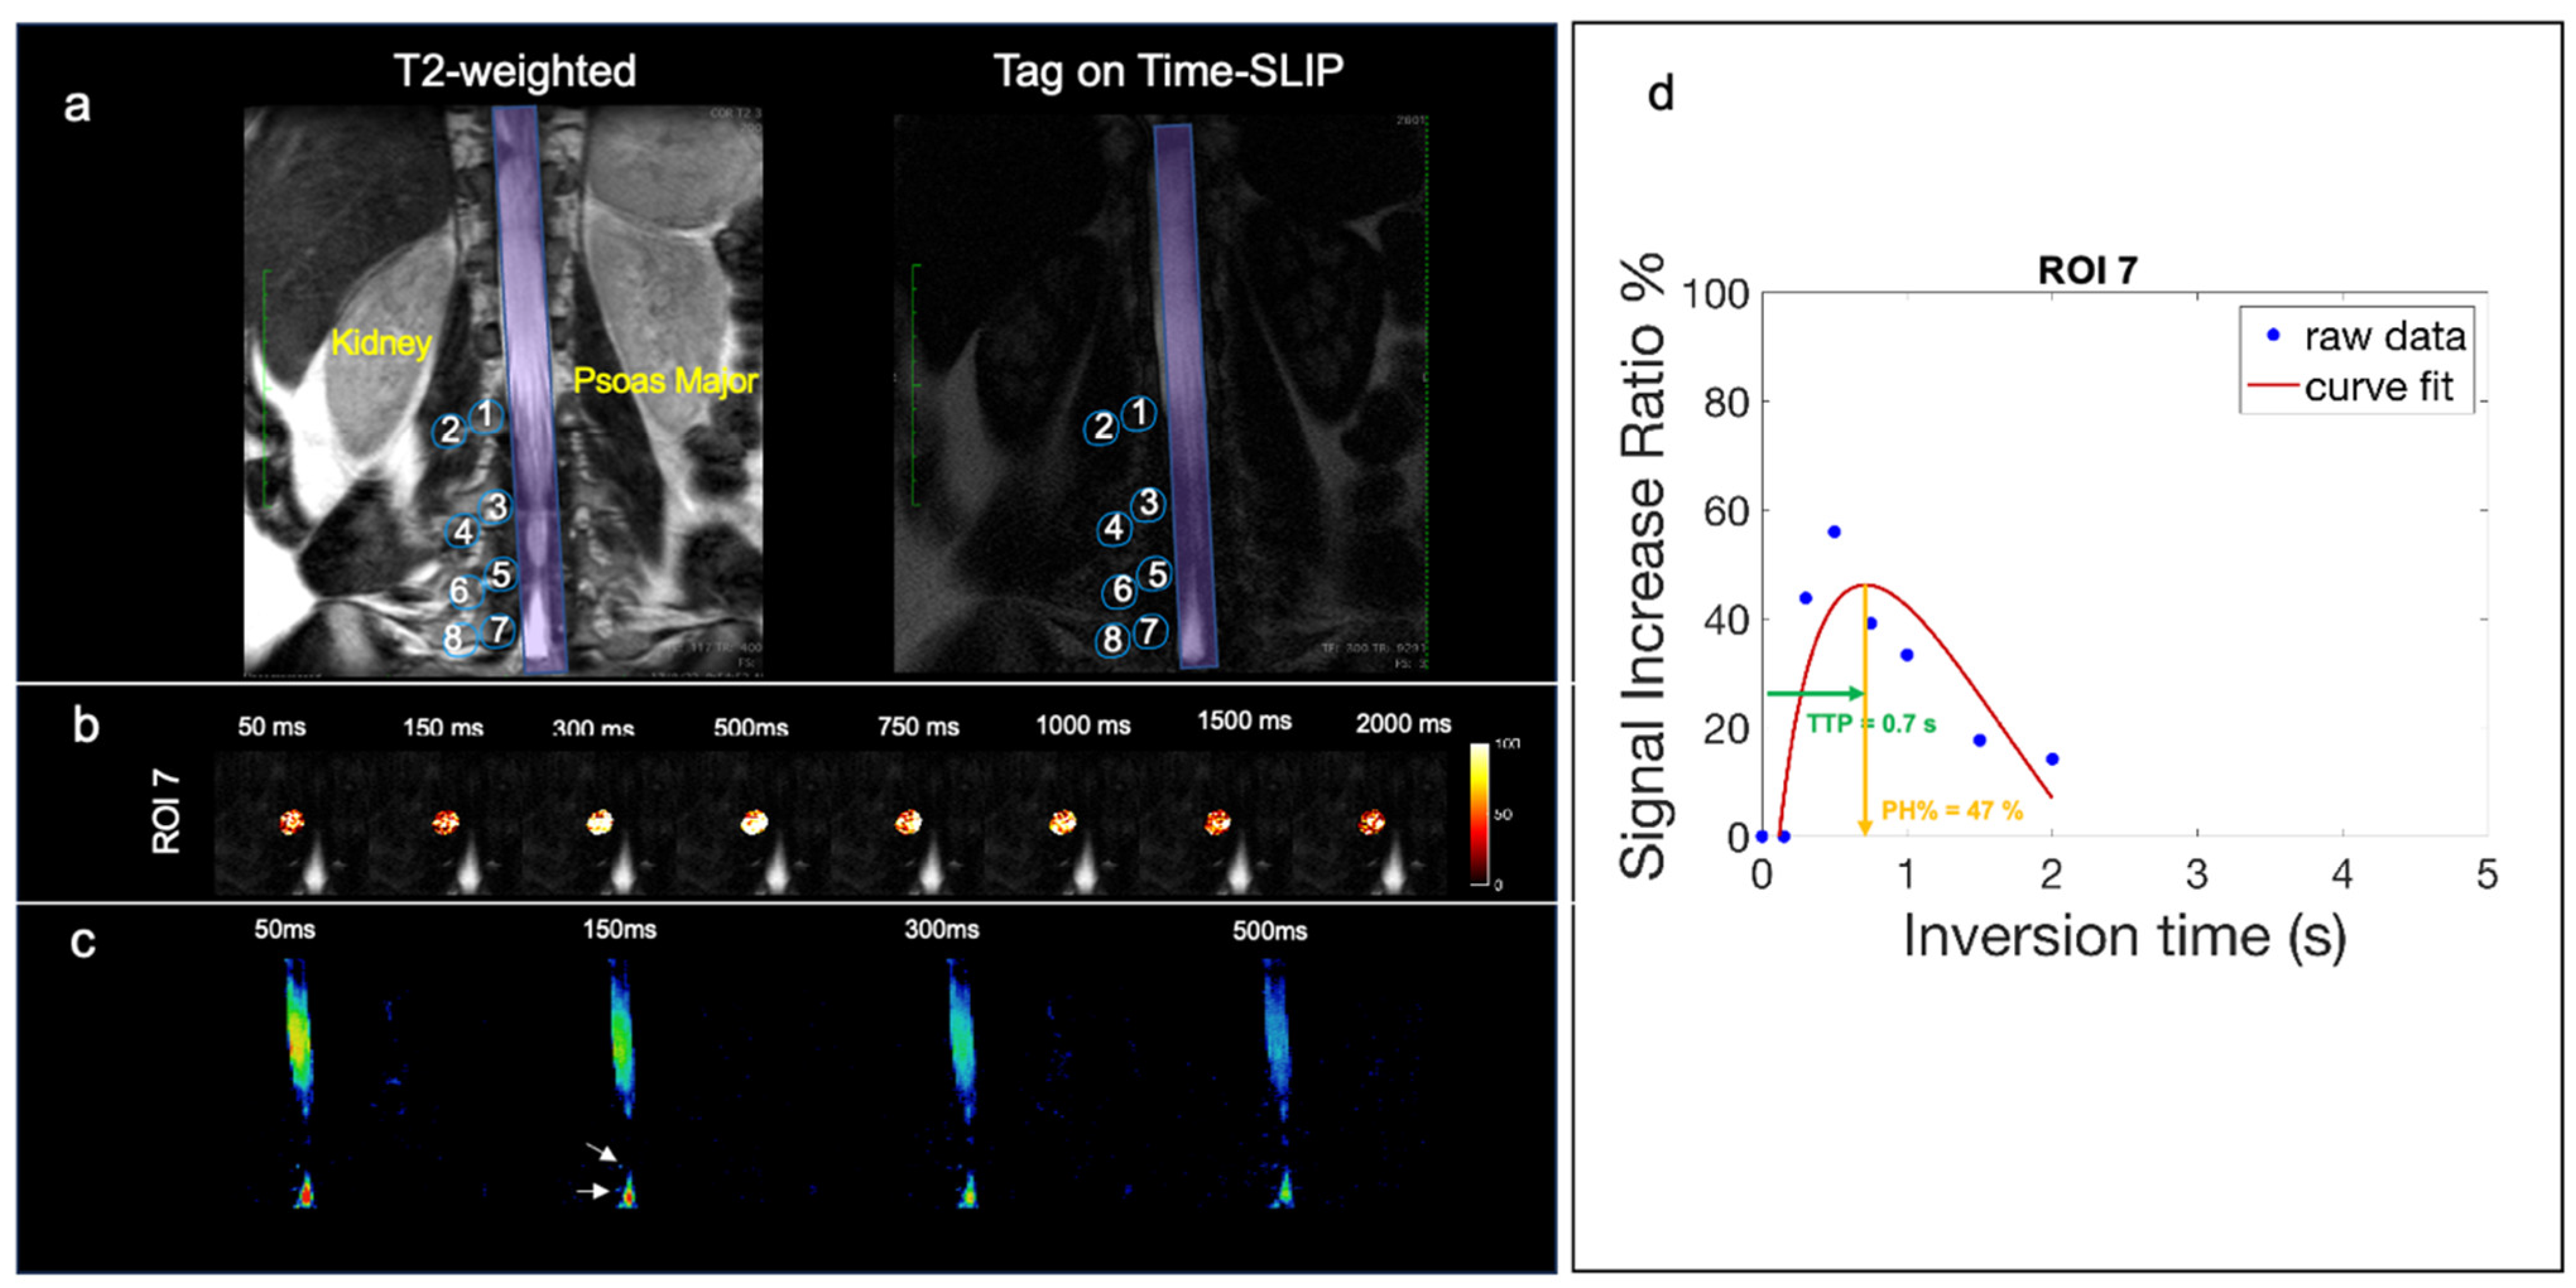
| 7 (L4 medial) | 20.41 ± 12.62 | 0.94 ± 0.71 |
| 8 (L4 distal) | 15.52 ± 11.04 | 1.69 ± 0.59 |
Disclaimer/Publisher’s Note: The statements, opinions and data contained in all publications are solely those of the individual author(s) and contributor(s) and not of MDPI and/or the editor(s). MDPI and/or the editor(s) disclaim responsibility for any injury to people or property resulting from any ideas, methods, instructions or products referred to in the content. |
© 2024 by the authors. Licensee MDPI, Basel, Switzerland. This article is an open access article distributed under the terms and conditions of the Creative Commons Attribution (CC BY) license (https://creativecommons.org/licenses/by/4.0/).
Share and Cite
Vucevic, D.; Malis, V.; Bae, W.C.; Ota, H.; Oshio, K.; McDonald, M.A.; Miyazaki, M. Visualization of Cerebrospinal Fluid Outflow and Egress along the Nerve Roots of the Lumbar Spine. Bioengineering 2024, 11, 708. https://doi.org/10.3390/bioengineering11070708
Vucevic D, Malis V, Bae WC, Ota H, Oshio K, McDonald MA, Miyazaki M. Visualization of Cerebrospinal Fluid Outflow and Egress along the Nerve Roots of the Lumbar Spine. Bioengineering. 2024; 11(7):708. https://doi.org/10.3390/bioengineering11070708
Chicago/Turabian StyleVucevic, Diana, Vadim Malis, Won C. Bae, Hideki Ota, Koichi Oshio, Marin A. McDonald, and Mitsue Miyazaki. 2024. "Visualization of Cerebrospinal Fluid Outflow and Egress along the Nerve Roots of the Lumbar Spine" Bioengineering 11, no. 7: 708. https://doi.org/10.3390/bioengineering11070708
APA StyleVucevic, D., Malis, V., Bae, W. C., Ota, H., Oshio, K., McDonald, M. A., & Miyazaki, M. (2024). Visualization of Cerebrospinal Fluid Outflow and Egress along the Nerve Roots of the Lumbar Spine. Bioengineering, 11(7), 708. https://doi.org/10.3390/bioengineering11070708