

FTSNet: Fundus Tumor Segmentation Network on Multiple Scales Guided by Classification Results and Prompts

 , and
, and
Abstract

1. Introduction
2. Related Work
2.1. Deep Learning Segmentation Network
2.2. Prompt Learning in Computer Vision
3. Method and Dataset
3.1. Dataset
3.2. FTSNet
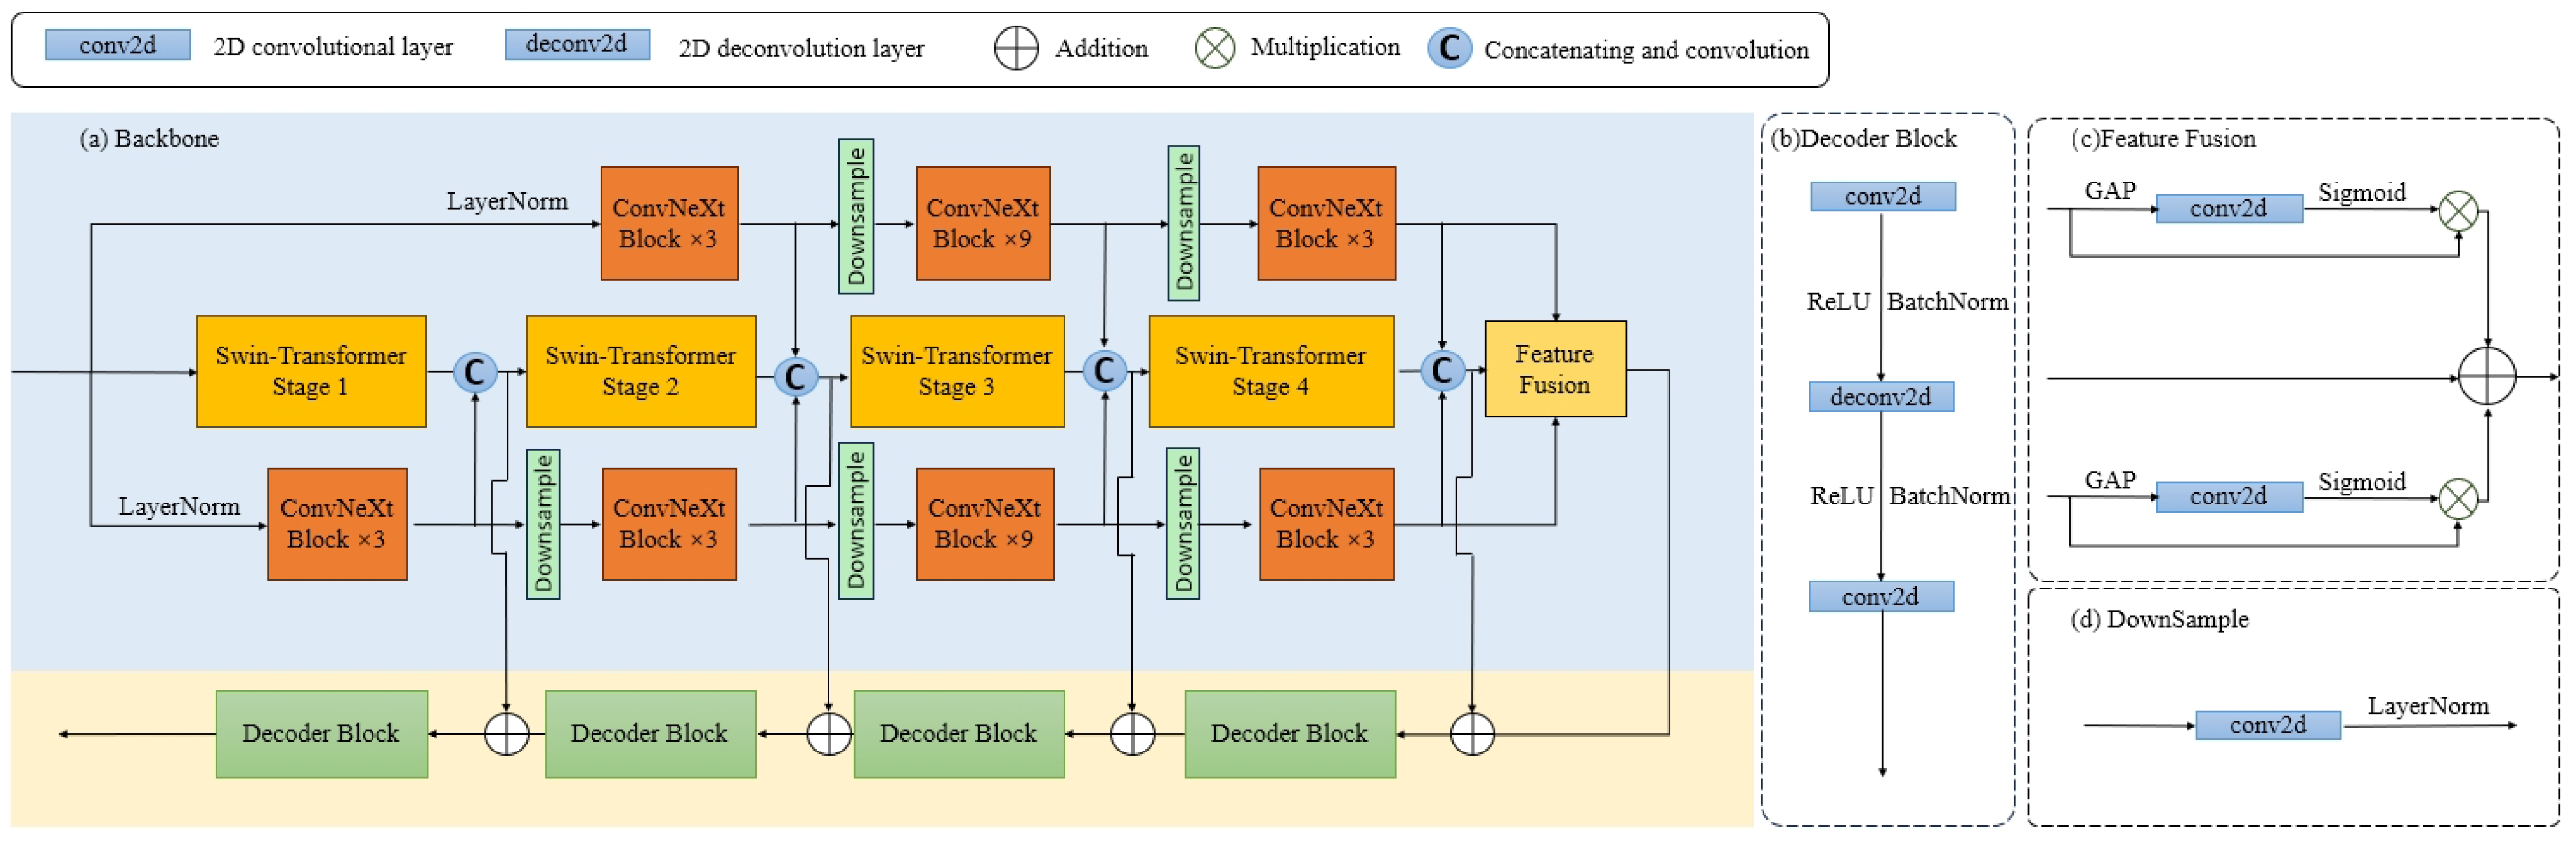
3.2.1. Overview
3.2.2. Encoder
3.2.3. Feature Fusion
3.2.4. Decoder
3.2.5. Prompt Dynamic Head
4. Experiments
4.1. Experiment Setup
4.1.1. Loss Function
4.1.2. Evaluation Metrics
4.1.3. Training Details
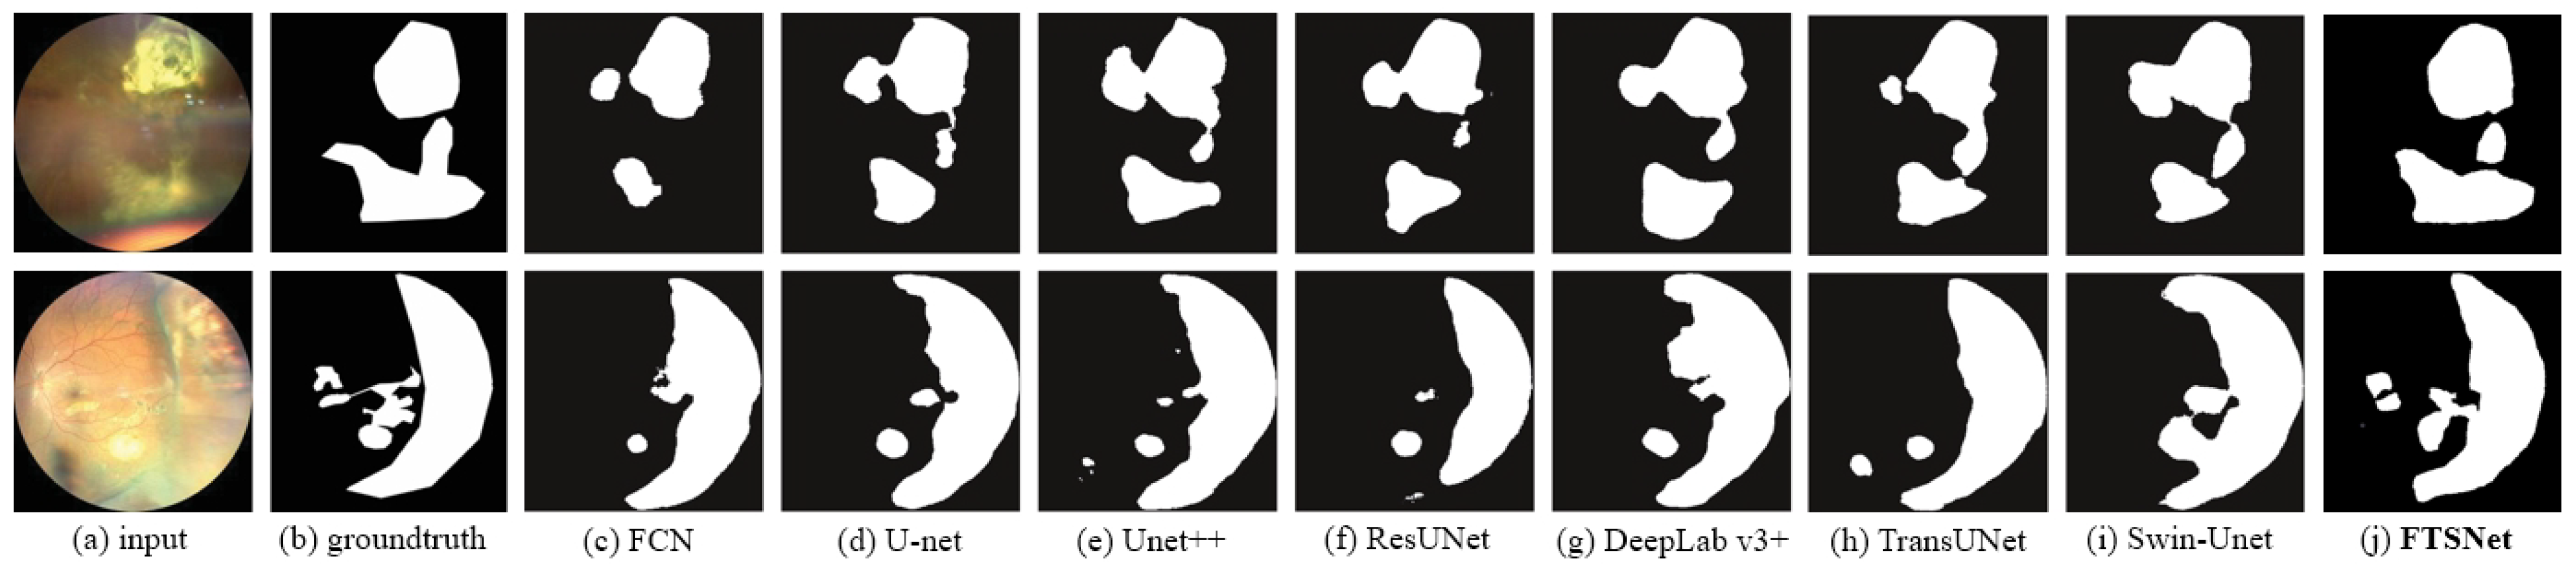
4.2. Results
4.3. Ablation Study
4.3.1. Combinations of Loss Functions
4.3.2. Combinations of Encoder
5. Conclusions
Author Contributions
Funding
Institutional Review Board Statement
Informed Consent Statement
Data Availability Statement
Conflicts of Interest
Correction Statement
References
- Singh, A.D.; Turell, M.E.; Topham, A.K. Uveal melanoma: Trends in incidence, treatment, and survival. Ophthalmology 2011, 118, 1881–1885. [Google Scholar] [CrossRef] [PubMed]
- Spagnolo, F.; Caltabiano, G.; Queirolo, P. Uveal melanoma. Cancer Treat. Rev. 2012, 38, 549–553. [Google Scholar] [CrossRef] [PubMed]
- Singh, A.D.; Topham, A. Incidence of uveal melanoma in the United States: 1973–1997. Ophthalmology 2003, 110, 956–961. [Google Scholar] [CrossRef] [PubMed]
- Shen, X.; Zhou, T.; Sun, Z.; Zheng, Y.; Lin, B.; Huang, Y. Trends in application of fundus fluorescein angiography in fundus diseases during a recent ten-year period. Photodiagnosis Photodyn. Ther. 2024, 46, 104029. [Google Scholar] [CrossRef] [PubMed]
- Shields, C.L.; Manalac, J.; Das, C.; Saktanasate, J.; Shields, J.A. Review of spectral domain enhanced depth imaging optical coherence tomography of tumors of the choroid. Indian J. Ophthalmol. 2015, 63, 117–121. [Google Scholar] [CrossRef] [PubMed]
- Ramírez-Ortiz, M.A.; Lansingh, V.C.; Eckert, K.A.; Haik, B.G.; Phillips, B.X.; Bosch-Canto, V.; González-Pérez, G.; Villavicencio-Torres, A.; Etulain-González, A. Systematic review of the current status of programs and general knowledge of diagnosis and management of retinoblastoma. Bol. Med. Hosp. Infant. Mex. 2017, 74, 41–54. [Google Scholar] [PubMed]
- Radford, A.; Kim, J.W.; Hallacy, C.; Ramesh, A.; Goh, G.; Agarwal, S.; Sastry, G.; Askell, A.; Mishkin, P.; Clark, J.; et al. Learning transferable visual models from natural language supervision. In Proceedings of the International Conference on Machine Learning, PMLR, Virtual, 18–24 July 2021; pp. 8748–8763. [Google Scholar]
- Ronneberger, O.; Fischer, P.; Brox, T. U-net: Convolutional networks for biomedical image segmentation. In Medical Image Computing and Computer-Assisted Intervention–MICCAI 2015, Proceedings of the 18th International Conference, Munich, Germany, 5–9 October 2015; Proceedings, Part III 18; Springer: Berlin/Heidelberg, Germany, 2015; pp. 234–241. [Google Scholar]
- Zhou, Z.; Rahman Siddiquee, M.M.; Tajbakhsh, N.; Liang, J. Unet++: A nested u-net architecture for medical image segmentation. In Deep Learning in Medical Image Analysis and Multimodal Learning for Clinical Decision Support, Proceedings of the 4th International Workshop, DLMIA 2018, and 8th International Workshop, ML-CDS 2018, Held in Conjunction with MICCAI 2018, Granada, Spain, 20 September 2018; Proceedings 4; Springer: Berlin/Heidelberg, Germany, 2018; pp. 3–11. [Google Scholar]
- Oktay, O.; Schlemper, J.; Folgoc, L.L.; Lee, M.; Heinrich, M.; Misawa, K.; Mori, K.; McDonagh, S.; Hammerla, N.Y.; Kainz, B.; et al. Attention u-net: Learning where to look for the pancreas. arXiv 2018, arXiv:1804.03999. [Google Scholar]
- Diakogiannis, F.I.; Waldner, F.; Caccetta, P.; Wu, C. ResUNet-a: A deep learning framework for semantic segmentation of remotely sensed data. ISPRS J. Photogramm. Remote. Sens. 2020, 162, 94–114. [Google Scholar] [CrossRef]
- Isensee, F.; Jaeger, P.F.; Kohl, S.A.; Petersen, J.; Maier-Hein, K.H. nnU-Net: A self-configuring method for deep learning-based biomedical image segmentation. Nat. Methods 2021, 18, 203–211. [Google Scholar] [CrossRef] [PubMed]
- Deng, Z.; Cai, Y.; Chen, L.; Gong, Z.; Bao, Q.; Yao, X.; Fang, D.; Yang, W.; Zhang, S.; Ma, L. Rformer: Transformer-based generative adversarial network for real fundus image restoration on a new clinical benchmark. IEEE J. Biomed. Health Inform. 2022, 26, 4645–4655. [Google Scholar] [CrossRef] [PubMed]
- Gao, W.; Shao, L.; Li, F.; Dong, L.; Zhang, C.; Deng, Z.; Qin, P.; Wei, W.; Ma, L. Fundus photograph-based cataract evaluation network using deep learning. Front. Phys. 2024, 11, 1235856. [Google Scholar] [CrossRef]
- Cao, K.; Zhang, X. An improved res-unet model for tree species classification using airborne high-resolution images. Remote. Sens. 2020, 12, 1128. [Google Scholar] [CrossRef]
- Chen, L.C.; Zhu, Y.; Papandreou, G.; Schroff, F.; Adam, H. Encoder-decoder with atrous separable convolution for semantic image segmentation. In Proceedings of the European Conference on Computer Vision (ECCV), Munich, Germany, 8–14 September 2018; pp. 801–818. [Google Scholar]
- Chen, J.; Lu, Y.; Yu, Q.; Luo, X.; Adeli, E.; Wang, Y.; Lu, L.; Yuille, A.L.; Zhou, Y. Transunet: Transformers make strong encoders for medical image segmentation. arXiv 2021, arXiv:2102.04306. [Google Scholar]
- Gao, Z.; Wang, Z.; Li, Y. A novel intraretinal layer semantic segmentation method of fundus OCT images based on the TransUNet network model. Photonics 2023, 10, 438. [Google Scholar] [CrossRef]
- Guo, S. Fundus image segmentation via hierarchical feature learning. Comput. Biol. Med. 2021, 138, 104928. [Google Scholar] [CrossRef] [PubMed]
- Rahdar, A.; Ahmadi, M.J.; Naseripour, M.; Akhtari, A.; Sedaghat, A.; Hosseinabadi, V.Z.; Yarmohamadi, P.; Hajihasani, S.; Mirshahi, R. Semi-supervised segmentation of retinoblastoma tumors in fundus images. Sci. Rep. 2023, 13, 13010. [Google Scholar] [CrossRef] [PubMed]
- Niu, Z.; Deng, Z.; Gao, W.; Bai, S.; Gong, Z.; Chen, C.; Rong, F.; Li, F.; Ma, L. FNeXter: A Multi-Scale Feature Fusion Network Based on ConvNeXt and Transformer for Retinal OCT Fluid Segmentation. Sensors 2024, 24, 2425. [Google Scholar] [CrossRef] [PubMed]
- Zhang, Y.; Jiang, H.; Miura, Y.; Manning, C.D.; Langlotz, C.P. Contrastive learning of medical visual representations from paired images and text. In Proceedings of the Machine Learning for Healthcare Conference. PMLR, Durham, NC, USA, 5–6 August 2022; pp. 2–25. [Google Scholar]
- Huang, S.C.; Shen, L.; Lungren, M.P.; Yeung, S. GLoRIA: A multimodal global-local representation learning framework for label-efficient medical image recognition. In Proceedings of the 2021 IEEE/CVF International Conference on Computer Vision (ICCV), Montreal, QC, Canada, 10–17 October 2021; pp. 3942–3951. [Google Scholar]
- Qin, Z.; Yi, H.; Lao, Q.; Li, K. Medical image understanding with pretrained vision language models: A comprehensive study. arXiv 2022, arXiv:2209.15517. [Google Scholar]
- Liu, J.; Zhang, Y.; Chen, J.N.; Xiao, J.; Lu, Y.; A Landman, B.; Yuan, Y.; Yuille, A.; Tang, Y.; Zhou, Z. CLIP-driven universal model for organ segmentation and tumor detection. In Proceedings of the 2023 IEEE/CVF International Conference on Computer Vision (ICCV), Paris, France, 1–6 October 2023; pp. 21152–21164. [Google Scholar]
- Lin, T.Y.; Dollár, P.; Girshick, R.; He, K.; Hariharan, B.; Belongie, S. Feature pyramid networks for object detection. In Proceedings of the IEEE Conference on Computer Vision and Pattern Recognition, Honolulu, HI, USA, 21–26 July 2017; pp. 2117–2125. [Google Scholar]
- Liu, Z.; Lin, Y.; Cao, Y.; Hu, H.; Wei, Y.; Zhang, Z.; Lin, S.; Guo, B. Swin transformer: Hierarchical vision transformer using shifted windows. In Proceedings of the IEEE/CVF International Conference on Computer Vision, Montreal, QC, Canada, 10–17 October 2021; pp. 10012–10022. [Google Scholar]
- Liu, Z.; Mao, H.; Wu, C.Y.; Feichtenhofer, C.; Darrell, T.; Xie, S. A convnet for the 2020s. In Proceedings of the IEEE/CVF Conference on Computer Vision and Pattern Recognition, New Orleans, LA, USA, 18–24 June 2022; pp. 11976–11986. [Google Scholar]
- Hu, J.; Shen, L.; Sun, G. Squeeze-and-excitation networks. In Proceedings of the IEEE Conference on Computer Vision and Pattern Recognition, Salt Lake City, UT, USA, 18–23 June 2018; pp. 7132–7141. [Google Scholar]
- Long, J.; Shelhamer, E.; Darrell, T. Fully convolutional networks for semantic segmentation. IEEE Trans. Pattern Anal. Mach. Intell. 2017, 39, 640–651. [Google Scholar]
- Cao, H.; Wang, Y.; Chen, J.; Jiang, D.; Zhang, X.; Tian, Q.; Wang, M. Swin-unet: Unet-like pure transformer for medical image segmentation. In Proceedings of the Computer Vision—ECCV 2022 Workshops, Tel Aviv, Israel, 23–27 October 2022; Springer: Cham, Switzerland, 2022; pp. 205–218. [Google Scholar]


| Label | Benign Tumor | Malignant Tumor |
|---|---|---|
| Number | 103 | 151 |
| Percentage | 40.55% | 59.45% |
| Network | mIoU | mDice |
|---|---|---|
| FCN [30] | 0.7587 ± 0.1067 | 0.8320 ± 0.0931 |
| U-net [8] | 0.7958 ± 0.1023 | 0.8721 ± 0.1128 |
| Unet++ [9] | 0.7905 ± 0.1385 | 0.8643 ± 0.1088 |
| ResUNet [11] | 0.7844 ± 0.1327 | 0.8599 ± 0.1490 |
| DeepLab v3+ [16] | 0.8077 ± 0.1426 | 0.8711 ± 0.1525 |
| TransUNet [17] | 0.8023 ± 0.1592 | 0.8731 ± 0.1451 |
| Swin-Unet [31] | 0.8133 ± 0.1804 | 0.8873 ± 0.1389 |
| FTSNet | 0.8254 ± 0.1266 | 0.9042 ± 0.1371 |
| Method | mIoU | mDice |
|---|---|---|
| only | 0.7741 | 0.8452 |
| 0.8196 | 0.9017 | |
| 0.7859 | 0.8603 | |
| 0.8254 | 0.9042 |
| Swin-Transformer | ConvNeXt | ResNet50 | mIou | mDice |
|---|---|---|---|---|
| 🗸 | 0.7965 | 0.8676 | ||
| 🗸 | 0.8007 | 0.8723 | ||
| 🗸 | 0.7811 | 0.8490 | ||
| 🗸 | 🗸 | 0.8193 | 0.8919 | |
| 🗸 | 🗸 | 0.8254 | 0.9042 |
Disclaimer/Publisher’s Note: The statements, opinions and data contained in all publications are solely those of the individual author(s) and contributor(s) and not of MDPI and/or the editor(s). MDPI and/or the editor(s) disclaim responsibility for any injury to people or property resulting from any ideas, methods, instructions or products referred to in the content. |
© 2024 by the authors. Licensee MDPI, Basel, Switzerland. This article is an open access article distributed under the terms and conditions of the Creative Commons Attribution (CC BY) license (https://creativecommons.org/licenses/by/4.0/).
Share and Cite
Bai, S.; Deng, Z.; Yang, J.; Gong, Z.; Gao, W.; Shao, L.; Li, F.; Wei, W.; Ma, L. FTSNet: Fundus Tumor Segmentation Network on Multiple Scales Guided by Classification Results and Prompts. Bioengineering 2024, 11, 950. https://doi.org/10.3390/bioengineering11090950
Bai S, Deng Z, Yang J, Gong Z, Gao W, Shao L, Li F, Wei W, Ma L. FTSNet: Fundus Tumor Segmentation Network on Multiple Scales Guided by Classification Results and Prompts. Bioengineering. 2024; 11(9):950. https://doi.org/10.3390/bioengineering11090950
Chicago/Turabian StyleBai, Shurui, Zhuo Deng, Jingyan Yang, Zheng Gong, Weihao Gao, Lei Shao, Fang Li, Wenbin Wei, and Lan Ma. 2024. "FTSNet: Fundus Tumor Segmentation Network on Multiple Scales Guided by Classification Results and Prompts" Bioengineering 11, no. 9: 950. https://doi.org/10.3390/bioengineering11090950
APA StyleBai, S., Deng, Z., Yang, J., Gong, Z., Gao, W., Shao, L., Li, F., Wei, W., & Ma, L. (2024). FTSNet: Fundus Tumor Segmentation Network on Multiple Scales Guided by Classification Results and Prompts. Bioengineering, 11(9), 950. https://doi.org/10.3390/bioengineering11090950